Induction heating: an efficient methodology for the synthesis of functional core–shell nanoparticles†
Álvaro
Raya-Barón‡
 a,
Sourav
Ghosh‡
 a,
Jaime
Mazarío‡
 a,
Víctor
Varela-Izquierdo
 a,
Pier-Francesco
Fazzini
 a,
Simon
Tricard
 a,
Jerome
Esvan
b and
Bruno
Chaudret
 *a
*a
aLPCNO (Laboratoire de Physique et Chimie des Nano-Objets), Université de Toulouse, CNRS, INSA, UPS, 31077 Toulouse, France. E-mail: chaudret@insa-toulouse.fr
bCIRIMAT-ENSIACET, INP-ENSIACET, 4 allée Emile Monso, BP 44362, 31030 Toulouse cedex 4, France
First published on 12th August 2023
Abstract
Induction heating has been applied for a variety of purposes over the years, including hyperthermia-induced cell death, industrial manufacturing, and heterogeneous catalysis. However, its potential in materials synthesis has not been extensively studied. Herein, we have demonstrated magnetic induction heating-assisted synthesis of core–shell nanoparticles starting from a magnetic core. The induction heating approach allows an easy synthesis of FeNi3@Mo and Fe2.2C@Mo nanoparticles containing a significantly higher amount of molybdenum on the surface than similar materials synthesized using conventional heating. Exhaustive electron microscopy, X-ray diffraction, and X-ray photoelectron spectroscopy characterization data are presented to establish the core–shell structures. Furthermore, the molybdenum shell was transformed into the Mo2C phase, and the catalytic activity of the resulting nanoparticles tested for the propane dry reforming reaction under induction heating. Lastly, the beneficial role of induction heating-mediated synthesis was extended toward the preparation of the FeNi3@WOx core–shell nanoparticles.
New conceptsUsing magnetic nanoparticles as heating agents under an alternating magnetic field is a hot research topic due to the high efficiency of heat delivery on a localized spot that these materials enable. For applications, magnetic nanoparticles may need additional functionalization; we show here that magnetic induction allows the preparation of nanoparticles displaying a magnetic core and a shell of molybdenum, a metal difficult to obtain at the zerovalent state, FeNi3@Mo and Fe2.2C@Mo. This approach yields significant benefits, depositing approximately twice as much molybdenum on the nanoparticle shell compared to a conventional thermal method in a shorter reaction time and spending lower amounts of Mo(CO)6. Thus, using magnetic heating instead of thermal heating allows FeNi3 or Fe2.2C nanoparticles to serve as both a heat source and a nucleation centre, resulting in an accurate decomposition of Mo(CO)6 onto the desired spot. The resulting outer layer can be further transformed into Mo2C under magnetic induction and used for catalytic reactions such as propane dry reforming hence demonstrating the flexibility of the approach. Finally, applying this strategy to an FeNi3@W system shows that this approach may be extended to functionalize magnetic materials efficiently and accurately. Therefore, the methodology reported herein paves the way for developing innovative complex nanostructures. |
1. Introduction
Magnetic nanoparticles (Mag-NPs) can produce high temperatures in short times and in localized spots via hysteresis losses when exposed to an alternating magnetic field (AMF).1–3 They have found applications in different fields, such as catalysis,1–3 medicine,4 and industrial manufacturing,5 where they offer remarkable advantages such as improved energy efficiency, precise localized heating and swift temperature control. However, synthetic implications of the induction heating phenomena (IH) remain almost unexplored at the nanoscale.Although the literature is teeming with examples of chain-like assemblies, nanosheets and core–shell structures assisted by static magnetic fields,6,7 there are few instances where an AMF is used, and none that produce core–shell nanoparticles. There have been reports of metal substrates acting as a heating agent upon generating eddy currents under AMF for growing nanostructures. One example is nickel foam anchoring Ni nanoparticles on MoO2 nanowires and NiFe-layered double hydroxides.8 Besides, graphene and carbon nanotubes (CNTs) have been grown on metal substrates by induction heating (IH) in a chemical vapor deposition (CVD) system using Pt monocrystals,9 Pt foils,10 Cu foils,11 and Ni layers12 as the heating substrates. Cu and Cu2O nanostructures can also be synthesized on Ni foil using IH and electrodeposition in solution.13 Moreover, graphene, a conductive non-metal, serves as a self-heating medium for the preparation of SiC nanorods from SiO2 NPs.14 The possibility of using reactors filled with stainless steel balls in a coil for the synthesis of iron oxide nanoparticles15 or CdSe16 quantum dots (QDs) has also received attention. To the best of our knowledge, the only systems derived from the use of nanoparticles under an AMF are TiO2-decorated Fe3O4,17 and a carbon Fe3O4 nanocomposite.18 However, no literature on magnetic nanoparticles acting as the substrate for the growth of metal, metal oxide or metal carbide shells is available.
On the other hand, core–shell nanoparticles are a distinct class of nanomaterials that offer unique advantages. By combining the properties of the core and shell, it is possible to tailor their physical and chemical attributes. In fact, they have found a wide range of uses in materials chemistry,19 biomedicine,20 and catalysis21 due to their broad range of features. Realizing their potential in varieties of applications, numerous synthetic routes were proposed.21,22 The most popular synthetic method for core–shell nanoparticles is the seed-mediated growth of a shell over a preformed core particle.21,22 Inspired by this, we aimed to develop a general method for the synthesis of core–shell nanoparticles through the use of ferromagnetic nanoparticles to create metallic or metal carbide shells via precursor decomposition in a reducing atmosphere. Based on this, and to explore the generality of the approach, we have considered two materials for the core, i.e., FeNi3 and Fe2.2C nanoparticles, the magnetic properties of which have been studied in our group, and refractory targets which are difficult to prepare at the nanoscale, namely Mo and Mo2C.
Interestingly, transition metal carbides have recently been proposed as substitutes for noble metals in catalysis due to their similar electronic properties.23,24 Among them, molybdenum carbide is a promising option due to a catalytic activity similar to platinum.25,26 In that sense, it has been employed in heterogeneous phases for a variety of processes, including synthesis gas conversion into alcohols,27 water gas shift reaction,28 CO2 hydrogenation,29 reductive biomass upgradation,30,31 and the hydrogen evolution reaction (HER).32 In this work, the dry reforming of propane (PDR) was selected to evaluate the catalytic activity of the Mo-based shell. PDR has gathered interest because it leads to the production of synthesis gas while valorising CO2 (C3H8 + 3CO2 ⇌ 6CO + 4H2, ΔH° = 620 kJ mol−1), and propane is regarded as a suitable hydrogen carrier due to the already existing infrastructure for its transport and storage.33–35 Since the PDR reaction occurs at high temperatures (550 to 900 °C) and low pressures, magnetic heating assisted by commercial Fe-wool was used along with the Mag-NPs@Mo nanoparticles.36,37
In summary, we present herein the synthesis of FeNi3@Mo and Fe2.2C@Mo nanoparticles (Mag-NP@Mo) via thermal and induction heating mediated decomposition of a Mo(CO)6 precursor. The as-prepared samples were thoroughly characterized using transmission electron microscopy (TEM), scanning transmission electron microscopy energy-dispersive X-ray spectroscopy (STEM-EDS) elemental mapping, powder X-ray diffraction (XRD), vibrating sample magnetometry (VSM), and inductively coupled plasma atomic emission spectroscopy (ICP-AES) techniques. The differences between conventional and induction heating (IH) were investigated. Furthermore, the unprecedented functionalization of Mag-NPs with carbidic Mo, the enhancement of the Mo2C phase by carburation, and its catalytic activity toward the PDR reaction were discussed. The results demonstrate that this approach directs the reaction towards the nanoparticle surface by utilizing the “hot spot” phenomenon. This results in the formation of refractory shells and boosts deposition yield by reducing homogeneous nucleation of molybdenum when compared to the thermal approach. Additionally, the magnetic core is preserved, resulting in high-quality core–shell nanostructures. Finally, the IH-mediated synthesis of FeNi3@WOx core–shell nanoparticles was demonstrated for scope extension purposes. The sample abbreviation is shown in Table 1.
| Abbreviation | Magnetic core | Metal shell | Heating mode |
|---|---|---|---|
| FeNi3@Mo-TH | FeNi3 | Mo | Thermal |
| FeNi3@Mo-IH | FeNi3 | Mo | Induction |
| Fe2.2C@Mo-TH | Fe2.2C | Mo | Thermal |
| Fe2.2C@Mo-IH | Fe2.2C | Mo | Induction |
| FeNi3@WOx-IH | FeNi3 | W | Induction |
2. Results and discussion
At first, FeNi3@Mo-TH and Fe2.2C@Mo-TH NPs were prepared by thermal decomposition of Mo(CO)6 on FeNi3 NPs or Fe2.2C NPs, respectively, at 150 °C under a 3 bar H2 pressure, following a procedure analogous to that previously described in our group for the synthesis of Fe2.2C@Ru,38 namely a two-step method (see Scheme 1). First, a layer of Mo was deposited, which acted as the nucleation site for the overgrowth of a Mo shell. Each step lasted for 72 hours, and an increasing concentration of Mo was used in each step, (i.e., 0.01 mmol mL−1 and 0.04 mmol mL−1). Elemental analysis data for FeNi3@Mo and Fe2.2C@Mo NPs synthesized via thermal and induction heating can be found in entries 1 and 3 in Table 2. The bulk composition of FeNi3@Mo-TH and Fe2.2C@Mo-TH NPs determined by ICP-AES analysis proved the presence of Mo in the products in 7 wt% for FeNi3@Mo-TH and 11 wt% for Fe2.2C@Mo-TH (Table 2 and Table S1, ESI†).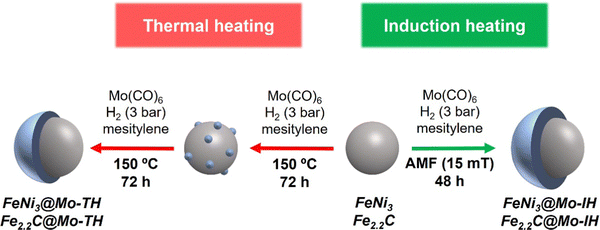 | ||
| Scheme 1 Schematic representation of thermal and magnetically induced molybdenum coating on magnetic nanoparticles. | ||
| Entry | Material | d (nm) | ICP-AESb (wt%) | XPSc (at%) | ||||
|---|---|---|---|---|---|---|---|---|
| Fe | Ni | Mo | Fe | Ni | Mo | |||
| a Particle size was calculated from the histogram plotted using the BF TEM images (all the histograms are shown in the ESI). b Mass percentage referred to the total mass of material. c Atomic percentage refers to the total amount of metals. | ||||||||
| 1 | FeNi3@Mo-TH | 14.9 ± 2.6 | 18 | 66 | 7 | 39 | 27 | 34 |
| 2 | FeNi3@Mo-IH | 15.7 ± 2.6 | 18 | 56 | 14 | 29 | 16 | 55 |
| 3 | Fe2.2C@Mo-TH | 14.8 ± 1.8 | 71 | — | 11 | 76 | — | 24 |
| 4 | Fe2.2C@Mo-IH | 14.8 ± 1.8 | 65 | — | 21 | 51 | — | 49 |
Taking advantage of the magnetic properties of FeNi3 and Fe2.2C precursors, Mo-coated nanoparticles were synthesized using induction heating (300 kHz, 15 mT) for 48 hours. The as-prepared FeNi3@Mo-IH and Fe2.2C@Mo-IH contained 14 wt% Mo for FeNi3@Mo-IH and 21 wt% for Fe2.2C@Mo-IH as determined by ICP-AES (Table 2 and Table S1, ESI†). Thus, the implementation of induction heating in the synthesis process enabled the achievement of greater quantities of Mo, all within a single cycle of the Mo(CO)6 decomposition step, while operating under 3 bars of H2, and using the same concentration of Mag-NPs as for thermal heating. Furthermore, the surface composition of the nanoparticles synthesized via thermal and induction heating was determined using the XPS technique (Table 2). Aligning with the findings observed at the bulk level, the surface analysis reveals a notable enhancement in the deposition of Mo on the bare core (FeNi3 or Fe2.2C) nanoparticles when induction heating is employed, as compared to the conventional heating method. The results from XPS data interpretation are discussed in detail in the following sections.
The morphology of the Mo-coated nanoparticles was analyzed via bright-field TEM (BF TEM). The particle size obtained from the histogram is tabulated in Table 2. Fig. S1 and S2 (ESI†) show the BF TEM image of parent FeNi3 and FeNi3@Mo-TH NPs, respectively. Both FeNi3 and FeNi3@Mo-TH NPs show similar polyhedral shapes. Likewise, the BF TEM image of Fe2.2C@Mo-TH NPs showed particles that could not be distinguished from the respective parent Fe2.2C NPs (Fig. S3 and S4, ESI†). The particle size distribution was calculated from the histogram for the as-prepared Mag-NPs and after the Mo coating and was found to be nearly identical (Fig. S1–S4, ESI†).
Additionally, further structural characterization was carried out using the powder XRD technique. The powder XRD pattern of FeNi3@Mo-TH and Fe2.2C@Mo-TH NPs was compared with the parent FeNi3 or Fe2.2C NPs cores (Fig. S5, ESI†). The diffraction patterns of Mo-coated NPs showed only the peaks corresponding to either FeNi3 or Fe2.2C NPs, and no other peak that might be attributed to any Mo species (Fig. S5, ESI†). Furthermore, the presence of the Mo shell was investigated using STEM-EDX elemental mapping. STEM coupled with EDX spectroscopy confirmed the presence of molybdenum on the surface of the nanoparticles (Fig. 1 and 2). The reason why Mo was detected by ICP-AES and STEM-EDX but not by powder XRD results is probably due to the very small amount of surface molybdenum present and to its amorphous nature.
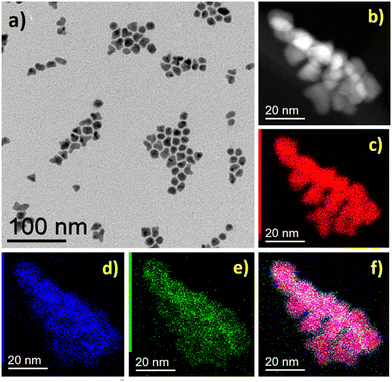 | ||
| Fig. 1 FeNi3@Mo-TH NPs, (a) BF TEM image, (b) STEM-HAADF image and STEM-EDX mapping of the sample, (c) Ni (red), (d) Fe (blue), (e) Mo (green), and (f) overlap of Fe, Ni, and Mo maps. | ||
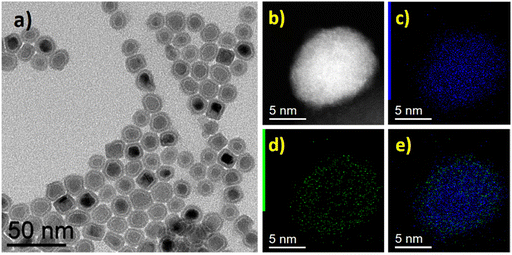 | ||
| Fig. 2 Fe2.2C@Mo-TH NPs, (a) BF TEM image, (b) STEM-HAADF image and STEM-EDX mapping showing (c) Fe (blue), (d) Mo (green), and (e) overlap of Fe and Mo maps. | ||
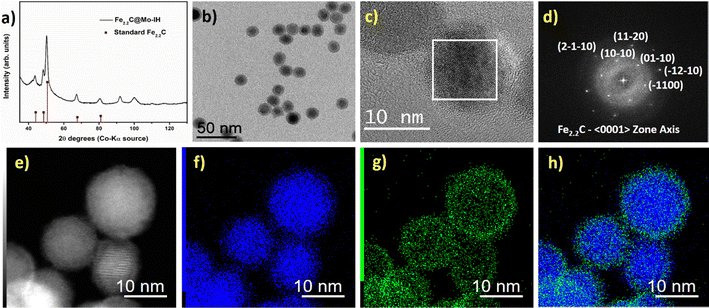
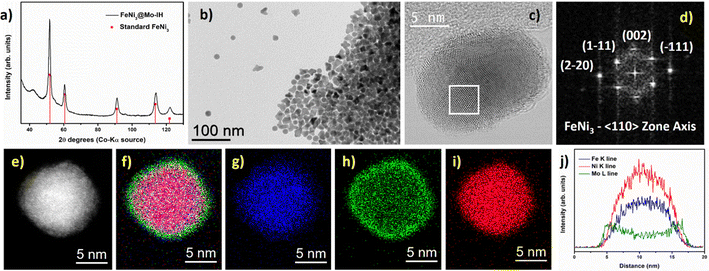
Similarly, the as-prepared FeNi3@Mo-IH and Fe2.2C@Mo-IH NPs were also characterized by BF TEM imaging, showing objects indistinguishable from their parent NPs (Fig. 3b and 4b). The FeNi3@Mo-IH NPs display a mean size of 15.7 ± 2.6 nm and a polyhedral shape (Fig. S6, ESI†), while Fe2.2C@Mo-IH NPs are spherical with a size of 14.8 ± 1.8 nm (Fig. S7, ESI†). In the same line, the powder XRD patterns matches those of the FeNi3 or Fe2.2C cores (Fig. 3a and 4a). Despite a higher concentration of Mo present in FeNi3@Mo-IH and Fe2.2C@Mo-IH as compared to the FeNi3@Mo-TH and Fe2.2C@Mo-TH, namely a ca. 0.5 nm thick Mo layer, no diffraction peaks corresponding to the Mo (metallic Mo or MoOx) species were observed. This observation can again be related to the still modest quantity of Mo present at the surface and to its amorphous nature.
Fig. 3c shows the high-resolution transmission electron microscopy (HRTEM) image of the Fe2.2C@Mo-IH. The fast Fourier transform (FFT) analysis of the core part of the HRTEM image indicates the presence of the hexagonal Fe2.2C phase (Fig. 3d). In contrast, the FFT pattern of the shell was devoid of any diffraction spots. This finding emphasizes the amorphous nature of the shell. The high-resolution scanning transmission electron microscopy high-angle annular dark field (HR-STEM HAADF) image is shown in Fig. S8 (ESI†). The Fe2.2C@Mo-IH NPs were observed to have a thin, amorphous shell measuring 1 to 2 nm, which could be attributed to Mo. To corroborate the core–shell structure, STEM-EDX mapping was conducted, and the results are shown in Fig. 3e–h. The combined Fe and Mo EDX maps confirmed that the Fe2.2C@Mo NPs had a core–shell structure, with Mo located in the outermost layer as seen in Fig. 3h.
The HRTEM image of the FeNi3@Mo-IH NPs is shown in Fig. 4c. The FFT analysis of the HRTEM image reveals a crystalline cubic FeNi3 core and an amorphous Mo shell (Fig. 4d), with a thickness of 1 to 2 nm. An amorphous outer layer is also evident in the HR-STEM image (Figure S9, ESI†). The STEM-EDX elemental mapping of the FeNi3@Mo-IH NPs is shown in Fig. 4e–i. The overlap of the Fe, Ni, and Mo EDX maps establishes the structure: FeNi alloy core and Mo shell. Additionally, EDX line scan analysis confirms the core–shell structure for FeNi3@Mo-IH, with Mo as the outer layer (Fig. 4j).
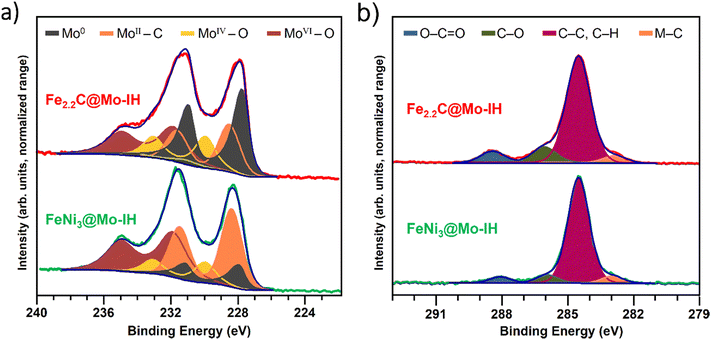
In order to investigate the electronic state of the surface Mo layer, X-ray photoelectron spectroscopy (XPS) was performed on samples synthesized via thermal and induction heating. The samples were exposed to air rapidly before introduction into the spectrometer. Fig. 5 shows a tentative fitting for the Mo3d (a) and C1s (b) regions for IH samples. In the Mo3d spectrum, clear signals of oxidized Mo could be identified, with MoIV3d5/2 appearing at 230.0 eV and MoVI3d5/2 at 231.9 eV.39,40 Additionally, adding components at lower binding energy (BE) makes it possible to achieve a satisfactory fit. Although this fitting (see the ESI† for a detailed procedure) may not precisely quantify Mo species, it helps identify Mo0 (≈227.8 eV)41,42 and carbidic Mo (≈228.4 eV).43,44 In the case of FeNi3@Mo, this carbidic peak assignment is also supported by the presence of a peak at ca. 282.8 eV in the C1s region.43 Interestingly, it can be challenging to differentiate whether carbidic and Mo0 peaks observed originate from the synthesis or from the decomposition of Mo(CO)6 on surfaces under the ultra-high vacuum conditions used during analyses.45 However, based on the low intensity of the expected CO chemisorbed peak (≈285.6 eV)46 and the lack of precursor in the IR analyses (Fig. S12, ESI†), we can assume that the shell composed of carbidic Mo and Mo0 originates from the IH-assisted synthesis.
To investigate the reasons behind variations in Mo loading during different heating processes, we looked deeper into role of the local reaction temperature. In thermal heating, the temperature of the oil bath was considered the temperature of the solution within the Fisher–Porter bottle. In induction heating, the reaction temperature of the solution during the Mo(CO)6 decomposition step was measured using an IR camera to be 165 °C (Table S3, ESI†). It is interesting to note that the Mo(CO)6 boiling point is at 156 °C, and indeed a re-crystallization was observed around the neck of the Fisher–Porter bottle during the reactions in an oil bath at 150 °C. We believe it is likely that, in conventional heating, the decomposition of Mo(CO)6 and the evaporation of Mo(CO)6 compete, resulting in the depletion of the overall Mo concentration in the solution. On the other hand, the increased amount of Mo deposited on the magnetic cores is likely due to the generation of localized hot spots in the induction heating. This has previously been demonstrated in the case of Fe2.2C@Ru where a surface temperature of 251 °C has been deduced from catalytic reactivity, whereas the mesitylene solution remained at 160 °C.47 The decomposition of Mo(CO)6 on the hot nanoparticles minimizes its re-crystallization on the walls of the reactor. Finally, it was observed that, the amount of Mo deposited in FeNi3@Mo-IH and Fe2.2C@Mo-IH NPs are associated with the SAR values of the bare cores FeNi3 (600 W g−1)48 and Fe2.2C (2100 W g−1)49 used for the synthesis; the higher SAR values of Fe2.2C result in higher Mo deposition (Table S3, ESI†).
The hysteresis curves of FeNi3@Mo-IH and Fe2.2C@Mo-IH were measured using vibrating sample magnetometry (VSM) technique at 5 and 300 K (Fig. S13, ESI†). The saturation magnetization (Ms, A m2 kg−1) and coercive field (Hc, mT) values obtained at 5 and 300 K were tabulated in Table S4 (ESI†). As expected, upon deposition of the non-magnetic element (Mo), both the Ms and Hc decrease for FeNi3@Mo-IH and Fe2.2C@Mo-IH as compared to the bare core (Table S4, ESI†). The SAR measured in an AMF at a frequency of 93 kHz and 47 mT, FeNi3@Mo-IH reached a value of 154 W g−1 and Fe2.2C@Mo-IH one of 808 W g−1 (Fig. S14, ESI†). These values are substantially lower than those of their bare cores (600 W g−1 for Fe30Ni70 and 2100 W g−1 for Fe2.2C).48,49 Upon deposition of non-magnetic materials, the overall heating efficiency decreases for the core–shell NPs, a phenomenon previously reported.38
Finally, the highly loaded Mag-NP@Mo-IH NPs were chosen for induction heating mediated gas-phase propane dry reforming (PDR) reactions. The FeNi3@Mo-IH and Fe2.2C@Mo-IH NPs were further diluted in the Siralox (Siralox-5, 5% SiO2 doped Al2O3) using ultrasonication (see the experimental section, ESI†). Due to the dilution of the Mag-NPs with a non-heating Siralox support, the overall heating capacity of the materials decreases. Hence, commercial Fe wool was used as an additional heating agent in order to reach the high temperatures needed for PDR (see the experimental section, ESI†). Such use of Fe wool in gas-phase catalytic reactions under induction heating has been previously demonstrated by our group.36,37
Before the PDR reaction, the Sirlaox samples were enriched with a Mo2C phase by being carburized in a propane and hydrogen mixture at 670–680 °C for 90 minutes, as stated in the experimental section (ESI†). This phase is already known to enable CO2 dissociation in dry reforming.50 As a model system, after carburization, the FeNi3@Mo2C-IH/Siralox sample was characterized by TEM, XRD, and XPS techniques (see the ESI† for a detailed discussion). The Mo2C phase was identified using the XRD and XPS techniques (Fig. S15–S17, ESI†). The particle size of the FeNi3@Mo2C-IH nanoparticles was slightly higher than the starting FeNi3@Mo-IH NPs (Fig. S18, ESI†). The propane conversion, CO2 conversion, carbon monoxide (CO) selectivity, and reaction temperature for different catalysts are shown in Table 3. In a control test, the pure Fe wool did not display any catalytic activity toward the PDR reaction, under the same experimental conditions. When Mo coating is followed by in situ carburization in the case of FeNi3 and Fe2.2C catalysts, propane conversion increases. Remarkably, the CO selectivity for all the catalysts was found to be >92%. The TEM images of the as-prepared and the spent catalysts are shown in Fig. S21–S28 (ESI†). In all the spent catalysts, deposition of the carbon flakes and carbon filaments was observed. The β-Mo2C phase was observed for the spent Mo-containing catalysts (Fig. S29, ESI†).
| Catalyst | Propane Conv. (%) | CO2 Conv. (%) | CO Sel. (%) | T (°C) |
|---|---|---|---|---|
| FeNi3/Siralox | 73 | 11 | 97 | 572 |
| FeNi3@Mo-IH/Siralox | >99 | 19 | 93 | 570 |
| Fe2.2C/Siralox | 2 | 6 | 94 | 581 |
| Fe2.2C@Mo-IH/Siralox | 29 | 17 | >99 | 584 |
| FeNi3@WOx-IH/Siralox | 60 | 15 | 92 | 560 |
Catalytic test conditions under induction heating: 300 kHz coil, catalyst weight 150 mg, iron wool weight 100 mg, total flow of 40 mL min−1 (propane![[thin space (1/6-em)]](https://www.rsc.org/images/entities/char_2009.gif) :
:![[thin space (1/6-em)]](https://www.rsc.org/images/entities/char_2009.gif) CO2 = 1
CO2 = 1![[thin space (1/6-em)]](https://www.rsc.org/images/entities/char_2009.gif) :
:![[thin space (1/6-em)]](https://www.rsc.org/images/entities/char_2009.gif) 3; propane 10 mL min−1 and CO2 30 mL min−1), and WHSV = 16
3; propane 10 mL min−1 and CO2 30 mL min−1), and WHSV = 16![[thin space (1/6-em)]](https://www.rsc.org/images/entities/char_2009.gif) 000 mL gcat−1 h−1. The catalysts are carburized prior to the catalytic test. Carburization conditions: total flow of 50 mL min−1 (propane
000 mL gcat−1 h−1. The catalysts are carburized prior to the catalytic test. Carburization conditions: total flow of 50 mL min−1 (propane![[thin space (1/6-em)]](https://www.rsc.org/images/entities/char_2009.gif) :
:![[thin space (1/6-em)]](https://www.rsc.org/images/entities/char_2009.gif) H2 = 1
H2 = 1![[thin space (1/6-em)]](https://www.rsc.org/images/entities/char_2009.gif) :
:![[thin space (1/6-em)]](https://www.rsc.org/images/entities/char_2009.gif) 4; propane 10 mL min−1 and H2 40 mL min−1) and at 670–680 °C for 90 min.
4; propane 10 mL min−1 and H2 40 mL min−1) and at 670–680 °C for 90 min.
The IH technology has been proven to efficiently permit the growth of a molybdenum shell on magnetic NPs by utilizing the magnetic heating properties of precursor cores under mild reaction conditions. In this direction, the advantages of the induction heating mediated synthesis of Mag-NPs@Mo were generalized by demonstrating the synthesis of FeNi3@WOx NPs from W(CO)6. In this synthesis, upon completion of the decomposition of the W(CO)6 precursor in the presence of FeNi3 NPs, the nanoparticles are deliberately oxidized via slow air diffusion (experimental section). Remarkably, the chemical stability and semiconducting properties of WOx have found application in various fields such as electro- and photochromism, pH sensing, photo(electro)catalysis, and acid catalysis.51–53
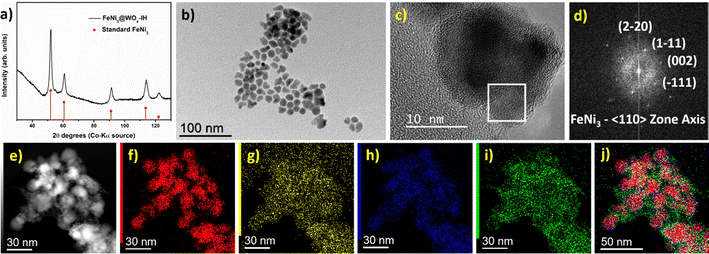
The powder XRD pattern of the FeNi3@WOx-IH NPs matches the cubic FeNi3 phase (Fig. 6a). Like previously, the diffraction peaks corresponding to any W (metallic W or WOx) species were not observed. The particle size and the polyhedral shapes of the FeNi3@WOx-IH NPs resemble the bare FeNi3 NPs (Fig. 6b). Furthermore, through a comprehensive analysis combining HRTEM and FFT analysis, we have substantiated the presence of a cubic FeNi3 core along with an amorphous WOx shell (Fig. 6c and d). The incorporation of an amorphous WOx layer on the FeNi3 core was also observed in the STEM EDX elemental mapping (Fig. 6e–j) and was evident from the HRSTEM HAADF imaging (Fig. S30, ESI†). The Siralox diluted FeNi3@WOx-IH sample was further tested for the PDR reaction (Table 3, entry 5). The catalyst was found active for PDR reaction with ∼92% CO selectivity. Hence, this specific synthesis example evidences the efficiency of the induction-heating approach and its potential to be extended to other complex materials designs.
Conclusions
This study investigated the benefits of using induction heating to create complex nanomaterials. It has been shown that the combination of magnetic induction heating with Mag-NPs, such as Fe2.2C and FeNi3, induces Mo(CO)6 decomposition and results in the synthesis of well-formed core–shell nanoparticles. These nanoparticles possess a distinctive structure wherein the outer shell contains amorphous carbidic Mo, and the magnetic phases, FeNi3 or Fe2.2C, reside in the core. By directing the decomposition towards the nanoparticle surface, this method shows notable advantages. It allows the decomposition of the precursor on the hot spots created by magnetic induction, thus resulting in the deposition of about twice the amount of molybdenum on the nanoparticle shell, in a shorter reaction time and with less Mo(CO)6 precursor used than in the thermal conditions. These nanoparticles were then supported on Siralox for use in PDR and enriched with the Mo2C phase in-situ before catalysis under a propane and hydrogen atmosphere. Finally, these new materials were shown to display interesting catalytic properties under magnetic induction.Overall, we describe a new method for the preparation of complex nanomaterials containing a magnetic core. We have chosen for the shell a metal which is difficult to obtain at the nanoscale in a reduced form, namely molybdenum and have shown that it can be extended to an even more difficult metal, namely tungsten. This methodology can then be used for the synthesis of different complex nanostructures, depending on the desired application.
Conflicts of interest
The authors declare no conflict of interest.Acknowledgements
The authors gratefully acknowledge the funding from the ERC Advance grant (MONACAT 2015-694159). The authors thank Alain Moreau (LCC, Toulouse) for the ICP analysis.References
- W. Wang, G. Tuci, C. Duong-Viet, Y. Liu, A. Rossin, L. Luconi, J.-M. Nhut, L. Nguyen-Dinh, C. Pham-Huu and G. Giambastiani, ACS Catal., 2019, 9, 7921–7935 CrossRef CAS.
- M. Estrader, K. Soulantica and B. Chaudret, Angew. Chem., Int. Ed., 2022, 61, e202207301 CrossRef CAS PubMed.
- J. Marbaix, N. Mille, J. Carrey, K. Soulantica and B. Chaudret, in Nanoparticles in Cataysis, ed. K. Philippot and A. Roucoux, WILEY-VCH GmbH,Germany, 1st edition, 2021, ch. 14, pp. 309–329 Search PubMed.
- A. Rajan and N. K. Sahu, J. Nanopart. Res., 2020, 22, 1–27 CrossRef.
- O. Lucía, P. Maussion, E. J. Dede and J. M. Burdío, IEEE Trans. Ind. Electron. Control Instrum., 2014, 61, 2509–2520 Search PubMed.
- L. Hu, R. Zhang and Q. Chen, Nanoscale, 2014, 6, 14064–14105 RSC.
- K. Wang, Q. Yang, H. Zhang, M. Zhang, H. Jiang, C. Zheng and J. Li, J. Mater. Chem. A, 2023, 11, 7802–7832 RSC.
- G. Xiong, Y. Chen, Z. Zhou, F. Liu, X. Liu, L. Yang, Q. Liu, Y. Sang, H. Liu, X. Zhang, J. Jia and W. Zhou, Adv. Funct. Mater., 2021, 31, 2009580 CrossRef CAS.
- Y. Fu, A. V. Rudnev, G. K. H. Wiberg and M. Arenz, Angew. Chem., Int. Ed., 2017, 56, 12883–12887 CrossRef CAS PubMed.
- M. Seifert, S. Drieschner, B. M. Blaschke, L. H. Hess and J. A. Garrido, Diamond Relat. Mater., 2014, 47, 46–52 CrossRef CAS.
- R. Piner, H. Li, X. Kong, L. Tao, I. N. Kholmanov, H. Ji, W. H. Lee, J. W. Suk, J. Ye, Y. Hao, S. Chen, C. W. Magnuson, A. F. Ismach, D. Akinwande and R. S. Ruoff, ACS Nano, 2013, 7, 7495–7499 CrossRef CAS PubMed.
- B. D. Sosnowchik and L. Lin, Appl. Phys. Lett., 2006, 89, 193112 CrossRef.
- S. Devillers, Q. Lemineur, J. Delhalle and Z. Mekhalif, Electrochim. Acta, 2011, 56, 4953–4959 CrossRef CAS.
- W. Dai, L. Lv, J. Lu, H. Hou, Q. Yan, F. E. Alam, Y. Li, X. Zeng, J. Yu, Q. Wei, X. Xu, J. Wu, N. Jiang, S. Du, R. Sun, J. Xu, C.-P. Wong and C.-T. Lin, ACS Nano, 2019, 13, 1547–1554 CAS.
- P. Sharma, N. Holliger, P. H. Pfromm, B. Liu and V. Chikan, ACS Omega, 2020, 5(31), 19853–19860 CrossRef CAS PubMed.
- V. Chikan and E. J. McLaurin, Nanomaterials, 2016, 6, 85 CrossRef PubMed.
- C. Gómez-Polo, S. Larumbe, L. Fernández Barquín and L. Rodríguez Fernández, J. Nanopart. Res., 2016, 18, 118 CrossRef.
- L. Cervera-Gabalda and C. Gómez-Polo, Sci. Rep., 2023, 13, 8913 CrossRef CAS PubMed.
- S. Wei, Q. Wang, J. Zhu, L. Sun, H. Lin and Z. Guo, Nanoscale, 2011, 3, 4474–4502 RSC.
- K. Chatterjee, S. Sarkar, K. J. Rao and S. Paria, Adv. Colloid Interface Sci., 2014, 209, 8–39 CrossRef CAS PubMed.
- M. B. Gawande, A. Goswami, T. Asefa, H. Guo, A. V. Biradar, D.-L. Peng, R. Zboril and R. S. Varma, Chem. Soc. Rev., 2015, 44, 7540–7590 RSC.
- R. Ghosh Chaudhuri and S. Paria, Chem. Rev., 2012, 112, 2373–2433 CrossRef CAS PubMed.
- E. de Smit and B. M. Weckhuysen, Chem. Soc. Rev., 2008, 37, 2758–2781 RSC.
- X.-H. Wang, H.-L. Hao, M.-H. Zhang, W. Li and K.-Y. Tao, J. Solid State Chem., 2006, 179, 538–543 CrossRef CAS.
- M. J. Ledoux, C. Pham Huu, J. Guille and H. Dunlop, J. Catal., 1992, 134, 383–398 CrossRef CAS.
- Y. Ma, G. Guan, X. Hao, J. Cao and A. Abudula, Renewable Sustainable Energy Rev., 2017, 75, 1101–1129 CrossRef CAS.
- S. Zaman and K. J. Smith, Catal. Rev.: Sci. Eng., 2012, 54, 41–132 CrossRef CAS.
- T. Namiki, S. Yamashita, H. Tominaga and M. Nagai, Appl. Catal., A, 2011, 398, 155–160 CrossRef CAS.
- F. G. Baddour, E. J. Roberts, A. T. To, L. Wang, S. E. Habas, D. A. Ruddy, N. M. Bedford, J. Wright, C. P. Nash, J. A. Schaidle, R. L. Brutchey and N. Malmstadt, J. Am. Chem. Soc., 2020, 142, 1010–1019 CrossRef CAS PubMed.
- C. J. Chen, W. S. Lee and A. Bhan, Appl. Catal., A, 2016, 510, 42–48 CrossRef CAS.
- E. F. Mai, M. A. Machado, T. E. Davies, J. A. Lopez-Sanchez and V. Teixeira da Silva, Green Chem., 2014, 16, 4092–4097 RSC.
- J.-T. Ren, Y.-J. Song and Z.-Y. Yuan, J. Energy Chem., 2019, 32, 78–84 CrossRef.
- A. Siahvashi, D. Chesterfield and A. A. Adesina, Chem. Eng. Sci., 2013, 93, 313–325 CrossRef CAS.
- Z. O. Malaibari, E. Croiset, A. Amin and W. Epling, Appl. Catal., A, 2015, 490, 80–92 CrossRef CAS.
- A. Siahvashi and A. A. Adesina, Int. J. Hydrogen Energy, 2018, 43, 17195–17204 CrossRef CAS.
- S. Ghosh, T. Ourlin, P. –F. Fazzini, L.-M. Lacroix, S. Tricard, J. Esvan, S. Cayez and B. Chaudret, ChemSusChem, 2023, 16, e202201724 CrossRef CAS PubMed.
- S. Ghosh, S. Gupta, M. Gregoire, T. Ourlin, P.-F. Fazzini, E. Abi-Aad, C. Poupin and B. Chaudret, Nanomaterials, 2023, 13(9), 1474 CrossRef CAS PubMed.
- J. M. Asensio, A. B. Miguel, P.-F. Fazzini, P. W. N. M. van Leeuwen and B. Chaudret, Angew. Chem., Int. Ed., 2019, 58, 11306–11310 CrossRef CAS PubMed.
- J.-G. Choi and L. T. Thompson, Appl. Surf. Sci., 1996, 93, 143–149 CrossRef CAS.
- J. Baltrusaitis, B. Mendoza-Sanchez, V. Fernandez, R. Veenstra, N. Dukstiene, A. Roberts and N. Fairley, Appl. Surf. Sci., 2015, 326, 151–161 CrossRef CAS.
- M. Watschinger, K. Ploner, D. Winkler, J. Kunze-Liebhäuser, B. Klötzer and S. Penner, Rev. Sci. Instrum., 2021, 92(2), 024105 CrossRef CAS PubMed.
- C. J. Powell, J. Electron Spectrosc. Relat. Phenom., 2012, 185, 1–3 CrossRef CAS.
- K. Oshikawa, M. Nagai and S. Omi, J. Phys. Chem. B, 2001, 105, 9124–9131 CrossRef CAS.
- J. Gao, Y. Wu, C. Jia, Z. Zhong, F. Gao, Y. Yang and B. Liu, Catal. Commun., 2016, 84, 147–150 CrossRef CAS.
- C.-C. Cho and S. L. Bernasek, J. Vac. Sci. Technol., A, 1987, 5, 1088–1090 CrossRef.
- F. Zaera, J. Phys. Chem., 1992, 96, 4609–4615 CrossRef CAS.
- Z. J. Díaz-Puerto, Á. Raya-Barón, P. W. N. M. van Leeuwen, J. M. Asensio and B. Chaudret, Nanoscale, 2021, 13, 12438–12442 RSC.
- D. De Masi, J. M. Asensio, P.-F. Fazzini, L.-M. Lacroix and B. Chaudret, Angew. Chem., Int. Ed., 2020, 59, 6187–6191 CrossRef CAS PubMed.
- A. Bordet, L.-M. Lacroix, P.-F. Fazzini, J. Carrey, K. Soulantica and B. Chaudret, Angew. Chem., Int. Ed., 2016, 55, 15894–15898 CrossRef CAS PubMed.
- Y. Diao, X. Zhang, Y. Liu, B. Chen, G. Wu and C. Shi, Appl. Catal., B, 2022, 301, 120779 CrossRef CAS.
- C. C. Mardare and A. W. Hassel, Phys. Status Solidi, 2019, 216, 1900047 CrossRef.
- T. H. Wondimu, A. W. Bayeh, D. M. Kabtamu, Q. Xu, P. Leung and A. A. Shah, Int. J. Hydrogen Energy, 2022, 47, 20378–20397 CrossRef CAS.
- H. Hattori and Y. Ono. Solid acid catalysis: from fundamentals to applications. CRC Press, 2015 Search PubMed.
Footnotes |
| † Electronic supplementary information (ESI) available. See DOI: https://doi.org/10.1039/d3mh00908d |
| ‡ Equally contributed. |
| This journal is © The Royal Society of Chemistry 2023 |


