DOI:
10.1039/D3MA00394A
(Paper)
Mater. Adv., 2023,
4, 4409-4416
Novel synthesis of polyaniline/tellurium (PANI/Te) nanocomposite and its EMI shielding behavior†
Received
11th July 2023
, Accepted 31st August 2023
First published on 5th September 2023
Abstract
A one-pot thermal method for the synthesis of polyaniline/tellurium PANI/Te nanocomposite with the conducting emeraldine salt (ES) form of polyaniline is presented. The PANI/Te nanocomposite is synthesized via the reaction of in situ generated tellurium with aniline in the presence of a small amount of 2-mercaptoethanol (MPE) at the boiling temperature of aniline, where MPE acted as a reducing agent. The nanocomposite so generated was characterized by UV-Vis, FTIR, XRD, SEM, and AFM and then tested for its application in EMI shielding. The UV-Vis spectrum showed the absorption bands corresponding to benzenoid and quinoid excitations in polyaniline at 354, 382 and 605 nm. FTIR confirmed the peaks due to ES polyaniline. XRD analysis confirmed the formation of PANI/Te with impurities of TeO2. The addition of 4 wt% of Ag NPs to the PANI/Te nanocomposites increased the EMI shielding effectiveness of PANI/Te films fabricated in PVA from −4 dB to about −10 dB. This is probably the first study of a PANI nanocomposite involving Te for EMI application. A comparative study of the EMI shielding properties of PANI/Te alone, as well as doped with Ag and additional Te, is presented.
1. Introduction
Conducting polymers gained tremendous attention soon after the synthesis of famous conducting polymers such as polyacetylene by Shirakawa et al.,1 which revolutionized this field. With doping of bromine in polyacetylene, a million times increase in conductivity was observed, and the invention was recognized with the Nobel prize in chemistry in 2000.2 Polyaniline (PANI), being easily synthesized and cost-effective, became a popular choice among conducting polymers.3–5 It possesses unique electronic and physical properties that make it versatile for various applications in electrical and electronic devices. Despite its advantages, polyaniline suffers in terms of stability and usability due to its rigid backbone and weak charge/discharge cycle. To overcome such issues, polyaniline blends with other polymers, as well as nanocomposites with metal/metal oxide nanoparticles, have been documented by many researchers in recent times.6–10
The electromagnetic interference (EMI) shielding materials have gained much attention recently. The proliferation of electronics has led to electromagnetic pollution, posing a threat to human life. The electromagnetic shielding mechanism aims to prevent radiation from escaping or entering equipment. To this end, various EMI shielding materials, including semiconductors, metal oxides, magnetic particles and metal nanoparticles, along with conducting polymers, have been reported.21 Researchers described a one-pot Fe/PPy nanocomposite for microwave shielding performance.7 Likewise, a polyaniline composite has been proposed for shielding of EM radiation in buildings, employing composite material derived from polyaniline and bricks.8 Conducting polymer composites show good shielding behavior against EM radiation due to changes in dielectric properties. PANI nanocomposites have been studied extensively for their microwave-absorbing properties.12 While metal-based materials have demonstrated strong shielding performance, they have limitations such as high density, reflection, and limited flexibility. Composites of conductive polymer have gained prominence as alternatives to overcome these limitations. However, to improve EMI shielding, fillers often affect the mechanical properties and costs. The main challenge in developing EMI shielding based on conducting polymers is to achieve high shielding effectiveness with a lower amount of fillers.11–15
Polyaniline has different forms categorized by its oxidation state, such as leucoemeraldine, pernigraniline, and emeraldine.16 Emeraldine base (EB) is the most extensively studied form, exhibiting both conducting and insulating behaviors. Emeraldine salt (ES) is a highly conducting form obtained by doping with an acid. Pernigraniline base (PB) is an insulating form that can be reduced to the emeraldine base. Leucoemeraldine base (LEB) is a partially reduced form, displaying a combination of conducting and insulating properties.3–7
Several methods have been utilized for the synthesis of polyaniline, including chemical oxidative polymerization,17 electrochemical polymerization,18 and template-assisted synthesis.19 Chemical oxidative polymerization is the most common method and results in different forms of polyaniline materials, such as powder, film, and fibre. A notable advantage of PANI is its ability to be easily doped and undoped, altering its electrical conductivity, which makes it a versatile material for a large domain of applications, e.g., electronic devices,20 supercapacitors,21 sensors,22 fuel cells,23 batteries,24 thermoelectric materials25 and EMI shielding.26
Despite several approaches to and forms of PANI, there is not much study on its composites with tellurium, and only a handful of reports are available on the PANI/Te nanocomposites, e.g., the electrodeposition of Te over PANI-coated phenolic foam reported by Jiang et al.27 In another approach, Kazim et al.16 reported the doping of PANI with an acidic solution of tellurium to prepare the PANI/Te composite. It is also reported that freshly prepared Te can act as catalyst for the polymerization of aniline by using hydrazine hydrate to start the polymerization to generate PANI-coated Te nanowire.28 Similarly, Wang et al.29 utilized the ultrasonic dispersion method to form Te/PANI film.
A PANI composite film with modified polyvinyl alcohol (PVA) prepared by Erdogon et al.30 had shown 5.6 dB average value of EMI shielding effectiveness (EMSE) in the 30 MHz–3 GHz range, corresponding to 71% shielding. In another research, Gangopadhyay et al.31 observed approx. 10 dB of shielding effectiveness (SE) in PANI-PVA film with 19% PANI loading. Also, with increasing thickness of the film, SE was found to increase for a lower PANI loading. However, for 19% PANI loading, the thickness effect was negligible. Wan et al.32 observed unusually high magnetic loss in the microwave region (1–18 GHz) in PANI-NSA (polyaniline-naphthalene sulfonic acid) microtubules. Kim et al.33 found approx. 99% SE in ES PANI- coated films. A reflection loss of −54 dB at 33.72 GHz and −42 dB at 29.27 GHz in the PANI/Fe3O4 composite film of 0.5 mm thickness was reported by Tang et al.,34 while Li et al.35 successfully developed lightweight and flexible films by incorporating amine-functionalized carbon nanotubes (CNTs) into polyaniline (PANI) for excellent shielding behavior. Similarly, shielding effectiveness of about 57 dB for a hybrid film of ∼10 μm thickness of PANI-nanorod/graphene-nanoflake was reported by Mohan et al.36
The present article highlights an in situ polymerization of aniline to prepare its composite with Te using sodium tellurite in the presence of 2-mercaptoethanol, a mild reducing agent. The EMI shielding property of PANI/Te nanocomposite so generated was investigated and demonstrated herein, revealing that using silver nanoparticles (Ag NPs) as an additional conductive nanofiller, the EMI efficiency can be improved. The shielding effectiveness of PANI/Te nanocomposite is compared with tellurium and silver.
2. Experimental details
2.1. Materials and measurements
Sodium tellurite (98.0%, Loba Chemie Pvt Ltd), aniline (≥ 99.0%, Merck Ltd), 2-mercaptoethanol (98.0%, Alfa Aesar), and polyvinyl alcohol (PVA, 99.0%, Loba Chemie Pvt Ltd) were used as purchased. XRD analysis was carried out on a bench-top AXRD PROTO instrument (Canada) with a Cu Kα source of 1.541 Å (λ). The measurements were done at a scanning rate of 2° min−1 between 2θ = 10–90°. UV-visible spectrum was obtained using an Analytik Jena SPECORD 210 PLUS UV spectrophotometer. Topological morphology characterization was performed using an Asylum Research MFP3D-Bio Atomic Force Microscope. FTIR was recorded on a BRUKER ALPHA II Compact FT-IR spectrometer. The current through the pellet was measured by a Kiethley source meter, Model 2420. EMI shielding measurements were carried out using films of 1 mm thickness with the PNA Network Analyzer (Vector Network Analyzer) Agilent Technologies model no. N5222A.
2.2. Synthesis of PANI/Te nanocomposite
The synthesis involves a convenient one-pot solvothermal reaction. Typically, a two-necked 100 mL round-bottom flask was charged with aniline (10.0 mL) and sodium tellurite (1.0 g), and the mixture was heated to the boiling point of aniline under an inert atmosphere of nitrogen with continuous stirring. To this was added 2-mercaptoethanol (2.0 mL) dropwise through a syringe, and the reaction continued at 180 °C for 4–6 h to allow the polymerization of aniline by in situ–generated Te via reduction of sodium tellurite. After the reaction, the precipitate was centrifuged and subsequently washed multiple times using ethanol. The distinctive green color of the isolated powder indicated the formation of polyaniline emeraldine salt (ES).
3. Results and discussion
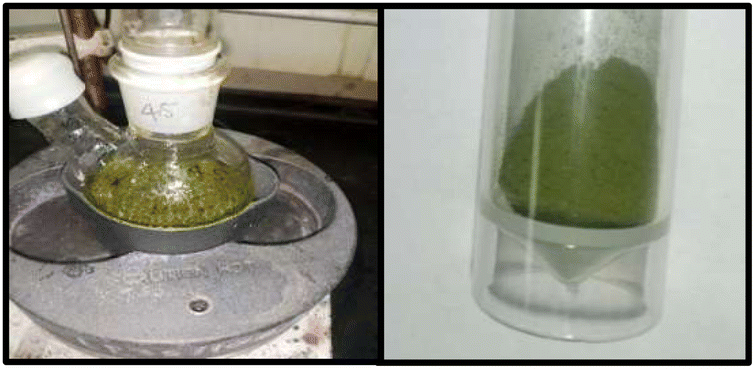
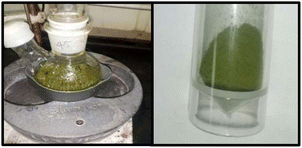
The polymerization process involves a series of reactions between the reagents present. Two significant color changes were observed during the process. The first change occurred when sodium tellurite, present in its white form, was reduced by 2-mercaptoethanol, resulting in the formation of black tellurium. The second change involved the polymerization of aniline into the ES form, causing the solution to turn green, as shown in Fig. 1. Overall, based on previous studies on polyaniline and its composites,27,29 the polymerization mechanism can be explained in terms of the in situ formation of tellurium nanoparticles, which then act as templates and assist in the polymerization of aniline. It is also likely that initially, aniline monomers form attachments with sodium tellurite molecules, creating a complex which eventually liberates Te nanoparticles.
 |
| | Fig. 1 Synthesis of PANI/Te nanocomposite. | |
When this complex attempts to stabilize, a redox reaction might occur between tellurium and tellurite ions due to surface instability of the tellurium nanoparticles, which triggers the polymerization of aniline. These nanoparticles not only facilitate the polymerization process but also stabilize the ES form of polyaniline by providing the necessary anionic support. Although the ES form of polyaniline exhibits good environmental stability, it is challenging to create a chemically stable solution. The composite is reasonably stable in dipolar aprotic solvent; however, in aqueous medium, the green color turns grayish, possibly due to weakening of the interaction between tellurium and the PANI functionality. It is possible that the presence of tellurium oxide as an impurity may generate anionic oxygen atoms that may stabilize the ES polyaniline due to the considerable difference in electronegativity. A change in the oxidation state of tellurium is believed to be the main cause of the oxidation of aniline and its subsequent polymerization. The nanocomposite was characterized by UV-Vis, IR, and XRD, etc. The powder was converted to pellets to measure its conductivity.
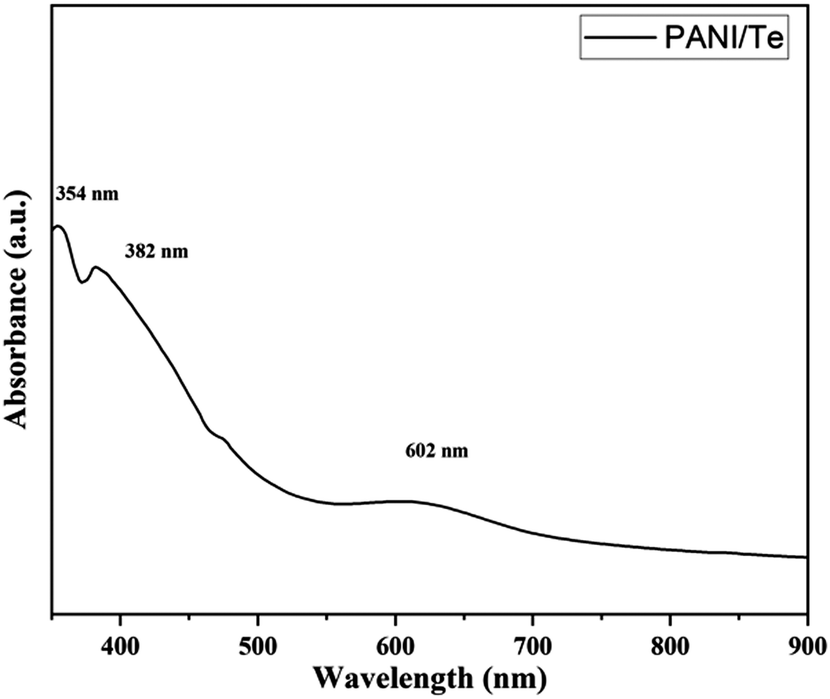
UV-visible absorbance in DMSO indicates a band for benzenoid ring-associated π–π* transition at 354 nm. Excitation of the quinoid ring is identified with bands at 382 and 605 nm (Fig. 2). A low-intensity 605 nm band and an invisibly faint band at 836 nm is due to interaction with Te and TeO2 and the reduction of quinoid moiety, indicating the conducting nature of the composite.37 Such an impression has been described by various researchers when PANI interacts with inorganic elements.16,27–29,38 The product obtained is green, which indicates the form of polyaniline to be an ES form.
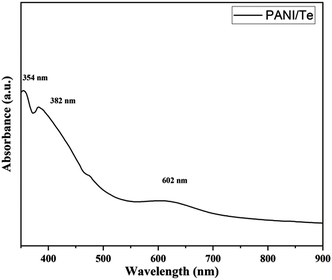 |
| | Fig. 2 UV-visible spectrum of PANI/Te in DMSO. | |
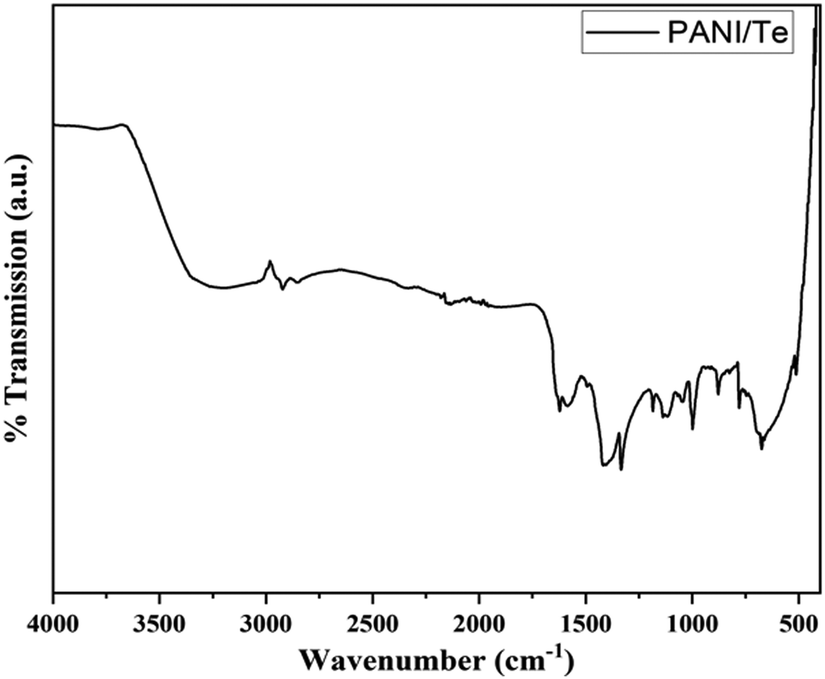
The FTIR spectra of polyaniline composites can provide valuable insights into their chemical composition and structural properties. The characteristic IR bands are observed, including the stretching (str.) vibration for N–H at about 3220 cm−1, and other stretching vibrations at 1584, 1493, and 1334 cm−1, respectively, for C![[double bond, length as m-dash]](https://www.rsc.org/images/entities/char_e001.gif) N, CC, and C–N bonds. Additional bands for 1,4-disubstituted benzene ring are found at 1136 cm−1, 998 cm−1, and 513 cm−1, which can be correlated with in-plane bending and out-of-plane deformation vibration modes of aromatic C–H.27–29 (Fig. 3 and Table 1). The presence of benzenoid and quinoid rings leads to peaks at approximately 1500 cm−1 and 1600 cm−1, respectively. The presence of quinoid peaks confirms the ES form of polyaniline. The IR spectrum also contains peaks corresponding to the Te–O bond at 780 cm−1 and 674 cm−1, respectively.38 All other FTIR bands can be attributed to stretching and bending of bonds in the polyaniline chain, as presented in Table 1.39,40 XRD analysis shows diffraction peaks for polyaniline, tellurium, and tellurium dioxide (Fig. 4). Although polyaniline is non-crystalline, it shows a semi-crystalline nature in some cases. It is reported that PANI (EB) has multiple peaks at 2θ = 18.5, 19.4, 20.0, 22.2° and even beyond.41a,b In the present study, diffraction peaks for polyaniline are observed at 2θ values of 15.29, 16.22, 18.17, 19.84, and 21.08° in the XRD pattern of the PANI/Te nanocomposite. Major peaks of tellurium observed are 27.50, 38.23, 40.39, 43.31, and 49.61, with the respective planes (101), (102), (110), (111), and (021), along with some other minor peaks.27,29
N, CC, and C–N bonds. Additional bands for 1,4-disubstituted benzene ring are found at 1136 cm−1, 998 cm−1, and 513 cm−1, which can be correlated with in-plane bending and out-of-plane deformation vibration modes of aromatic C–H.27–29 (Fig. 3 and Table 1). The presence of benzenoid and quinoid rings leads to peaks at approximately 1500 cm−1 and 1600 cm−1, respectively. The presence of quinoid peaks confirms the ES form of polyaniline. The IR spectrum also contains peaks corresponding to the Te–O bond at 780 cm−1 and 674 cm−1, respectively.38 All other FTIR bands can be attributed to stretching and bending of bonds in the polyaniline chain, as presented in Table 1.39,40 XRD analysis shows diffraction peaks for polyaniline, tellurium, and tellurium dioxide (Fig. 4). Although polyaniline is non-crystalline, it shows a semi-crystalline nature in some cases. It is reported that PANI (EB) has multiple peaks at 2θ = 18.5, 19.4, 20.0, 22.2° and even beyond.41a,b In the present study, diffraction peaks for polyaniline are observed at 2θ values of 15.29, 16.22, 18.17, 19.84, and 21.08° in the XRD pattern of the PANI/Te nanocomposite. Major peaks of tellurium observed are 27.50, 38.23, 40.39, 43.31, and 49.61, with the respective planes (101), (102), (110), (111), and (021), along with some other minor peaks.27,29
 |
| | Fig. 3 FTIR spectrum of PANI/Te nanocomposite. | |
Table 1 FTIR peak analysis of PANI/Te nanocomposite
| Wavenumber (cm−1) |
Vibrations (Stretching) |
| 3220 |
N–H str. |
| 2930 |
Aromatic C–H str. |
| 1622, 1584 |
CN (quinoid) |
| 1493 |
CC (benzenoid) |
| 1419 |
C–N (benzenoid) |
| 1334 |
Aromatic C–N (amine group) |
| 1136 |
C–H bending (in plane) |
| 779 |
Para-disubstituted aromatic rings indicating polymer formation |
| 674 |
Te–O str. |
| 513 |
C–H out of plane deformation |
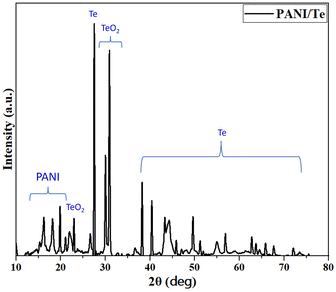 |
| | Fig. 4 XRD pattern of PANI/Te nanocomposite. | |
However, either in situ generated or due to surface oxidation, peaks for TeO2 are also observed. Therefore, the composite material can be considered as a PANI/Te nanocomposite with some impurity of tellurium oxide, which is evident from the XRD pattern showing peaks at 2θ = 30.02, 30.89, and 44.29, with respective Miller planes (111), (102) and (211) that correspond to α-TeO2.42,43 By using the Scherrer formula, the average crystallite size for Te nanoparticles was estimated to be about 35 nm in the sample. Overall analysis confirms the formation of PANI/Te with impurities of TeO2.40
The SEM images are presented in Fig. 5(i), which show a mixed morphology mainly composed of spherical and rod-shaped components in the PANI/Te nanocomposite powder that appear to be platelets, and the particles are visible in and around; however, these may also be uniformly present in the film so as to boost their overall sturdy morphology. Images at various magnification levels (100 nm × 50![[thin space (1/6-em)]](https://www.rsc.org/images/entities/char_2009.gif) 000, 1 um × 5000, 1 um × 20000, 100 nm × 30000) are presented. Obviously, PANI/Te possesses agglomerated spherical, rod, and stacked rod structures. The EDAX analysis clearly indicated the presence of respective components in the composite, as shown in Fig. S1 (ESI†). The presence of sulphur is also observed due the fact that 2-mercaptoethanol was employed as the surface capping-cum-reducing agent. Fig. 5(ii) depicts the surface topology of a PANI/Te blended PVA film examined using atomic force microscopy (AFM). The heights of the partially spherical blobs are measured in nanometres, demonstrating the nanodomain topology of surfaces.
000, 1 um × 5000, 1 um × 20000, 100 nm × 30000) are presented. Obviously, PANI/Te possesses agglomerated spherical, rod, and stacked rod structures. The EDAX analysis clearly indicated the presence of respective components in the composite, as shown in Fig. S1 (ESI†). The presence of sulphur is also observed due the fact that 2-mercaptoethanol was employed as the surface capping-cum-reducing agent. Fig. 5(ii) depicts the surface topology of a PANI/Te blended PVA film examined using atomic force microscopy (AFM). The heights of the partially spherical blobs are measured in nanometres, demonstrating the nanodomain topology of surfaces.
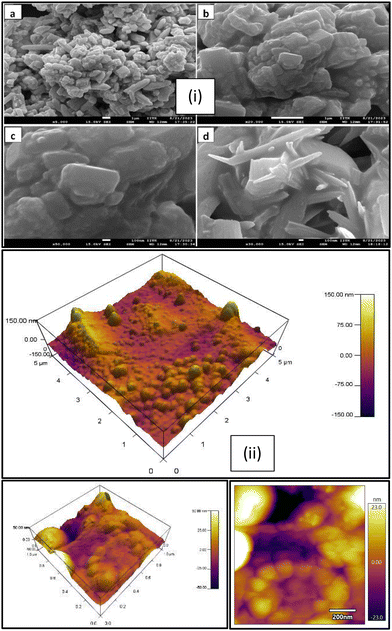 |
| | Fig. 5 (i) SEM images of the PANI/Te powder, (a, b) Scale-1 μm & (c, d) Scale-100 nm and (ii) AFM images of the PANI/Te-PVA film. | |
The shape of the film is known to be highly dependent on the mixing of the PANI/Te nanocomposite in the PVA solution. Structural heterogeneity is clearly visible in the image of the nanocomposite film, which is a characteristic property of most semicrystalline materials including amorphous constituents. Fig. 5 (ii) suggests different locations have distinct surface shapes due to blending of PANI/Te particles into the PVA polymer solution, possibly due to inhomogeneous size distribution. The heights of the hills and bumps are almost 100 nm, while the depths of the valleys within are nearly 50 nm. The AFM is nearly similar to those discussed in the literature.44 It is reported that polyaniline is a hole-transporting material with conductivity in the semiconducting range with varying values of Te doping (10−9–10−3 S m−1), up to 25% doping.16 In the present case, Te is assumed to be about 20–25% with respect to the in situ form of PANI, and therefore, the values obtained are comparable with literature. The calculated value for DC conductivity of the sample was found to be in the semiconducting range, i.e., 2.1 × 10⁻⁵ S m−1, which was measured using a two-probe method. The current was measured at a fixed voltage of 1.0 V, and a nearly constant value was obtained during the measurement. Conductivity can be calculated based on the dimensions of the pellet using the equation given below:
where
t = pellet thickness,
R = the resistance and
A = pellet surface area.
In the present case, thickness of the pellet was 1 mm and diameter was 12.5 mm. It is found that the PANI/Te nanocomposite was more conductive than undoped polyaniline, while the PANI/Te presented in this article has lower conductivity compared to 25% Te-doped polyaniline and Te nanowire alone.16,29 Movement of the polarons, i.e., electron–phonon interaction in the polymer lattice, is responsible for its conducting nature. Hopping of charge carriers occurs between two polymer chains the during conduction process.29
Having observed reasonable conductivity of PANI/Te, it was appropriate to test the samples for EMI shielding behavior. PANI/Te polymer composite films were fabricated using a solution processing method. Microwave heating was employed to dissolve PVA in deionized water. Subsequently, PANI/Te composite was added to the PVA solution. In some cases, Ag NPs and Te powder were also added to evaluate their impact on the shielding property. A total of seven films of different compositions of PANI/Te were prepared (Table 2). The films were analysed by XRD and FTIR. The results of three samples, namely, PANI/Te-PVA (F2), PANI/Te/Ag-PVA (F4) and Te/PANI/Te/Ag-PVA (F7), are discussed herein briefly. PVA embedded films show significant changes in XRD pattern. It is expected that the peaks related to PANI and PVA may overlap, leading to shallow reflections in XRD (Fig. 6).
Table 2 Details of constituents of composite films
| Sample name |
PVA (gm) |
PANI/Te (gm) |
Te (gm) |
Ag NPs (gm) |
| Te-PVA (F1) |
2.0 |
— |
0.25 |
— |
| PANI/Te-PVA(F2) |
2.0 |
0.5 |
— |
— |
| Te/Ag-PVA (F3) |
2.0 |
— |
0.25 |
0.02 |
| PANI/Te/Ag -PVA (F4) |
2.0 |
0.5 |
— |
0.02 |
| Te-PVA (F5) |
2.0 |
— |
0.5 |
— |
| Te/Ag-PVA (F6) |
2.0 |
— |
0.5 |
0.02 |
| Te/PANI/Te/Ag-PVA (F7) |
2.0 |
0.5 |
0.25 |
0.02 |
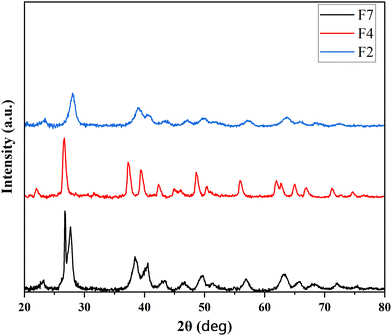 |
| | Fig. 6 XRD pattern of PANI/Te-PVA (F2), PANI/Te/Ag-PVA (F4) and Te/PANI/Te/Ag-PVA (F7) films. | |
Normally, the peaks for both are more or less in matching 2θ positions. It is reported that the peak at 2θ value of about 20° is attributed to the PVA (101) plane.45 Samples F2, F4 and F7 differ with respect to the peaks for Ag. On comparison, it is found that the peak broadening has increased upon Ag doping. Peaks of Ag may have overlapped with tellurium in both F4 and F7 samples.28,29 The peaks in F4 had sharpened, with some shifts in diffraction angles indicating increased cluster diameter. Additionally, it is observed that peaks due to impurities of TeO2 are suppressed in PVA composites. In film, F7 peak broadening is observed, confirming the nano-regime nature of the composite. Also in the films, some reflections are observed due to impurities of TeO2.46 Some entities may not show XRD diffractions, as PVA quantity in the film is much higher than the elements and suppression of crystallinity is expected. Table S1 (ESI†) and Fig. 6 show the relevant XRD peaks for tellurium in the selected films F2, F4 and F7.
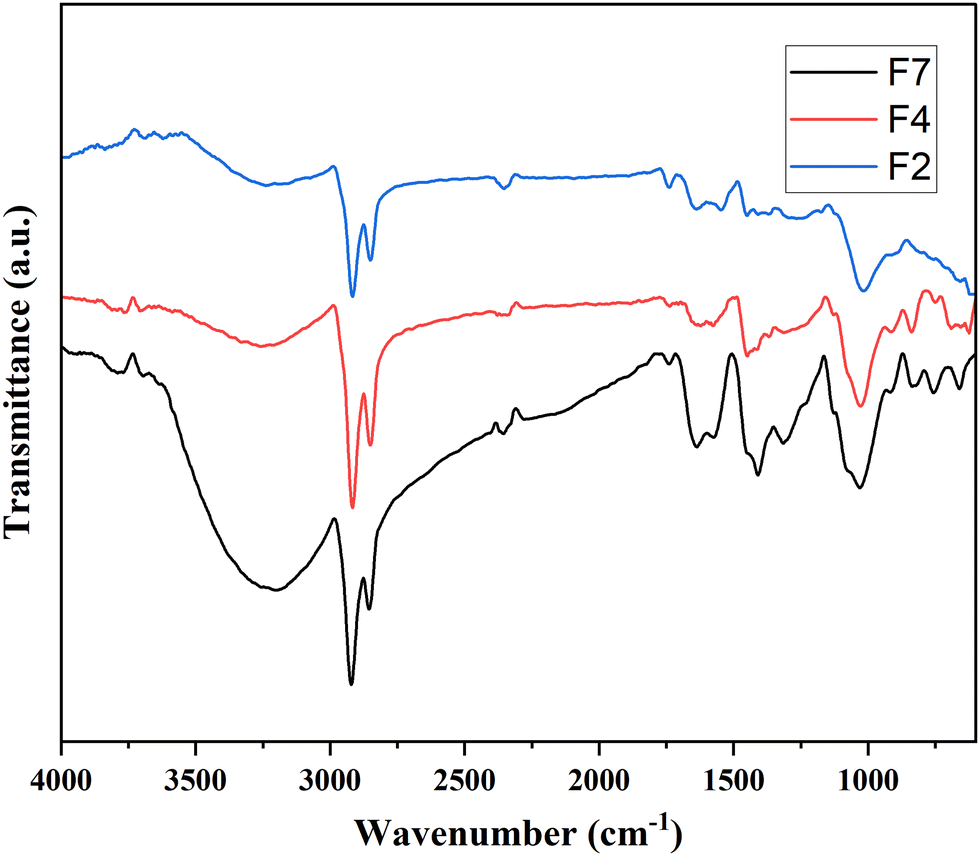
FTIR analysis of the three representative composite films is presented in Fig. 7. Based on the literature on previously studied composite films,45 it is noticed that the characteristic IR peaks corresponding to PVA in sample F2 are observed at 3235, 2924, 2353, 1451, 1368, 1015, 915 and 835 cm−1. On comparison, it is found that the peak intensity at about 1400 cm−1 upon the addition of silver was enhanced in the sample. Other peaks were similar to PVA in all samples. In F7 film, the intensity of O–H at 3200 cm−1, CH2 near 2900 cm−1, and C–C–O at 1400 cm−1 has increased as compared to F2 and F4. Also, the O–H stretching and CH2 bending have slightly shifted to lower wavenumbers. It is observed that PVA functionality has been affected by the inorganic fillers. The N–H frequency for all samples relating to PANI are possibly overlapped with the O–H functionality of PVA, as their values are very close to each other. Peaks at 1638 cm−1 for CN due to quinoid stretching (for PANI) were also affected in all samples. However, the absorbed water may also result in peaks in this range, as has been reported by Jipa et al.45 The peak values corresponding to PVA in all the three representative samples are shown in Table S2 (ESI†).
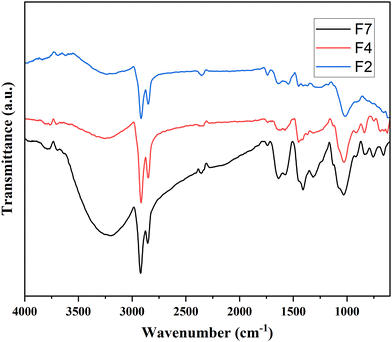 |
| | Fig. 7 FTIR spectra of F2, F4 and F7 films. | |
4. EMI shielding studies
EMI shielding is the material property that stops the transmission of EM waves. There are two primary ways of shielding any object from radiation, i.e., reflection and absorption. A conductivity range of 10−3 to 1.0 S cm−1 is sufficient for blocking EM waves through reflection, due to ohmic (heating) loss because of electrons and holes (the charge carriers). Meanwhile, for absorption-mode EMI shielding, interaction of the electric and/or magnetic dipoles of the material with EM radiation is needed. It is well documented that a good shielding material should effectively attenuate more EM field.15,47,48 The EMI shielding properties of various polymer composite films are listed in Table 3. The EMI analysis was conducted using a two-port vector network analyzer (VNA) to measure complex scattering parameters known as S-parameters, namely, S11 (for incident wave) and S12 (for transmitted wave). These parameters can be suitably connected with the reflectance (R = |S11|2) and transmittance (T = |S12|2). The equation A = (1 − R − T) was employed for calculation of the absorbance (A).15,33 Moreover, EM wave intensity related to reflection inside the shielding material was primarily determined by the quantity (1 − R). This quantity can be utilized to normalize the absorbance (A), resulting in the effective absorbance denoted as {Aeff = [(1 − R − T)/(1 − R)]}. By employing this approach, the experimental reflection and absorption losses can be expressed as given below.47,48| | | SER = 10log (1 − R) = 10log (1 − |S11|2) | (1) |
| | | SEA = 10log (T/1 − R) = 10log (1 − |S12|2) | (2) |
and| | | SEA =10log (1 − Aeff) | (3) |
Table 3 EMI shielding property of the composite films
| Sample name |
SER dB (max) |
SEA dB (max) |
SET (dB) (max) |
% shielding |
| Te-PVA (F1) |
−1.00 |
−3.19 |
−4.19 |
61.90 |
| PANI/Te-PVA (F2) |
−1.00 |
−3.00 |
−4.0 |
60.19 |
| Te/Ag-PVA (F3) |
−0.89 |
−2.00 |
−2.89 |
48.60 |
| PANI/Te/Ag -PVA (F4) |
−1.77 |
−7.00 |
−8.77 |
86.73 |
| Te-PVA (F5) |
−1.40 |
−2.70 |
−4.10 |
61.10 |
| Te/Ag-PVA (F6) |
−1.10 |
−2.10 |
−3.20 |
52.14 |
| Te/PANI/Te/Ag-PVA(F7) |
−2.80 |
−7.39 |
−10.19 |
90.43 |
To calculate the total shielding effectiveness,
| | | SET = SER + SEA = 10log (Pt/Pi) | (4) |
and
| | | SET = 10log (1 − T) | (5) |
The % shielding formulation applied for the films is as follows:
where SE is total shielding effectiveness,
is percentage power transmitted, and
is the percentage shielding.
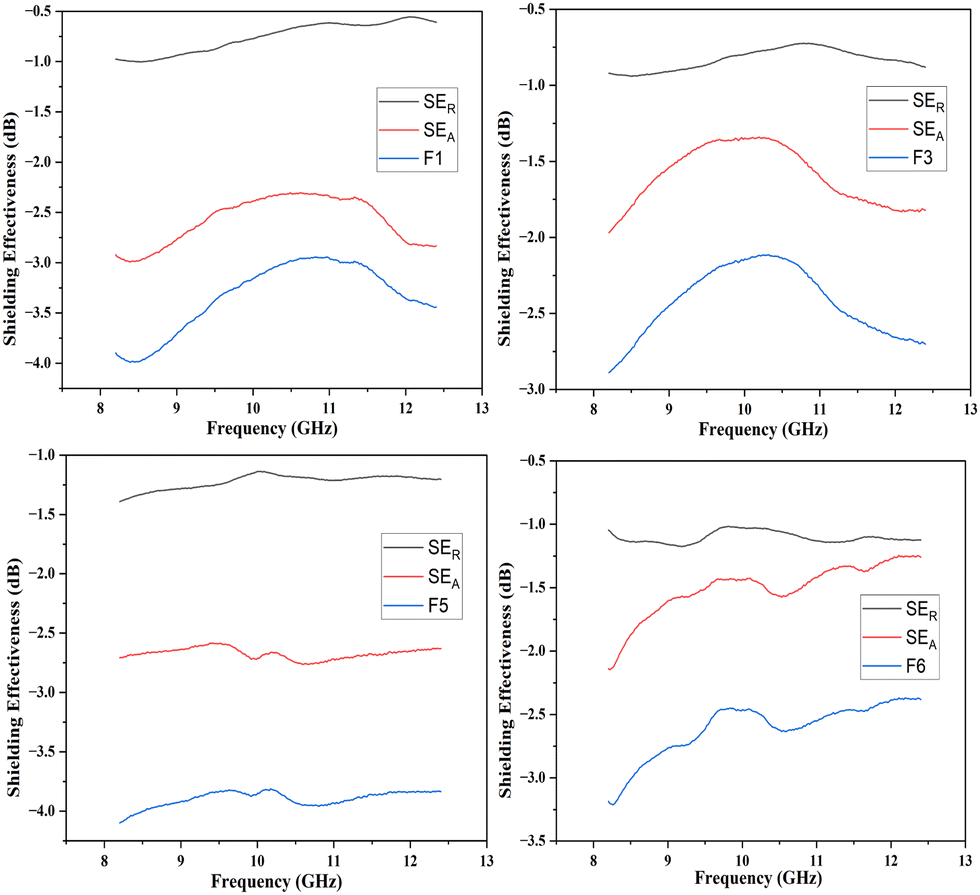
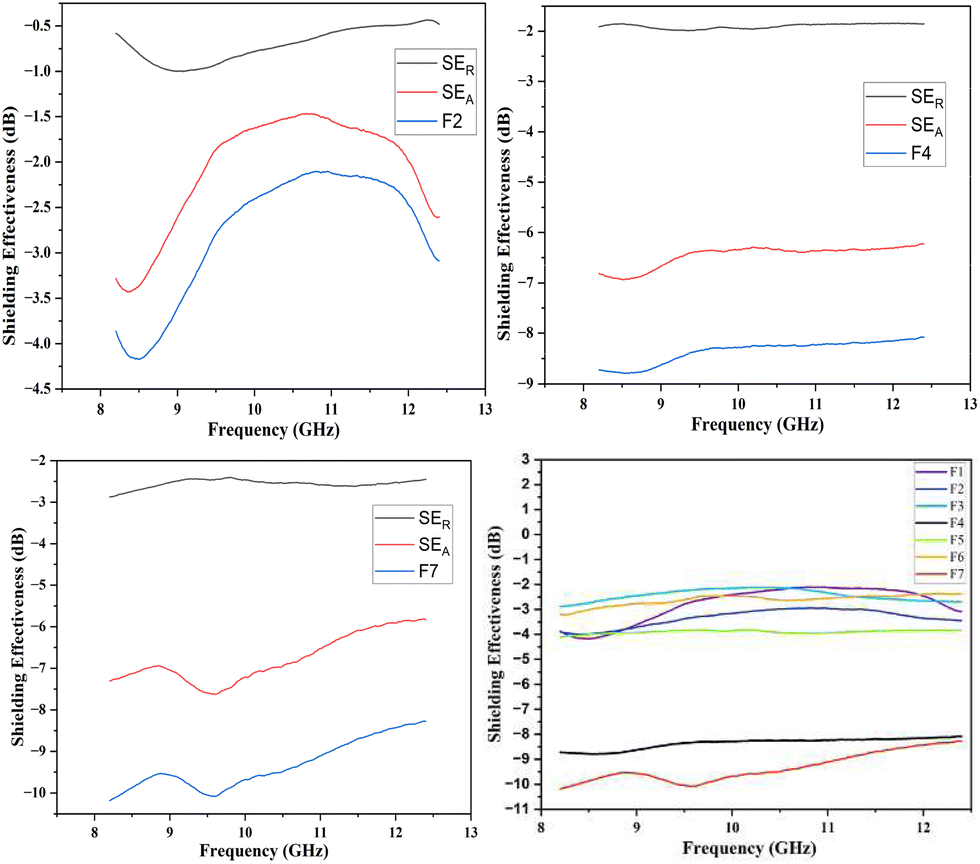
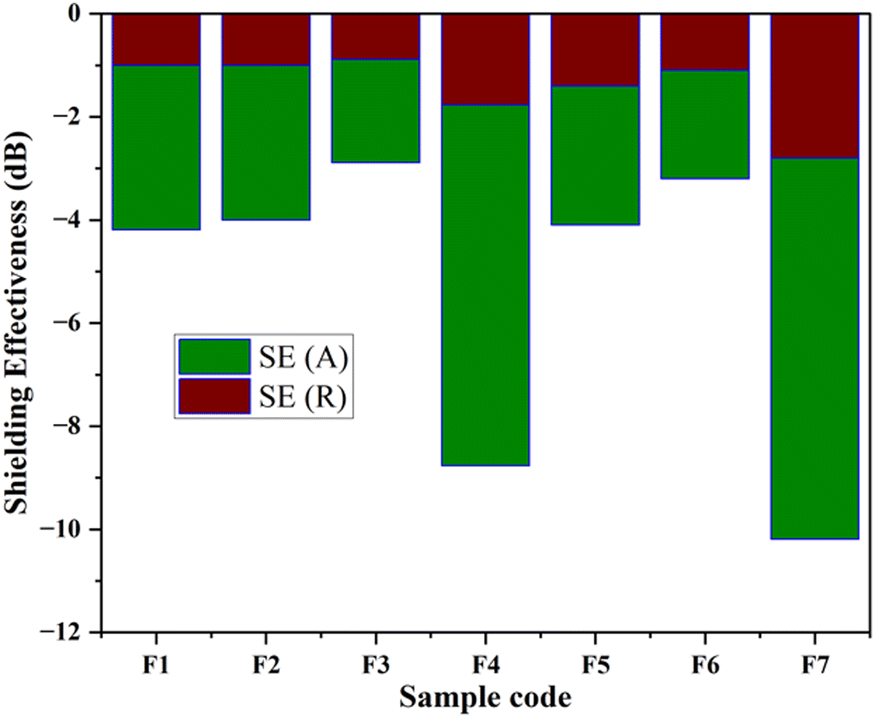
In the present study, the behavior of the composites was investigated in the X-band (8–12 GHz). The values of S11 and S12 were obtained from the EMI shielding test using the shielding effectiveness values, which are estimated and presented in Table 3 (Fig. 8, 9 and 10). The PANI/Te-PVA nanocomposite shows reasonably encouraging shielding effectiveness by virtue of contribution from the conducting nanofillers. Appropriately, it is observed that by adding Ag NPs to the composite, nearly 2.5 times increase in shielding effectiveness can be realized. Such a result can be considered promising EMI shielding for radar, terrestrial and space applications.14 In the case of PVA/Te films without PANI, i.e., F1, F3, F5 and F6, very small effect on SE is observed in the presence of Ag NPs. According to Fig. 8, the maximum shielding efficiency for these films is observed at ∼8.5 GHz. However, in PVA films of PANI/Te, i.e., F2, F4 and F7, the effect of Ag NPs is remarkable. Film F4 shows the maximum estimated increase in SET of −4.77 dB when compared with film F2. This enhancement comes from SER and SEA, by −0.77 dB and 4.00 dB, respectively. Therefore, it is confirmed that an increase in the dipolar nature of the PANI/Te nanocomposite film can be attained with additional Ag nanofiller. Thus, the value in film F4 has increased to −8.77 dB (86.73% shielding) as against −4.00 dB (60.19% shielding) in film F2. The effect of additional tellurium in the composite has also been investigated for film F4 by doubling the tellurium content in the PANI/Te/Ag powder, and the resultant film was named F7. This film has shown a further increase in SET of −1.42 dB (3.7%) as compared to F4. It is realized that the contributions from SER and SEA are −2.80 dB and −7.39 dB, respectively, and the total shielding effectiveness value is −10.19 dB (90.43% shielding). Also, there has been an increase in SE at 9.5 GHz frequency in F7, which shows a value of approx. −10 dB. It can be said that the conducting nature of Ag nanofiller causes an increase in the absorption mode of shielding, which could be due to the enhanced dipolar properties of the nanocomposite material. Overall, it is observed that the EMI efficiency has improved from −4.0 dB for F2 to −8.77 for F4, which further improved to −10.19 dB in the case of F7, highlighting the impact of inorganic fillers in the nanocomposites.14,47,48 It should be noted that the EMI shielding efficiency of pure PANI is reported in the range of −0.5 dB,49 and that of PVA film is reported to be −0.34 dB.50 The mechanism of EMI shielding is similar to what has been proposed by several searchers, where the contribution from reflectance as well as absorbance has been correlated with shielding efficiency.51,52
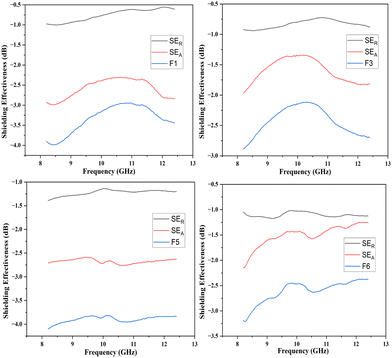 |
| | Fig. 8 Shielding effectiveness (SE) of the nanocomposite films without PANI. | |
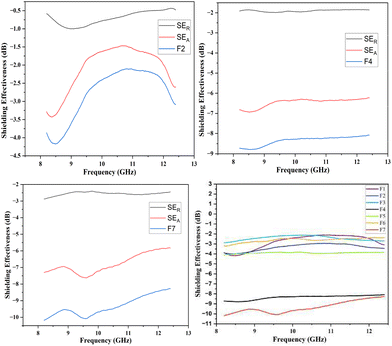 |
| | Fig. 9 Shielding effectiveness (SE) of F2, F4, F7 and of all films. | |
 |
| | Fig. 10 Bar chart of shielding effectiveness (SE) of all the films. | |
5. Conclusion
Overall, the present article is unique in presenting a novel approach to the synthesis of polyaniline/tellurium nanocomposite. The UV-visible absorption spectrum of the PANI/Te powder in DMSO showed bands at 354 nm for the associated benzenoid rings and at 382 and 605 nm for the quinoid ring. This is probably the first study on EMI shielding using the PANI/Te nanocomposite. The composite was characterized by XRD and FTIR to establish its correctness and the functionality of polyaniline. It was observed that the composite may acquire TeO2 impurities in situ due to incomplete reduction of sodium telluride, which is supported by XRD showing peaks for Te at 2θ = 30.02, 30.89, and 44.29 for α-TeO2.
In the EMI shielding application, metal nanoparticles enhanced the shielding effectiveness of the PANI/Te nanocomposite by increasing the conductivity of the material. There have been positive impacts from different constituents on the PANI/Te nanocomposite, e.g., Ag NPs and tellurium, while the presence of Ag in the PANI/Te nanocomposite increased the SE due mainly to absorption efficiency. EMI efficiency improved from −4.0 dB for F2 to −8.77 for F4, which further improved to −10.19 dB in the case of F7 due to the presence of silver nanoparticles. The polyaniline, being conducting in nature, may be useful for effective EMI shielding in various electronics and photonic devices.
Author contributions
Experiments were designed by Prof. Pawan K. Khanna. Experiments were conducted by Alok Kumar Yadav and Naeem. Characterization was carried out by Alok and Naeem, while the results were analysed by all three. Manuscript draft was prepared by Alok and finalized by the corresponding author.
Conflicts of interest
There are no conflicts to declare.
Acknowledgements
Authors thank Vice-Chancellor DIAT(DU) Pune for support and the Department of Applied Physics for EMI measurement. Naeem Mohammad is thankful to DST, GoI for the INSPIRE fellowship for doctoral research (Fellow No. IF200413).
References
- H. Shirakawa, E. J. Louis, A. G. Macdiarmid, C. K. Chiang and A. J. Heeger, J. Chem. Soc., Chem. Commun., 1977, 578–580 RSC.
- A. J. Heeger, J. Phys. Chem. B, 2001, 105, 8475–8491 CrossRef CAS.
-
F. X. Perrin and C. Oueiny, Polyaniline Blends, Composites, and Nanocomposites, ed. P. M. Visakh, C. D. Pina and E. Falletta, Elsevier, Cambridge, 2018, vol. 5, pp. 117–147 Search PubMed.
-
S. A. Waghuley, Polyaniline Blends, Composites, and Nanocomposites, ed. P. M. Visakh, C. D. Pina and E. Falletta, Elsevier, Cambridge, 2018, vol. 10, pp. 257–277 Search PubMed.
-
F. Ran and Y. Tan, Polyaniline Blends, Composites, and Nanocomposites, ed. P. M. Visakh, C. D. Pina and E. Falletta, Elsevier, Cambridge, 2018, 7, 175–208 Search PubMed.
- P. Saini, V. Choudhary, B. P. Singh, R. B. Mathur and S. K. Dhawan, Mater. Chem. Phys., 2009, 113, 919–926 CrossRef CAS.
- R. Peymanfar, F. Norouzi and S. Javanshir, Mater. Res. Express, 2019, 6, 035024 CrossRef.
- R. Peymanfar, S. Keykavous-Amand, M. M. Abadi and Y. Yassi, Constr. Build. Mater., 2020, 263, 120042 CrossRef CAS.
- J. Srivastav, P. K. Khanna, P. V. More and N. Singh, Adv. Mater. Lett., 2017, 8(1), 42–48 CrossRef.
- M. Faisal and S. Khasim, Iran. Polym. J., 2013, 22, 473–480 CrossRef CAS.
-
N. Ezzati, E. Asadi, M. Abdouss and M. H. Ezzati, Polyaniline Blends, Composites, and Nanocomposites, ed. P. M. Visakh, C. D. Pina and E. Falletta, Elsevier, Cambridge, 2018, vol. 4, pp. 279–303 Search PubMed.
- M. Wan, X. H. Tang, J. H. Cai, H. Wu, J.-B. Shen and S.-Y. Guo, Carbon, 2021, 177, 377–402 CrossRef.
- K. Sushmita, G. Madras and S. Bose, ACS Omega, 2020, 5, 4705–4718 CrossRef CAS PubMed.
- M. Dragoman, T. Braniste, S. Iordanescu, M. Aldrigo, S. Raevschi, S. Shree, R. Adelung and I. Tiginyanu, Nanotechnology, 2019, 30, 34LT01 CrossRef CAS PubMed.
-
P. Saini and M. Arora, in New Polymers for Special Applications, ed. A. De Souza Gomes, InTech, 2012, 3, 71–112 Search PubMed.
- S. Kazim, V. Ali, M. Zulfequar, M. M. Haq and M. Husain, Curr. Appl. Phys., 2007, 7, 68–75 CrossRef.
- A. Yasuda and T. Shimidzu, Polym. J., 1993, 25, 329–338 CrossRef CAS.
- K. Koga, S. Yamasaki, K. Narimatsu and M. Takayanagi, Polym. J., 1989, 21, 773 Search PubMed.
- R. V. Parthasarathy and C. R. Martin, Chem. Mater., 1994, 6, 1627–1632 CrossRef CAS.
- Y. Mei, Z. Shen, S. Kundu, E. Dennis, S. Pang, F. Tan, G. Yue, Y. Gao, C. Dong, R. Liu, W. Zhang and M. I. Saidaminov, Chem. Mater., 2021, 33, 4679–4687 CrossRef CAS.
- H. Zhou, H. Chen, S. Luo, G. Lu, W. Wei and Y. Kuang, J. Solid State Electrochem., 2005, 9, 574–580 CrossRef CAS.
- S. S. Joshi, T. P. Gujar, V. R. Shinde and C. D. Lokhande, Sens. Actuators, B, 2008, 132, 349–355 CrossRef CAS.
- Y. Qiao, S. J. Bao, C. M. Li, X. Q. Cui, Z. S. Lu and J. Guo, ACS Nano, 2008, 2, 113–119 CrossRef CAS PubMed.
- Z. Li, Y. Shen, Y. Li, F. Zheng, L. Liu, X. Liu and D. Zou, High Perform. Polym., 2019, 31, 178–185 CrossRef CAS.
- L. Wang, Y. Liu, Z. Zhang, B. Wang, J. Qiu, D. Hui and S. Wang, Composites, Part B, 2017, 122, 145–155 CrossRef CAS.
- S. Koul, R. Chandra and S. K. Dhawan, Polymer, 2000, 41, 9305–9310 CrossRef CAS.
- C. H. Jiang, W. Wei, Z. M. Yang, C. Tian and J. S. Zhang, J. Porous Mater., 2012, 19, 819–823 CrossRef CAS.
- J. Wang, X. Zhang, R. Ke, S. Zhang, C. Mao, H. Niu, J. Song, S. Li and Y. Tian, Semicond. Sci. Technol., 2016, 31, 055011 CrossRef.
- Y. Wang, S. M. Zhang and Y. Deng, J. Mater. Chem. A, 2016, 4, 3554–3559 RSC.
- M. K. Erdogan and M. Sacak, GU J. Sci., 2021, 34, 381–394 Search PubMed.
- R. Gangopadhyay, A. De and G. Ghosh, Synth. Met., 2001, 123, 21–31 CrossRef CAS.
- M. Wan, J. Li and S. Li, Polym. Adv. Technol., 2001, 12, 651–657 CrossRef CAS.
- B. R. Kim, H. K. Lee, S. H. Park and H. K. Kim, Thin Solid Films, 2011, 519, 3492–3496 CrossRef CAS.
- F. Xu, L. Ma, Q. Huo, M. Gan and J. Tang, J. Magn. Magn. Mater., 2015, 374, 311–316 CrossRef CAS.
- H. Li, X. Lu, D. Yuan, J. Sun, F. Erden, F. Wang and C. He, J. Mater. Chem. C, 2017, 5, 8694–8698 RSC.
- R. R. Mohan, A. T. Prasannakumar, J. John, S. J. Varma and S. J. ayalekshmi, New J. Chem., 2023, 47, 2565–2574 RSC.
-
M. Goswami, R. Ghosh and A. K. Meikap, in Polyaniline Blends, Composites, and Nanocomposites, ed. P. M. Visakh, C. D. Pina and E. Falletta, Elsevier, Cambridge, 2018, vol. 12, pp. 305–325 Search PubMed.
- R. A. El-Mallawany, Infrared Phys., 1989, 29, 781–785 CrossRef CAS.
- P. K. Khanna, M. V. Kulkarni, N. Singh, S. P. Lonkar, V. V. V. S. Subbarao and A. K. Viswanath, Mater. Chem. Phys., 2006, 95, 24–28 CrossRef CAS.
- P. K. Khanna, N. Singh, S. Charan and A. K. Viswanath, Mater. Chem. Phys., 2005, 92, 214–219 CrossRef CAS.
-
(a) S. Bhadra and D. Khastgir, Polym. Test., 2008, 27, 851–857 CrossRef CAS;
(b) T. Jana and A. K. Nandi, Langmuir, 2000, 16, 3141–3147 CrossRef CAS.
- A. Amari, M. K. A. Mesfer, N. S. Alsaiari, M. Danish, A. M. Alshahrani, M. A. Tahoon and F. B. Rebah, Int. J. Electrochem. Sci., 2021, 16, 210235 CrossRef CAS.
- C. Yuwen, B. Liu, P. Liu, S. Guo and L. Zhang, Mater. Chem. Phys., 2020, 255, 123637 CrossRef.
- D. K. Bandgar, G. D. Khuspe, R. C. Pawar, C. S. Lee and V. B. Patil, Appl. Nanosci., 2014, 4, 27–36 CrossRef CAS.
- I. M. Jipa, A. Stoica, M. Stroescu, L. M. Dobre, T. Dobre, S. Jinga and C. Tardei, Chem. Pap., 2012, 66, 138–143 CAS.
- W. J. Lan, S. H. Yu, H. S. Qian and Y. Wan, Langmuir, 2007, 23, 3409–3417 CrossRef CAS PubMed.
- B. A. A. Asbahi, S. M. H. Qaid and A. G. El-Shamyd, J. Ind. Eng. Chem., 2021, 100, 233–247 CrossRef.
- M. Khan, A. N. Khan, A. Saboor and I. H. Gul, Polym. Compos., 2017, 39, 3686–3695 CrossRef.
- M. Zahid, R. Anum, S. Siddique, H. F. Shakir and Z. Rehan, J. Thermoplast. Compos. Mater., 2023, 36, 1717–1761 CrossRef CAS.
- N. Mohammad, D. Khanna, P. Phalswal and P. K. Khanna, Mater. Lett., 2023, 347, 134597 CrossRef CAS.
- R. Peymanfar, A. Ahmadi, E. Zakerin, A. Ghaffari, M. M. Mojtahedi and A. Sharif, Chem. Eng. J., 2021, 405, 126985 CrossRef CAS.
- H. Dogari, R. Peymanfar and H. Ghafuri, RSC Adv., 2023, 13, 22205 RSC.
|
| This journal is © The Royal Society of Chemistry 2023 |

 Open Access Article
 This Open Access Article is licensed under a Creative Commons Attribution-Non Commercial 3.0 Unported Licence
 *
*