 Open Access Article
A review on fine-tuning of energy storage characteristics of conducting polymers
Bindu
M.
* and
Pradeepan
Periyat
 *
*
Department of Environmental Studies, Kannur University, Mangattuparamba Campus-670567, India. E-mail: binduscs@gmail.com; pperiyat@kannuruniv.ac.in
First published on 22nd May 2023
Abstract
To meet the day by day increasing energy requirements, energy storage devices have been fabricated by using the most relevant synthesis strategies and technologies. The device should be capable of storing a large amount of energy with a light weight package and should distribute the stored energy rapidly during working. Conducting polymers are very attractive candidates for storing charge by rapid oxidation reduction reaction. However, in the pristine form they cannot meet certain requirements of energy storage in practical applications. To solve this problem, they are often made into a composite with many fillers for capacitive energy storage applications. Incorporation of carbon nanostructures into conducting polymeric matrices improves the energy storage characteristics. This review highlights the recent trends and advances in conducting polymer–carbon nanomaterial nanocomposites for energy storage applications. The key factors influencing the energy storage performance have been discussed in detail.
1. Introduction
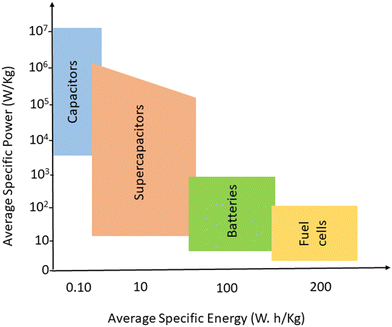
In the quest for a sustainable solution to the energy crisis, flexible, miniaturised, ultrathin, portable energy storage materials have been developed.1,2 Energy storage strategies need reliable and unique approaches towards electrical power storage and devices that can store sufficient quantity of energy, which can be used later. Electrochemical storage devices include capacitors, supercapacitors, batteries and fuel cells; they have similar electrochemical properties but differ in the mechanism of energy storage.3 Batteries and fuels cells have low power, whereas for capacitors, the specific power is greater than 106 W kg−1 at low specific energy.4,5 Supercapacitors lie in between capacitors and batteries, in terms of both power and specific energy. Fig. 1 gives an idea about the average specific energy and specific power of various energy storage devices.Supercapacitors have drawn more research interest than lithium-ion batteries, owing to their superior characteristics.6,7 The actual mechanism of working lies in the formation of layers of opposing charges, at the interface between the electrode and the electrolyte, upon polarisation. In the case of supercapacitors, the opposing layers are more closer and the distance between them is in the range of atomic distance, thereby yielding more energy density and high power than capacitors.8–10
Supercapacitors generally have two electrodes, which are separated from each other by means of a non-conductive separator.11–13 The electrodes are ionically connected through electrolytes which include aqueous electrolytes, solid state electrolytes and organic electrolytes. Aqueous electrolytes such as H2SO4, KOH, etc. offer high capacitance and power density. However, their low voltage window restricts the attainment of high energy density.14,15 This can be overcome by the use of organic electrolytes, which have a higher voltage window, but their use is generally associated with environmental problems.16 Solid state electrolytes include polymeric gels, which can minimize the leakage issues.17
The electrolyte plays a crucial role in transferring and balancing charges between two electrodes. By changing the cationic species in aqueous electrolytes, we can modulate the specific capacitance of the electrode.18 Various parameters such as ionic mobility, hydrated cationic radius and conductivity affect the specific capacitance. Higher conductivity and ionic mobility help in fast charge transfer and a smaller hydration sphere radius also offers more ion adsorption at the electrode/electrolyte interface to further facilitate the Faraday reaction.19 Due to the highest conductivity and ionic mobility, among the aqueous electrolytes, supercapacitor electrodes with HCl electrolyte exhibit the highest specific capacitance.20 Significant variation in specific capacitance has been observed by changing the anionic species of aqueous electrolytes as well.20 A schematic representation of the reaction mechanism between an alkaline electrolyte (KOH) and a representative electrode is shown in Fig. 2.
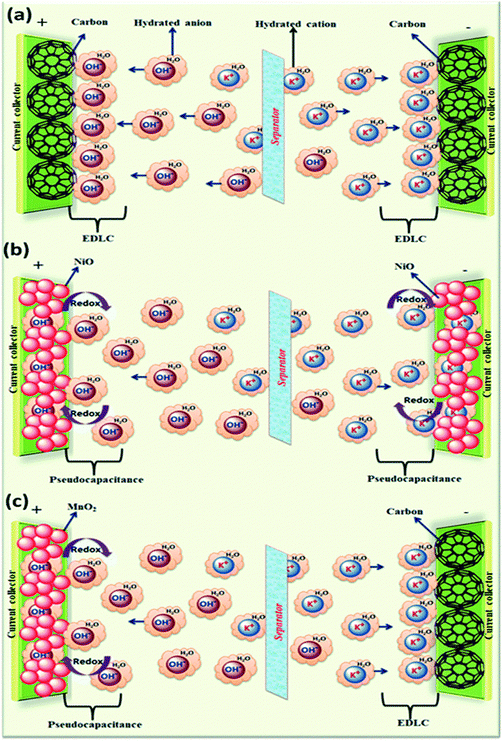 | ||
| Fig. 2 A schematic representation of the reaction mechanism between an alkaline electrolyte (KOH) and a representative electrode: (a) electrical double layer capacitor, (b) pseudocapacitor, and (c) hybrid supercapacitor; reprinted with permission from ref. 20; copyright © Royal Society of Chemistry. | ||
The specific capacitance of an electrical double layer capacitor depends on the specific surface area as well as pore size distribution of its electrode.20 The properties of organic electrolytes such as the size of anionic and cationic species and ion–solvent interactions are crucial in determining the overall performance of the system. In order to maximize the specific capacitance, the size of electrolyte ions should match the pore size of the electrode to allow easy movement of electrolyte ions in and out of the electrodes. In addition to this, the size of bare and solvated ions should also be considered. It has also been observed that pores with a size close to the size of desolvated ions could increase the specific capacitance.
Based on the mechanism of energy storage, there are two types of supercapacitors, viz., electric double layer supercapacitors and pseudocapacitors.17,21–23 In the case of electric double layer supercapacitors, the charge accumulation occurs on the electrode surface and thus stores energy electrostatically, whereas for pseudocapacitors, the faradaic electrochemical reaction between the electrode and the electrolyte produces capacitance.
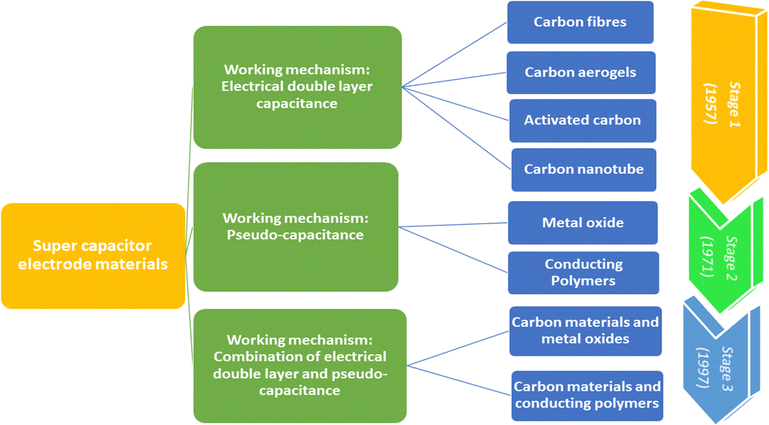
Fig. 3 shows the taxonomy and timeline of supercapacitor materials. During the initial stages, carbon nanomaterials were extensively used for supercapacitor electrode fabrication. They exhibit stable electrical double layer capacitance, owing to their excellent conductivity, high specific area and cyclic stability.24,25 The electrical double layer capacitance depends upon the specific area and capacitance of the material. Generally, the specific capacitance of carbon materials varies from 5 μF cm−2 (for carbon black) to 35 μF cm−2 (for graphite).26 However, it is very difficult to attain the theoretical capacitance value since it depends on the pre-treatment conditions and pore accessibility. The conductivity and stability of carbon nanomaterials decrease with the decrease in surface area, because of the loss of mechanical integrity since the material becomes highly porous.27 Second stage supercapacitor electrode materials involve various metal oxides/hydroxides such as those of cobalt, nickel, manganese, and ruthenium and conducting polymers. They exhibit reversible redox reactions, giving rise to pseudocapacitance. Ruthenium oxides shows a specific capacitance of 1000 F g−1; however, high cost limits their applications.28 The third category includes a combination of carbon–various metal oxides and conducting polymer–carbon materials.9
Electric charge for the electrode process is a function of potential, which further depends on the activity of the oxidised species. Conducting polymers are very active candidates for pseudocapacitive energy storage. Electrons are released upon charging the conducting polymers and they become electron deficient (polycations), and thereby pull oppositely charged ions (i.e. negatively charged) from the electrolytes to maintain the charge neutrality29,30 as shown in Fig. 4(A).
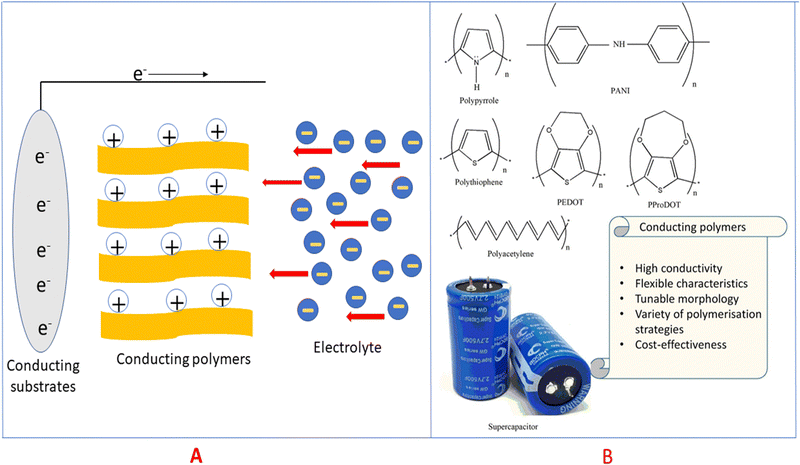 | ||
| Fig. 4 (A) Mechanism of pseudocapacitance in conducting polymers. (B) Structures of some conducting polymers employed for energy storage applications. | ||
Since the electrochemical process takes place both on the surface and in the bulk of the electrode, it can store a greater extent of charge. However, the major issues associated with conducting polymers are, they are prone to rapid degradation, owing to the loss of mechanical integrity during the charging/discharging cycle.31,32 The shrinkage/swelling of the polymer causes device failure. Also, during the electrode preparation, they tend to agglomerate and sometimes get detached from the current collector.33 So, in order to address these issues, conducting polymers are often combined with some other materials to obtain a conducting polymer nanocomposite. By doing so, electrodes with good cyclic stability and high capacitance can be achieved.34–36 Hence this review discusses the recent developments in conducting polymer/carbon nanocomposites for energy storage applications. The strength and limitations of currently employed polymer nanocomposites have been discussed. The current challenges and future perspectives have been commented.
2. Conducting polymers for energy storage
Conducting polymers are organic polymers having high electrical conductivity (usually 103 S cm−1), excellent processability, flexibility, durability, tunable morphology and reactivity towards many other materials, which make them ideal candidates for electrode material fabrication.37–39Fig. 4(B) depicts conducting polymers having different functional groups, employed for energy storage purpose, and the characteristic features of these conducting polymers are also listed. Many conducting polymers namely polyaniline (PANI),40–42 polythiophene (PT),43–45 poly(3,4-ethylene dioxythiophene) (PEDOT),46–48 poly(3,4-propylene dioxythiophene) (PProDOT)49,50 and polypyrrole51–53 have been commonly used for fabricating electrodes, owing to the easiness in synthesis and high conductivity. It has been demonstrated that the solubility and conductivity can be fine-tuned by varying the structure of the polymers.54 The physico-chemical features, viz., the extent of cross-linking, miscibility and chemical stability, can also be modulated by tuning the structures for desired applications.55 Among the variety of conducting polymers, heterocyclic conducting polymers have gained considerable attention, owing to their good stability and easy handling, in addition to their high conductivity.56,57 The cyclic stability of conducting polymers can be improved by microstructural control.58Compared to carbon-based electrodes, conducting polymers have high current density. For example, PANI supercapacitors have a specific energy of 10 W h kg−1, whereas for carbon-based electrodes, it is 3–5 W h kg−1.59 In a packaged cell, the performance is closely related to whether it is a two electrode or three electrode system. In a three-electrode system, the electrodes are the working electrode, counter electrode and reference electrode. The potential range of the working electrode in a three electrode configuration is twice that in a two electrode system. Therefore, capacitance will be doubled. Supercapacitors with two electrodes give more accurate results of capacitance, and large errors have been observed in the capacitance using three electrode configurations.60
Even though pseudocapacitors possess excellent specific capacitance, ion transport is slowed down due to the faradaic process leading to a decrease in power, in comparison with electrical double layer capacitors.61 The charge transfer kinetics of the electrodes is influenced by the conductivity of the pseudocapacitor. In order to achieve excellent conductivity and capacitance, the polymer should have charge carriers, considerable charge mobility and sufficient solvated counter ions.62,63 Charge carrier concentration can be increased by doping. There are two types of doping, i.e. n type and p type doping. In the n-type doping, an electron is added to the conduction band (reduction), and in the p-type doping, an electron is removed from the valence band (oxidation). Eqn (1) and (2) represent n type and p type doping in a conducting polymer (CP):64
| CP + nRed → (C+)nCPn− + nRed+ | (1) |
| CP + nOx → CPn+ (A−)n + nOx− | (2) |
Conducting polymers contain SP2 hybridised carbon atoms. They undergo Jahn–Teller relaxation or otherwise Peierls distortion, causing segregation between the occupied and the unoccupied portion of the SP2 band.67 Graphene also shows a band gap, but only in the presence of induced distortions.68 The addition of new energy levels by doping increases the conductivity of the polymers. For example, in the case of polypyrrole, if p-type doping is done, a di-cation is formed by the removal of two electrons from the chain. When the doping reaches a saturation value, more and more di-cationic states are produced and result in the overlapping of these energy bands to form an intermediate band structure which facilitates electron transport within the polymer chain.69 This is depicted in Fig. 5.
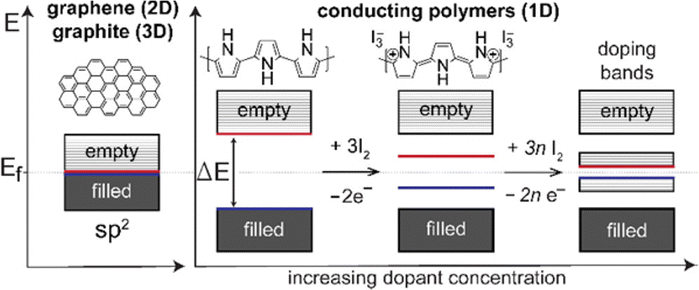 | ||
| Fig. 5 Band structures of conducting polymers; reprinted with permission from ref. 69; copyright © American Chemical Society. | ||
Usually, the doping limit of conducting polymers has been observed to be less than 1 dopant per polymer unit. The doping range depends on the counter ion and synthetic conditions and it has been identified from the closeness in the spacing of the charge island.64 For polypyrrole, XPES studies have shown that maximum conductivity is achieved with a doping of 32.8%.70
Carrier mobility is an important factor determining the conductivity. In the case of conducting polymers, SP2 hybridised carbon facilitates smooth chain mobility and develops a delocalised π system along the polymer chain through which charge carriers can move very freely. Conjugation encourages π–π* stacking between the polymer chains and facilitates charge mobility.71,72 Conductivity of the conducting polymers cannot be explained by classical doping theory.73 Doping of an organic polymer to achieve certain metallic properties is phenomenologically similar to the doping of a classical inorganic semiconductor. However, the doping mechanism of organic polymers involves partial oxidation/reduction of the polymer, and each oxidation state exhibits its characteristic reduction potential.73 The role of the dopant is not only to withdraw electrons from the conducting polymer, but also to add electrons to the conducting polymer backbone. The oxidation/reduction creates charge carriers such as polarons (radical ions) and bipolarons (dication/dianion) in the polymer. Movement of these charge carriers creates electricity.
The undoped PEDOT has a band gap of 1.6 eV. In the case of tosylate doped PEDOT, there is a shifting of the Fermi level into the valence band as indicated from ultraviolet photoelectron spectroscopy. A doping efficiency of 20.6% and 42% has been observed for lightly and heavily tosylate doped PEDOT respectively.74
While comparing the energy storage devices, two terms have been widely used. They are specific energy and specific power. The total amount of energy that a device can store with respect to device mass is known as specific energy. The term specific power means how rapidly the charge can be stored and distributed (charging rate). When the specific power increases, the amount of energy stored decreases, owing to the kinetics of redox reactions and ion transport occurring at the electrode. Electric energy is not fully converted into charge stored and some portion of the energy is lost as heat. A decrease in specific power causes the amount of energy stored to be increased.69
The maximum energy stored in a capacitor is evaluated using the expression75
 | (3) |
The maximum power output has been calculated as75
 | (4) |
So, in order to attain maximum energy density and power density, the voltage window of the device and the capacitance of each electrode should be maximised, and the equivalent series resistance should be minimised.
There are 4 different types of conducting polymer pseudocapacitors based on the selection of positive and negative materials as indicated by Fig. 6.69 The type 1 [Fig. 6(a)] category consists of two similar p-dopable polymers. During the charging cycle, the positive electrode becomes fully doped and the negative electrode is neutral. When the type 1 pseudocapacitor is fully discharged, both electrodes become half p doped, because of the equal charging–discharging rate. This category has comparatively lower energy density. The type 2 [Fig. 6(b)] category consists of two different p-type polymers having a different voltage window. The polymer with a higher voltage window acts as a positive electrode and that with a lower voltage window acts as a negative electrode. During complete charging, doping of the positive electrode takes place and the negative electrode remains neutral. When the pseudocapacitor is completely discharged, more than half of the stored charge gets transferred from the positive electrode to the negative electrode. The type 2 category has higher energy density than type 1.
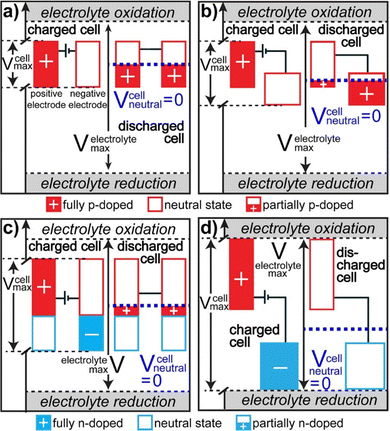 | ||
| Fig. 6 Potential diagrams of fully charged and discharged states; reprinted with permission from ref. 69; copyright © American Chemical Society. | ||
In the type 3 category, a combination of p and n type polymers (identical) has been used. When the type 3 pseudocapacitor is fully charged, the positive electrode is completely p-doped and the negative electrode is completely n-doped. During complete discharging, both the electrodes are having an equal charge/discharge ratio and are slightly p doped as represented by Fig. 6(c). Type 3 has higher energy density than Type 1 and Type 2. In the type 4 category, both the polymers are having different voltage windows with p-type polymers as the positive electrode and n type polymers as the negative electrode [Fig. 6(d)]. During complete charging, the positive electrode is completely p-doped and the negative electrode is n-doped. After discharge, both the electrodes remain neutral and this category has the highest energy density among the four types.76
In order to undergo fast redox reactions and counter balance the charge generated on the polymer electrode, the counter ions must be able to intercalate and deintercalate during charging/discharging cycles.77 The factors influencing the fast kinetics include high conductivity and low internal resistance. The polymer chain length has an impact on mobility, as with the increase in the chain length the extent of conjugation increases and π–π* stacking also increases.72 A charge carrier moving along the isolated polymer backbone can travel a distance not exceeding the average end to end distance of a macromolecule expressed by  .78 For a freely joined chain,
  can be determined from the product of its segment length (l) and segment number (n):
 | (5) |
 depends on the contour length of the polymer chain (can be calculated by multiplying the number of monomers in the chain and the distance between them) and is directly related to the degree of polymerisation.78 Hopping also gets minimised by controlling the chain length.79
Reports reveal that aligned polymer chains produce enhanced conductivity in crystalline, spun or mechanically stretched systems.80 Branching, cross linking and chain inhomogeneity lead to poor conductivity and capacitance.81 Control of the pore structure is a promising strategy to induce high surface area and facile kinetics;82 for example, porous PANI has higher capacitance than solid PANI.83 Compounds such as benzoyl peroxide, azoisobutyronitrile and ammonium bicarbonate are prone to thermal degradation and can be added to conducting polymers as porogens, to create porosity and high surface area.
Cyclic stability of the devices is very crucial in determining the performance, since they undergo a series of charging–discharging cycles. Adhesion of the polymer onto the current collector causes a reduction in cyclic stability.84 Electrolytes also influence the cyclic stability.85,86 For aqueous electrolytes, the voltage window selected is less than 1 V, because at low and high voltage hydrogen and oxygen evolution occur, causing device failure. Smaller electrolyte ions offer a longer lifetime as evidenced from PPy, with 92% retention of the initial capacitance. Continuous movements of ions cause swelling of the polymer chains and destroy the charge storage capacity.
Various polymerisation strategies such as electrochemical polymerisation (ECP), solid state polymerisation (SSP), solution processable polymerisation (SPP), emulsion polymerisation (EP) and vapour phase polymerisation (VPP) have been used to synthesise heterocyclic polymers. The polymerisation can be controlled in the ECP strategy; however the electrical conductivity of the polymer formed will be low in comparison with other strategies.87 ECP requires highly conducting electrodes, so the application is limited. SSP is simple and it involves heating of the monomers. It is not suitable to obtain homogeneous films, because the crystallised monomers cannot be converted into a film form.88 The VPP strategy ensures the formation of thin films with high electrical conductivity, but requires complex processing conditions and also produces toxic vapours of the monomer.89 SPP has been reported to be a more effective method for coating onto a larger area.90
EP is a free radical polymerisation in which a monomer or mixture of monomers are polymerised in an aqueous solution to form a latex.91 The extensive use of emulsion polymerisation is due to the ease of removal of heat of polymerisation, low viscosity of the latex at high polymer concentration and control of submicron particle size and morphology.92 In addition to these, higher rates of polymerisation and higher molecular weight polymers can be achieved in comparison to other methods of free radical polymerisation. EP can be carried out as a batch, semibatch and continuous process.92 The choice of the method depends on the desired properties of the final polymer/dispersion and on the product economy.
In the batch emulsion polymerisation, all the reactants are added to the reactor at the outset. Initially, the monomer emulsion is prepared and heated to the reaction temperature, followed by the addition of the initiator into the monomer to start polymerisation. In the semibatch strategy, some of the reactants are added at the starting and the remaining are fed in a controlled way. In the continuous process, the components are fed continuously into the reactor system from which the product is continuously removed. The purity of the end product is a challenging factor in the EP strategy.92
Even though every method has unique advantages, they cannot be fully employed for the bulk production.
Fig. 7 shows a schematic representation of the mechanism of pyrrole polymerisation via the SPP strategy, in the presence of acids to form polypyrrole, an important member of the conducting polymer family. Protonation by the acid takes place at the alpha (α), beta (β) and N positions, aromaticity is lost and a radical cation is formed.69 The radical cation may then react with monomers to form polypyrrole as shown in Fig. 7.
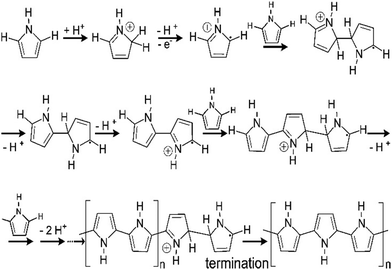 | ||
| Fig. 7 Mechanism of polymerisation of pyrrole; reprinted with permission from ref. 69; copyright © American Chemical Society. | ||
It has been reported that compared to virgin conducting polymers, their composites exhibit excellent energy storage characteristics. This is attributed to the mutual synergistic effect of both the partners, i.e., the conducting polymer and the nanoparticles.93,94 For example, inorganic materials usually possess high capacitance, but suffer from poor cyclic stability and electrical conductivity and hence cannot meet the requirements for commercial applications.95 The combined advantages of both inorganic materials and conducting polymers generates a system with desired electrical conductivity and plasticity. It has been shown that the nanocomposite electrodes are superior in performance, in comparison with individual electrodes.96,97
3. Conducting polymer nanocomposites based on carbon nanomaterials
Carbon nanomaterials such as graphene, graphene derivatives, carbon nanotubes, diamond and fullerenes have gained considerable attention of researchers owing to their applications in various sectors such as in automobiles, energy storage, electronics, aerospace engineering, and biomedicine.98–101 Due to high surface area, excellent conductivity and mechanical properties, they can be employed as electrode materials. Besides, high capacitance can be obtained upon composite fabrication with conducting polymers. Incorporation of different nano-architectured carbon materials (1D, 2D and 3D) into conducting polymer matrices has a positive impact on energy storage characteristics. Fig. 8 shows the images of carbon nanostructures in different dimensions.102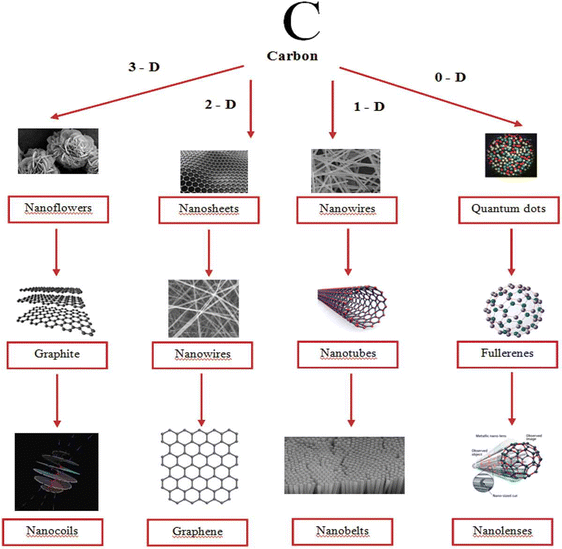 | ||
| Fig. 8 Carbon nanostructures in different dimensions; reprinted with permission from ref. 102; copyright © Taylor and Francis Group. | ||
The characteristics of carbon-based conducting polymer nanocomposites can be fine-tuned by careful control of the synthesis strategy. In order to improve the dispersion of nanomaterials in the polymer matrix and to ensure interfacial interactions, the surface of carbon nanomaterials is often modified via covalent/non-covalent strategies.103–105 The non-covalent methods comprise of physical adsorption or wrapping onto the nanomaterial surface. Since this interaction is weak, effective stress transfer will be low. In the covalent strategy, a chemical bond is formed between the polymer and the nanomaterial, leading to excellent interfacial interactions among the partners. The interaction may disrupt the conjugation, but modifies the properties.
The most common synthesis strategies to develop conducting polymer carbon nanocomposites include chemical and electrochemical methods.106–108 In the chemical method, it is easy to scale up the amount of nanocomposites formed, which increases according to a fixed ratio, while in the electrochemical methods, the amount of nanocomposites formed depends on the electrode characteristics where the polarization takes place.109 In addition to these methods, some other strategies such as physical mixing, electrospinning and layer by layer assembly have also been employed.110–112 The chemical methods involve the oxidation of monomers by oxidising agents such as K2Cr2O7, FeCl3, Fe(OTs)3 and (NH4)2S2O8. Bulk production is possible by this strategy and is preferred in industries. Compared with other routes, the nanocomposites formed by chemical polymerisation methods have been found to be non-homogeneous and exhibit lower conductivity.113 Sometimes, there are chances for polymerisation to occur within the porous structures of carbon nanomaterials and hence suppress further reaction between the radical cations owing to the hindrance to diffusion, resulting in the formation of ramified chains of polymers. To solve this issue, initially monomers are adsorbed, to ensure suitable diffusion of oxidising agents. In view of this, several polymer nanocomposites based on conducting polymers and carbon nanomaterials were synthesised via the chemical polymerisation strategy.
In the following section, a detailed description of conducting polymer/carbon nanomaterial nanocomposites is given.
3.1. Conducting polymer/carbon nanotube (CNT) nanocomposites
CNTs have fascinating porous structures with excellent mechanical and chemical steadiness and mesopores which allows a constant charge circulation.114 Oxidised single walled carbon nanotubes (SWCNTs) having an electrical conductivity of 100–1000 S cm−1 have been shown to be promising candidates for supercapacitors and Li-ion batteries.115 Owing to their excellent electrical characteristics and highly available exterior area, CNTs have proved to be a valuable power conducting material.116,117 Many approaches for the development of CNT based conducting polymer nanocomposites have been put forward. The major issue associated with CNTs is their tendency to form aggregates within the polymer matrix.118,119 To prevent this, oxidative polymerisation has been carried out in situ in the presence of CNTs. Ultrasonication during the polymerisation offers a homogeneous dispersion of CNTs in the medium and also prevents coagulation.120 In an interesting work, oxidative polymerisation of aniline has been carried out in the presence of CNTs, resulting in the formation of a homogeneous coating of PANI onto the CNT surface.121 The interaction between the aromatic rings of CNTs and π–π interactions among the quinoid groups of PANI enhance the transport of electrons and thereby the electrical performance of the nanocomposites.In another work, a conjugated poly acid diphenylamine-2-carboxylic acid (DPAC) has been polymerised onto SWCNTs in acidic and basic media.122 The morphology, thermal stability and electrical conductivity of the nanocomposites have been investigated in terms of the solution pH and the concentration of SWCNTs. The nanocomposites have been shown to exhibit excellent electrical conductivity and thermal stability suitable for supercapacitor applications. Fig. 9 represents the frequency dependence on the conductivity of PDPAC/SWCNT nanocomposites. It has been shown that, PDPAC-1 exhibits a linear relationship between conductivity and frequency, a characteristic of non-conducting materials. For 3 wt% SWCNT/PDPAC-1 nanocomposites, the conductivity increases gradually with frequency, from 1.9 × 10⁻¹⁰ to 1.8 × 10⁻⁶ S cm−1. The frequency dependence of conductivity can be explained by the hopping mechanism of charge transfer.123 As the SWCNT loading increases to 10 wt%, the frequency dependence of conductivity is considerably less, owing to the attainment of percolation threshold. The same trend is observed for 10 wt% SWCNT-PDPAC-2 nanocomposites also (PDPAC 1: synthesised via oxidative polymerisation in an alkaline medium; PDPAC 2: synthesised via oxidative polymerisation in an acidic medium).
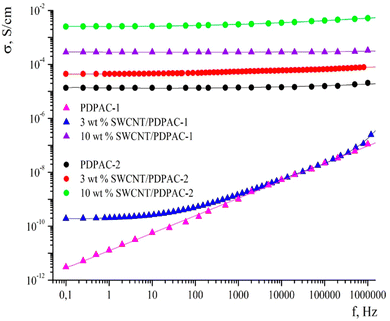 | ||
| Fig. 9 Frequency dependence of conductivity for PDPAC and SWCNT/PDPAC nanocomposites; reprinted with permission from ref. 122; copyright © MDPI. | ||
At lower frequency, 3 wt% SWCNT/PDPAC-2 nanocomposites exhibit higher conductivity than 3 wt% SWCNT/PDPAC-1 systems. This might be due to the doping of polymer nanocomposites in the acidic medium, making the former to attain higher conductivity.
In a recent work, polyacrylamide–alginate hydrogels have been made into a composite with multiwalled carbon nanotubes (MWCNTs) to fabricate durable and flexible electrodes.124 As the MWCNT content increases, the mechanical properties, thermal stability and electrical conductivity of the nanocomposites increase, and MWCNT concentration of 2.8% was found to be the optimum amount. At the highest nanotube content, the nanocomposites showed interfacial double layer capacitance, indicating the possibility of utilisation of the developed nanocomposites for energy storage applications. In comparison with pure hydrogels, the MWCNT loaded hydrogels exhibited enhanced total conductivity upon elongation. Thus, it can be shown that the MWCNT increases the total conductivity of the hydrogels under mechanical deformation. Impedance spectroscopy revealed that the resistance of the electrodes shows a decreasing trend with the increase in the MWCNT component upon elongation. However, bending and twisting do not change the conductivity. The conductivity range observed was 1–4 × 10⁻² S cm−1. The tensile strength and rigidity of the nanocomposites were higher than those of the virgin hydrogels. The interaction between MWCNT surfaces and acrylamide results in improved mechanical and electrical characteristics.
Polyimide/MWCNT nanocomposites have been fabricated via imidization reaction. The synthesis strategy is shown in Fig. 10.125 A two-step reaction using perylene 3,4,9,10-tetracarboxylic dianhydride (PTCDA) and diamino propane (DAP) has been used to obtain PI/MWCNT nanocomposites. The MWCNT acts as a conductive channel to maximize the utilisation of active materials in the electrode. Electrospun polyacrylonitrile nanofibrous membrane networks having excellent ionic conductivity have been used as a gel polymer electrolyte. The PI/MWCNT nanocomposite cathode in combination with gel polymer electrolytes can be used for sodium ion batteries, having a life span of 3000 cycles and stable cyclic performance. The stability of the gel polymer electrolyte has been determined from the electrochemical stability window. An anodic stability of 5.1 V was observed for the gel polymer electrolyte.
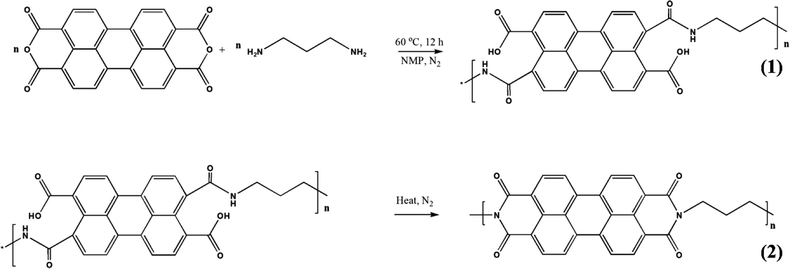 | ||
| Fig. 10 Synthesis strategy for the synthesis of polyimide/MWCNT; reprinted with permission from ref. 125; copyright © American Chemical Society. | ||
Chen et al. reported the synthesis of flexible PANI/SWCNT nanocomposites by an in situ electrochemical polymerisation method.126 The effective deposition of PANI onto SWCNT surfaces and tunable morphology can be achieved by electrical polymerisation. Here, the SWCNT acts as a ‘skeleton’ and PANI as a ‘skin.’ The authors measured the performance of two electrode SWCNT/PANI nanocomposite supercapacitors. SWCNT/PANI systems were sandwiched between PET and a separator. The supercapacitor characteristics were studied by cyclic voltammetry (CV). Rectangular shaped CV plots were obtained for SWCNT films, suggesting SWCNTs to be an electrical double layer capacitor material. However, SWCNT/PANI films possessed a large area CV curve compared to the neat SWCNT, indicating higher specific capacitance of hybrid films, owing to the contributions from pseudocapacitance. In addition to this, SWCNT/PANI nanocomposites having a deposition time of 30 seconds had higher CV area than other nanocomposites, indicating that 30 seconds is the optimum deposition time. The shape of the CV curve remained the same if the scan rate was increased, which is an indication of the rapid current response of the nanocomposites on voltage reversal.
In order to ensure stable electrochemical performance and a wide electrochemical window, the voltage used was in between 0 and 2 V. The specific capacitance Cspec of the systems was evaluated from the current charge–discharge curve by using the expression126
 | (6) |
Literature reports reveal that the nanotubes with random arrangements in the conducting polymeric matrix have a synergistic influence on the capacitance. Also, the ordered arrangements of nanotubes considerably enhance the electrochemical features.127 Zang et al. demonstrated the fabrication of aligned nanotube/conducting polymer nanocomposites and reported that the supercapacitor had exhibited a wide operation voltage of 4 V, having a maximum energy and power density of 83 W h L−1 and 130 kW L−1 respectively.128
PANI/MWCNT nanocomposites have been fabricated via in situ polymerisation at room temperature.129 The synthesis condition has a strong influence on the molecular conformation and degree of order of PANI. At lower temperature, there is an ordered arrangement of the chain segments in PANI/MWCNT systems which leads to a change in conductivity behaviour from semiconductor to metallic, and the conductivity becomes doubled. Zang et al. reported the fabrication of PANI/CNT/ethylene vinyl acetate (EVA) supercapacitor electrodes having excellent conductivity (19.5 S cm−1), flexibility and mechanical properties (tensile strength 23 MPa).130 Initially, the CNT/EVA system was dipped in an ethanol/aniline hydrochloride mixture and allowed to evaporate ethanol. The aniline hydrochloride that remains in the system acts as the working electrode. PANI networks have been obtained via the cyclic voltammetric technique by incorporating the working electrode in a three-electrode cell assembly. An areal capacitance of 575 mF cm−2 and a specific capacitance of 1105 F g−1 have been obtained. Interestingly, the nanocomposite electrode exhibited a cyclic stability of 45![[thin space (1/6-em)]](https://www.rsc.org/images/entities/char_2009.gif) 000 cycles.
000 cycles.
3-D nanoarchitectured electrodes with excellent porosity, good ion diffusion, excellent mechanical properties and high electrical conductivity have been fabricated131 by using CNTs. The plasma enhanced chemical vapour deposition (PECVD) strategy has been employed to synthesise vertically aligned CNTs directly on a CNT substrate consisting of horizontally aligned CNTs. The strategy shall produce free standing structures in which CNT sheets act as both substrate and current collector. The array of CNTs contributes to higher surface area and porosity to the electrode. PANI is then coated onto the substrate electrode via the electrodeposition process. Controlled deposition of PANI onto the substrate was achieved via creation of the CNT/PANI core–shell architecture, which allows rapid charge transfer between PANI and electrode. Fig. 11 demonstrates the tip growth mechanism, with catalyst particles trapped at the tip of CNTs having an average tube diameter of 40 nm. The SEM images of CNTs coated with an increasing amount of PANI after 10, 20, 30, 40 and 50 cycles of CV are shown in Fig. 12(a–e). When the number of cycles of CV is small, a thin coating of PANI is formed on the CNT. As the number of CV cycles increases, the thickness of PANI coating formed also increases, indicated by the increase in the diameter of nanotube like structures. At 40 and 50 cycles of CV, a network of PANI nanowires on the top of the PANI coated CNT array is formed. Fig. 12(f) shows the SEM image of coating of PANI after 30 cycles of CV onto the pristine CNT (without CNT arrays). The PANI nanowire network has been seen to grow directly onto the CNT sheet surface. PANI/CNT electrodes with 56 wt% PANI content possess a gravimetric capacitance of 359 F g−1 at 1.56 mA cm−2 current density. When the current density is increased 30-fold, the electrodes retain 82% of the original capacitance. A symmetric supercapacitor has been fabricated by using the PVA/H2SO4 hydrogel as an electrolyte. The flexible PANI/CNT supercapacitor electrodes exhibited a specific capacitance of 128 F g−1 at a current density of 2.47 A g−1 and retained 92% of the initial capacitance after 10![[thin space (1/6-em)]](https://www.rsc.org/images/entities/char_2009.gif) 000 charging/discharging cycles at a current density of 24.7 A g−1.
000 charging/discharging cycles at a current density of 24.7 A g−1.
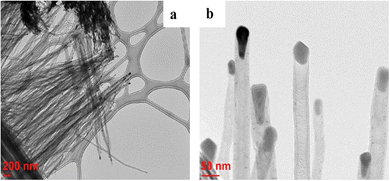 | ||
| Fig. 11 TEM images of CNTs grown on the CNT sheet by PECVD; reprinted with permission from ref. 131; copyright © Elsevier. | ||
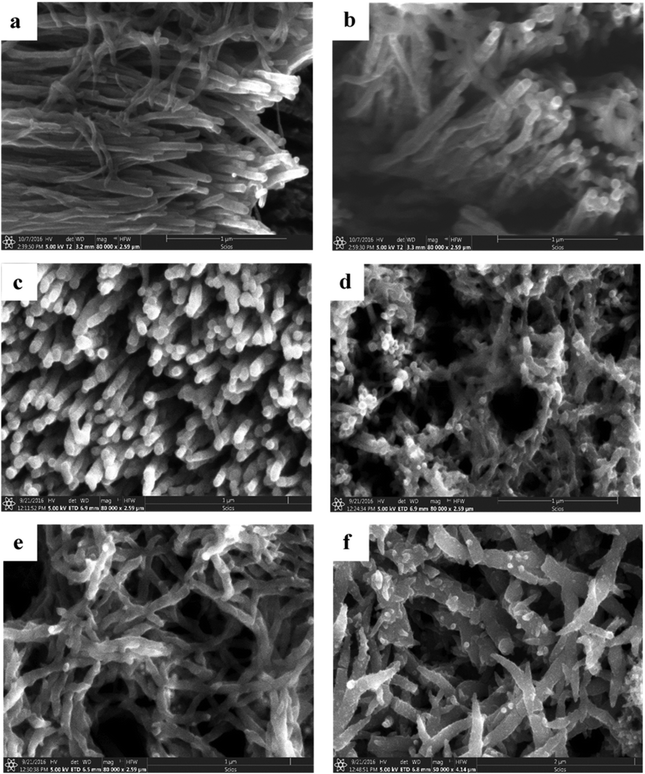 | ||
| Fig. 12 (a–e) SEM images of PANI/CNT after 10, 20, 30, 40 and 50 cycles of PANI deposition. (f) SEM image of the PANI/pristine CNT sheet after 30 cycles of PANI deposition; reprinted with permission from ref. 131; copyright © Elsevier. | ||
Lin et al. reported the fabrication of PANI/MWCNT nanocomposites via the electrodeposition process.132 The conducting films have been found to be very apt for the development of flexible, transparent supercapacitor electrodes, having a maximum specific capacitance of 233 F g−1 at 1 A g−1 current density. The specific capacitance of the nanocomposite electrode is 32 times that of MWCNTs and 23 times that of PANI. The developed nanocomposite films were highly flexible as shown by Fig. 13(a) and can be bent many times without any decrease in structural stability as indicated by SEM analysis. Fig. 13(b) shows the variation of specific capacitance with the bending angle, from 0 to 180°. As the bending angle increases, the specific capacitance remains almost unchanged. The ratio of specific capacitance before and after different bending cycles (C/C0) is shown in Fig. 13(c). After 50 cycles of bending, less than 8% reduction in C/C0 values occurs. The variation of specific capacitance with current density is presented in Fig. 13(d). The aligned CNT/PANI nanocomposites possess higher specific capacitance than randomly dispersed CNT/PANI films.
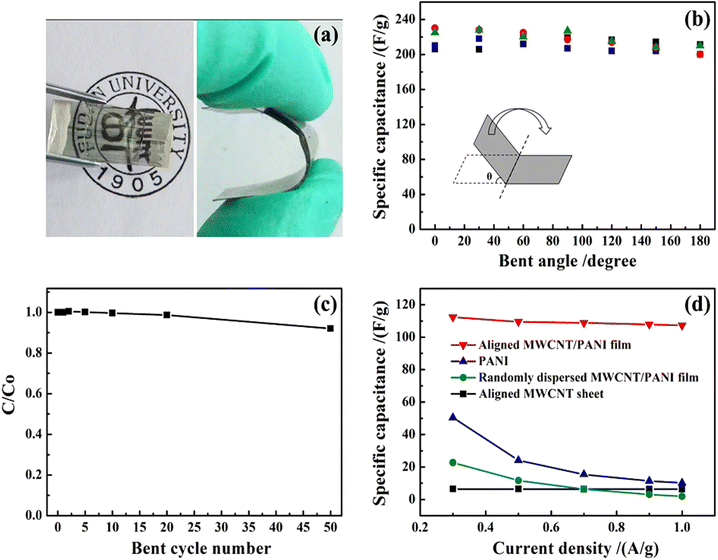 | ||
| Fig. 13 (a) A typical PANI/multiwalled CNT flexible nanocomposite film.(b) Variation of specific capacitance with the bending angle. (c) Dependence of the ratio of specific capacitance of the system before and after bending versus the bending cycle number. (d) Variation of specific capacitance with current density; reprinted with permission from ref. 132; copyright © Springer Nature. | ||
Porous PANI/CNT nanocomposites have been prepared by grafting PANI onto CNTs, followed by creation of interpenetrating porous structures by using CaCO3 as a template.133 The porous structures provide sufficient channels for ion transport and hence improve the capacitive performance. A schematic representation of the synthesis strategy is provided in Fig. 14. The optimized nanocomposites exhibited a capacitance of 1266 F g−1 at 1 A g−1 current density. When the current density reached as high as 128 A g−1, then also the specific capacitance attained a high value, i.e. 864 F g−1. After 10![[thin space (1/6-em)]](https://www.rsc.org/images/entities/char_2009.gif) 000 charging/discharging cycles, 83% of the initial capacitance was retained. The band gap of the system was determined from CV and it was observed that the optimized nanocomposite PANI/CNT-30 has a lower band gap than PANI. This is owing to the extended conjugation length of the PANI/CNT system.134 The porous PANI/CNT system possesses an even lower band gap, attributed to the extended conjugation length caused by the acid etching process in the preparation of the porous nanocomposite. Since pores and H+ transport channels are created in the porous structure, the PANI chains deep inside can take part in the redox reaction easily; thus compared with PANI and PANI/CNT systems, porous PANI/CNT-30 has more active PANI units and produces larger area enclosed in the CV plot. Further, the area in the CV curve increases with the increase in the scan rate from 5 mV s−1 to 100 mV s−1. The peak current also increases with the scan rate, indicating rapid charge propagation.
000 charging/discharging cycles, 83% of the initial capacitance was retained. The band gap of the system was determined from CV and it was observed that the optimized nanocomposite PANI/CNT-30 has a lower band gap than PANI. This is owing to the extended conjugation length of the PANI/CNT system.134 The porous PANI/CNT system possesses an even lower band gap, attributed to the extended conjugation length caused by the acid etching process in the preparation of the porous nanocomposite. Since pores and H+ transport channels are created in the porous structure, the PANI chains deep inside can take part in the redox reaction easily; thus compared with PANI and PANI/CNT systems, porous PANI/CNT-30 has more active PANI units and produces larger area enclosed in the CV plot. Further, the area in the CV curve increases with the increase in the scan rate from 5 mV s−1 to 100 mV s−1. The peak current also increases with the scan rate, indicating rapid charge propagation.
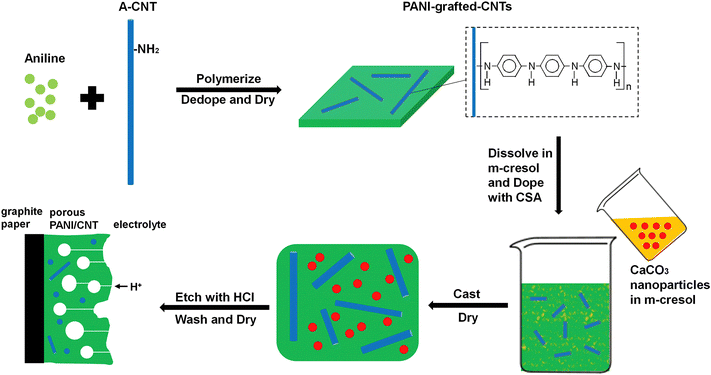 | ||
| Fig. 14 Schematic representation of synthesis of porous PANI/CNT electrodes; reprinted with permission from ref. 133; copyright © Elsevier. | ||
The improved delocalisation of electrons caused by grafting PANI onto CNTs reduces the oxidation potential of grafted PANI and the etching process by acids removes a substantial amount of ungrafted PANI. This enhances the oxidation of PANI, reduces the voltage loss across the material and allows a more even application of the potential, and hence favours long term stability of the capacitor.
Core–shell nanocomposites based on PANI and various forms of CNTs such as multiwalled CNTs (MWCNTs) [PAM], carboxylic acid functionalised CNTs [PACM] and amine functionalised CNTs have been synthesised [PANM] via in situ oxidation by ammonium persulphate.134 A strong interaction between the CNT core and the PANI shell has been observed for PAM and PACM systems; however the interaction is week for PANM systems. All the core–shell structured nanocomposites prepared exhibited better electrochemical properties than PANI. The highest specific capacitance was exhibited by PAM electrodes (647 F g−1) which also showed 98% capacitance retention and 100% coulombic efficiency after 5000 charging/discharging cycles. Both electron and ion transport are improved in the PAM system due to the porous nature and good bonding between the PANI shell and the CNT core compared to PACM and PANM systems. The symmetric device delivered a maximum energy density of 37 W h kg−1 at a power density of 166 W kg−1.
In an interesting work, the chemical vapour deposition (CVD) strategy has been used to develop PEDOT/CNT nanocomposites.135 The morphology of the system has been evaluated with respect to CVD time. The specific capacitance and efficiency of the cells were examined to find out the charge storage features. The morphology of PEDOT/CNT is depicted in Fig. 15. From the SEM images one can see the well aligned morphology of the CNTs and the uniform surface coverage of PEDOT on the CNT surface. The difference in the contrast of CNT carbon and conducting polymer carbon chains is non-existent, so the CNT is invisible through the coatings in the TEM images. The specific capacitance of the nanocomposites shows a positive trend with the thickness of the PEDOT coatings. The experimental values have been found to be in exact match with the theoretical calculations, indicating a uniform distribution of the films deposited.
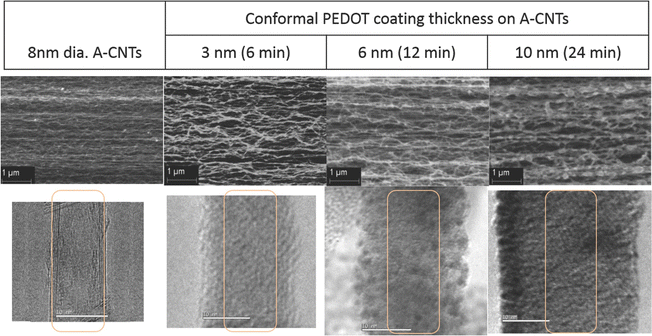 | ||
| Fig. 15 Morphology of PEDOT/CNT nanocomposites; reprinted with permission from ref. 135; copyright © Wiley Online Library. | ||
The specific capacitance also depends upon the scan rate, i.e. both are inversely related. This result is more significant for PEDOT coatings with higher thickness. At a low scan rate, i.e. the charging/discharging time is greater than 50 s, all the available sites take part in the charging/discharging cycle and contribute to specific capacitance. The energy density and power density of the nanocomposite system increase with the increase in the thickness of the PEDOT layer. The highest PEDOT thickness used in this study was 10 nm.
PEDOT/functionalised SWCNT nanocomposites along with certain dopants such as sodium dodecyl sulfate (SDS) and 1,2-dihydroxybenzene-3,5,disulfonic acid disodium salt hydrate have been fabricated and the electrical characteristics of the films are investigated.136 During the electropolymerisation process of synthesising PEDOT/functionalised CNT, the negatively charged functionalised CNT served as an anionic dopant. Compared to the neat polymer, the nanocomposite films exhibited enhanced electrochemical capacitance. By using these films, electrodes with better quality have been obtained. By the addition of dopants, the current response of the film gets decreased.
The effect of electrolyte pH on the capacitive performance of PEDOT/CNT systems was investigated.137 It was found that an acidic electrolyte (1 M H2SO4) is highly favourable to obtain higher capacitance (120 F g−1) whereas a basic electrolyte (6 M KOH) and an organic electrolyte produce a capacitance of 80 F g−1 and 60 F g−1 respectively. The effect of characteristic features of carbon materials such as porosity, surface area and void volume on the conductivity of the nanocomposites was examined.138 High porosity MWCNTs can provide a capacitance which is twice that of SWCNT nanocomposites.
Extensive research work has been carried on polypyrrole (PPy), to develop supercapacitor electrodes, owing to its high capacitance, environmental stability, wonderful mechanical properties and solubility in aqueous media.139,140 It has been reported that the fabrication strategy, surface morphology, PPy–CNT ratio, nature of the electrolytes used, scan rate, and current density have a strong dependence on the overall capacitive performance. The structural features such as porosity and surface area have a crucial role in controlling the diffusion rate of ions into the bulk of the redox active material. The porous structures allow easy infiltration of the electrolytes as well as electron migration through the network structures. An article by Jayesh et al. reported the fabrication of free standing flexible PPy–CNT nanocomposites by electrodeposition of PPy onto CNTs.141 The authors were successful in growing oxidised CNTs on carbon fibers (OCNTFs) and the mesoporous OCNTF provides a high surface area for PPy electropolymerisation. The agglomeration of CNTs within the PPy matrix has been considerably decreased by the addition of CNFs. Oxygen containing functional groups on the surface of the OCNTF and the redox activity of PPy result in superior supercapacitance performance.
It was shown that the PPy/OCNTF nanocomposite electrodes exhibit higher capacitance (300 F g−1) than the virgin CNT (60 F g−1) and OCNTF (110 F g−1). This has been attributed to the charge storage contribution by both PPy and CNTs. The 3D hierarchical brush like nanocomposite electrodes offer a high surface area and make better contact with electrolytes. Each and every electroactive moiety is in touch with the electrolyte solution and hence produces excellent capacitance.
Supercapacitor electrodes were developed by using three dimensional ordered mesoporous CNTs (3 DOM) and PPy, via cyclic voltammetric copolymerization of pyrrole monomers in the presence of CNTs.142 A template of colloidal SiO2 was used for the electro-polymerisation process. To evaluate the performance of supercapacitor electrodes, CV studies have been carried out in the three electrode configuration arrangements. Fig. 16 shows the CV plots of (a) PPy, (b) planar PPy/CNT nanocomposites and (c) PPy/3 DOM nanocomposites in 1 M KCl solutions. Fig. 16(a) shows that the oxidation and reduction current get reduced in the direction of the negative potential, indicating that the polymer slowly changes into a resistive and inactive form. When the scanning rate increases, the CV curves have been observed to be distorted. From Fig. 16(b), it was found that the CV curve of planar PPy/CNT nanocomposites exhibits a rectangular shape at a scanning rate lower than 100 mV s−1. Owing to the excellent electronic and ionic conductivity of the planar PPY/CNT nanocomposites, a quick charge–discharge switch operates and results in straight and vertical current variations. At negative potentials, the virgin PPy becomes nonconducting, while PPy/CNT nanocomposites exhibit excellent conductivity due to the diffusion of the ions to the surface. The specific capacitance of planar PPy/CNT nanocomposites was observed to be 128 F g−1 at 5 mV s−1 scanning rate. Fig. 16(c) represents the CV plots of 3 DOM CNT/PPy systems at different scan rates in KCl solution (1 M). Even at higher scanning rates, the nanocomposite films showed a rectangular shape. The specific capacitance calculated was 427 F g−1 at 5 mV s−1 scanning rate, which is nearly 3.5 times that of planar PPy/CNT nanocomposites. The 3 DOM structures with large surface area, ordered pore size and interconnected windows allow easy penetration of the electrolytes and transport of ions at a higher scan rate as well.
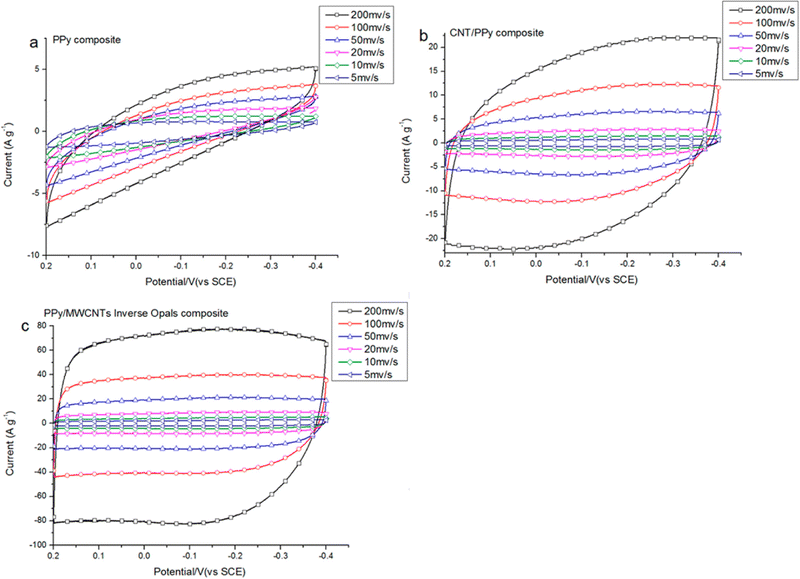 | ||
| Fig. 16 CV plots of (a) PPy, (b) planar PPy/CNT nanocomposites and (c) PPy/3 DMO nanocomposites in KCl solution (1 M); reprinted with permission from ref. 142; copyright © American Chemical Society. | ||
Fig. 17(a) represents the charging–discharging curves of supercapacitor electrodes, at a constant current. Capacitance has been calculated using the equation143
 | (7) |
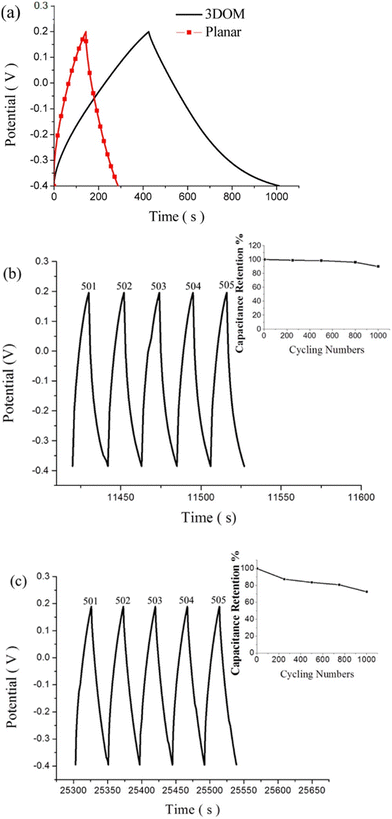 | ||
| Fig. 17 (a) Galvanostatic charge/discharge curves of planar PPy/CNT nanocomposites and PPy/3 DMO nanocomposites. (b) Continuous galvanostatic charge/discharge curves of planar PPy/CNT nanocomposites after 500 cycles. (c) Charge–discharge curves of 3 DOM-PPy/CNT nanocomposite supercapacitor electrodes after 500 cycles; reprinted with permission from ref. 142; copyright © American Chemical Society. | ||
The planar and 3 DOM PPy/CNT supercapacitor electrodes exhibited a specific capacitance of 46.5 and 196 F g−1 respectively. Fig. 17(b) shows galvanostatic charge/discharge curves of planar PPy/CNT nanocomposites after 500 cycles, and the capacitance retention behaviour has been shown in the inset. 89% capacitance retention was observed after 1000 cycles of operation. Fig. 17(c) represents the charge–discharge cycles of 3 DOM PPy/CNT supercapacitor electrodes after 500 cycles.
Egg shell membranes have been used as a platform for developing high performance supercapacitor electrodes based on PPy and CNTs.144 The strategy involves the electrostatic deposition of CNTs onto the egg shell membrane, followed by polymerisation of pyrrole in situ. By the use of egg shell membranes, hybrid supercapacitor electrodes can be prepared in a simple manner and no special chemical modifications and binders are required. Here, polyvinyl alcohol/H3PO4 have been used as a separator. Voltammograms of the PPy–egg shell membrane and PPy–CNT–eggshell membranes are shown in Fig. 18. The electrochemical performance of PPy was greatly influenced by the incorporation of the CNT. Also, from Fig. 18, it is shown that the effect of CNT incorporation is more noteworthy at lower PPy concentration (0.02 M). The competition between PPy and CNT favours the CNT behaviour at lower PPy concentration. A minimal change in the C–V curves has been observed at higher PPy concentration (Fig. 18c), owing to the excellent coverage of PPy at higher concentration which produces higher conductivity; however a lower relative contribution of the CNT to the overall response was observed.
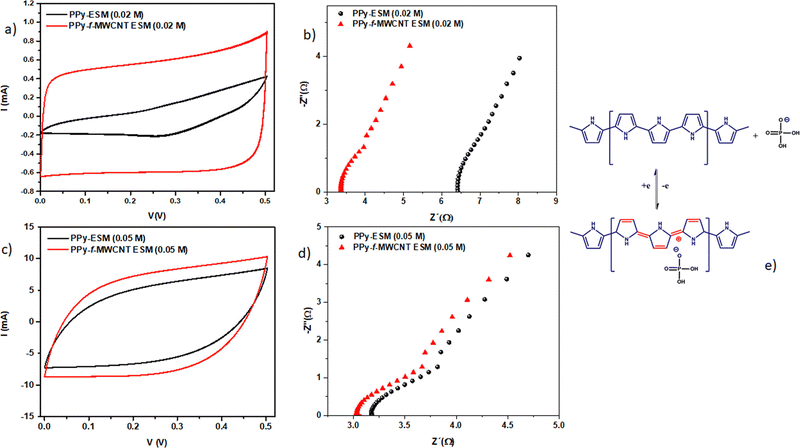 | ||
| Fig. 18 Voltammograms of PPy/egg shell membranes and PPy/CNT/egg shell membranes by using (a) 0.02 M PPy and (c) 0.05 M PPy; the corresponding impedance spectrum at 50 mV s−1 using (b) 0.02 M PPy and (d) 0.05 M PPy; (e) charge storage mechanism of CNT/PPy in H3PO4/PVA systems; reprinted with permission from ref. 144; copyright © American Chemical Society. | ||
The impedance of the system is shown in Fig. 18(b) and (d). It was found that the intersection of Z‖ onto the X axis (represents the bulk resistance value) is lower for CNT loaded systems. The difference in electrical response is minimum at higher PPy content [Fig. 18(d)]. Fig. 18(e) depicts the mechanism of the charge–discharge process in CNT/PPy nanocomposites, in the presence of H3PO4/PVA.
Table 1 illustrates the capacitance of PPy/CNT/egg shell membranes with respect to PPy concentration. The specific capacitance (Csp) of the active layer reached a maximum value of 384. 2 F g−1 at 0.03 M PPy. A further increase in PPy concentration led to a reduction in the Csp value. When the egg shell membrane was present, the capacitance of the whole device exhibited an increasing trend with PPy concentration. Both the areal and volumetric capacitance (CA and Cv) also increase with the increase in PPy content, having a maximum value at 0.08 M PPy. By combining the electrochemical and mechanical properties, it was found that 0.05 M PPy/CNT/egg shell membranes have better device performance.
| PPy concentration (M) | C sp active layer (F g−1) | C sp whole device (F g−1) | C A (mF cm−2) | C v (F cm−3) |
|---|---|---|---|---|
| 0.02 | 134.2 | 43.0 | 87.5 | 4.3 |
| 0.03 | 384.2 | 122.8 | 249.0 | 9.6 |
| 0.05 | 357.9 | 153.2 | 369.5 | 15.7 |
| 0.08 | 224.3 | 155.0 | 546.5 | 24.8 |
It has been reported that the PPy/CNT supercapacitor electrodes produced via in situ chemical oxidative polymerisation of pyrrole onto CNT networks exhibited higher capacitance at lower CNT content, usually in the range of 2–10 wt%.145
Also, thicker PPy layers are formed onto the CNT surface at lower CNT content and vice versa.146 A thicker PPy layer reduces the pore size and obstructs the diffusion pathways for electrolyte ions and hence is inefficient for charge accumulation. Dispersion of the CNT in the PPy matrix is also highly challenging. The presence of more CNT content in the reaction mixture catalyses PPy production, leading to the formation of PPy aggregates, which decreases the capacitive performance of PPy/CNT systems. Therefore, 2–10 wt% CNT in a chemically polymerised PPy/CNT composite is ideal for supercapacitor electrode fabrication.147 However, by electrochemical methods, it is possible to fabricate PPy/CNT electrodes having CNT content as high as 82 wt% while attaining high specific capacitance.148 An interesting article by Xu et al. reported the development of PPy/CNT sponges for supercapacitor electrode fabrication.149 The authors reported that there is an increase in the specific capacitance from 225 F g−1 to 350 F g−1 as the CNT content increases from 30 to 50 wt%. However, a further increase in CNT content reduces the capacitance of the systems, owing to the lower intrinsic capacitance of the CNT and the smaller pseudocapacitance contribution from PPy.150 The capacitive performance of some conducting polymer/CNT nanocomposites is presented in Table 2.
| Sl no. | Nanocomposites | Synthesis strategy | Specific capacitance | Current density | Cyclic stability | Ref. |
|---|---|---|---|---|---|---|
| 1 | PANI/MWCNT with a core–shell structure | In situ polymerisation of aniline in the presence of MWCNT as a template | 560 F g−1 | — | 70.9% retention after 700 cycles | 151 |
| 2 | PANI/MWCNT | In situ chemical polymerisation | 606 F g−1 | 1 A g−1 | 63.7% retention after 1000 cycles | 152 |
| 3 | PANI/CNT | Cyclodextrin assisted polymerisation of aniline over CNT | 107 F g−1 | 1 A g−1 | 97% retention after 5000 cycles | 153 |
| 4 | PANI/CNT | Electrospinning | 385 F g−1 | 0.5 A g−1 | 81.4% retention after 1000 cycles | 154 |
| 5 | PANI/CNT (vertically aligned) | Electrodeposition of PANI onto vertically aligned CNT | 17 mF cm−2 | 0.25 mA cm−2 | 73% retention after 3000 cycles | 155 |
| 6 | Free standing PANI/CNT | Solution deposition method | 446 F g−1 | 1 A g−1 | 98% retention after 13![[thin space (1/6-em)]](https://www.rsc.org/images/entities/char_2009.gif) 000 cycles 000 cycles |
156 |
| 7 | PANI/SWCNT | Electrochemical polymerisation | 55 F g−1 | 2.6 A g−1 | — | 157 |
| 8 | PIn/CNT | Electrospinning | 476 F g−1 | 1 A g−1 | 95% retention after 2000 cycles | 158 |
| 9 | PIn/CNT/graphene | In situ polymerisation | 383 F g−1 | 1 A g−1 | 88.79% retention after 3000 cycles | 159 |
| 10 | PIn/mesoporous CNT | In situ and ex situ strategy in the presence of layered silicates | 533 F g−1 | 10 mV s−1 | 96% retention after 2000 cycles | 160 |
| 11 | PEDOT/CNT | Co-deposition of PEDOT and CNT using galvanic pulsed electropolymerization | 297 F g−1 | 4 mA cm−2 | 79% retention after 2000 cycles | 161 |
| 12 | PEDOT/CNT/egg shell membrane | Chemical method | 58 F g−1 | 4 mA cm−2 | 90% retention after 2000 cycles | 162 |
| 13 | PPy/CNT | In situ polymerisation | 164 F g−1 | 0.2 A g−1 | 55% retention after 5000 cycles | 163 |
| 14 | PPy/CNT-E. coli | Oxidative polymerisation | 173 F g−1 | 0.2 A g−1 | 95.95% retention after 1000 cycles | 164 |
| 15 | PPy/MWCNT | Chemical polymerisation of pyrrole onto MWCNT | 167 F g−1 | 0.5 mA cm−2 | 97% retention after 500 cycles | 165 |
| 16 | PPy/CNT fibers | Electrochemical deposition of PPy on oxidized CNT fibers | 305 F g−1 | 2.5 mA cm−2 | 100% retention after 5000 cycles | 166 |
| 17 | PPy/CNT | Electropolymerisation of pyrrole onto CNT over carbon cloth | 486 F g−1 | 1 mA cm−2 | 82% retention after 10![[thin space (1/6-em)]](https://www.rsc.org/images/entities/char_2009.gif) 000 cycles 000 cycles |
167 |
| 18 | PPy/MWCNT | Chemical method by using anionic dopants | 179 F g−1 | 0.5 mA cm−2 | 118.1% retention after 1000 cycles | 168 |
| 19 | PPy/MWCNT | Electrophoretic deposition | 390 F g−1 | 1 mA cm−2 | — | 169 |
| 20 | PPy/MWCNT | Enzyme catalysed in situ reaction | 46.2 F g−1 | 1 mA cm−2 | — | 170 |
| 21 | PPy/porous SWCNT sheets | Vacuum filtration | 131 F g−1 | 100 mA g−1 | — | 171 |
| 22 | CNT@PPy core–shell sponge | Electrochemical synthesis | 276.3 F g−1 | 1 A g−1 | 86% retention after 1000 cycles | 172 |
| 23 | PPy/CNT (air plasma activated) | Polymerisation of pyrrole onto air plasma treated CNT | 188 F g−1 | 5 mA cm−2 | 89% retention after 1000 cycles | 173 |
| 24 | PPy/CNT fiber | Electrochemical deposition of PPy on CNT fiber (flexible, solid-state supercapacitor) | 69 F g−1 | — | 92% retention after 5000 cycles | 174 |
| 25 | PPy/CNT | Electrochemical deposition of PPy onto acid treated CNT | 535 F g−1 | 2 mA cm−2 | 97.8% retention after 100 cycles | 175 |
| 26 | PTh/CNT | Electrochemical polymerisation of PTh onto CNT modified carbon paper by a galvanostatic method | 216 F g−1 | 1 A g−1 | 85% retention after 100 cycles | 176 |
| 27 | Poly(3-hexyl-thiophene-2,5-diyl) (P3HT)/single-walled carbon nanotubes (SWCNTs) | Chemical method | 248 F g−1 | 0.5 A g−1 | 80.5% retention after 1000 cycles | 177 |
| 28 | PTh/MWCNT | In situ polymerisation strategy | 125 F g−1 | 1 A g−1 | — | 178 |
| 29 | PTh/MWCNT | Electro-polymerisation | 110 F g−1 | 1 A g−1 | 90% retention after 1000 cycles | 179 |
| 30 | Poly(3-oligo (ethylene oxide)) thiophene (PD2ET)/CNT | Covalent grafting with CNT via esterification reaction | 399 F g−1 | 1 A g−1 | 91% retention after 1000 cycles | 180 |
| 31 | Poly(3-methyl thiophene) (PMT)/multiwalled carbon nanotubes (MWCNTs) | Chemical method | 296 F g−1 | 1 A g−1 | 80% retention after 100 cycles | 181 |
The π–π interaction among the conducting polymer and the CNT increases the electron transport and hence enhances the electrical properties of the nanocomposites. From the literature it is observed that the synthesis strategies, the ratio of the conducting polymer to the CNT, surface morphology, scan rate, current density, number of cyclic voltammetry cycles, electrolyte characteristics, porosity and surface area strongly influence the capacitive performance. 1-D carbon nano-architectured CNTs randomly arranged in a conducting polymer have a synergistic impact on the specific capacitance. Aligned CNT/conducting polymer nanocomposites have been observed to produce an excellent result than non-aligned structures. The plasma enhanced chemical vapour deposition strategy has been found to be the best method to produce vertically aligned nanostructures onto the polymer matrix, to yield high specific capacitance.
3.2. Conducting polymer/graphene based nanocomposites
Graphene is a 2D form of carbon, with an exterior area of around 2700 m2 g−1, excellent mechanical properties and a high conductivity of 6000 S cm−1, and has been reported to be a superior candidate for supercapacitor electrode fabrication.182–185 Graphene derivatives like graphene oxide (GO), reduced graphene oxide (RGO), chemically modified graphene, etc. are well established as supercapacitor materials.186–188 Exfoliation of graphite by chemical, mechanical or thermal strategies produces graphene and the graphene derivatives possess multiple graphene sheets stacked together. Compared to graphene, graphene derivatives have more surface defects, which prevents their usage in photonics/optoelectronic devices. However, this property is more favourable for supercapacitor applications and also increases the electrochemical capacitance capability.189–191PANI/graphene nanocomposites have been fabricated for supercapacitor applications via various strategies, viz., interfacial polymerisation, chemical polymerisation and electrochemical polymerisation.192–194 The chemical oxidative polymerisation strategy has been carried out in a rotating packed bed (RPB) for developing PANI/graphene supercapacitor electrodes.195 The effect of concentration of graphene, mol ratio of oxidant/monomer, monomer concentration and type of reactor on the surface morphology and capacitive performance of the nanocomposites has been investigated. The RBP method creates PANI/graphene nanocomposites with relatively uniform surface morphology having very thinner coatings than those produced in a stirred tank reactor (STR). Compared to PANI, PANI/graphene nanocomposites exhibit higher specific capacitance (403 F g−1). Also, a capacitance retention of 87% has been obtained after 1000 cycles.
PANI/graphene oxide nanocomposites have been prepared by the in situ chemical oxidative strategy in an acidic environment and dodecyl benzene sulfonic acid (DBSA) has been employed as a surfactant and dopant.196 The authors investigated the effect of GO concentration on the morphology of the nanocomposites (Fig. 19). It was found that at 6% GO loading, porous nanoarchitectures having dispersed nanofibers were formed. DBSA supports the growth of PANI on the graphene oxide surface during the polymerisation. As the GO loading increases, the specific capacitance of the nanocomposites shows an increasing trend and reaches a maximum of 658 F g−1 at 6% GO and after that it tends to decrease (PANI: 158 F g−1; PANI/GO-1: 323 F g−1; PANI/GO-2: 345 F g−1; PANI/GO-4: 417 F g−1; PANI/GO-6: 658 F g−1; PANI/GO-8: 387 F g−1; PANI/GO-10: 355 F g−1). PANI/GO-6 nanocomposites possess the least pore size and the highest pore volume and surface area, which contribute to the highest specific capacitance.
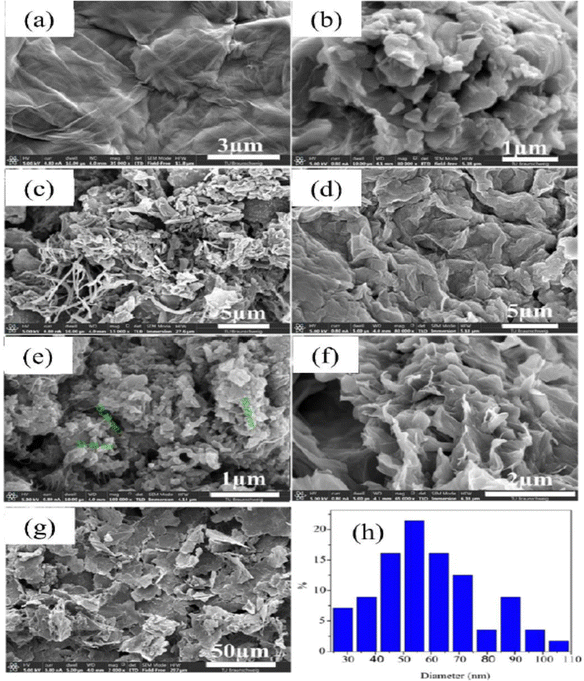 | ||
| Fig. 19 SEM images of the electrode surfaces containing (a) graphene, (b) PANI, (c) PANI-GO-1, (d) PANI-GO-4, (e) PANI-GO-6, (f) PANI-GO-8, and (g) PANI-GO-10; (h) particle size distribution of a representative system (PANI-GO-10); reprinted with permission from ref. 196; copyright © MDPI. | ||
Dong et al. developed PANI/ionic liquid-modified RGO supercapacitor electrodes via in situ polymerisation of aniline onto an RGO-ionic liquid layer.197 The ionic liquid enlarged the inter-layer distance of RGO sheets and acted as a PANI dopant to enhance the capacitive features of the system. Ionic liquids have high conductivity and electrochemical stability and hence provide additional pathways for electron and ion transport. The PANI/RGO-ionic liquid electrodes exhibited a specific capacitance of 790 F g−1 at 1 A g−1 discharge current, significantly greater than those of unmodified PANI/RGO electrodes. Furthermore, the symmetric supercapacitor device made of the PANI/RGO-ionic liquid layer supercapacitor electrode in 1 M H2SO4 showed an energy density of 24 W h kg−1 at a power density of 501 W kg−1 and an outstanding cyclic stability of 91% retention in 1000 cycles.
PANI/RGO-ionic liquid layer systems possess a unique, compact multilayer structure in which PANI coils are wrapped around the layers of RGO, which cushions the volume changes caused by expansion and contraction of PANI and provides excellent mechanical stability. The ionic liquid has a crucial role in determining the energy density and stability of the electrodes. The interaction between PANI and RGO increases in the presence of ionic liquids, owing to which there is an increase in space for the electrolytes to access the electrode, resulting in an efficient utilization of electrode materials and improved capacitance.
Interdigitated RGO/PANI flexible microsupercapacitors have been fabricated on the PET substrate.198 Here, the reduction of graphene oxide and growth of conducting polymers are executed simultaneously in one step by the laser irradiation strategy. A schematic illustration of the preparation method is given in Fig. 20. The CV curves of RGO microsupercapacitor and RGO@PANI microsupercapacitor electrodes at 5, 10 and 20 mV s−1 scan rates are shown in Fig. 21(a) and (b) respectively. Curves with rectangular shapes have been observed for RGO microsupercapacitor electrodes, indicating the faradaic effect and suggesting the formation of an effective double layer capacitance [Fig. 21(a)], whereas for RGO@PANI microsupercapacitor electrodes, quasi-rectangular shaped CV curves with a pair of redox peaks have been observed owing to the charge–discharge behaviour and pseudocapacitance of PANI due to the change in structure, i.e. leucoemeraldine–emeraldine and emaraldine–pernigraniline [Fig. 21(b)]. The stack area capacitance can be determined using the area and volume of the stack by integrating the area of the CV curve using the equation198
 | (8) |
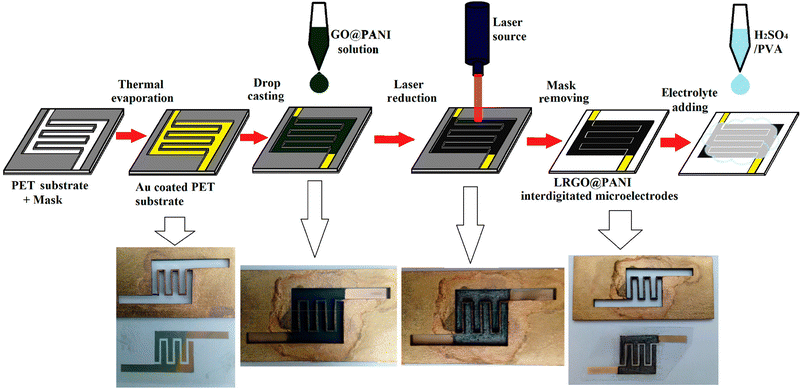 | ||
| Fig. 20 Schematic and digital photograph of fabrication of PANI/RGO microcapacitor electrodes; reprinted with permission from ref. 198; copyright © American Chemical Society. | ||
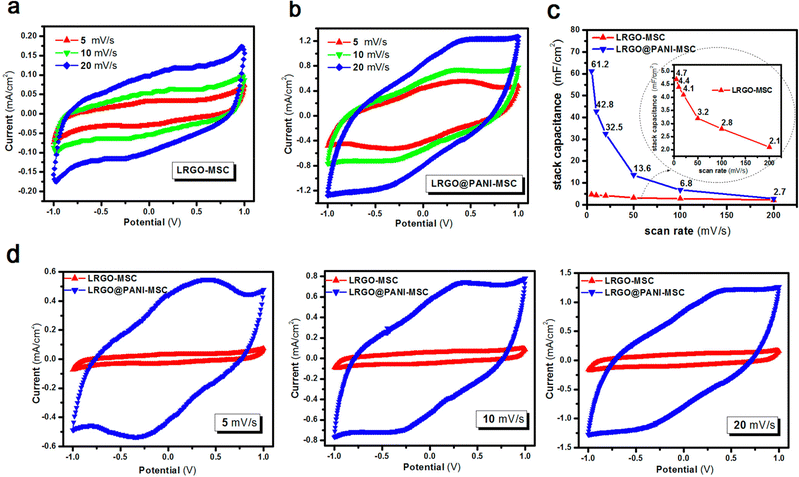 | ||
| Fig. 21 CV curves of the (a) RGO microsupercapacitor and (b) RGO@PANI microsupercapacitor at different scan rates. (c) Stack area capacitance as a function of scan rate. (d) CV curves at different scan rates (5, 10 and 20 mV s−1) for RGO microsupercapacitor electrodes and RGO@PANI microsupercapacitors; reprinted with permission from ref. 198; copyright © American Chemical Society. | ||
In an interesting article, RGO-wrapped PANI nanocomposites have been synthesised by reducing GO to RGO.199 A combination of Et4N+BF4−/propylene carbonate has been used as an organic electrolyte. A capacitance of 250 F g−1 with a cyclic stability of 73% has been achieved. Over 1000 cycles of charging/discharging, only 27% loss of the initial capacitance has been observed. Baek et al. developed PANI-grafted GO (PANI-g-GO) nanocomposites by initially grafting 1-amine-protected 4-aminophenols onto GO and subsequent polymerisation using aniline.200 Reduction of GO has been facilitated by thionyl chloride. The electrical conductivity and specific capacitance of the nanocomposite were 8.7 S cm−1 and 250 F g−1 respectively. The results proved that the system is very apt for energy storage applications. The synthesis strategy of PANI-g-GO nanocomposites is shown in Fig. 22.
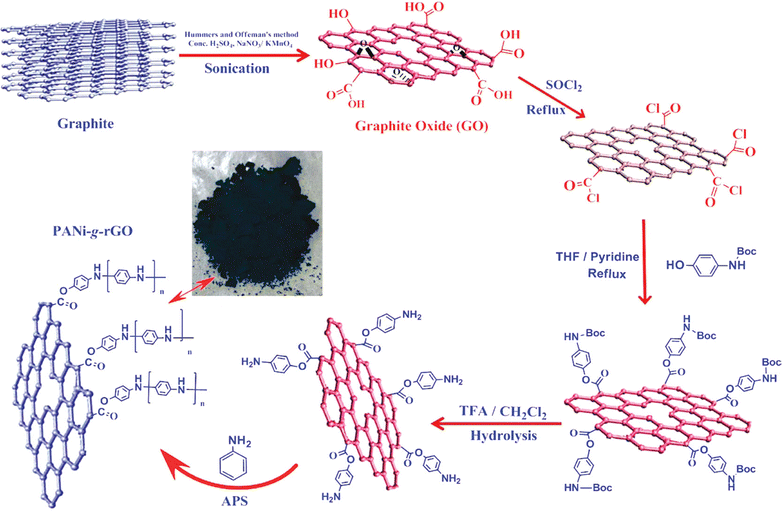 | ||
| Fig. 22 Schematic representation of the synthesis of PANI-g-GO nanocomposites; reprinted with permission from ref. 200; copyright © American Chemical Society. | ||
There are certain parameters which influence the electrochemical properties of RGO/PANI nanocomposites. They are the order of compositing, reduction of GO and the nature of electrolytes. Moyseowicz et al. employed modified Hummers' method to synthesise GO from graphite. Hydrothermal treatment for 12 hours at 180 °C was used to reduce GO to RGO, followed by the addition of PANI into the reaction medium.201 The specific capacitance of PANI/RGO-HT (RGO by hydrothermal treatment) was observed to be 239 F g−1 at a current density of 20 A g−1, whereas for PANI it was 84 F g−1. The cyclic stability of the composite was greatly increased and 80% retention of the capacitance after 6000 cycles can be achieved. For bare PANI, only 46% capacitance was retained after 1000 cycles at a current density of 2 A g−1.
Wen et al. synthesised PPy/GO nanocomposites by exploiting an eco-friendly polymerisation within the ice and fabricated them into electrodes for symmetric solid-state supercapacitors.202 PPy/GO supercapacitors showed a better capacitance of 98.4 mF cm−2 at a current density of 1 mA cm−2, compared to pure PPy supercapacitors. After 1000 charging/discharging cycles, 94.1% of the capacitance was retained. GO addition has two advantages: it increases the PPy conjugation length as well as improves the film formation property. An increase in conjugation length leads to a reduction in the resistance of the material and enhancement in the energy storage property. Fig. 23 shows the galvanostatic charge–discharge (GCD) plots with respect to current density. The curves were symmetrical, indicating their good capacitance behaviour. However, the capacitance of the system decreased with the increase in current density. Fig. 23(f) represents the areal capacitance of the system as a function of current density according to GCD data. The highest area specific capacitance was observed for FSC-5 samples (PPy-Go 2.5), 97.3 mF cm−2 at 1 mA cm−2 current density. All the supercapacitors exhibited higher area specific capacitance than neat PPy.
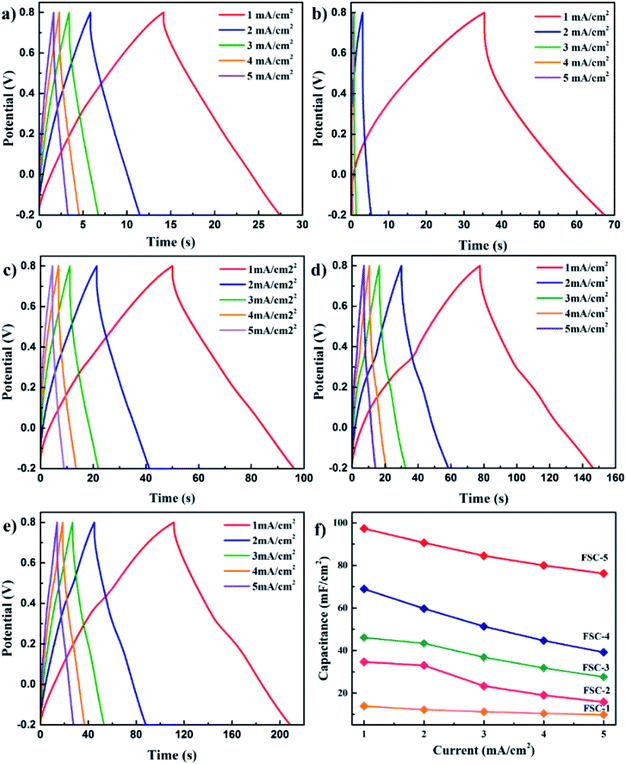 | ||
| Fig. 23 GCD profiles of (a) PPy, (b) PPy-GO 1, (c) PPy-GO 1.5, (d) PPy-GO 2 and (e) PPy-Go 2.5 at different current densities. (f) Plots of areal specific capacitance for FSCs (FSCs: flexible supercapacitors, FSC-1 = PPy, FSC-2 = PPy-GO 1, FSC-3 = PPy-GO 1.5, FSC-4 = PPy-GO 2, and FSC-5 = PPy-Go 2.5); reprinted with permission from ref. 202; copyright © Royal Society of Chemistry. | ||
The cyclic stability of two representative samples FSC-1 and FSC-5 is shown in Fig. 24(a). It was shown that in the case of the FSC-1 system the capacitance decreases quickly whereas that of FSC-5 shows almost a steady nature. The contraction and enlargement of chain segments of PPy during the charging/discharging cycle influences the charge distribution and conformation of the polymer, leading to a reduction in the electrochemical characteristics. The introduction of GO into PPy chains imparts electrochemical stability and mechanical strength, thereby reducing the volume change of the polymer chains. Fig. 24(b) represents the GCD diagram of the representative sample FSC-5 with respect to bending angles. Only slight variation has been observed in the GCD curves with bending angles indicating that the system is highly flexible.
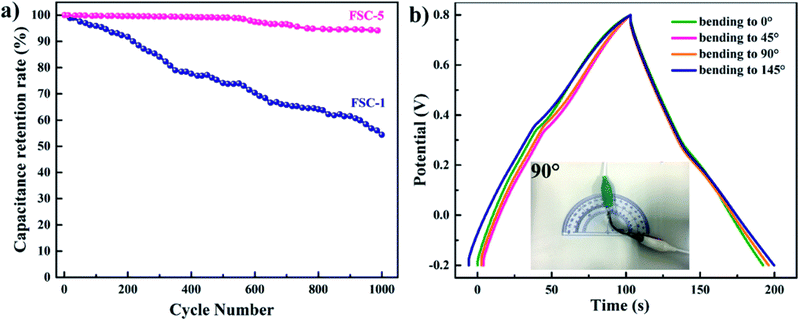 | ||
| Fig. 24 (a) Cycling behavior of FSC-1 and FSC-5 asymmetric supercapacitors. (b) GCD curves of FSC-5 with different bending angles at a current density of 1 mA cm−2; reprinted with permission from ref. 202; copyright © Royal Society of Chemistry. | ||
By using hexadecyl pyridinium chloride for GO modification, Feng et al. developed PPy/modified GO nanocomposite via the in situ polymerisation strategy.203 The hydrophobic group in hexadecyl pyridinium chloride (pyridine rings) combined with PPy chains interacts with the GO surface via π–π stacks as shown in Fig. 25. Due to this, the specific capacitance of modified GO (202 F g−1) has been observed to be greater than that of PPy/GO (129 F g−1) indicating that the modification of GO by hexadecyl pyridinium chloride improves the performance of the PPy/GO nanocomposites. Also, the supercapacitor has an energy density of 149.1 W kg−1, which is considerably higher than that of the conventional capacitors. 83.8% capacitance retention after 1000 charging/discharging cycles has been obtained.
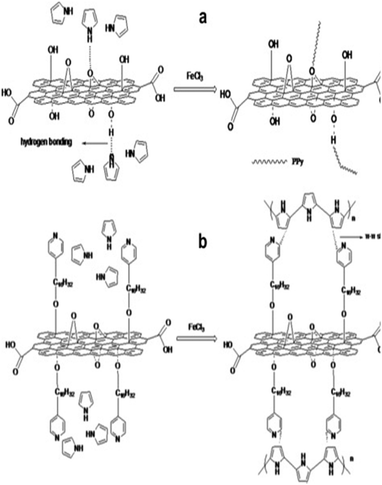 | ||
| Fig. 25 Possible combining mode of (a) PPy/GO and (b) PPy/modified GO; reprinted with permission from ref. 203; copyright © Elsevier. | ||
The microwave irradiation technique has been employed to exfoliate and reduce GO, followed by in situ polymerisation of pyrrole onto it.204 The optimum weight ratio of pyrrole![[thin space (1/6-em)]](https://www.rsc.org/images/entities/char_2009.gif) :
:![[thin space (1/6-em)]](https://www.rsc.org/images/entities/char_2009.gif) MRGO (GO by microwave irradiation) was 10
MRGO (GO by microwave irradiation) was 10![[thin space (1/6-em)]](https://www.rsc.org/images/entities/char_2009.gif) :
:![[thin space (1/6-em)]](https://www.rsc.org/images/entities/char_2009.gif) 1 owing to the maximum conductivity. The π–π interaction amongst PPy and MRGO has been revealed from Raman spectroscopy. The G and D bands are found at 1588 cm−1 and 1350 cm−1 respectively [Fig. 26(a)]. The characteristic peaks of PPy due to C
1 owing to the maximum conductivity. The π–π interaction amongst PPy and MRGO has been revealed from Raman spectroscopy. The G and D bands are found at 1588 cm−1 and 1350 cm−1 respectively [Fig. 26(a)]. The characteristic peaks of PPy due to C![[double bond, length as m-dash]](https://www.rsc.org/images/entities/char_e001.gif) C stretching, C–H in-plane deformation and pyrrole ring deformation have been observed at 1568 cm−1, 1042 cm−1 and 977 cm−1 respectively. The interaction between PPy and MRGO causes a shift in the G band to higher wavelength. The defect density has been determined from the ratio of intensity of D band to G band and it is 0.9 for MRGO whereas for the PPy/MRGO nanocomposite it is 0.922, indicating a reduction in the size of the in-plane SP2 region and a greater extent of defects in it. Fig. 26(b(a)) shows the GCD plots of PPy/MRGO nanocomposites at different current density. The GCD plots exhibit deviated triangular symmetry, showing pseudocapacitive behaviour. The GCD plots of the system are presented in Fig. 26(b(b)). The discharge time of the PPy/RGO nanocomposite is longer, leading to higher specific capacitance. Fig. 26(b(c)) represents the specific capacitance vs. current density plot. Compared to individual components, the specific capacitance of PPy/RGO nanocomposites has been increased seven-fold, owing to the synergism between the components.
C stretching, C–H in-plane deformation and pyrrole ring deformation have been observed at 1568 cm−1, 1042 cm−1 and 977 cm−1 respectively. The interaction between PPy and MRGO causes a shift in the G band to higher wavelength. The defect density has been determined from the ratio of intensity of D band to G band and it is 0.9 for MRGO whereas for the PPy/MRGO nanocomposite it is 0.922, indicating a reduction in the size of the in-plane SP2 region and a greater extent of defects in it. Fig. 26(b(a)) shows the GCD plots of PPy/MRGO nanocomposites at different current density. The GCD plots exhibit deviated triangular symmetry, showing pseudocapacitive behaviour. The GCD plots of the system are presented in Fig. 26(b(b)). The discharge time of the PPy/RGO nanocomposite is longer, leading to higher specific capacitance. Fig. 26(b(c)) represents the specific capacitance vs. current density plot. Compared to individual components, the specific capacitance of PPy/RGO nanocomposites has been increased seven-fold, owing to the synergism between the components.
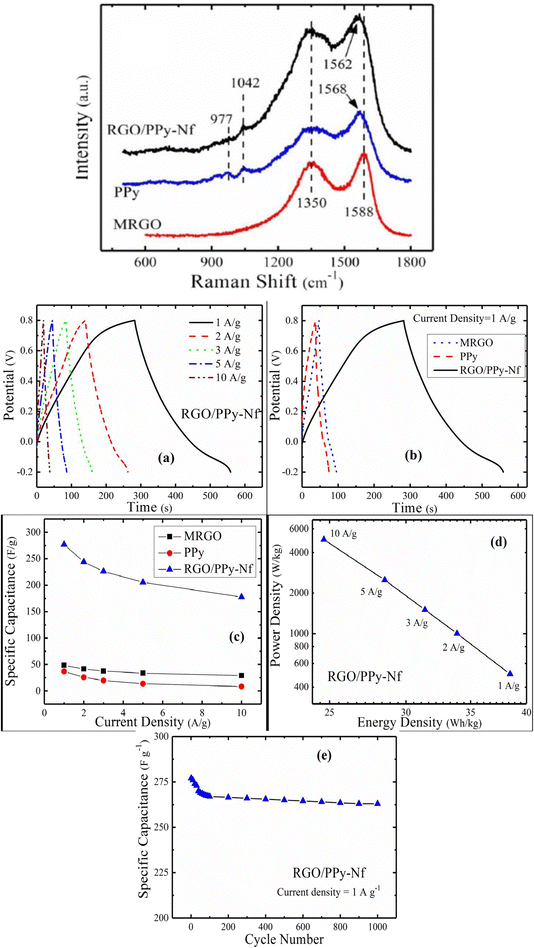 | ||
| Fig. 26 (a) Raman spectra of MRGO, PPy, and the RGO/PPy-NF nanocomposite; reprinted with permission from ref. 204; copyright © Springer. (b) (a) GCD plot of the RGO/PPy nanocomposite with current density. (b) GCD plot of the samples at a current density of 1 A g−1. (c) Variation of specific capacitance with current density. (d) Ragone plot. (e) Specific capacitance vs. cycle numbers for the RGO/PPy nanocomposite; reprinted with permission from ref. 204; copyright © Springer. | ||
The Ragone plot, showing the relationship between power density and energy density, is presented in Fig. 26(b(d)). The specific energy density was calculated using the equation204
 | (9) |
The power density (P) has been calculated by using the expression204
 | (10) |
PPy/RGO nanocomposites exhibited an energy density of 38.5 W h kg−1 with a power density of 500 W kg−1 at 1 A g−1 current density. The contribution from both pseudocapacitance and porous nature of the electrode material provides higher energy density. The current density and energy density are inversely related as shown in Fig. 26(b(d)). This may be attributed to the time lag in the diffusion of ions to reach the electrode material. Fig. 26(b(e)) shows the specific capacitance versus cycle number plot. For the first 100 cycles the specific capacitance decreases to 96%, owing to the activation process and breakage of the nanocomposites.
Exfoliated graphene (Ex-GF) has been used as a partner for fabricating composites with pyrrole, using 1,5 naphthalene di-sulphonate (NDS) and 2-naphthalene sulfonate (NMS) as dopants to form Ex-GF/PPy-NDS and Ex-GF/PPy-NMS nanocomposites respectively.205 Both the nanocomposites showed high electrical conductivity and improved cyclic stability due to the synergy between the partners. In another work, graphite nanoflakes have been fabricated on a polymeric film, followed by polymerisation of p-toluene sulphonate doped PPy on the surface to form flexible electrodes.206 The developed micro-capacitor devices have a maximum capacitance of 37 mF cm−2 using H2SO4 as the electrolyte and 6 mF cm−2 for solid state electrolytes (e.g. PVA/H3PO4). Lai et al. reported the synthesis of nitrogen doped graphene-PPy electrodes, having a capacitance of 393 F g−1, which is larger than those of NH2-graphene-PPy electrodes (225 F g−1) and GO/PPy electrodes (165 F g−1).207 During the oxidative polymerisation with GO, monomers are polymerised and subsequent reduction of GO to graphene occurs. Nanocomposites with hierarchical structures have been developed from PANI nanowires and GO sheets by varying the aniline/GO ratio. The synthesised nanocomposites exhibited a capacitance of 555 F g−1 and possessed excellent cyclic stability; i.e., even after 2000 charging/discharging cycles, 92% of initial capacitance was retained.
PPy/GO nanocomposites have been fabricated via the electrochemical co-deposition strategy and the areal capacitance of the nanocomposites has been evaluated.208 The areal capacitance of the nanocomposites reaches 23 mF cm−2 at a current density of 0.1 mA cm−2 and then decreases to 16 mF cm−2 as the current density approaches 2 mA cm−2, retaining 70% of the capacitance at 0.1 mA cm−2. For practical application of electrode materials as supercapacitors, increasing the areal capacitance is preferred, which depends on the loading of the active materials on the electrode. The amount of active materials on the electrode can be varied by changing the deposition time. In the study, the areal capacitance was evaluated for a range of deposition time varying from 200 s to 2700 s. The variation of areal capacitance with deposition time at different scan rates is shown in Fig. 27. At a lower scan rate of 1 mV s−1 and 10 mV s−1, the areal capacitance shows a linear behaviour with respect to deposition time. As the scan rate increases, the areal capacitance of the RGO/PPy nanocomposite electrode decreases with deposition time owing to the reduction in the interaction between the polymer matrix and electrolytes because of the slow ion diffusion in the polymer matrix. Except for 1 mV s−1 and 10 mV s−1 scan rates, the other plots do not show a linear trend with deposition time. The areal capacitance is independent of deposition time as the scan rate approaches 500 mV s−1. At a lower scan rate the ions of the electrolytes get enough time to diffuse into the nanocomposite and the active materials on the electrodes can be used adequately hence producing larger areal capacitance. However, when the scan rate increases, the electrolyte ions don’t get sufficient time to diffuse and only a part of the active material can be utilized. Hence the electrodes deposited at the highest deposition time of 2700 s no longer exhibit maximum areal capacitance at fast scans. Table 3 shows the dependence of the largest areal capacitance on the scan rate and deposition time.
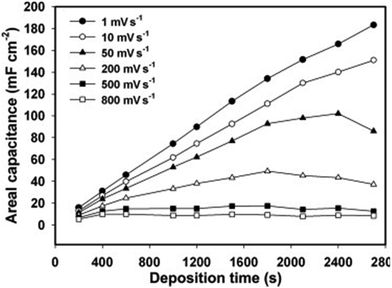 | ||
| Fig. 27 Areal capacitance versus deposition time plot of RGO/PPy electrodes with different CV scan rates; reprinted with permission from ref. 208; copyright © Elsevier. | ||
| Sl no. | Scan rate (mV s−1) | Largest areal capacitance (mF cm−2) | Deposition time (s) |
|---|---|---|---|
| 1 | 10 | 152 | 2700 |
| 2 | 30 | 117 | 2400 |
| 3 | 50 | 102 | 2400 |
| 4 | 100 | 77 | 1800 |
| 5 | 200 | 49 | 1800 |
| 6 | 500 | 18 | 1800 |
Polyindole (PIn), an important member of the conducting polymer family, has been extensively employed for the fabrication of supercapacitors.209,210 They possess hybrid properties of both poly(para-phenylene) and polypyrrole, owing to the structural similarities. In addition to this, their thermal properties are superior in comparison with those of polyaniline, polythiophene and polypyrrole.211 PIn is an electrically stable redox material which can run over 450![[thin space (1/6-em)]](https://www.rsc.org/images/entities/char_2009.gif) 000 redox cycles between −0.5 and 0.9 V.212 Introduction of RGO into PIn significantly improves the conductivity of the latter, owing to the interaction of –NH groups of the indole moieties of PIn with RGO. Zhou et al. reported the fabrication of PIn/RGO nanocomposites via the in situ chemical oxidative polymerisation strategy.213 Compared to PIn and RGO, PIn/RGO nanocomposites exhibit an excellent specific capacitance of 323 F g−1 at 1 A g−1 current density. 94.5% cycling efficiency was achieved after 1000 cycles.
000 redox cycles between −0.5 and 0.9 V.212 Introduction of RGO into PIn significantly improves the conductivity of the latter, owing to the interaction of –NH groups of the indole moieties of PIn with RGO. Zhou et al. reported the fabrication of PIn/RGO nanocomposites via the in situ chemical oxidative polymerisation strategy.213 Compared to PIn and RGO, PIn/RGO nanocomposites exhibit an excellent specific capacitance of 323 F g−1 at 1 A g−1 current density. 94.5% cycling efficiency was achieved after 1000 cycles.
The structural conversion of PIn in H2SO4 media (GCD plots at different current densities are monitored in the 1 M H2SO4 (aq) electrolyte) is presented in Fig. 28. In the first redox process, the neutral species is converted to a radical cation as the oxidation proceeds. The proton and electron exchange related to the redox transformation occurs at the positive potential during the second redox process. The oxidation and reduction peaks of PIn/RGO were observed at 0.52 V, 0.86 V and 0.4 V, 08 V respectively. The peaks were slightly shifted due to the interaction of PIn and RGO.
 | ||
| Fig. 28 Structural changes of the PIn electrode in H2SO4: (a) electron exchange in the first redox process and (b) proton and electron exchange in the second redox cycle; reprinted with permission from ref. 213; copyright © Royal Society of Chemistry. | ||
PIn/GO nanocomposites have been synthesised via the cetyltrimethylammonium assisted dilute solution polymerisation strategy in the presence of different concentrations of GO from 5 to 20% w/w and FeCl3 as an oxidant.214 Sulphonated polysulphone electrodes have been fabricated on a steel substrate and the capacitance has been examined with reference to Ag/AgCl via cyclic voltammetry at a scan rate of 0.001 to 0.15. PIn/GO nanocomposites with 20% GO showed the highest specific capacitance of 399.9 F g−1 in comparison with 21.89 of pure PIn. Only 1% reduction in capacitance has been observed after 50 cycles, indicating the cyclic stability of the supercapacitors.
There is no difference in the environmental and electrochemical stability between PANI, PPy and PIn. However, their conductivity follows the order PPy > PANI > PIn.215Table 4 shows a comparison of performance of supercapacitors based on conducting polymer/graphene nanocomposites. The electrochemical features, viz., charge/discharge speed, specific capacitance and cyclic stability, of the nanocomposites depend on the concentration of graphene or graphene derivatives, features of conducting polymers and polymerisation strategies. In summary, 2D graphene materials have been shown to be a promising candidate for energy storage applications. They are characterised by excellent strength, flexibility and electrical conductivity. Specifically, graphene and reduced GO are superior in conductivity enhancement of the electrode composite, while GO, which is rich in surface functional groups, possesses the potential for fast surface adsorption–desorption reactions as required for supercapacitors. It has also been observed that both graphene and reduced GO nanosheets tend to fold and restack together, resulting in micropores with size below 1 nm. These micropores are very small for the access of the electrolyte, leading to considerable specific capacitance loss. To solve this, it is essential to avoid severe stacking of graphene sheets and control pore configuration.
| Sl no. | Nanocomposites | Synthesis strategy | Specific capacitance | Current density | Cyclic stability | Ref. |
|---|---|---|---|---|---|---|
| 1 | PEDOT/RGO | Hydrothermal method followed by in situ polymerisation strategy | 104 F g−1 | 0.5 A g−1 | 88% retention after 1000 cycles | 216 |
| 2 | PEDOT/GO | Electrodeposition strategy | 115 F g−1 | 0.3 A g−1 | — | 217 |
| 3 | PPy/GO | Electrochemical co-deposition method | 186.67 F g−1 | — | — | 218 |
| 4 | PPy/GO | Electrochemical co-deposition method | 481.1 F g−1 | 0.2 mA cm−2 | 80% retention after 1000 cycles | 219 |
| 5 | PPy/RGO | Electrodeposition strategy | 229 F g−1 | 0.5 A g−1 | 81% retention after 1000 cycles | 220 |
| 6 | PPy/RGO | Thermal reduction of GO followed by chemical polymerisation of pyrrole | 336 F g−1 | 0.6 mA cm−2 | 64% retention after 500 cycles | 221 |
| 7 | PPy/GO | Electro co-deposition method | 356 F g−1 | 0.5 A g−1 | 78% retention after 1000 cycles | 222 |
| 8 | PANI/graphene | In situ polymerisation of aniline in the presence of (NH4)2S2O8 | 408 F g−1 | 5 mV s−1 | 84% retention after 40 cycles | 223 |
| 9 | PANI/GO | Microemulsion polymerisation | 448 F g−1 | 0.5 A g−1 | 81% retention after 5000 cycles | 224 |
| 10 | PANI/GO | In situ chemical oxidative pathway | 658 F g−1 | 10 A g−1 | 84% retention after 2000 cycles | 225 |
| 11 | PANI/RGO | In situ polymerisation strategy | 349 F g−1 | 0.5 A g−1 | 82% retention after 1000 cycles | 226 |
| 12 | PANI/RGO | In situ polymerisation strategy | 284 F g−1 | 0.5 A g−1 | 70% retention after 1000 cycles | 227 |
| 13 | PANI/RGO | Electrochemical reduction of GO followed by cyclic voltammetric electrodeposition of PANI | 1084 F g−1 | 3.22 mA cm−2 | 86% retention after 1000 cycles | 228 |
| 14 | PANI/RGO | Oxidative polymerisation | 207 F g−1 | 2 mV s−1 | 75% retention after 1000 cycles | 229 |
| 15 | PANI/RGO | Oxidative polymerisation followed by hydrothermal method | 420 F g−1 | 0.2 A g−1 | 80% retention after 6000 cycles | 230 |
| 16 | PEDOT/RGO | In situ polymerisation strategy | 270 F g−1 | 0.5 A g−1 | 93% retention after 10000 cycles | 231 |
| 17 | PEDOT/RGO | Electrochemical synthesis | 12.1 mF cm−2 (areal cap) | 0.3 A g−1 | 88% retention after 3000 cycles | 232 |
| 18 | PIn/graphitic carbon nitride (g-C3N4) | Reflux method | 440.8 C g−1 | 6 A g−1 | 72% retention after 5000 cycles | 233 |
| 19 | PIn/RGO | Hydrothermal method followed by in situ emulsion polymerisation | 320 F g−1 | 0.3 A g−1 | 84% retention after 2000 cycles | 234 |
| 20 | PIn/RGO (PIn nanotubes supported on RGO) | Electrochemical method | 399 F g−1 | — | 99% retention after 50 cycles | 235 |
| 21 | PIn/RGO | Electrochemical synthesis | 265 F g−1 | 5 A g−1 | 62% retention after 5000 cycles | 236 |
| 22 | PIn/graphite | Electrochemical synthesis | 1308 F g−1 | 1 A g−1 | 98% retention after 850 cycles | 237 |
| 23 | Poly-ortho aminophenol/functionalised GO | Electrochemical synthesis | 281.1 F g−1 | 1 A g−1 | >99% retention after 1200 cycles | 238 |
3.3. Conducting polymer/activated carbon (AC) nanocomposites
AC can also be used as an electrode material. However, ion transport with AC is slow. It has an exterior area of 1400 m2 g−1 and an average pore dimension of 2.5 nm.239,240 There is no much literature available on polymerisation of conducting polymers onto AC. In the recent work reported by Ryu et al., aniline has been deposited on AC, followed by further polymerisation in acid media.241 The specific capacitance of the PANI/AC system has been increased by 41% compared to pristine AC. In another study, it has been reported that the uniformity in the distribution of PANI onto AC does not depend on the ratio of AC and PANI.242A series of PANI/AC nanocomposites were developed, via mechanical mixing and chemical methods.243 AC has been produced from anthracite by chemical activation using KOH and subsequently heated to eliminate oxygen groups. Both the heat-treated AC and untreated AC have been utilised to develop PANI/AC nanocomposites. The specific capacitance of the heat-treated AC nanocomposites was found to be lower (125 F g−1) than that of untreated AC (228 F g−1). This is attributed to the higher porosity and greater number of oxygen groups at the surface of pristine AC.
Anggraini et al. reported the fabrication of PANI/AC supercapacitor electrodes by the dry mixing method, in the ratio of 82% AC to 18% PANI.244 The highest specific capacitance obtained was 290 F g−1 at 1 mV s−1, and the cyclic stability lasted up to 20 cycles, with a reduction in capacitance of 21%. This decrease is due to the swelling and deswelling of PANI. The combination of good cyclic stability of activated carbon and conductivity of PANI generates a system with excellent electrode performance.
Asymmetric supercapacitor electrodes have been fabricated by using the GO/PANI system as the positive electrode and AC as the negative electrode.245 The electrodes exhibited a specific capacitance of 142 F g−1 at 1 A g−1 current density. Furthermore, the supercapacitor electrodes showed excellent cyclic stability, i.e. retention of 119% initial capacitance even after 10![[thin space (1/6-em)]](https://www.rsc.org/images/entities/char_2009.gif) 000 cycles, with a coulombic efficiency of 98%, signifying outstanding potential for practical applications. By asymmetric combination of electrodes, the voltage window can be extended to a higher value. The energy density, power density and areal capacitance obtained were 29 W h kg−1, 2503 W kg−1 and 57 mF cm−2 respectively.
000 cycles, with a coulombic efficiency of 98%, signifying outstanding potential for practical applications. By asymmetric combination of electrodes, the voltage window can be extended to a higher value. The energy density, power density and areal capacitance obtained were 29 W h kg−1, 2503 W kg−1 and 57 mF cm−2 respectively.
Nanocomposites having PANI coatings inside the microporous structure of activated carbon fiber (ACF) have been developed via the chemical and electrochemical method.246 The system has been then used to fabricate asymmetric supercapacitors based on AC as the negative electrode and ACF/PANI as the positive electrode in H2SO4 as the electrolyte. PANI within the pores of ACF prevents the oxidation of carbon material and oxygen evolution occurs at more positive potentials. The system exhibits an energy density of 20 W h kg−1 and a power density of 2.1 kW kg−1 with an excellent cycle life time (90% during the first 1000 cycles) and high coulombic efficiency.
Martinez et al. developed PANI/AC composite electrodes via various synthesis strategies.247 In the first strategy, mechanical mixing of PANI with AC was done and it was found that the system doesn’t exhibit significant synergism. The second strategy involved chemical polymerisation of aniline within AC. Aniline reacts with the oxygen groups at the carbon surface, removing their positive effect on capacitance with a concomitant change in carbon porosity. PANI/AC systems exhibit higher specific capacitance if they are mixed together directly or polymerized over a carbon material with low content of surface oxygens. Tan et al. reported the synthesis of PANI/AC nanocomposites via in situ polymerisation for supercapacitor electrode fabrication.248 The nanocomposite electrodes exhibited an excellent specific capacitance of 520 F g−1, at a current density of 1 A g−1 and also showed good capacitance retention with an increase in current density. 71.2% capacitance retention has been achieved after 5000 charging/discharging cycles. Further, a high energy density of 29 W h kg−1 was measured from charging/discharging experiments.
Fabrication of PPy/AC nanocomposites was reported via polymerisation of pyrrole in an aqueous dispersion of carbon black.249 The effect of carbon black content on the electronic conductivity of the nanocomposites was examined. This work opened a new chapter for the development of conducting polymer-based nanocomposites for electrochemical storage. To maintain the exceptional power performance of supercapacitors, precise control over the thickness of the polymer is required. The discharge time of polymer-based supercapacitors is often in the range of seconds in comparison with milli- or microseconds of conventional capacitors.
Hence the overall power density is lower than capacitors. Increasing the PPy content in the nanocomposite has been shown to increase the gravimetric capacitance; however it also creates a non-desirable increase in the charging time constant. The miniemulsion polymerisation strategy has been employed to develop PPy/AC nanocomposites in the presence of a surfactant (for controlling the size of PPy). The developed system exhibits a pseudocapacitance of 125 F g−1 at 0.5 A in concentrated KOH.
Sudhakar et al. reported the fabrication of a multilayer PPy/AC nanocomposite for supercapacitor electrode fabrication.249 Here, p-toluene sulfonic acid (PTSA), camphor sulfonic acid (CSA) and benzene sulfonic acid have been employed as supporting electrolytes. Fig. 29 shows a schematic representation of the development of PPy/AC nanocomposite supercapacitor electrodes. The electrodes were sandwiched between polypropylene separators.
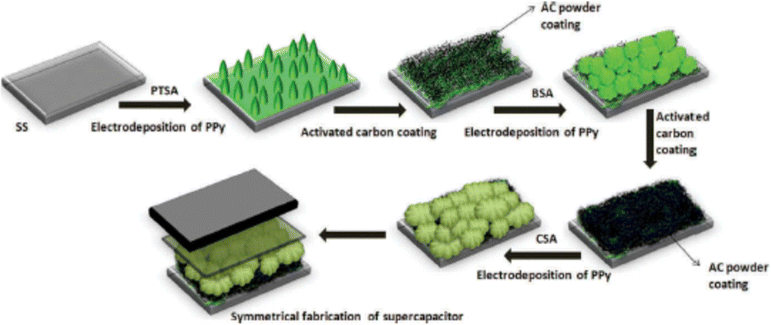 | ||
| Fig. 29 A schematic representation of PPy/AC nanocomposite supercapacitor electrode fabrication; reprinted with permission from ref. 249; copyright @ Taylor & Francis Group [SS: stainless steel]. | ||
Fig. 30 shows the CV loops of single layer and multilayer PPy/AC supercapacitor electrodes. The specific capacitance of electrodes has been evaluated by using the expression249
 | (11) |
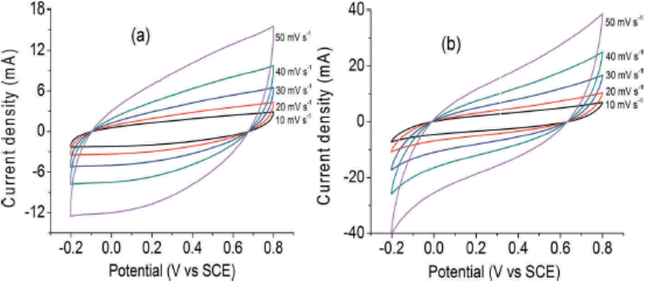 | ||
| Fig. 30 CV loops of (a) single layer PPy/AC supercapacitor electrodes and (b) multilayer supercapacitor electrodes; reprinted with permission from ref. 249; copyright @ Taylor & Francis Group. | ||
The maximum energy, power density and equivalent series resistance obtained were 16 W h kg−1, 5 kW kg−1 and 4.7 Ω respectively. The pores and interconnected channels within PPy/AC multilayer structures provide high specific capacitance. In the first layer, large dopant molecules are found to be strongly bound to PPy and this prevents leaching of dopant molecules from the polymer matrix even in an extreme environment. Also, the smaller dopant molecules employed in the remaining layers are accessible during the charging/discharging cycle. The supporting electrolytes with increasing cationic structures offer a sufficient number of cations to be present in between the layers to attract anions during the discharging, and thereby produce the required energy density for the supercapacitor. Also, the cations are unable to move through the layers, causing minimum capacitance loss during discharging.
Supercapacitor electrodes have been fabricated by using PEDOT:poly(styrene sulfonate) (PSS)/AC and doped PEDOT/AC.250 PEDOT:PSS/AC supercapacitor electrodes possess a capacitance of 640 F g−1 at 10 mV s−1. The high surface area and the porous and conducting backbone of the system maximize the faradaic interactions with the electrolytes and produce high capacitance. Scanning electrochemical microscopic investigations have been carried out to study the surface current profile of the system by using a platinum microelectrode, a Ag/AgCl reference electrode and LiClO4 (0.1 M) as an electrolyte. AC/PEDOT:PSS and AC/doped PEDOT nanocomposites showed a higher surface current profile compared to PEDOT:PSS and doped PEDOT films. AC/doped PEDOT supercapacitor electrodes have a specific capacitance of 1183 F g−1 at 10 mV s−1. PEDOT doping with multiple dopants affects the self-discharging process, and it further depends on the internal resistance and impedance of the electroactive layer. PEDOT/AC nanocomposites have been prepared via chemical polymerisation of EDOT on carbonized bamboo waste and the supercapacitor electrodes showed a specific capacitance of 302 F g−1 at a current density of 0.5 A g−1.251 87% capacitance retention was attained after 10![[thin space (1/6-em)]](https://www.rsc.org/images/entities/char_2009.gif) 000 charging/discharging cycles. The energy density obtained was 30 W h kg−1 at a power density of 0.5 kW kg−1.
000 charging/discharging cycles. The energy density obtained was 30 W h kg−1 at a power density of 0.5 kW kg−1.
3.4. Conducting polymer/3D carbon material nanocomposites
3D carbon nanomaterials are excellent candidates for fabrication of supercapacitor electrodes because of their large surface area, high electrical conductivity and good electrolyte accessibility.252,253 3-D carbon nanomaterials such as carbon fibers, aerogels and carbon cloths containing hierarchical porous structures act as sites for growing conducting polymers. Studies have shown that the carbon-based supercapacitor electrodes sometimes do not exhibit specific capacitance in proportion with their surface area values.254 This may be because some micropores are not accessible to the ions of the electrolyte to react. Therefore, there should be a perfect match in the pore size and size of the ions in the electrolyte to obtain maximum specific capacitance.255High performance supercapacitor electrodes have been made out of graphene/carbon fiber, onto which conducting polymers have been coated. PANI nanorods have been coated onto graphene/carbon fibers via in situ polymerisation, resulting in the formation of nanocomposites with high surface area, enhanced redox rate and low internal resistance.256
Kurungot et al. prepared PEDOT/carbon fiber electrodes for supercapacitor applications.257 The layer of flower like PEDOT on carbon fibers enhances the surface area and the porous structures within the system allow proper immersion of polymer-based gel electrolytes.
Carbon cloths are composed of carbon fiber networks having a diameter in the micrometre range. They have been applied for both free standing and conducting substrate electrodes.258 Well aligned PPy nanowires have been immobilized onto carbon fibers in untreated carbon cloths.259 The electrode material showed a specific capacitance of 699 F g−1 and 82% of the initial capacitance was retained.
Ion and electron transport can be improved by carbon aerogels having an interpenetrating network structure.260 Aerogel based nanocomposites were used as free standing and flexible energy storage devices261 and there is no need of binders in this case. Interconnected nanotubular graphene/PPy nanocomposites have been developed by Chen et al.262 CVD has been used to produce nanotubular graphene, by using a porous nickel template. Cyclic electrochemical deposition of PPy onto core–shell graphene@np-Ni has been done followed by etching of np-Ni. A schematic representation of the synthesis strategy is shown in Fig. 31. A maximum energy density of 22 W h kg−1 and a power density of 33 kW kg−1 can be achieved.
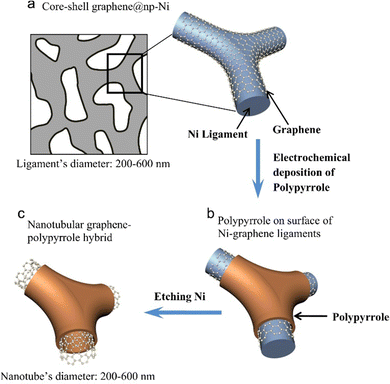 | ||
| Fig. 31 Schematic representation of fabrication of graphene/PPy nanocomposites; reprinted with permission from ref. 262; copyright @ Elsevier. | ||
3.5. Conducting polymer/fullerene nanocomposites
The advantage of fullerenes over other carbon nanomaterials is due to their well-defined molecular structures, which enable easy covalent modification.263,264 During the synthesis of polymer/fullerene nanocomposites, the major challenge faced was the solubility and dispersion of fullerene molecules in the polymer matrix. Lack of solubility leads to aggregation of fullerene molecules, causing a reduction in the desired characteristics of polymer/fullerene nanocomposites.265,266 In order to overcome this, modification or functionalisation of fullerenes has been done.Fullerene based polymer materials have great potential applications owing to their redox properties. Fullerene is an electron deficient material with high electron accepting capacity.267 Charge separating systems can be generated by the interaction of electron deficient fullerenes with electron donating polymeric chains. Depending upon the type of interaction between polymeric chains and fullerenes, different structures can be formed. Fig. 32 depicts the structures of some macromolecular systems based on fullerenes.268
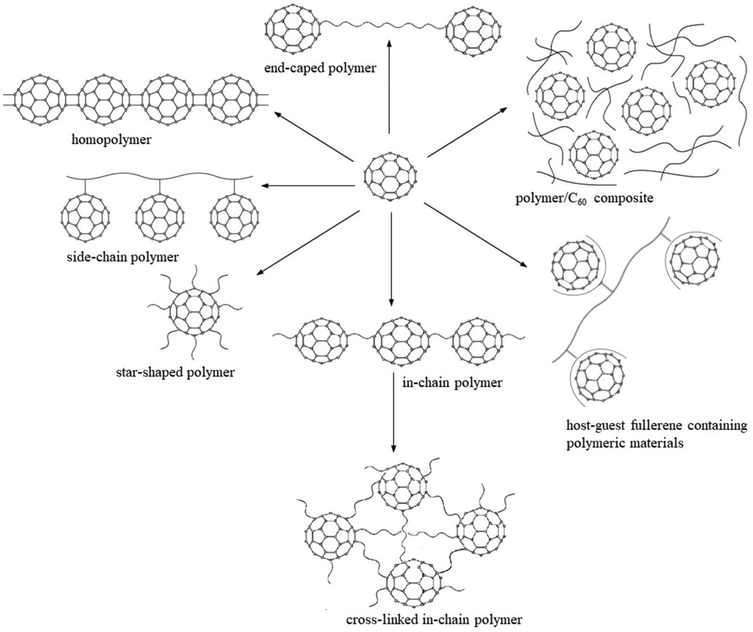 | ||
| Fig. 32 Possible structures formed by the incorporation of polymers onto fullerenes; reprinted with permission from ref. 268; copyright © Wiley Online Library. | ||
It was found that both the polymer and the fullerene in the nanocomposites retain their electrochemical activity. Electrochemical activity of the organic polymer is in the range of positive potential.269 The activity of the organic polymer in the nanocomposite is found to be more positive than that of the pure polymer, because of the electron transfer between the π-conjugated polymer and the fullerene in the nanocomposite.270
The current response of fullerenes under an applied voltage depends on their structure. A weak interaction between the components results in low stability and it may tend the fullerene phase to agglomerate. Incorporation of fullerene molecules covalently into polymeric chains leads to stronger electronic interactions between the components.271 In the nanocomposites, retention of the electrochemical property of fullerene is observed and the properties were found to be stable during the charging and discharging cycle.272 Their capacitance properties were similar to those of conducting organic polymers. In charge storage devices, the polymer/fullerene system can act as both anodic and cathodic material because n-doped properties are exhibited by fullerene/polymer nanocomposites and also polymers are active at the positive potential, they exhibit p-type behaviour. Covalent linkages of some conducting polymers onto fullerene are depicted in Fig. 33.273
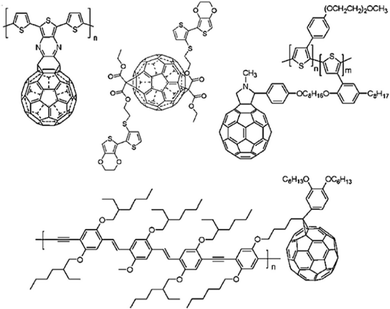 | ||
| Fig. 33 Covalent linkages of conducting polymers onto fullerenes; reprinted with permission from ref. 273; copyright © Royal Society of Chemistry. | ||
The electronic properties of conjugated polymers are significantly influenced by the incorporation of fullerenes.274,275 Electron transfer between the polymer and the fullerene creates higher charge density within the polymer. Mixing of electronic wave functions of polymers and fullerenes leads to the formation of a ground state charge transfer complex. Polarons and bipolarons are created within the forbidden band of the polymer. C60 deformation splits the degenerated (3-fold) LUMO into three levels having energy higher than that of the LUMO of unperturbed fullerene.276 In such a situation, electron transfer is possible between the polarons and bipolarons of polymers and unoccupied energy levels of the fullerene. Fig. 34 shows the energy level diagram of a poly(3-alkylthiophene)/C60 nanocomposite system, with poly(3-alkylthiophene) representing the conjugated polymer.276
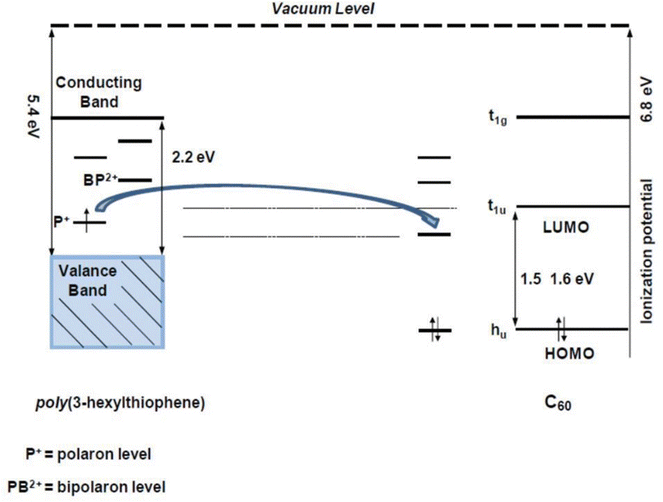 | ||
| Fig. 34 Energy diagram of poly(3-alkylthiophene)/C60 nanocomposites; reprinted with permission from ref. 268; copyright © Wiley Online Library. | ||
When the charge carrier concentration increases, the conductivity also increases.277 However, when the amount of fullerene reaches a limiting value, the conductivity decreases. The electrochemical behaviour of fullerene incorporated polymeric systems generally depends on the structure of the polymer backbone, the density of fullerenes, and if some side chains are linking the fullerenes on to the polymer backbone, then on their length, flexibility and structure.278
PANI/C60 nanocomposites exhibited higher capacitance compared to polyaniline.279 The cyclic voltammogram of the systems is presented in Fig. 35. A specific capacitance of 813 F g−1 at a current density of 1 A g−1 has been attained for PANI/C60 nanocomposites, which is 3 times higher than that of pure polyaniline. Further, the nanocomposites exhibited 85% capacitance retention even after 1500 charging/discharging cycles. Cheng et al. fabricated PANI/polydivinyl benzene (PDVB)/fullerene nanocomposites and investigated their electrical and thermal conductivity.280 The electrical conductivity of PDVB is 8 × 10⁻¹⁰ S m−1 and after the addition of PANI, a 10-fold increase in electrical conductivity was observed. Formation of highly conductive PANI networks in PDVB matrices increases the electrical conductivity of the system. When the PANI content reaches the percolation threshold, a continuous conductive path is formed and leads to significant enhancement in electrical conductivity. Compared to PANI/PDVB systems, PANI/PDVB/C60 nanocomposites exhibit a 3-fold increase in electrical conductivity. C60 acts as an electron acceptor and PANI acts as an electron donor, thereby changing the electron density of PANI. An increase in charge carrier concentration leads to higher electrical conductivity.
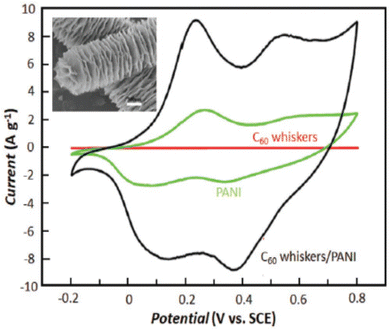 | ||
| Fig. 35 Cyclic voltammogram of C60, polyaniline and their nanocomposites; the SEM image of the nanocomposites is shown in the inset; reprinted with permission from ref. 279; copyright © Elsevier. | ||
The effect of incorporation of a fullerene derivative phenyl-C60-butyric acid methyl ester (PCBM) onto PANI has been reported.281 It was found that there is a two-fold increase in the specific capacitance of the PANI/PCBM electrodes, in comparison with pure PANI. The energy and power density of the electrodes were 62 W h kg−1 and 2250 W kg−1 respectively. In addition, the electrodes exhibited a cyclic stability of 96% capacitance retention even after 1000 cycles. Fig. 36(a) shows the CV curves of PANI and PANI/PCBM nanocomposites at a scan rate of 5 mV s−1. PANI/PCBM-5 (PCBM-5 mg) has a higher integral area indicating the highest specific capacitance. In addition, the redox peak position gets shifted owing to the difference in polarization behaviour.
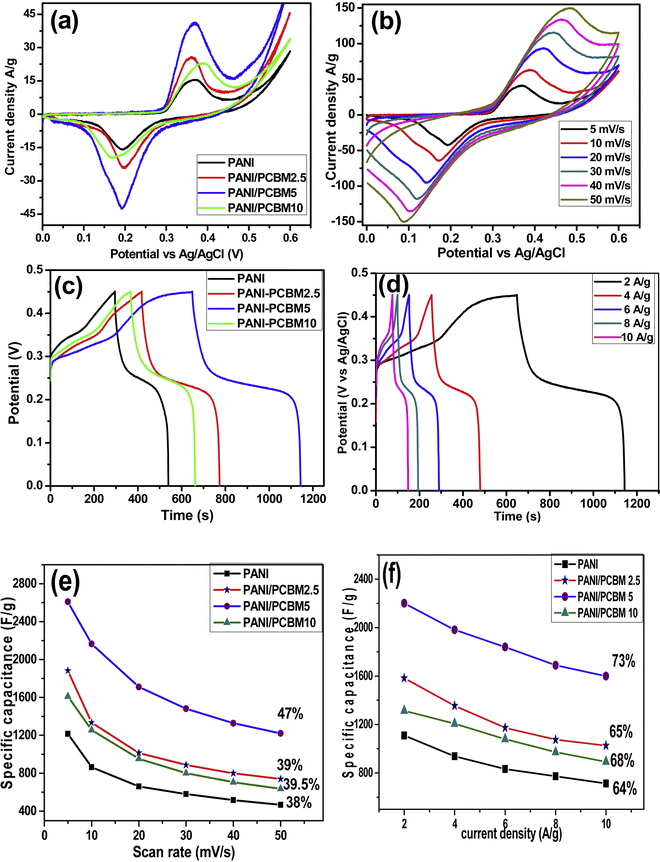 | ||
| Fig. 36 (a) CV curves of PANI and PANI/PCBM nanocomposites at a scan rate of 5 mV s−1. (b) CV curves of PANI/PCBM5 at different scan rates ranging from 5 to 50 mV s−1. (c) Charging–discharging features of the systems at a current density of 2 A g−1. (d) Charging–discharging characteristics of PANI/PCBM5 nanocomposites in a range of current densities from 2 A g−1 to 10 A g−1. (e) Specific capacitance of PANI and PANI/PCBM nanocomposites calculated from CV with respect to the scan rate; reprinted with permission from ref. 281; copyright © Elsevier. | ||
Fig. 36(b) represents the CV curves of PANI/PCBM5 at different scan rates ranging from 5 to 50 mV s−1. At a higher scan rate, both anodic and cathodic peaks are observed, indicating quick redox reactions. As the scan rate increases, the peaks are shifted to higher and lower potentials, owing to electrode polarization. Fig. 36(c) indicates the charging–discharging features of the systems at a current density of 2 A g−1. Two plateau regions are observed, corresponding to the redox peaks of CV. Fig. 36(d) represents the charging–discharging characteristics of PANI/PCBM5 nanocomposites in a range of current densities from 2 A g−1 to 10 A g−1. The PANI/PCBM5 nanocomposites exhibited a specific capacitance of 2201, 1982, 1840, 1689 and 1600 F g−1 at 2, 4, 6, 8 and 10 A g−1 respectively. Fig. 36(e) shows the specific capacitance of PANI and PANI/PCBM nanocomposites calculated from CV with respect to the scan rate. Compared to pure PANI, PANI/PCBM nanocomposites showed higher specific capacitance. The plot of specific capacitance versus current density is depicted in Fig. 36(f).
Bronnikov et al. demonstrated the fabrication of polyazomethine/fullerene nanocomposites, by varying the fullerene loading, in the range of 0.25–2.5 wt%.282 The dielectric loss shows a temperature dependent behaviour. It has been observed that as the C60 content increases from 0.25 to 1.5 wt%, the dielectric loss decreases. The C60 nanoparticles are found to be uniformly distributed within the polymer matrix and hinder network formation, leading to a reduction in the dielectric loss. The maximum dielectric loss has been found for 2.5 wt% C60 loaded polyazomethine, owing to the increase in the conductivity of the nanocomposites due to the formation of fullerene percolation networks. The glass transition temperature (Tg) of the system gets shifted to higher temperatures, owing to an increase in the fragility of the system by interaction of fullerenes with polymers as shown in Fig. 37.
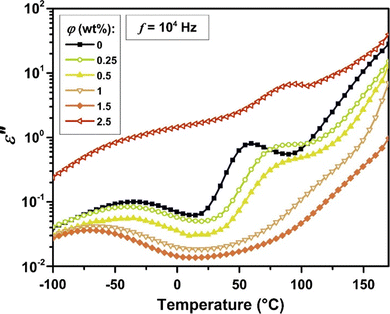 | ||
| Fig. 37 Dielectric loss of polyazomethine/C60 nanocomposites as a function of temperature; reprinted with permission from ref. 282; copyright © Elsevier. | ||
Poly[2-methoxy-5-(2-ethyl) hexoxy-1,4-phenylenevinylene] (MEH-PPV)/C60 nanocomposites have been prepared and their electrical conductivity has been evaluated with respect to C60 loading.283 There was a four-fold increase in the conductivity of the system, after the incorporation of C60 nanoparticles.
As the C60 content increases, the average distance between fullerenes decreases, which allows easy tunnelling of the electrons via physical contact between the partners.
In conclusion, due to the spherical cage structures and the presence of full π electrons on the surface, fullerenes exhibit numerous fascinating properties that have potential for energy related areas. Fullerenes and fullerene derivatives are good electron acceptors. They can accept electrons as well as donate electrons under certain conditions. They show rich oxidation–reduction features, which results in interesting electrochemical characteristics.
4. Summary and outlook
Conducting polymers, owing to their pseudocapacitance ranging theoretically from 200 to 750 F g−1, are good candidates for energy storage applications. However, there is a significant contradiction between the theoretical and experimental values of pseudocapacitance. This difference arises due to the non-availability of some active sites of the polymers and the property can be enormously improved by controlling the polymer morphology at the nanoscale, i.e., make them porous or mix them with other nanofillers. In the present review, up to date thorough analysis of conducting polymer nanocomposites based on carbon nanomaterials for supercapacitor applications has been presented. The issues associated with conducting polymers such as less cyclic stability and low capacitance can be addressed by composite fabrication with carbon nanomaterials. By doing so, excellent energy density and cyclic stability can be achieved.In this review, a detailed investigation of the capacitive performance of conducting polymer nanocomposites based on various carbon nanostructures such as carbon nanotubes, graphene derivatives, activated carbon and fullerenes is reported. It was found that the arrangement of nanostructures in the polymer significantly influences the capacitive performance; aligned nanostructures produce better results. Compared to graphene, graphene derivatives such as graphene oxide, reduced graphene oxide and chemically modified graphene have more surface defects and hence exhibit increased electrochemical capacitance. Conducting polymer/graphene-based nanocomposites showed a gravimetric capacitance ranging from 100 to 1000 F g−1 and a relatively high energy and power density of 45 W h kg−1 and 50 kW h kg−1, depending on the structure and morphology. Fullerene based polymer materials have greater potential applications owing to their redox properties. Compared to other carbon nanomaterials they have the advantages of well-defined molecular structures, owing to which covalent modification is very easy.
In situ and ex situ chemical or electrochemical synthesis strategies have been employed to create conducting polymer nanocomposites for energy storage applications. In the in situ strategy, the as-prepared nanomaterials are added to the monomer before polymerisation. Excellent nanoparticle dispersibility can be achieved by the in situ method, which results in good energy storage characteristics. The difficult aspect of the in situ method is controlling the preparative and development circumstances, which affect the overall performance of the nanocomposite. In the ex situ method, nanomaterials are incorporated into a polymerised matrix.
The properties of the nanocomposite formed by the electrochemical method depend exclusively on the electrode characteristics. For the industrial production, the chemical polymerisation strategy in the presence of oxidising agents is highly favourable. In order to ensure proper diffusion of oxidizing agents, monomers are initially adsorbed on the carbon nanomaterial.
Conducting polymer nanocomposite electrodes will have a momentous role in flexible, smart and economical energy storage applications in the future too. There is a vast option in fine-tuning the structures of conducting polymers via introduction of certain functionalities to improve the results. Fabrication of a ternary polymer nanocomposite system is expected to give better results than a binary system.
Conflicts of interest
The authors declare no conflicts of interest.Acknowledgements
Dr Bindu M. is grateful to KSCSTE for her Back to Lab Post-Doctoral Fellowship (KSCSTE/261/2021 BLP, Council (P) order no: 161/2021/KSCSTE; dated 13-03-2021).References
- H. Liu, Z. Sun, Y. Chen, W. Zhang, X. Chen and C. P. Wong, ACS Nano, 2022, 16, 10088–10129 CrossRef CAS PubMed
.
- L. Liu, Y. Feng and W. Wu, J. Power Sources, 2019, 410, 69–77 CrossRef
.
- E. Hossain, H. Mansur, R. Faruque, Md. S. Haque Sunny and N. M. N. Nawar, Energy, 2020, 13, 3651 CAS
.
- A. Riaz, M. R. Sarker, M. H. M. Saad and R. Mohamed, Sensors, 2021, 21, 5041 CrossRef CAS PubMed
.
- S. Ahankari, D. Lasrado and R. Subramaniam, Mater. Adv., 2022, 3, 1472–1496 RSC
.
- C. Lu and X. Chen, Acc. Chem. Res., 2020, 53, 1468–1477 CrossRef CAS PubMed
.
- L. Miao, Z. Song, D. Zhu, L. Li, L. Gan and M. Liu, Mater. Adv., 2020, 1, 945–966 RSC
.
- F. Bu, W. Zhou, Y. Xu, Y. Du and C. Guan, npj Flex Electron, 2020, 4, 31 CrossRef
.
- S. Rajagopal, R. P. Vallikkattil, M. M. Ibrahim and D. G. Velev, Condens. Matter., 2022, 7, 6 CrossRef CAS
.
- Z. Wu, L. Li, J. Yan and X. Zhang, Adv. Sci., 2017, 4, 1600382 CrossRef
.
- Z. Yu, L. Tetard, L. Zhai and J. Thomas, Energy Environ. Sci., 2015, 8, 702 RSC
.
- B. K. Deka, A. Hazarika, J. Kim, Y. B. Park and H. W. Park, Int. J. Energy Res., 2017, 41, 1397–1411 CrossRef
.
- J. C. Gutierrez, A. Celzard and V. Fierro, Front. Mater., 2020, 7, 1–25 CrossRef
.
- R. Ramachandran and F. Wang, Electrochemical Capacitor Performance: Influence of Aqueous Electrolytes, Supercapacitors-Theoretical and Practical Solutions, IntechOpen, DOI: 10.5772/intechopen.69087, ISBN 978-1-78923-353-7.
- W. Qin, N. Zhou, C. Wu, M. Xie, H. Sun, Y. Guo and L. Pan, ACS Omega, 2020, 5, 3801–3808 CrossRef CAS
.
- R. Chen, D. Bresser, M. Saraf, P. Gerlach, A. Balducci, S. Kunz, D. Schröder, S. Passerini and J. Chen, ChemSusChem, 2020, 13, 2205–2219 CrossRef CAS PubMed
.
- J. N. D. Freitas, J. E. Benedetti, F. S. Freitas, A. F. Nogueira and M. A. D. Paoli, Polymer electrolytes for dye-sensitized solar cells, Woodhead Publishing Series in Electronic and Optical Materials, Polym. Electrolytes, 2010, 381–430 Search PubMed
.
- K. Xu, Chem. Rev., 2004, 104, 4303–4418 CrossRef CAS PubMed
.
- T. Xiong, T. L. Tan, L. Lu, W. S. V. Lee and J. Xue, Adv. Energy Mater., 2018, 8, 1702630–1702640 CrossRef
.
- B. Pal, S. Yang, S. Ramesh, V. Thangadurai and R. Jose, Nanoscale Adv., 2019, 1, 3807 RSC
.
- E. Lim, C. Jo and J. Lee, Nanoscale, 2016, 8, 7827–7833 RSC
.
- S. Liu, L. Wei and H. Wang, Appl. Energy, 2020, 278, 115436 CrossRef CAS
.
- J. Libich, J. Maca, J. Vondrak, O. Cech and M. Sedlaříkova, J. Energy Storage, 2018, 17, 224–227 CrossRef
.
- T. Chen and L. Dai, Mater. Today, 2013, 16, 272–280 CrossRef CAS
.
- M. Zhong, M. Zhang and X. Li, Carbon Energy, 2022, 4, 950–985 CrossRef CAS
.
- S. S. Siwal, Q. Zhang, N. Devi and V. K. Thakur, Polymers, 2020, 12, 505–534 CrossRef CAS
.
- I. J. Gomez, M. V. Sulleiro, D. Mantione and N. Alegret, Polymers, 2021, 13, 745 CrossRef CAS PubMed
.
- S. Trasatti and G. Buzzanca, J. Electroanal. Chem., 1971, 29, A1–5 CrossRef
.
- A. M. Bryan, L. M. Santino, Y. Lu, S. Acharya and J. M. D’Arcy, Chem. Mater., 2016, 28(17), 5989–5998 CrossRef CAS
.
- T. Ö. Varol, S. Topal, Ö. Haklı, E. Sezer, Ü. Anık and T. Öztürk, J. Appl. Polym. Sci., 2020, 138, app50234 Search PubMed
.
- Y. Shi and G. Yu, Chem. Mater., 2016, 28, 2466–2477 CrossRef CAS
.
- F. Zhong, M. Ma, Z. Zhong, X. Lin and M. Chen, Chem. Sci., 2021, 12, 1783–1790 RSC
.
- L. Lizarraga, E. M. Andrade and F. V. Molina, J. Electroanal. Chem., 2004, 561, 127–135 CrossRef CAS
.
- Y. Xu, J. Wang and W. Sun, J. Power Sources, 2006, 159, 370–373 CrossRef CAS
.
- X. Li, L. Yang, Y. Lie, L. Gu and D. Xiao, ACS Appl. Mater. Interfaces, 2014, 6, 19978–19989 CrossRef CAS PubMed
.
- H. Kwon, D. Hong, I. Ryu and S. Yim, ACS Appl. Mater. Interfaces, 2017, 9, 7412–7423 CrossRef CAS PubMed
.
- K. Namsheer and C. S. Rout, RSC Adv., 2021, 11, 5659–5697 RSC
.
- B. Zhu, E. W. C. Chan, S. Y. Li, X. Sun and J. T. Sejdic, J. Mater. Chem. C, 2022, 10, 14882–14891 RSC
.
- A. V. Volkov, H. Sun, R. Kroon, T. P. Ruoko, C. Che, J. Edberg, C. Müller, S. Fabiano and X. Crispin, ACS Appl. Energy Mater., 2019, 2, 5350–5355 CrossRef CAS
.
- K. Xie, M. Zhang, Y. Yang, L. Zhao and W. Qi, Nanoscale Res. Lett., 2018, 13, 163 CrossRef PubMed
.
- T. Zhang, H. Yue, X. Gao, F. Yao, H. Chen, X. Lu, Y. Wang and X. Guo, Dalton Trans., 2020, 49, 3304–3311 RSC
.
- Z. Huang, Z. Ji, Y. Feng, P. Wang and Y. Huang, Polym. Int., 2020, 70, 437–442 CrossRef
.
- B. Senthilkumar, P. Thenamirtham and R. K. Selvan, Appl. Surf. Sci., 2011, 257, 9063–9067 CrossRef CAS
.
- A. Laforgue, P. Simon, C. Sarrazin and J. F. Fauvarque, J. Power Sources, 1999, 80, 142–148 CrossRef CAS
.
- A. Rahman, H. Noreen, Z. Nawaz, J. Iqbal, G. Rahman and M. Yaseen, New J. Chem., 2021, 45, 16187–16195 RSC
.
- S. Khasim, A. Pasha, N. Badi, M. Lakshmi and Y. K. Mishra, RSC Adv., 2020, 10, 10526–10539 RSC
.
- L. Manjakkal, A. Pullanchiyodan, N. Yogeswaran, E. S. Hosseini and R. Dahiya, Adv. Mater., 2020, 1907254, DOI:10.1002/adma.201907254
.
- H. Wang, Y. Diao, Y. Lu, H. Yang, Q. Zhou, K. Chrulski and J. M. D’Arcy, Nat. Commun., 2020, 11, 3882 CrossRef CAS PubMed
.
- S. Deshagani, A. Das, D. Nepak and M. Deepa, ACS Appl. Polym. Mater., 2020, 2, 1190–1202 CrossRef CAS
.
- A. Das, M. Ojha, P. Subramanyam and M. Deepa, Nanoscale Adv., 2020, 2, 2925–2942 RSC
.
- J. E. l Nady, A. Shokry, M. Khalil, S. Ebrahim, A. M. Elshaer and M. Anas, Sci. Rep., 2022, 12, 3611 CrossRef
.
- L. Li, Z. Wei, J. Liang, J. Ma and S. Huang, Results Chem., 2021, 3, 100205 CrossRef CAS
.
- Y. Ren, Y. Liu, S. Wang, Q. Wang, S. Li, W. Wang and X. Dong, Carbon Energy, 2022, 4, 527–538 CrossRef CAS
.
- A. N. Andriianova, Y. N. Biglova and A. G. Mustafin, RSC Adv., 2020, 10, 7468–7491 RSC
.
- Y. Zheng, M. Ashizawa, S. Zhang, J. Kang, S. Nikzad, Z. Yu, Y. Ochiai, H. C. Wu, H. Tran, J. Mun, Y. Q. Zheng, J. B. H. Tok, X. Gu and Z. Bao, Chem. Mater., 2020, 32, 5700–5714 CrossRef CAS
.
- J. Kim, J. Lee, J. You, M. S. Park, M. S. A. Hossain, Y. Yamauchi and J. H. Kim, Mater. Horiz., 2016, 3, 517–535 RSC
.
- Y. Wang, G. Liu, Y. Liu, J. Yang, P. Liu, Q. Jiang, F. Jiang, C. Liu, W. Ding and J. Xu, Appl. Surf. Sci., 2021, 558, 149910 CrossRef CAS
.
- Y. Han and L. Dai, Macromol. Chem. Phys., 2019, 1800355, DOI:10.1002/macp.201800355
.
- K. D. Fong, T. Wang and S. K. Smoukov, Sustainable. Energy Fuels, 2017, 1, 1857–1874 RSC
.
- L. E. Helseth, J. Energy Storage, 2021, 35, 102304–102313 CrossRef
.
- Y. C. Liu and K. Xie, Sci. Adv. Mater., 2014, 6, 863–874 CrossRef CAS
.
- D. Guo, L. Lai, A. Cao, H. Liu, S. Dou and J. Ma, RSC Adv., 2015, 5, 55856–55869 RSC
.
- J. M. D’Arcy, M. F. El-Kady, P. P. Khine, L. Zhang, L. S. H. Lee, N. R. Davis, D. S. Liu, M. T. Yeung, S. Y. Kim and C. L. Turner, ACS Nano, 2014, 8, 1500–1510 CrossRef PubMed
.
- G. A. Snook, P. Kao and A. S. Best, J. Power Sources, 2011, 196, 1–12 CrossRef CAS
.
- J. L. Brédas and G. B. Street, Acc. Chem. Res., 1985, 18, 309–315 CrossRef
.
- R. B. Kaner and A. G. MacDiarmid, Sci. Am., 1988, 258, 106–111 CrossRef CAS
.
- G. R. Mitchell, F. J. Davis and C. H. Legge, Synth. Met., 1988, 26, 247–257 CrossRef CAS
.
- M. S. Nevius, M. Conrad, F. Wang, A. Celis, M. N. Nair, A. T. Ibrahimi, A. Tejeda and E. H. Conrad, Phys. Rev. Lett., 2015, 115, 136802–136806 CrossRef CAS PubMed
.
- A. M. Bryan, L. M. Santino, Y. Lu, S. Acharya and J. M. D’Arcy, Chem. Mater., 2016, 28, 5989–5998 CrossRef CAS
.
- L. B. Groenendaal, F. Jonas, D. Freitag, H. Pielartzik and J. R. Reynolds, Adv. Mater., 2000, 12, 481–494 CrossRef CAS
.
- K. Lee, S. Cho, S. H. Park, A. J. Heeger, C. W. Lee and S. H. Lee, Nature, 2006, 441, 65–68 CrossRef CAS PubMed
.
- G. MacDiarmid and A. J. Epstein, Synth. Met., 1994, 65, 103–116 CrossRef
.
- A. G. MacDiarmid, R. J. Mammone, R. B. Kaner, S. J. Porter, R. Pethig, A. J. Heeger and D. R. Rosseinsky, Trans. R. Soc. A, 1985, 314, 3–15 Search PubMed
.
- O. Bubnova, Z. U. Khan, H. Wang, S. Braun, D. R. Evans, M. Fabretto, P. H. Talemi, D. Dagnelund, J. B. Arlin and Y. H. Geerts, Nat. Mater., 2014, 13, 190–194 CrossRef CAS PubMed
.
- G. Gu and G. Yushin, WIREs Energy Environ., 2014, 3, 424–473 CrossRef
.
-
T. Pandolfo, V. Ruiz, S. Sivakkumar and J. Nerkar, General Properties of Electrochemical Capacitors, in Supercapacitors: Materials, Systems and Applications, ed. Béguin, F. and Frackowiak, E., Wiley-VCH, Weinheim, Germany, 2013, ch. 2, p 87 Search PubMed
.
- W. A. Christinelli, R. Gonçalves and E. C. Pereira, J. Power Sources, 2016, 303, 73–80 CrossRef CAS
.
- K. Janus, D. Chlebosz, A. Janke, W. Goldeman and A. Kiersnowski, Macromolecules, 2023, 56, 964–973 CrossRef CAS
.
- G. A. Snook, C. Peng, D. J. Fray and G. Z. Chen, Electrochem. Commun., 2007, 9, 83–88 CrossRef CAS
.
- B. Cho, K. S. Park, J. Baek, H. S. Oh, Y. E. K. Lee and M. M. Sung, Nano Lett., 2014, 14, 3321–3327 CrossRef CAS PubMed
.
- M. E. Abdelhamid, A. P. O’Mullane and G. A. Snook, RSC Adv., 2015, 5, 11611–11626 RSC
.
- W. Tian, X. Mao, P. Brown, G. C. Rutledge and T. A. Hatton, Adv. Funct. Mater., 2015, 25, 4803–4813 CrossRef CAS
.
- S. Cho, K. H. Shin and J. Jang, ACS Appl. Mater. Interfaces, 2013, 5, 9186–9193 CrossRef CAS PubMed
.
- Y. Song, T. Y. Liu, X. X. Xu, D. Y. Feng, Y. Li and X. X. Liu, Adv. Funct. Mater., 2015, 25, 4626–4632 CrossRef CAS
.
- Z. Dai, C. Peng, J. H. Chae, K. C. Ng and G. Z. Chen, Sci. Rep., 2015, 5, 9854 CrossRef CAS PubMed
.
- J. Zhu, Y. Xu, J. Wang, J. Lin, X. Sun and S. Mao, Phys. Chem. Chem. Phys., 2015, 17, 28666–28673 RSC
.
- J. Heck, J. Goding, R. P. Lara and R. Green, Acta Biomater., 2022, 139, 259–279 CrossRef CAS PubMed
.
- Y. Shi, L. Peng, Y. Ding, Y. Zhao and G. Yu, Chem. Soc. Rev., 2015, 44, 6684–6696 RSC
.
- R. Brooke, P. Cottis, P. Talemi, M. Fabretto, P. Murphy and D. Evans, Prog. Mater. Sci., 2017, 86, 127–146 CrossRef CAS
.
- M. Wang, S. Kee, D. Barker and J. T. Sejdic, Eur. Polym. J., 2020, 125, 109508 CrossRef CAS
.
- A. Guyot, K. Landfester, F. J. Schork and C. Wang, Prog. Polym. Sci., 2007, 32, 1439–1461 CrossRef CAS
.
- P. A. Lovell and F. J. Schork, Biomacromolecules, 2020, 21, 4396–4441 CrossRef CAS PubMed
.
-
M. A. Raza, Z. U. Rehman, M. Gulraiz, T. Muhammad and F. Maqsood, Metal oxide-conducting polymer-based composite electrodes for energy storage applications, Renewable Polymers and Polymer-Metal Oxide Composites, Elsevier, 2022, pp. 195–251 Search PubMed
.
- T. A. Taha and M. H. Mahmoud, Mater. Chem. Phys., 2021, 270, 124827 CrossRef CAS
.
- S. Rajagopal, R. P. Vallikkattil, M. M. Ibrahim and D. G. Velev, Condens. Matter, 2022, 7, 6 CrossRef CAS
.
- P. Forouzandeh, V. Kumaravel and S. C. Pillai, Catalysts, 2020, 10, 969 CrossRef CAS
.
- J. Hong, T. T. Mengesha, S. W. Hong, H. K. Kim and Y. H. Hwang, J. Korean Phys. Soc., 2020, 76, 264–272 CrossRef CAS
.
- M. F. E. Kady, Y. Shao and R. B. Kaner, Nat. Rev. Mater., 2016, 1, 16033 CrossRef
.
- M. F. L. De Volder, S. H. Tawfick, R. H. Baughman and A. J. Hart, Science, 2013, 339, 535–539 CrossRef CAS PubMed
.
- S. Yu, N. Yang, S. Liu and X. Jiang, Curr. Opin. Solid State Mater. Sci., 2021, 25, 100922 CrossRef CAS
.
- B. A. Ali, A. H. Biby and N. K. Allam, ChemElectroChem, 2020, 7, 1672–1678 CrossRef CAS
.
- S. Z. Al Sheheri, Z. M. Al-Amshany, Q. A. Al Sulami, N. Y. Tashkandi, M. A. Hussein and R. M. El-Shishtawy, Des. Monomers Polym., 2019, 22, 8–53 CrossRef CAS PubMed
.
- P. C. Ma, N. A. Siddiqui, G. Marom and J. K. Kim, Composites, Part A, 2010, 41, 1345–1367 CrossRef
.
- J. Chen, L. Yan, W. Song and D. Xu, Composites, Part A, 2018, 114, 149–169 CrossRef CAS
.
- A. M. D. Pascual, Macromol, 2021, 1, 64–83 Search PubMed
.
- E. M. Rhazi, S. Majid, M. Elbasri, F. E. Salih, L. Oularbi and K. Lafdi, Int. Nano Lett., 2018, 8, 79–99 CrossRef
.
- S. Sharma, P. Sudhakara, A. A. B. Omran, J. Singh and R. A. Ilyas, Polymers, 2021, 13, 2898 CrossRef CAS PubMed
.
- D. N. Nguyen and H. Yoon, Polymers, 2016, 8, 118 CrossRef PubMed
.
- A. O. Oliveira, G. A. O. Brito and M. F. S. Teixeira, ACS Omega, 2020, 5, 25954–25967 CrossRef PubMed
.
- Y. Yang, C. Han, B. Jiang, J. Iocozzia, C. He, D. Shi, T. Jiang and Z. Lin, Mater. Sci. Eng., R, 2016, 102, 1–72 CrossRef
.
- T. Lee, S. H. Min, M. Gu, Y. K. Jung, W. Lee, J. U. Lee, D. G. Seong and B. S. Kim, Chem. Mater., 2015, 27, 3785–3796 CrossRef CAS
.
- Z. Hou, Q. Yang, H. Lu and Y. Li, J. Appl. Polym. Sci., 2016, 133, 42995–43001 CrossRef
.
- O. Kanoun, A. Bouhamed, R. Ramalingame, J. R. B. Quijano, D. Rajendran and A. A. Hamry, Sensors, 2021, 21, 341–369 CrossRef CAS PubMed
.
- N. F. Zorn and J. Zaumseil, Appl. Phys. Rev., 2021, 8, 041318 CAS
.
- J. H. Park, H. J. Lee, J. Y. Cho, S. Jeong, H. Y. Kim, J. H. Kim, S. H. Seo, H. J. Jeong, S. Y. Jeong, G. W. Lee and J. Tark Han, ACS Appl. Mater. Interfaces, 2020, 12, 1322–1329 CrossRef CAS PubMed
.
- A. L. Raus, J. Patmore, L. Kurzepa, J. Bulmer and K. Koziol, Adv. Funct. Mater., 2014, 24, 3661–3682 CrossRef
.
- B. Earp, D. Dunn, J. Phillips, R. Agrawal, T. Ansell, P. Aceves, I. D. Rosa, W. Xin and C. Luhrs, Mater. Res. Bull., 2020, 131, 110969 CrossRef CAS
.
- B. Aissa, A. Habib and E. A. Hafidh, Int. J. Mater. Eng. Innov., 2015, 63, 185–223 CrossRef
.
- J. Pan and L. Bian, Acta Mech., 2017, 228, 2207–2217 CrossRef
.
- D. Kim, T. Lee, M. Kwon, H. J. Paik, J. H. Han, M. Kang, J. Choi, S. Hong and Y. A. Kim, RSC Adv., 2020, 10, 26262–26267 RSC
.
- T. Farrell, K. Wang, C. W. Lin and R. B. Kaner, Polymer, 2017, 129, 1–4 CrossRef CAS
.
- S. Z. Ozkan, G. P. Karpacheva, A. I. Kostev and G. N. Bondarenko, Polymers, 2019, 11, 1181 CrossRef PubMed
.
- M. Jebli, Ch Rayssi, J. Dhahri, M. B. Henda, H. Belmabrouk and A. Bajahzar, RSC Adv., 2021, 11, 23664–23678 RSC
.
- J. Thibodeau and A. Ignaszak, Polymers, 2020, 12, 181 CrossRef CAS PubMed
.
- J. Manuel, X. Zhao, K. K. Cho, J. K. Kim and J. H. Ahn, ACS Sustainable Chem. Eng., 2018, 6, 8159–8166 CrossRef CAS
.
- Z. Niu, P. Luan, Q. Shao, H. Dong, J. Li, J. Chen, D. Zhao, L. Cai, W. Zhou, X. Chen and S. Xie, Energy Environ. Sci., 2012, 5, 8726–8733 RSC
.
- P. S. Goh, A. F. Ismail and B. C. Ng, Composites, Part A, 2014, 56, 103–126 CrossRef CAS
.
- H. Luo, X. Zhou, C. Ellingford, Y. Zhang, S. Chen, K. Zhou, D. Zhang, C. R. Bowen and C. Wan, Chem. Soc. Rev., 2019, 48, 4424 RSC
.
- Y. Wang, S. Zang and Y. Deng, Mater. Lett., 2016, 164, 132–135 CrossRef CAS
.
- Z. Zhang, Y. Zhang, K. Yang, K. Yi, Z. Zhou, A. Huang, K. Mai and X. Lu, J. Mater. Chem. A, 2015, 3, 1884–1889 RSC
.
- R. Malik, L. Zhang, C. McConnell, M. Schott, Y. Y. Hsieh, R. Noga, N. T. Alvarez and V. Shanov, Carbon, 2017, 116, 579–590 CrossRef CAS
.
- H. Lin, L. Li, J. Ren, Z. Cai, L. Qiu, Z. Yang and H. Peng, Sci. Rep., 2012, 3, 1353 CrossRef PubMed
.
- B. Che, H. Li, D. Zhou, Y. Zhang, Z. Zeng, C. Zhao, C. He, E. Liu and X. Lu, Composites, Part B, 2019, 165, 671–678 CrossRef CAS
.
- G. Chakraborty, K. Gupta, D. Rana and A. K. Meikap, Adv. Nat. Sci.: Nanosci. Nanotechnol., 2012, 3, 35015 Search PubMed
.
- N. Lachman, H. Xu, Y. Zhou, M. Ghaffari, M. Lin, D. Bhattacharyya, A. Ugur, K. K. Gleason, Q. M. Zhang and B. L. Wardle, Adv. Mater. Interfaces, 2014, 1400076, DOI:10.1002/admi.201400076
.
- F. Branzoi and V. Branzoi, J. Surf. Eng. Mater. Adv. Technol., 2014, 4, 164–179 Search PubMed
.
- K. Lota, V. Khomenko and E. Frackowiak, J. Phys. Chem. Solids, 2004, 65, 295–301 CrossRef CAS
.
- Y. Liang, W. Zhang, D. Wu, Q. Q. Ni and M. Q. Zhang, Adv. Mater. Interfaces, 2018, 5, 1800430 CrossRef
.
- Y. Shi, L. Pan, B. Liu, Y. Wang, Y. Cui, Z. Bao and G. Yu, J. Mater. Chem. A, 2014, 2, 6086–6091 RSC
.
- Y. Huang, J. Tao, W. Meng, M. Zhu, Y. Huang, Y. Fu, Y. Gao and C. Zhi, Nano Energy, 2015, 11, 518–525 CrossRef CAS
.
- C. Jayesh and K. K. Kamal, J. Mater. Chem. A, 2016, 4, 9910–9922 RSC
.
- D. Zhang, Q. Q. Dong, X. Wang, W. Yan, W. Deng and L. Y. Shi, J. Phys. Chem. C, 2013, 117, 20446–20455 CrossRef CAS
.
- F. Luan, G. Wang, Y. Ling, X. Lu, H. Wang, Y. Tong, X. X. Liu and Y. Li, Nanoscale, 2013, 5, 7984 RSC
.
- J. J. A. Espinoza, C. P. de Melo and H. P. de Oliveira, ACS Omega, 2017, 2, 2866–2877 CrossRef PubMed
.
- H. Fu, Z. Du, W. Zou, H. Li and C. Zhang, J. Mater. Chem. A, 2013, 1, 14943–14950 RSC
.
- Y. K. Lee, K. J. Lee, D. S. Kim, D. J. Lee and J. Y. Kim, Synth. Met., 2010, 160, 814–818 CrossRef CAS
.
- V. Khomenko, E. Frackowiak and F. Beguin, Electrochim. Acta, 2005, 50, 2499–2506 CrossRef CAS
.
- P. Li, E. Shi, Y. Yang, Y. Shang, Q. Peng, S. Wu, J. Wei, K. Wang, H. Zhu and Q. Yuan, Nano Res., 2014, 7, 209–218 CrossRef CAS
.
- R. Xu, J. Wei, F. Guo, X. Cui, T. Zhang, H. Zhu, K. Wang and D. Wu, RSC Adv., 2015, 5, 22015–22021 RSC
.
- F. M. Guo, R. Q. Xu, X. Cui, L. Zhang, K. L. Wang, Y. W. Yao and J. Q. Wei, J. Mater. Chem. A, 2016, 4, 9311–9318 RSC
.
- Y. Zhou, Z. Y. Qin, L. Li, Y. Zhang, Y. L. Wei, L. F. Wang and M. F. Zhu, Electrochim. Acta, 2010, 55, 3904–3908 CrossRef CAS
.
- S. R. Sivakkumar, W. J. Kim, J. A. Choi, D. R. MacFarlane, M. Forsyth and D. W. Kim, J. Power Sources, 2007, 171, 1062 CrossRef CAS
.
- W. Zhang, Y. Kong, X. Jin, B. Yan, G. Diao and Y. Piao, Electrochim. Acta, 2020, 331, 135345 CrossRef CAS
.
- X. Lu, C. Wang, F. Favier and N. Pinna, Adv. Energy Mater., 2016, 7, 1601301 CrossRef
.
- A. Aydinli, R. Yuksel and H. E. Unalan, Int. J. Hydrogen Energy, 2018, 43, 18617–18625 CrossRef CAS
.
- F. Liu, S. Luo, D. Liu, W. Chen, Y. Huang, L. Dong and L. Wang, Appl. Mater. Interfaces, 2017, 9, 33791–33801 CrossRef CAS PubMed
.
- J. Ge, G. Cheng and L. Chen, Nanoscale, 2011, 3, 3084 RSC
.
- M. Tebyetekerwa, S. Yang, S. Peng, Z. Xu, W. Shao, D. Pan, S. Ramakrishna and M. Zhu, Electrochim. Acta, 2017, 247, 400–409 CrossRef CAS
.
- W. Wang and S. Wu, Appl. Surf. Sci., 2017, 396, 1360–1367 CrossRef CAS
.
- R. Oraon, A. D. Adhikari, S. K. Tiwari, S. Bhattacharyya and G. C. Nayak, RSC Adv., 2016, 6, 64271–64284 RSC
.
- A. M. Obeidat and A. C. Rastogi, Meet. Abstr., 2016, MA2016-01, 13 Search PubMed
.
- R. J. Silva, Ravi M. A. P. Lima, M. C. A. Oliveira, J. J. A. Espinoza, C. P. Melo and H. P. de Oliveira, J. Electroanal. Chem., 2020, 856, 113658 CrossRef
.
- X. Lu, H. Dou, C. Yuan, S. Yang, L. Hao, F. Zhang, L. Shen, L. Zhang and X. Zhang, J. Power Sources, 2012, 197, 319–324 CrossRef CAS
.
- K. S. Lee, J. Y. Kim, J. Park, J. M. Ko and S. Mugobera, Materials, 2022, 15, 5804 CrossRef CAS PubMed
.
- S. Paul, Y. S. Lee, J. Choi, Y. C. Kang and D. W. Kim, Bull. Korean Chem. Soc., 2010, 31, 1228–1232 CrossRef CAS
.
- J. Cherusseri and K. K. Kar, J. Mater. Chem. A, 2016, 4, 9910–9922 RSC
.
- Y. Yesi, I. Shown, A. Ganguly, T. T. Ngo, L. C. Chen and K. H. Chen, ChemSusChem, 2016, 9, 370–378 CrossRef CAS PubMed
.
- Y. Su and I. Zhitomirsky, Appl. Energy, 2015, 153, 48–55 CrossRef CAS
.
- X. Li and I. Zhitomirsky, Electrodeposition of polypyrrole carbon nanotube composites for electrochemical supercapacitors, J. Power Sources, 2013, 221, 49–56 CrossRef CAS
.
- K. Ryu, H. Xue and J. Park, J. Chem. Technol. Biotechnol., 2013, 88, 788–793 CrossRef CAS
.
- J. Oh, M. E. Kozlov, B. G. Kim, H. K. Kim, R. H. Baughman and Y. H. Hwang, Synth. Met., 2008, 158, 638–641 CrossRef CAS
.
- T. Qian, X. Zhou, C. Yu, S. Wu and J. Shen, J. Mater. Chem. A, 2013, 1, 15230 RSC
.
- L. Yang, Z. Shi and W. Yang, Electrochim. Acta, 2015, 153, 76–82 CrossRef CAS
.
- S. Huang, P. Chen, W. Lin, S. Lyu, G. Chen, X. Yin and W. Chen, RSC Adv., 2016, 6, 13359–13364 RSC
.
- C. Liu, Z. Cai, Y. Zhao, H. Zhao and F. Ge, Cellulose, 2016, 23, 637–648 CrossRef CAS
.
- H. Zhang, Z. Hu, M. Li, L. Hu and S. Jiao, J. Mater. Chem. A, 2014, 2, 17024 RSC
.
- A. Shokry, M. Karim, M. Khalil, S. Ebrahim and J. E. Nady, Sci. Rep., 2022, 12, 11278 CrossRef CAS PubMed
.
- A. K. Thakur, M. Majumder, R. B. Choudhary and S. N. Pimpalkar, IOP Conf. Ser. Mater. Sci. Eng., 2016, 149, 012166 CrossRef
.
- C. Fu, H. Zhou, R. Liu, Z. Huang, J. Chen and Y. Kuang, Mater. Chem. Phys., 2012, 132, 596–600 CrossRef CAS
.
- M. Zhou, Y. Li, Q. Gong, Z. Xia, Y. Yang, X. Liu, J. Wang and Q. Gao, Chem. Electron. Chem., 2019, 6, 4595–4607 CAS
.
- P. Sivaraman, A. R. Bhattacharrya, S. P. Mishra, A. P. Thakur, K. Shashidhara and A. B. Samui, Electrochim. Acta, 2013, 94, 182–191 CrossRef CAS
.
- M. Karakoti, S. Pandey, G. Tatrari, P. S. Dhapola, R. Jangra, S. Dhali, M. Pathak, S. Mahendia and N. G. Sahoo, Mater. Adv., 2022, 3, 2146–2157 RSC
.
- D. Y. Wu and J. J. Shao, Mater. Chem. Front., 2021, 5, 557–583 RSC
.
- B. Pattanayak, P. A. Le, D. Panda, F. M. Simanjuntak, K. H. Wei, T. Winie and T. Y. Tseng, RSC Adv., 2022, 12, 27082–27093 RSC
.
- N. Kumar, S. B. Kim, S. Y. Lee and S. J. Park, Nanomaterials, 2022, 12, 3708 CrossRef CAS PubMed
.
- A. T. Smith, A. M. Chance, S. Zeng, B. Liu and L. Sun, Nanomater. Sci., 2019, 1, 31–47 Search PubMed
.
- M. P. Down, S. J. R. Neale, G. C. Smith and C. E. Banks, ACS Appl. Energy Mater., 2018, 1, 707–714 CrossRef CAS
.
- S. Korkmaz and I. A. Kariper, J. Energy storage, 2020, 27, 101038 CrossRef
.
- Y. Gao, Nanoscale Res. Lett., 2017, 12, 387 CrossRef PubMed
.
- Q. Li, M. Horn, Y. Wang, J. M. Leod, N. Motta and J. Liu, Materials, 2019, 12, 703 CrossRef CAS PubMed
.
- V. Georgakilas, J. N. Tiwari, K. C. Kemp, J. A. Perman, A. B. Bourlinos, K. S. Kim and R. Zboril, Chem. Rev., 2016, 116, 5464–5519 CrossRef CAS PubMed
.
- G. Konwar, J. Deka, K. Raidongia and D. Mahanta, New J. Chem., 2021, 45, 17909–17917 RSC
.
- A. Petrovski, P. Paunović, R. Avolio, M. E. Errico, M. Cocca, G. Gentile, A. Grozdanov, M. Avella, J. Barton and A. Dimitrov, Mater. Chem. Phys., 2017, 185, 83–90 CrossRef CAS
.
- N. P. S. Chauhan, M. Mozafari, N. S. Chundawat, K. Meghwal, R. Ameta and S. C. Ameta, J. Ind. Eng. Chem., 2016, 36, 13–29 CrossRef CAS
.
- Y. Zhao, M. Arowo, W. Wu, H. Zou, J. Chen and G. Chu, J. Ind. Eng. Chem., 2015, 25, 280–287 CrossRef CAS
.
- H. Gul, A. A. Shah, U. Krewer and S. Bilal, Nanomaterials, 2020, 10, 118 CrossRef CAS PubMed
.
- C. Dong, X. Zhang, Y. Yu, L. Huang, J. Li, Y. Wu and Z. Liu, Chem. Commun., 2020, 56, 11993–11996 RSC
.
- K. G. Laelabadi, R. Moradian and I. Manouchehri, ACS Appl. Energy Mater., 2020, 3, 5301–5312 CrossRef
.
- S. Zhou, H. Zhang, Q. Zhao, X. Wang, J. Li and F. Wang, Carbon, 2013, 52, 440–450 CrossRef CAS
.
- N. A. Kumar, H. J. Choi, Y. R. Shin, D. W. Chang, L. Dai and J. B. Baek, ACS Nano, 2012, 6, 1715–1723 CrossRef CAS PubMed
.
- A. Moyseowicz and G. Gryglewicz, Composites, Part B, 2019, 159, 4–12 CrossRef CAS
.
- J. Wen, Y. Ding, J. Zhong, R. Chen, F. Gao, Y. Qiao, C. Fu, J. Wang, L. Shen and H. He, RSC Adv., 2020, 10, 41503 RSC
.
- H. Feng, B. Wang, L. Tan, N. Chen, N. Wang and B. Chen, J. Power Sources, 2014, 246, 621–628 CrossRef CAS
.
- R. Ghanbari, M. E. Shabestari, E. N. Kalali, Y. Hu and S. R. Ghorbani, Ionics, 2021, 27, 1279–1290 CrossRef CAS
.
- Y. Song, J. L. Xu and X. X. Liu, J. Power Sources, 2014, 249, 45–58 Search PubMed
.
- C. J. Raj, B. C. Kim, W. J. Cho, W. Lee, S. D. Jung, Y. H. Kim, S. Y. Park and K. H. Yu, ACS Appl. Mater. Interfaces, 2015, 7, 13405–13414 CrossRef CAS PubMed
.
- L. Lai, L. Wang, H. Yang and N. G. Sahoo, Nano Energy, 2012, 1, 723–731 CrossRef CAS
.
- H. Zhou, G. Han, Y. Xiao, Y. Chang and H. J. Zhai, J. Power Sources, 2014, 263, 259–267 CrossRef CAS
.
- I. Marriam, Y. Wang and M. Tebyetekerwa, Energy Storage Mater., 2020, 33, 336–359 CrossRef
.
- X. Cai, K. Sun, Y. Qiu and X. Jiao, Crystals, 2021, 11, 947 CrossRef CAS
.
- X. Hong, Y. Liu, Y. Li, X. Wang, J. Fu and X. Wang, Polymers, 2020, 12, 331 CrossRef CAS PubMed
.
- H. Mudila, P. Prasher, M. Kumar, A. Kumar, M. G. H. Zaidi and A. Kumar, Mater. Renewable Sustainable Energy, 2019, 8, 9 CrossRef
.
- Q. Zhou, D. Zhu, X. Ma, J. Xu, W. Zhou and F. Zhao, RSC Adv., 2016, 6, 29840–29847 RSC
.
- H. Mudila, S. Rana, M. G. H. Zaidi and S. Alam, Fuller. Nanotub. Carbon Nanostructures, 2014, 23, 20–26 CrossRef
.
- R. B. Choudhari, S. Ansari and B. Purty, J. Energy Storage, 2020, 29, 101302 CrossRef
.
- S. Li, Y. Chen, X. He, X. Mao, Y. Zhou, J. Xu and Y. Yang, Nanoscale Res. Lett., 2019, 14, 226 CrossRef PubMed
.
- N. H. N. Azman, H. N. Lim and Y. Sulaiman, Electrochim. Acta, 2016, 188, 785–792 CrossRef
.
- J. Xue, Q. Sun, Y. Zhang, W. Mao, F. Li and C. Yin, ACS Omega, 2020, 5, 10995–11004 CrossRef CAS PubMed
.
- J. Cao, Y. Wang, J. Chen, X. Li, F. C. Walsh, J. H. Ouyang, D. Jia and Y. Zhou, J. Mater. Chem. A, 2015, 3, 14445–14457 RSC
.
- Y. C. Eeu, H. N. Lim, Y. S. Lim, S. A. Zakarya and N. M. Huang, J. Nanomater., 2013, 2013, 1–6 CrossRef
.
- J. Xu, D. Wang, Y. Yuan, W. Wei, L. Duan, L. Wang, H. Bao and W. Xu, Org. Electron., 2015, 24, 153–159 CrossRef CAS
.
- C. Zhu, J. Zhai, D. Wen and S. Dong, J. Mater. Chem., 2012, 22, 6300–6306 RSC
.
- A. V. Murugan, T. Muraliganth and A. Manthiram, Chem. Mater., 2009, 21, 5004–5006 CrossRef CAS
.
- M. Hassan, K. R. Reddy, E. Haque, S. N. Faisal, S. Ghasemi, A. I. Minett and V. G. Gomes, Compos. Sci. Technol., 2014, 98, 1–8 CrossRef CAS
.
- E. Mitchell, J. Candler, F. D. Souza, R. K. Gupta, B. K. Gupta and L. F. Dong, Synth. Met., 2015, 199, 214–218 CrossRef CAS
.
- J. Zhang and X. S. Zhao, J. Phys. Chem. C, 2012, 116, 5420–5426 CrossRef CAS
.
- K. Zhang, L. L. Zhang, X. S. Zhao and J. Wu, Chem. Mater., 2010, 22, 1392–1401 CrossRef CAS
.
- M. S. Nooshabadi and F. Zahedi, Electrochim. Acta, 2017, 245, 575–586 CrossRef
.
- L. F. Lai, H. P. Yang, L. Wang, B. K. Teh, J. Q. Zhong, H. Chou, L. W. Chen, W. Chen, Z. X. Shen, R. S. Ruoff and J. Y. Lin, ACS Nano, 2012, 6, 5941–5951 CrossRef CAS PubMed
.
- A. Moyseowicz and G. Gryglewicz, Composites, Part B, 2019, 159, 4–12 CrossRef CAS
.
- D. Sun, L. Jin, Y. Chen, J. R. Zhang and J. J. Zhu, ChemPlusChem, 2013, 78, 227–234 CrossRef CAS
.
- T. Lindfors, Z. A. Boevaac and R. M. Latonen, RSC Adv., 2014, 4, 25279 RSC
.
- E. Dhandapani, S. Prabhu, N. Duraisamy and R. Ramesh, J. Energy Storage, 2021, 44, 103360 CrossRef
.
- A. Thadathil, Y. A. Ismail and P. Periyat, RSC Adv., 2021, 11, 35828–35841 RSC
.
- W. Wang, G. Ren, M. Wang and Y. Liu, J. Mater. Sci.: Mater. Electron., 2018, 29, 5548–5560 CrossRef CAS
.
- E. Azizi, J. Arjomandi, A. Salimi and J. Y. Lee, Polymer, 2020, 195, 122429 CrossRef CAS
.
- A. Shokry, A. M. Elshaer, J. E. Nady, S. Ebrahim and M. Khalil, Electrochim. Acta, 2022, 423, 140614 CrossRef CAS
.
- H. Heli and H. Yadegari, J. Electroanal. Chem., 2014, 713, 103–111 CrossRef CAS
.
- M. K. Liu, S. X. He, W. Fan, Y. E. Miao and T. X. Liu, Compos. Sci. Technol., 2014, 101, 152–158 CrossRef CAS
.
- W. Fan, Y. E. Miao, Y. P. Huang, W. W. Tjiu and T. X. Liu, RSC Adv., 2015, 5, 9228–9236 RSC
.
- K. S. Ryu, Y. G. Lee, K. Kim, Y. Park, Y. S. Hong, X. Wu, M. Kang, N. Park, R. Y. Song and J. Ko, Synth. Met., 2005, 153, 89–92 CrossRef CAS
.
- Z. H. Zhou, N. C. Cai, Y. Zeng and Y. H. Zhou, Chin. J. Chem., 2006, 24, 13–16 CrossRef CAS
.
- M. J. B. Martinez, E. Morallon and D. C. Amoros, Electrochim. Acta, 2007, 52, 4962–4968 CrossRef
.
- N. Anggraini, L. Rohmawati and W. Setyarsih, J. Phys.: Conf. Ser., 2019, 1171, 012046 CrossRef CAS
.
- H. Gul, A. H. A. Shah and S. Bilal, Polymers, 2019, 11, 1678 CrossRef CAS PubMed
.
- D. S. Torres, J. M. Sieben, D. L. Castello, D. C. Amoros and E. Morallon, Electrochim. Acta, 2013, 89, 326–333 CrossRef
.
- M. J. B. Martinez, E. Morallon and D. C. Amoros, Electrochim. Acta, 2007, 52, 4962–4968 CrossRef
.
- Q. Tan, Y. Xu, J. Yang, L. Qiu, Y. Chen and X. Chen, Electrochim. Acta, 2013, 88, 526–529 CrossRef CAS
.
- Y. N. Sudhakar, S. M. Cortinas and M. Selvakumar, Mater. Technol., 2018, 126–134, DOI:10.1080/10667857.2018.1540330.244
.
- T. S. Sonia, P. A. Mini, R. Nandhini, K. Sujith, B. Avinash, S. V. Nair and K. R. V. Subramanian, Bull. Mater. Sci., 2013, 36, 547–551 CrossRef CAS
.
- F. J. Gonzalez, A. Montesinos, J. A. Morera, R. Verdejo and M. Hoyos, J. Compos. Sci., 2020, 4, 87 CrossRef CAS
.
- A. Dang, T. Li, C. Xiong, T. Zhao, Y. Shang, H. Liu, X. Chen, H. Li, Q. Zhuang and S. Zhang, Composites, Part B, 2018, 141, 250–257 CrossRef CAS
.
- W. Wang, S. Guo, M. Penchev, I. Ruiz, K. N. Bozhilov, D. Yan, M. Ozkan and C. S. Ozkan, Nano Energy, 2013, 2, 294–303 CrossRef CAS
.
- H. Y. Tsai, C. C. Wu, C. Y. Lee and E. P. Shih, J. Power Sources, 2009, 194, 199–205 CrossRef CAS
.
- R. Heimbockel, F. Hoffmann and M. Froba, Phys. Chem. Chem. Phys., 2019, 21, 3122–3133 RSC
.
- Z. Zhou and X. F. Wu, J. Power Sources, 2014, 262, 44–49 CrossRef CAS
.
- B. Anothumakkool, A. T. A. Torris, S. N. Bhange, M. V. Badiger and S. Kurungot, Nanoscale, 2014, 6, 5944–5952 RSC
.
- H. Yang, H. Xu, M. Li, L. Zhang, Y. Huang and X. Hu, ACS Appl. Mater. Interfaces, 2016, 8, 1774–1779 CrossRef CAS PubMed
.
- S. Alwin and S. X. Shajan, Mater. Renewable Sustainable Energy., 2020, 9, 7 CrossRef
.
- X. Li, X. Zang, Z. Li, X. Li, P. Li, P. Sun, X. Lee, R. Zhang, Z. Huang and K. Wang, Adv. Funct. Mater., 2013, 13, 4862–4869 Search PubMed
.
- S. Yuan, W. Fan, Y. Jin, D. Wang and T. Liu, Nanomater. Sci., 2021, 3, 68–74 CAS
.
- H. Kashani, L. Y. Chen, Y. Ito, J. H. Han, A. Hirata and M. W. Chen, Nano Energy, 2016, 19, 391–400 CrossRef CAS
.
- H. Zhao, Y. Yu, C. Han, Q. Liu, H. Liu, G. Zhou and M. Xu, J. Macromolecular Sci., Part A, 2021, 58, 419–430 CrossRef CAS
.
- T. Kim, J. Choi, H. J. Kim, W. Lee and B. J. Kim, Macromolecules, 2017, 50, 6861–6871 CrossRef CAS
.
- Y. Kanbur and U. Tayfun, J. Elastomers Plastics, 2019, 51, 262–279 CrossRef CAS
.
- S. Mohamadi and S. N. Sanjani, J. Macromolecular Sci., Part A, 2018, 55, 775–784 CrossRef CAS
.
- C. Wang, Z. X. Guob, S. Fua, W. Wu and D. Zhu, Prog. Polym. Sci., 2004, 29, 1079 CrossRef CAS
.
- E. Gradzka, M. W. Żołopa and K. Winkler, Adv. Energy Mater., 2020, 2001443, DOI:10.1002/aenm.202001443
.
- M. W. Żołopa, K. Winkler, R. Caballero and F. Langa, Electrochim. Acta, 2011, 56, 5566 CrossRef
.
- M. W. Żołopa, K. Winkler, A. A. Thorn, C. J. Chancellor and A. L. Balch, Electrochim. Acta, 2010, 55, 2010 CrossRef
.
- M. Wysocka, K. Winkler and A. L. Balch, J. Mater. Chem., 2004, 14, 1036 RSC
.
- E. Brancewicz, E. Grądzka, A. Z. Wilczewska and K. Winkler, ChemElectroChem, 2015, 2, 253 CrossRef CAS
.
- N. Martín, Chem. Commun., 2006, 2093–2104 RSC
.
- S. Savagatrup, A. S. Makaram, D. J. Burke and D. J. Lipomi, Adv. Funct. Mater., 2014, 24, 1169–1181 CrossRef CAS
.
- I. Botiz and N. Stingelin, Materials, 2014, 7, 2273–2300 CrossRef PubMed
.
- S. Luzatti, M. Panigoni and M. Cattelani, Synth. Met., 2001, 116, 171 CrossRef
.
- J. F. Nierengarten, New J. Chem., 2004, 28, 1177–1191 RSC
.
- M. Mojica, J. A. Alonso and F. Mendez, J. Phys. Org. Chem., 2013, 26, 526–539 CrossRef CAS
.
- H. Wang, X. Yan and G. Piao, Electrochim. Acta, 2017, 231, 264–271 CrossRef CAS
.
- X. Cheng, T. Yokozeki, M. Yamamoto, H. Wang, L. Wu, J. Koyanagi and Q. Sun, Compos. Sci. Technol., 2017, 144, 160–168 CrossRef CAS
.
- A. Ramadan, M. Anas, S. Ebrahim, M. Soliman and A. I. A. Aly, Int. J. Hydrogen Energy, 2020, 45, 16254–16265 CrossRef CAS
.
- S. Bronnikov, A. Podshivalov, S. Kostromin, M. Asandulesa and V. Cozan, Eur. Polym. J., 2016, 78, 213–225 CrossRef CAS
.
- A. Ltaief, A. Bouazizi, J. Davenas, R. B. Chaabane and H. B. Ouada, Synth. Met., 2004, 147, 261–266 CrossRef CAS
.
| This journal is © The Royal Society of Chemistry 2023 |


