
 Open Access Article
 This Open Access Article is licensed under a Creative Commons Attribution-Non Commercial 3.0 Unported Licence
Utilization of biowaste-derived catalysts for biodiesel production: process optimization using response surface methodology and particle swarm optimization method†
Ikbal Bahar
Laskar
a,
Tuhin
Deshmukhya
b,
Aayushi
Biswas
c,
Bappi
Paul
 d,
Bishwajit
Changmai
c,
Rajat
Gupta
e,
Sushovan
Chatterjee
f and
Samuel Lalthazuala
Rokhum
*c
d,
Bishwajit
Changmai
c,
Rajat
Gupta
e,
Sushovan
Chatterjee
f and
Samuel Lalthazuala
Rokhum
*c
aDepartment of Mechanical Engineering, Jorhat Engineering College, Jorhat, Assam 785007, India
bDepartment of Mechanical Engineering, Barak Valley Engineering College, Nirala, Assam 788701, India
cDepartment of Chemistry, National Institute of Technology Silchar, Assam 788010, India. E-mail: rokhum@che.nits.ac.in; Fax: +91 3842-224797; Tel: +91 3842 242915
dDepartment of Chemistry, National Institute of Technology Nagaland, Dimapur, Nagaland 797103, India
eDepartment of Mechanical Engineering, National Institute of Technology Mizoram, Aizawl, Mizoram 796012, India
fDepartment of Mechanical Engineering, Cooch Behar Government Engineering College, Cooch Behar, West Bengal 736170, India
First published on 4th April 2022
Abstract
In this experimental and optimization study, banana (Musa acuminata) flower petal ash has been considered as an effective catalyst in the room temperature (28 °C) assisted transesterification to produce biodiesel from waste cooking oil. The transformation of Musa acuminata flower petals to ash catalyst has been performed by a simple conventional open-air burning process. Three important parameters (catalyst concentration, methanol/oil (M/O) molar ratio and time) that play a significant role in the conversion of waste cooking oil to waste cooking oil methyl ester (biodiesel) were investigated. In order to maximize the conversion rate these key transesterification parameters were optimized using central composite rotatable design of response surface methodology. A metaheuristic algorithm popularly known as particle swarm algorithm has been used to observe a clear picture of the global optimum points scattered around the search domain. Particle swarm optimization has also been used to validate the results obtained from central composite rotatable design. The chemical composition and morphology of the ash catalyst have been investigated using several analytical techniques. It was observed that the catalyst remained active until the 4th reaction cycle. The catalyst's reusability, renewability and robust activity in the reaction make it efficient, economic, green and industrially applicable.
1. Introduction
The rapid industrial growth coupled with uncontrolled population explosion has resulted in an overdependence on the fossil fuel, which is fast depleting and resulted in alarming global warming in recent years. Thus keeping in mind the current scenario, the need to discover environment friendly and renewable sources of fuel has been felt around the globe at present.1,2 In the light of this, biodiesel which is non-toxic, biodegradable and renewable has attracted widespread attention.3 Though biodiesel production is expensive compared to fossil fuels, this factor can be nullified using low cost feedstock like non-edible4 and waste oils.5 Usually using vegetable oils the total cost of production becomes approximately twice the cost of fossil fuels wherein 60–75% of the cost involvement accounts for usage of vegetable oils.6,7 Apart from this, the acute shortage of land for cultivation of edible vegetables is a big hindrance in commercializing edible vegetable oil-based biodiesel.8 Thus, waste cooking oil (WCO)9 which can serve as an alternative to vegetable oils in terms of availability and environment friendliness can be used as a cheap feedstock for low cost production of biodiesel.Of late, the heterogeneous catalysts have gained attention due to their low cost of production compared to their homogeneous counterparts. Most importantly, the problems (expensive catalyst separation process, high wastewater generation during washing, saponification, non-reusable and additional reactant utilization) encountered with the homogeneous catalyst have made the researchers shift their focus to heterogeneous catalysts. Moreover, heterogeneous catalysts owing to their reusability and less corrosive nature have become a favorable choice in biodiesel production.10 The catalysts derived from rice husk,11 banana peduncle,12 banana peel,13Brassica nigra plant,14 trunk of Musa balbisiana Colla,15tucuma peels16 and Citrus sinensis peel17 are some of the biomass waste-based solid catalysts that have been successfully used in the past few years. The outcome of some of these transesterification studies showed that the calcined ash samples of biomass can be used directly as heterogeneous solid catalysts without chemical modification. Balajii and Niju have managed to achieve a FAME yield of 98.69 wt% using Napoleon's plume seed oil and calcined banana peduncle ash.12 In another study, Nath et al. obtained 98.87 wt% FAME yield using soybean oil and Brassica nigra plant ash.14 Deka et al. considered yellow oleander seed oil and trunk of Musa balbisiana Colla for FAME production where a yield of 96 wt% has been recorded.15 In order to counteract the high price linked with the use of vegetable oils as feedstock, various studies have been carried out to convert WCO into biodiesel using biomass based solid catalysts. These studies have reported the synthesis of various catalysts for conversion of WCO, such as oil palm ash,18 lipase (enzyme),19 egg shells,20 chicken and fish bones,21 chicken bones,22 waste ostrich-egg shells,23 eggshell and peat clay,24 chicken manure25 and white bivalve clam shell.26 Tan et al. managed to obtain 89.5% biodiesel yield with chicken and fish bones as the catalyst from WCO at 65 °C.21 In another study, Farooq et al. transformed WCO to biodiesel (89.33%) with chicken bone at a temperature of 65 °C for 4 h using 15![[thin space (1/6-em)]](https://www.rsc.org/images/entities/char_2009.gif) :1 methanol to oil (M/O) molar ratio and 5 wt% catalyst loading.24 Jung et al. used chicken manure as the catalyst to achieve a biodiesel yield of 95% from WCO with the expense of 350 °C.25 Though these catalysts can successfully convert WCO to WCME, an elevated temperature of 60–100 °C is needed for completion of the reaction which demands high end facilities like condensers attached with a chiller, heater and temperature controller machine to name a few. This complex system which also demands tremendous amount of energy to run raises the biodiesel cost in return. In order to reduce the cost associated with temperature assisted biodiesel production approaches, Piker et al. managed to produce biodiesel from WCO at room temperature. Though a high biodiesel yield of 97% was achieved with 6:1 M/O molar ratio, it took 11 h for the reaction to complete.6 In this current study, one of the major objectives is to reduce the conversion time of WCO to biodiesel using a biomass-based catalyst.
:1 methanol to oil (M/O) molar ratio and 5 wt% catalyst loading.24 Jung et al. used chicken manure as the catalyst to achieve a biodiesel yield of 95% from WCO with the expense of 350 °C.25 Though these catalysts can successfully convert WCO to WCME, an elevated temperature of 60–100 °C is needed for completion of the reaction which demands high end facilities like condensers attached with a chiller, heater and temperature controller machine to name a few. This complex system which also demands tremendous amount of energy to run raises the biodiesel cost in return. In order to reduce the cost associated with temperature assisted biodiesel production approaches, Piker et al. managed to produce biodiesel from WCO at room temperature. Though a high biodiesel yield of 97% was achieved with 6:1 M/O molar ratio, it took 11 h for the reaction to complete.6 In this current study, one of the major objectives is to reduce the conversion time of WCO to biodiesel using a biomass-based catalyst.
Banana the second largest produced fruit in the world27 has a great potential in the yield of biodiesel. With a record global production of 101992743 MT in 2012, Africa alone accounted for a massive 15863068 MT.13 Petals of banana flowers automatically peel out as the fruit grow and generate biowaste. Thus, disposal of peels and petals of banana waste have become a matter of concern for the countries where the production is high. Though catalysts derived from banana peel,13 banana trunk15 and banana peduncles12 have already been studied in biodiesel production, the application of banana flower petals as a catalyst in transesterification reaction to produce biodiesel has not been reported in the literature.
The conventional catalysts with a micropore structure pose some inherent difficulties in converting large and viscous feedstocks (plant or algal oil) to biodiesel, whereas the mesoporous and macroporous catalysts have been seen to perform reasonably well.28 Lee et al. carried out an extensive review on several solid acid and base catalysts’ surface properties and pore architectures.29 The study found that the catalyst carrying pore structures interlinked using meso- and macro-porous channels obtained an immense improvement in reaction rate due to the capability of diffusion of the reactants in the pores which increases the biodiesel production rate. They also reported that micropore structure possessing catalysts showed lower activity in the transesterification reaction due to the lack of active site accessibility in the pores.29 Carrero et al. planted a secondary mesoporous structure on the microporous H-β-zeolite to improve the diffusion of reactants into the pores to enhance the esterification of microalgal oil.30 Thus, the mass transfer limitation of the reactants could be enhanced by improving the diffusion properties using the presented catalyst.
Several critical factors are responsible for the production of biodiesel. The parameters such as M/O molar ratio, catalyst loading, reaction temperature, and reaction time are some of the key variables that directly influence the yield. Optimizing these parameters thus becomes crucial in improving the efficiency of the biodiesel production.31 Response surface methodology (RSM) is a powerful tool frequently employed by researchers to design experiments and record the effects of the variables on the final response. RSM has so far been used in numerous studies related to biodiesel to optimize its production.12,16,20,21 Betiku et al. produced biodiesel from neem oil where they optimized the production process using RSM and artificial neural networks (ANN) where a yield of 99.1% and 98.7% is obtained respectively by these two methods.1 Balajii et al. used central composite design (CCD) of RSM to optimize the two-step biodiesel production process parameters where CCD was applied in transesterification and predicted a biodiesel yield of 99.36%. Under the condition determined by CCD, a biodiesel yield of 98.69% was quantified experimentally.12 Several studies related to optimization of biodiesel production from banana peel,13 eggshell,20 and chicken and fish bones21 have been investigated using CCD.
By considering the fact that a huge amount of waste is generated from banana flower petals along with banana peels due to the high consumption of this fruit worldwide, this study aims to convert waste (Musa acuminata flower petals (MAFP)) into a novel catalyst by the simple conventional burning method. Our continuous effort on transforming biowaste into a valuable product as low-cost, renewable and biodegradable catalysts in various organic transformations32,33 as well as in transesterification reactions34,35 has directed us towards the investigation of Musa acuminata flower petal ash (MAFPA) as the catalyst for converting WCO to WCME. In order to optimize the reaction parameters (i.e. catalyst loading, M/O ratio and reaction time) experimental runs were designed with central composite rotatable design (CCRD) of RSM. A powerful swarm-based metaheuristic optimization technique, particle swarm optimization (PSO), has been used to perform proper global optimization of important variables in order to improve the biodiesel yield. As per the authors’ knowledge, this is the first ever application of any swarm based algorithm in the area of biodiesel research. Application of swarm intelligence in this area can help scientists and researchers to gain an insight about the optimum design variables that help in improving the yield by properly digging out global optimum points in the domain.
2. Experimental
2.1 Materials
WCO, collected from two distinct hotels of Silchar, Assam, India, contains some food debris and moisture which were removed by filtration through filter paper followed by heating at 120 °C. The properties of treated WCO were determined by ASTM methods which are listed in Table 9. Musa acuminata flowers were fetched from the local market of Fakirtilla, Silchar, to collect unused large petals for further use. Bromothymol blue (pKa = 7.2), phenolphthalein (pKa = 9.8), indigo carmine (pKa = 12.2), 2,4-dinitroaniline (pKa = 15.0), 4-nitroaniline (pKa = 18.4), methanol and acetone were purchased from Sigma Aldrich. The acid value of WCO and biodiesel was determined by a standard titration method using phenolphthalein indicator36 where it is seen that the percentage of free fatty acids (FFA) is 0.98%. Since the acid content is less than 2% pre-esterification is not needed. CDCl3 (D, 99.8%, cat. no. DLM-7-100S, which was used as a solvent in nuclear magnetic resonance (NMR) analysis) was purchased from CIL Inc., USA. Methyl hexanoate (analytical standard, >99.8%, cat. no. 21599, used as an analytical standard for gas chromatography–mass spectroscopy (GC–MS) analysis) was procured from Sigma-Aldrich.2.2 Catalyst preparation and characterization
Large petals of Musa acuminata were separated from the fruits. The petals were then thoroughly washed with distilled water and sun-dried. Subsequently the dried petals were burnt in air and ground to fine powder. The physicochemical property of the prepared ash was then determined using the following analyses which include XRD, XRF, IR, XPS, TGA, TEM, SEM, EDX, CO2-TPD and BET. X-Ray diffraction (XRD) study of waste banana flower petals (BFP) was carried out on a Bruker AXS D8-Advance powder X-ray diffractometer with the following parameter setting: Cu-Kα radiation (K-Alpha1 wavelength, λ = 1.54056 Å and K-Alpha2 wavelength, λ = 1.54439 Å), 35 mA current, 40 kV generator voltage, 2θ in the range 15°–90° at a scanning rate of 2° min−1. The catalyst elemental analysis was performed on a Bruker S4 Explorer X-ray Fluorescence (XRF) spectrophotometer. FTIR analysis was performed to determine the functional group of the catalyst and IR spectra were obtained on a 3000 Hyperion FTIR spectrometer (Bruker, Germany) within the range from 400 to 4000 cm−1. The catalyst surface element and binding energy of the corresponding elements were identified by XPS analysis in a Thermo Fischer Scientific bearing model no. ESCALAB Xi+ instrument. Thermal stability analysis was carried out by thermogravimetric analysis (TGA) on the model STA 409 Metzsch Geratebau GMBH (Germany) under nitrogen flow at a pressure of 1.5 bar and flow rate of 2 L h−1. The catalyst (MAFPA) mass transfer and phase transition were studied in the range between 10 °C and 1000 °C with constant nitrogen gas flow. Scanning electron microscopy coupled with EDS analysis (determination of elemental composition) of the catalyst was carried out on model no JEOL JSM-7600F. SEM images were captured on an FEI Quanta 200 F, using an X-ray source made up of tungsten filament doped with lanthanum hexaboride (LaB6) and connected with an ETD as the secondary electron detector operated at high vacuum with an acceleration tension of 30 kV. Samples are analyzed by spreading them on a carbon tape. JEM2100 equipment was used to capture transmission electron microscopy images of the catalyst. Surface area and pore volume of the MPS were found out by Brunauer–Emmett–Teller (BET) study and the analysis result as N2 adsorption–desorption isotherm was determined on a Micromeritics ASAP 2010 using He as the carrier gas. Prior to analysis the catalyst was made moisture and atmospheric vapour free by degassing at 180 °C for 12 h. Furthermore the basic strength was tested by the Hammett indicator method using the following indicators with different acidity functions (H_): phenolphthalein (H_ = 9.8), indigo carmine (H_ = 12.2), 2,4-dinitroaniline (H_ = 15.0) and 4-nitroaniline (H_ = 18.4). Anhydrous ethanol was used in the reaction. In the experimental run, 50 mg of catalyst and 10 mL of anhydrous ethanol were taken in a 25 mL round bottom flask and shaken well. The reactants were then allowed to rest for 2 h to attain a state of equilibrium. The gradual change in reaction colour indicates the base strength of the catalyst. When the catalyst strength is higher than the weakest indicator, a change in solution colour is observed, while it remains unchanged when the catalyst strength is lower than the strongest indicator.2.3 Pretreatment of waste cooking oil
Waste cooking oil was obtained from a hotel in Silchar, Assam, India. A filtered paper was used to make the oil free of crude impurities. The filtrate was then washed 3 times with hot water to eliminate the impurities and the mixture was allowed to settle, which was then separated using a separating funnel. The washed oil was then heated at 120 °C for 2 h to remove moisture from the oil. The oil obtained was treated with charcoal to remove any remaining colored impurities. The saponification value and acid value of the pretreated WCO were found to be 184.37 mg KOH g−1 and 1.95 mg KOH g−1. The oil was further used for the transesterification reaction with methanol in the presence of the MAFPA catalyst.2.4 Transesterification of WCO
As free fatty acid (FFA) was found to be <2%, it required only one step transesterification for the conversion of WCO to WCME.23,37 In this study, the transesterification process was performed at room temperature (28 °C) in a round bottom (RB) flask placed on a magnetic stirrer. The desired amount of methanol, oil and MAFPA was taken in a RB and the reaction was carried out for a specific time span. All the experimental runs were performed sequentially according to the transesterification parameter (MAFPA concentration, M/O ratio and time) values provided by CCD of RSM. The parameters selected for designing the experimental run with CCD are shown in Table 1. Once the reaction time was completed the resultant mixture was subjected to vacuum distillation (heating) for a particular time period in order to remove the excess methanol followed by separation of the catalyst from the reaction mixture through centrifugation at 3000 rpm. Next, two layers were obtained which consist of the WCME (biodiesel) at the top layer and the prepared catalyst with glycerol at the bottom layer. The top layer containing WCME is collected and stored in an airtight container for further analysis. The oil conversion after each run is estimated using 1H NMR which is carried out on a Bruker Avance II (400 MHz) spectrometer using CDCl3 as a solvent and tetramethylsilane (TMS) as an internal reference. The percentage conversion of WCO to WCME was estimated using eqn (1) given by Knothe.38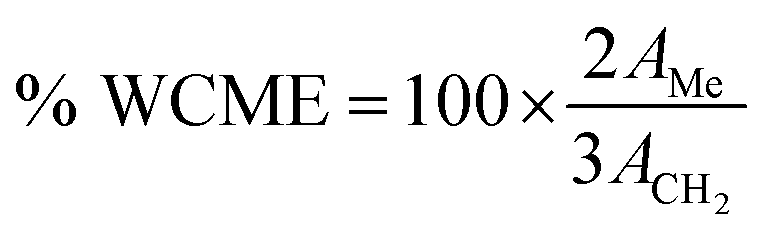 | (1) |
| Variables | Symbol | Units | Level | ||||
|---|---|---|---|---|---|---|---|
| −α | −1 | 0 | 1 | +α | |||
| α = 1.68179, variables converted from coded (C) to un coded (UC) and are as follows: A = 10X + 40, B = 1.5X + 6.5, and C = X + 3. | |||||||
| MAFPA concentration | A | % w/w | 1.98 | 3 | 4.5 | 6 | 7.02 |
| M/O ratio | B | mol mol−1 | 3.98 | 5 | 6.5 | 8 | 9.02 |
| Time | C | h | 1.32 | 2 | 3 | 4 | 4.68 |
2.5 Experimental design for maximum biodiesel yield
Here in this study central composite design (CCD) coupled with surface methodology (RSM) has been used for designing and modelling the experiments as well as optimizing WCME. The application of CCD in the optimization of biodiesel using MAFPA catalyst as well as the effect of key variables (M/O molar ratio, catalyst concentration and reaction time) on the yield has been discussed here. Twenty different experimental runs were conducted separately (2p + 2p + c, where, p = number of factor and c = center point number). The 2p design in the current case with center points needed fewer runs whereby giving identical details regarding curvature as shown by a 3p design.21 The current CCD model comprises 23 = 8 factorial points, 2 × 3 = 6 axial and b = 6 center points. The axial point α in this study is selected to be 1.68. The independent variables along with their upper and lower limits can be seen from Table 1. Finally, the CCD matrix in Table 2 shows the whole design matrix including real and coded independent variables.| Run | Point type | MAFPA concentration | M/O molar ratio (mol/mol) | Time (h) | Biodiesel conversion (%) | RSE % | ||||
|---|---|---|---|---|---|---|---|---|---|---|
| UC | C | UC | C | UC | C | Experimental | Predicted | |||
| 1 | Fact | 3 | −1 | 5 | −1 | 4 | 1 | 54 | 54.75 | 1.39 |
| 2 | Centre | 4.5 | 0 | 6.5 | 0 | 3 | 0 | 85.74 | 86.27 | 0.62 |
| 3 | Fact | 6 | 1 | 5 | −1 | 2 | −1 | 46.88 | 47.94 | 2.26 |
| 4 | Fact | 6 | 1 | 8 | 1 | 2 | −1 | 34 | 33.85 | 0.44 |
| 5 | Axial | 7.02 | +α | 6.5 | 0 | 3 | 0 | 77.57 | 77.34 | 0.3 |
| 6 | Fact | 3 | −1 | 8 | 1 | 4 | 1 | 60.29 | 59.83 | 0.76 |
| 7 | Axial | 4.5 | 0 | 6.5 | 0 | 1.32 | -α | 19 | 18.02 | 5.16 |
| 8 | Axial | 4.5 | 0 | 6.5 | 0 | 3 | 0 | 85.78 | 86.27 | 0.57 |
| 9 | Fact | 6 | 1 | 5 | −1 | 4 | 1 | 95.28 | 94.53 | 0.79 |
| 10 | Fact | 4.5 | 0 | 6.5 | 0 | 3 | 0 | 86.82 | 86.27 | 0.63 |
| 11 | Fact | 4.5 | 0 | 6.5 | 0 | 4.68 | +α | 83.84 | 83.94 | 0.12 |
| 12 | Axial | 4.5 | 0 | 9.02 | +α | 3 | 0 | 57.56 | 56.99 | 1 |
| 13 | Centre | 4.5 | 0 | 6.5 | 0 | 3 | 0 | 86.63 | 86.27 | 0.42 |
| 14 | Fact | 3 | −1 | 5 | −1 | 2 | −1 | 31.29 | 31.18 | 0.35 |
| 15 | Axial | 4.5 | 0 | 3.98 | —α | 3 | 0 | 64.84 | 64.57 | 0.42 |
| 16 | Centre | 4.5 | 0 | 6.5 | 0 | 3 | 0 | 87.53 | 86.27 | 1.44 |
| 17 | Axial | 1.98 | −α | 6.5 | 0 | 3 | 0 | 39.58 | 38.96 | 1.57 |
| 18 | Fact | 4.5 | 0 | 6.5 | 0 | 3 | 0 | 85 | 86.27 | 1.5 |
| 19 | Fact | 3 | −1 | 8 | 1 | 2 | −1 | 26.64 | 27.99 | 5.06 |
| 20 | Centre | 6 | 1 | 8 | 1 | 4 | 1 | 88 | 88.71 | 0.8 |
| Avg RSE 1.28% | ||||||||||
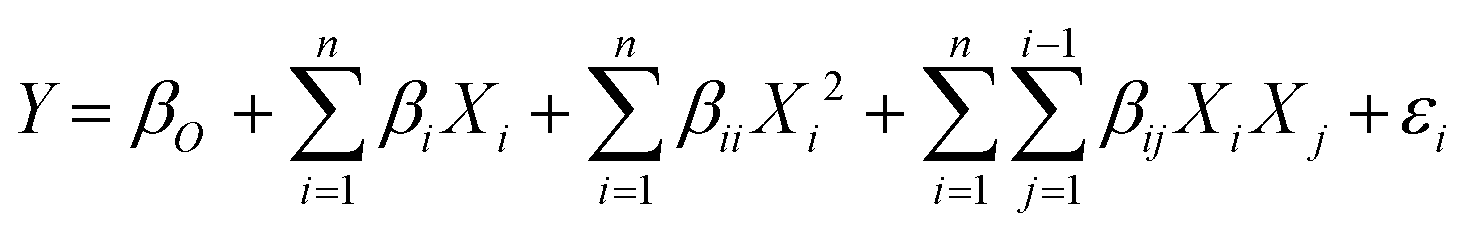
To correlate the biodiesel conversion as response to the transesterification process variables, a mathematical model is developed. The interaction of input variables with output (biodiesel conversion) is formulated in the following equation (eqn (2)):
 | (2) |
Analysis of variance (ANOVA) was examined in Design-Expert 11.0 software. Next P-test and F-test were performed on each coefficient to ensure the statistical significance of each term in the fitted equation. The considerable value for F (within the level of 95%) and p (<0.05) was chosen for the model to be significant39 on top of this, the operational parameters were tested with regression and graphical analysis to quantify their optimal values.
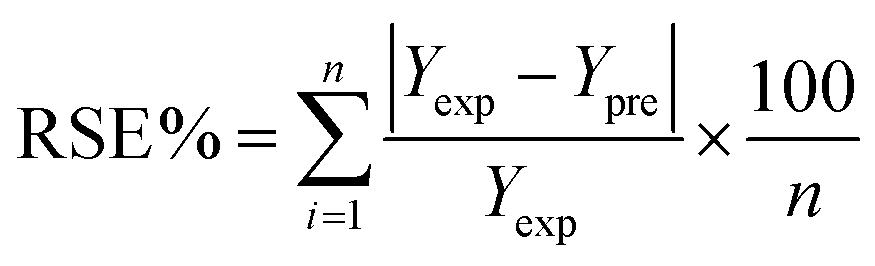
The regression coefficient of determination or relative standard error (RSE) between the experimental and predicted outcomes was to determine the model reliability.40 The RSE is estimated by eqn (3). The average RSE lower than 10% was acceptable.41
 | (3) |
2.6 Maximizing the yield using particle swarm optimization (PSO)
Inspired by the social, especially the foraging nature of the birds in nature, a metaheuristic algorithm has been developed by Kennedy and Eberhart (Kennedy and Eberhart, 1995) in the year 1995. PSO works by initiating a swarm of hypothetical birds or particles in a three-dimensional space and assigning them certain velocities. In this 3D design space, the position of each particle is represented by time, catalyst concentration and M/O ratio. Every position represents a potential solution of the problem and these solutions are evaluated with respect to the objective function which is the yield in the present case. The beauty of this algorithm is its inherent ability to maintain a fine balance between intensification and diversification in order to explore the entire domain as well as exploit the promising regions in the later stages of the run. PSO functions by obeying the following update equations:To initiate the search process, a swarm of hypothetical particles (that represent potential solutions of the problem) are generated and random velocities are assigned to the particles. The objective function values are evaluated with respect to the positions of the agents and their individual fitness values (p-best) and the fitness value of the best particle (g-best) is recorded.42 Here it is worth mentioning that the initial positions of all the particles are their respective personal bests. Based on these two values the particles update or change their positions and velocities by obeying the following equations:
| νdi+1 = νdi + c1r1 (pbestdi − xdi) + c2r2 (gbesti − xdi) | (4) |
| xdi+1 = xdi + νdi+1 | (5) |
The fact that makes PSO a superior algorithm is that the particles retain the memory of the locations in the domain. The algorithm runs in an iterative fashion by constantly improving the positions of the particles and finally converging at a near optimal point. After every iteration, the positions are updated and the particles are made to move toward the best particle of the swarm. Soon within a few iterations, the particles converge near a good optimum value in the vicinity of the global best position. Here a linearly decreasing inertia weight is employed which makes the algorithm scan the multi-dimensional domain in the initial iterations and gradually converge to a promising optimum value at the end of the run.43 To ensure efficient functioning of the algorithm, the algorithm centric parameters should be judicially selected. It is quite logical to believe that the more the number of agents the better will be the result. However, increasing the number of agents increases the computational effort without much improvement in the output. So, the number of particles in the swarm should neither be too less nor too large.
3 Results and Discussion
3.1 Catalyst characterization
To identify the specific composition of the banana flower petal ash (MAFPA) catalyst, XRF analysis was conducted, and the results are presented in Table 3.| S. no. | Compound formula | Weight (%) |
|---|---|---|
| 1 | K2O | 60.23 |
| 2 | SiO2 | 21.3 |
| 3 | MgO | 4.78 |
| 4 | Cl | 3.91 |
| 5 | P2O5 | 3.65 |
| 6 | CaO | 3.17 |
| 7 | Na2O | 1.11 |
| 8 | SO3 | 0.71 |
| 9 | Fe2O3 | 0.19 |
| 10 | TiO2 | 0.18 |
| 11 | ZnO | 0.16 |
| 12 | Al2O3 | 0.15 |
| 13 | Rb2O | 0.13 |
| 14 | SrO | 0.12 |
| 15 | CuO | 0.1 |
| 16 | MnO | 0.07 |
| 17 | Cr2O3 | 0.04 |
The important components which are responsible for catalytic activity in MAFPA catalyst as found from the analysis are potassium oxide (60.23%), silicon dioxide (21.3%), magnesium oxide (4.78%), calcium oxide (3.17%), chloride (3.91%) and phosphorus pentoxide (3.65%). Some metal oxides in minimal amount are also traced from the analysis which are listed in Table 3. A close inspection of Table 3 reveals that a highly basic K2O is the major component of the proposed mango peel ash that boosts its catalytic activity to a great extent. It is a well-known fact that the mixed metal oxide performs better in transesterification reaction as compared to single metal oxide as the catalyst.44–46 This translates to the fact that since the current MAFPA catalyst is composed of mixed metal oxides, an enhanced catalytic performance in the reaction can be expected. Rabie et al. improved the transesterification reaction using a dolomite supported CaO and MgO (dolomite@CaO/MgO) catalyst.45 Hence, the presence of CaO and MgO in MAFPA further increases the efficiency of the present catalyst in the reaction.
The results of XRD analysis of MAFPA are shown in Fig. 1a. It is evident from the figures that the major components of MAFPA are metal oxides and carbonates where potassium oxide and potassium carbonate are found to be present in high abundance. These can be seen from the characteristic peaks at 2 theta values which include 23.56, 25.37, 26.81, 28.56, 32.17, 32.7, 38.49, 40.50, 48.5 and 57.91 (JCPDS reference file no. 26-1327 and 49-1093). CaCO3 and CaO were detected at 2θ = 30.3, 32.31, 37.21, and 53.65 (JCPDS file no. 87-1863 and 48-1467). The SiO2 present in MAFPA can be determined from the inhabitancy of peaks at 2θ = 29.72, 41.31 and 43.45 (JCPDS file no 81-0069). Apart from the above mentioned constituents, various other peaks obtained at 2 theta values of 20.21, 20.86, 42.95, 46.31 and 44.65 are due to SO3, P2O5, MgO, Na2O and C molecules respectively assured from JCPDS file no. 72-1664, 87-0952, 87-0652, 77-2148 and 80-0017. 34. We have earlier reported a similar XRD pattern for Musa acuminata peel ash.47
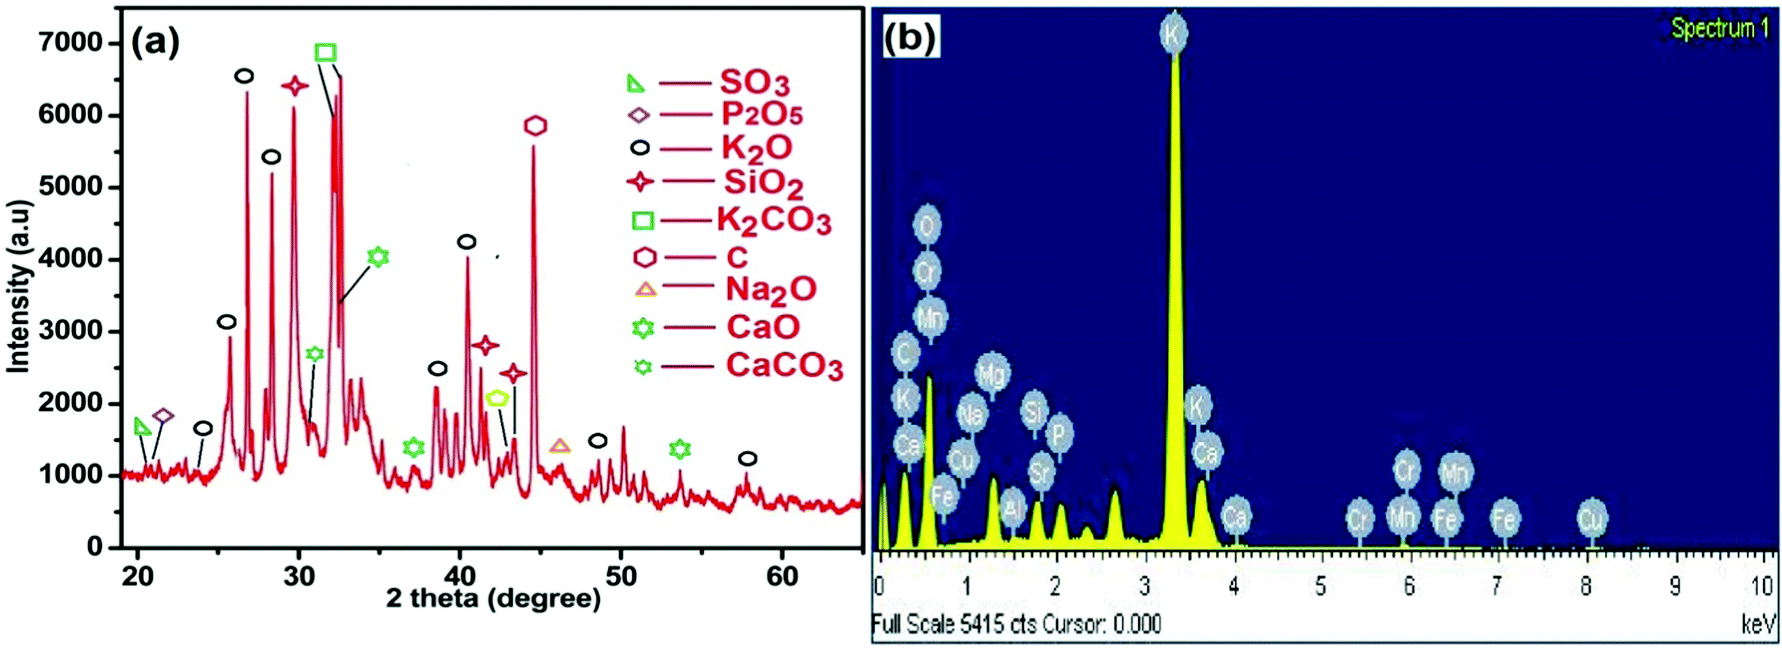 | ||
| Fig. 1 (a) XRD pattern of MAFPA and (b) EDS spectra of MAFPA. | ||
EDS analysis was performed to get an idea about various elements present in the MAFPA and the results are presented in Fig. 1b. The analysis revealed the presence of K (45.44%), O (41.84%), Ca (2.4%), P (2.03%), Mg (3.05%), Si (1.95%), and C (1.9%). The results obtained from EDS analysis are in good agreement with XRF and XRD analyses. In a study by Madhuvilakku et al. the authors found that the catalytic (ZnO–TiO2) activity of mixed metal oxide in transesterification is significantly higher than that of their single oxide counterparts.46 Hence, it is anticipated that the presented catalyst would exhibit better performance in the reaction due to the presence of several metal oxides in it inherently.
Further, thermogravimetric analysis (TGA) was performed for MAFPA catalyst and the results are furnished in Fig. 2a. A steady fall of 1.89% in weight up to 110 °C (due to evaporation) can be read from the trend seen in the figure.16 Again under the influence of N2, the weight of MAFPA further drops by 9.83% in between 115–290 °C due to thermal decomposition of the catalyst,47 while after 290 °C, the further drop in weight is due to the carbonaceous material of MAFPA undergoing oxidation and elimination of CO2, CO, etc.16,17,47
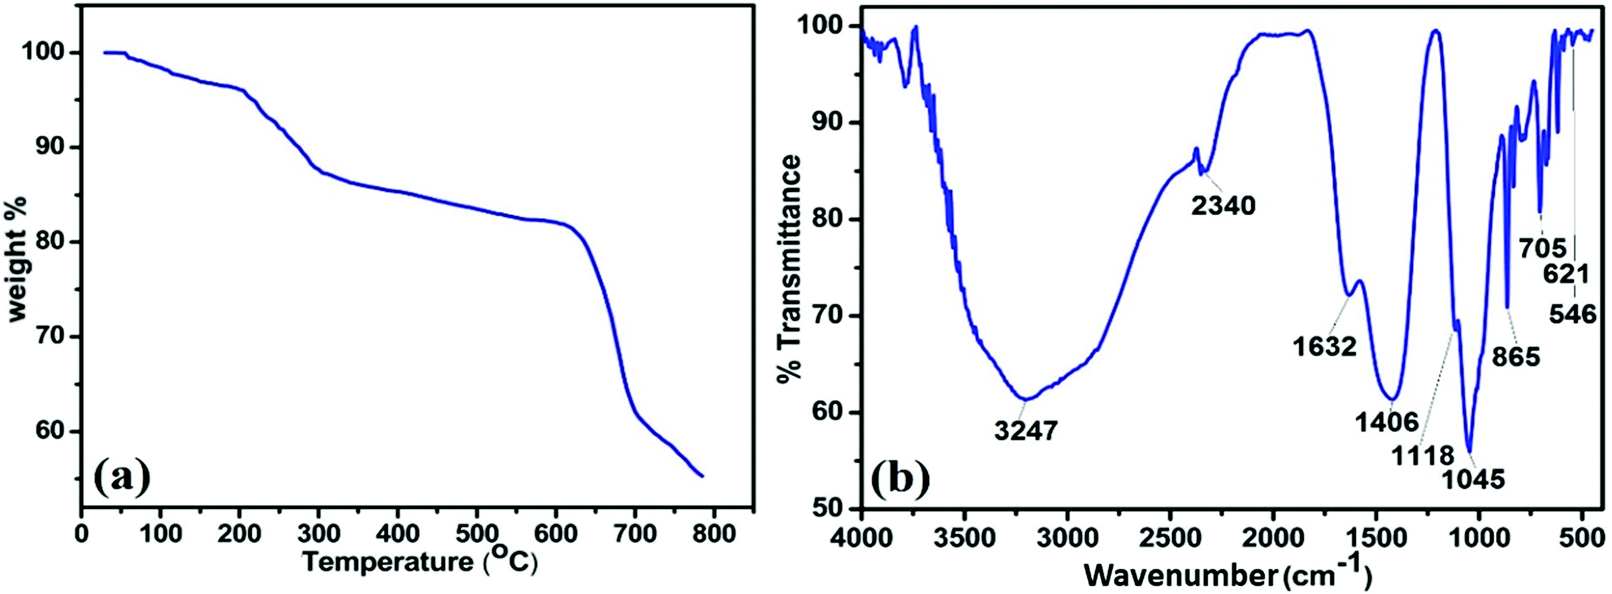 | ||
| Fig. 2 (a) TGA pattern of MAFPA, and (b) FTIR spectra of MAFPA. | ||
To get information about the functional group attached to the MAFPA, FTIR analysis was performed. Fig. 2b depicts the presence of number of bands appearing at different wave numbers. The band appearing at 3210 cm−1 corresponds to O–H stretching and can be attributed to the H2O bending vibration.13,47,48 The bands at 1640, 1398, 1122 and 705 cm−1 are due to C–O stretching and bending vibrations which are the characteristic peaks of metal carbonates (CO3), while the peak at 1398 cm−1 is due to K2CO3.13,49 The metal oxide surfaces adsorb CO2 from the environment which results in the formation of metal carbonates in MAFPA.47 However the bands at 1051 and 621 cm−1 and the band at 2340 cm−1 are due to the stretching of Si–O–Si13 and M–O–K bonds (M = Si, Mg, etc.) respectively, while the absorption band at 864 cm−1 is due to isolated vibration of SiO4, in CaMgSiO4. This may be due to interaction of Ca2+ and Mg2+ with SiO4.13
Further, SEM and TEM images of MAFPA were captured with an aim to get a clear view of the catalyst's peripheral morphology. The number of aggregate surfaces with a mesoporous structure can be seen in Fig. 3a–c. MAFPA exhibited porous glossy/glassy and spongy particles (Fig. 3c and e). A similar morphological surface has been obtained from banana peel ash in our past studies.47 A strong resemblance of results obtained by TEM analysis with that of SEM analysis has been noticed. From Fig. 3d, porous nature and assemblage of the particles can be seen. The crystalline nature of the particles was observed in the image obtained from SAED in Fig. 3f.
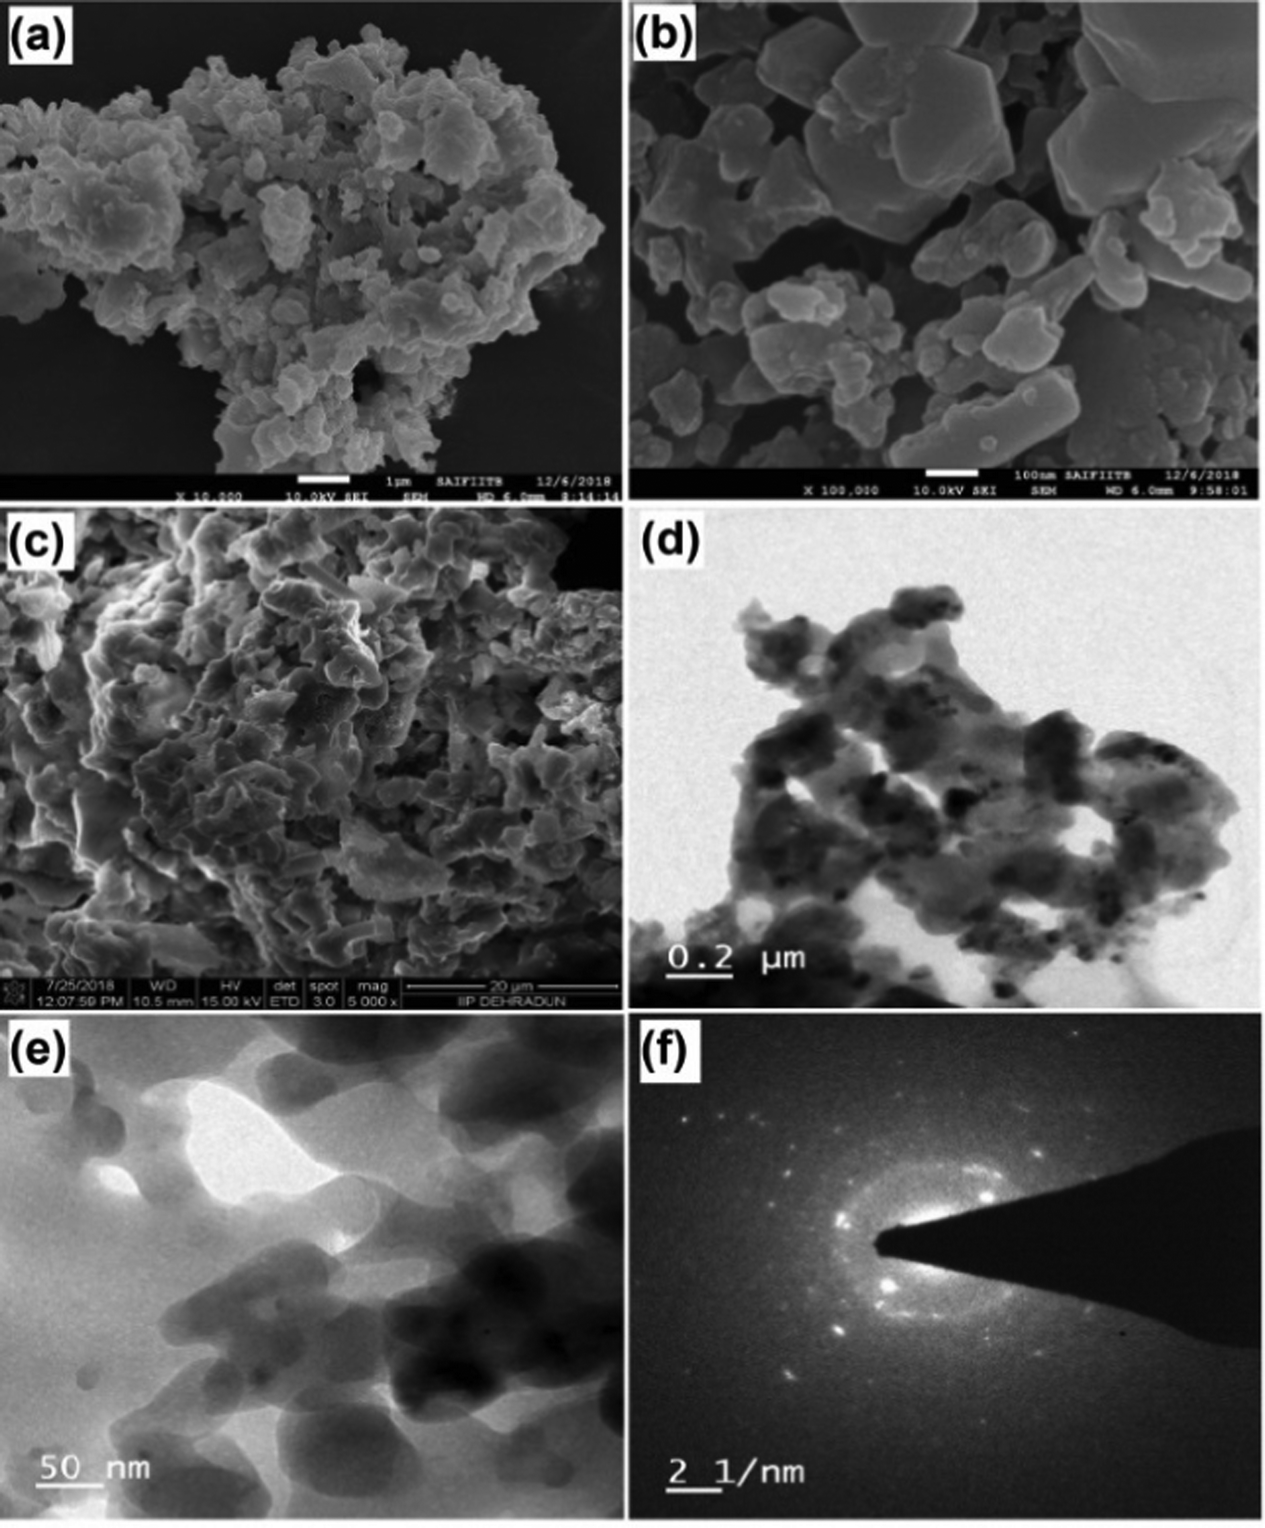 | ||
| Fig. 3 SEM images (a–c), TEM images (d and e), and SAED pattern (f). | ||
A type-IV hysteresis loop which is a characteristic of mesoporous materials is obtained in the N2 adsorption – desorption isotherm of MAFPA (Fig. 4a). A clear insight about the pore size has been visualized from Fig. 4b where it is seen that the pores obtained are in the range of 4–35 nm. A similar mesoporous structure has been obtained in the SEM and TEM analysis. A surface area of 79.33 m2 g−1, pore volume of 0.260 cm3 g−1 and pore size of 9.71 nm were determined by the BET method. The catalytic activity in transesterification reaction is greatly influenced by the surface area as well as the type of pore structure obtained.29 The mesoporous structure helps in better diffusion of reactants inside the pores which eventually speeds up the reaction rate. This is in contrast to the microporous structures where reactions occur at the entrance, thereby reducing the rate of reaction.28,29,50,51 The MAFPA being mesoporous in structure boosts biodiesel production to a large extent.
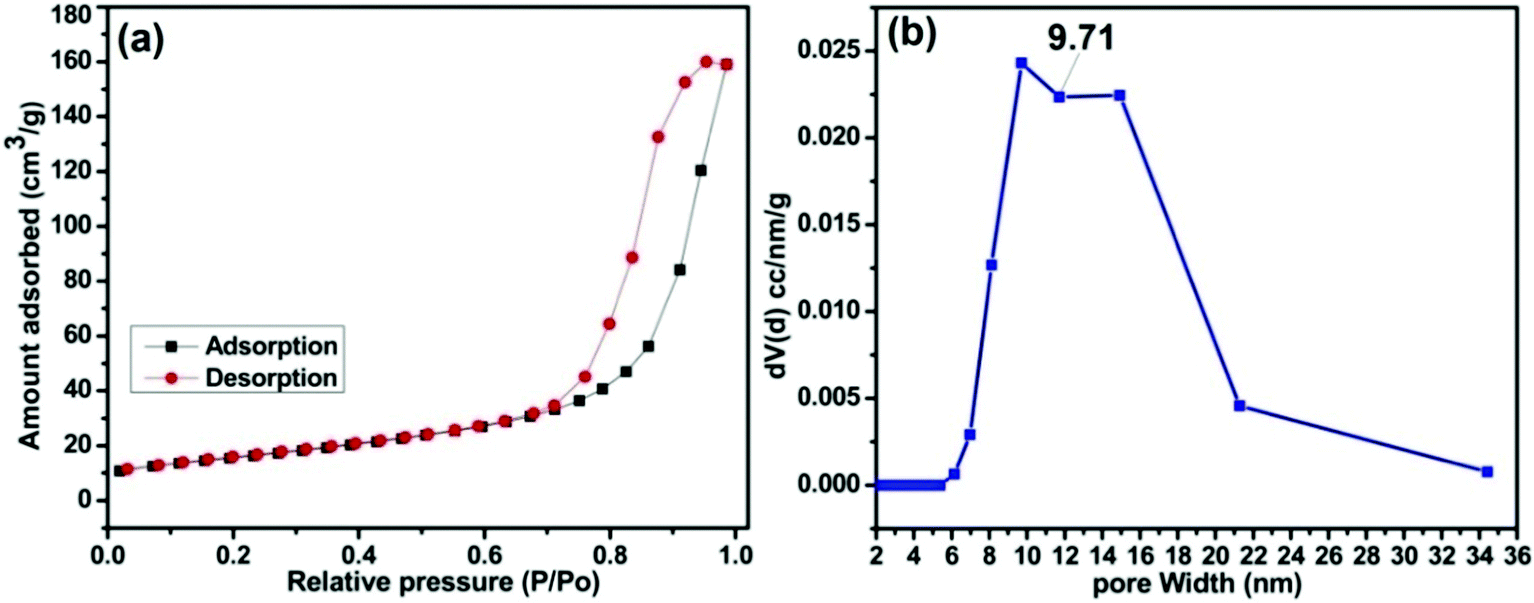 | ||
| Fig. 4 BET result of MAFPA: (a) N2 adsorption–desorption isotherm and (b) pore size distribution. | ||
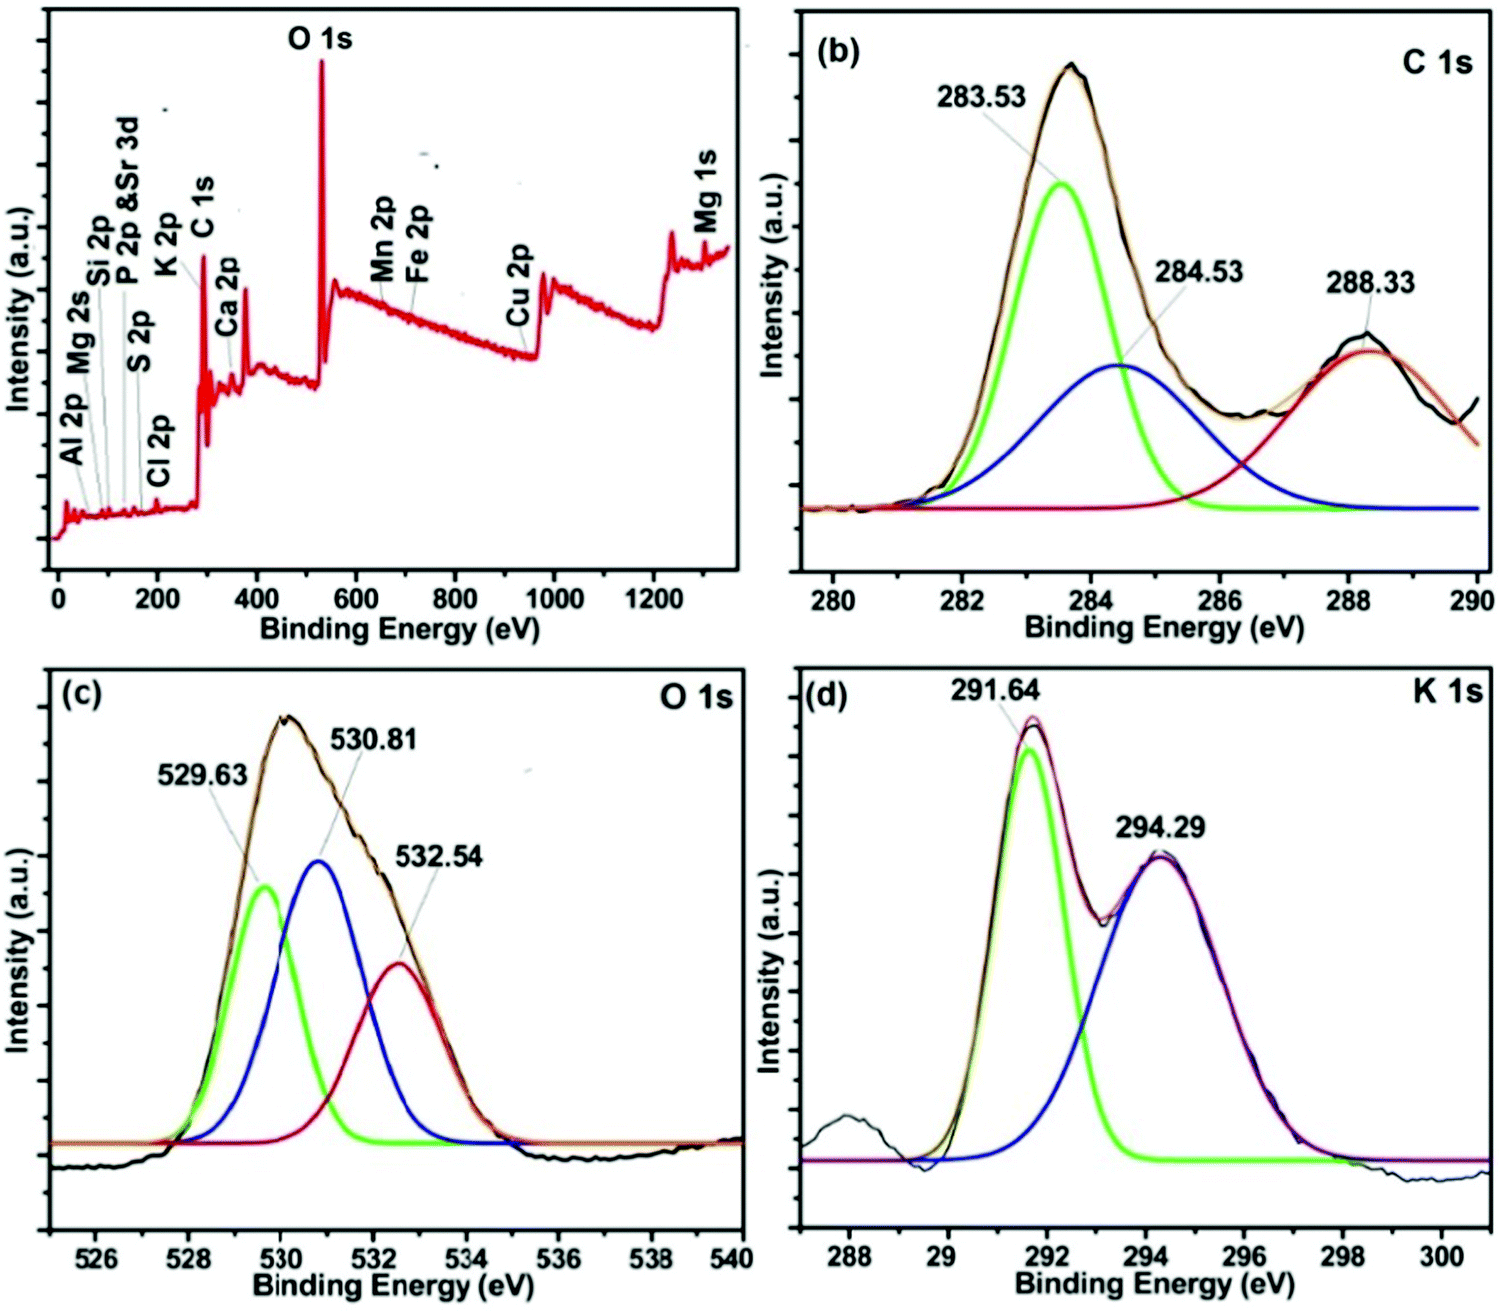
In order to have concrete information about the constituents present on the catalyst's surface, XPS analysis was performed. The results (as displayed in Fig. 5) showed that the most prominent constituents present in the MAFPA surface are potassium (23.5%), carbon (29.93%), oxygen (32.29 wt%), silicon (2.89 wt%), calcium (3.02 wt%), and chlorine (2.26 wt%). Along with these, magnesium (1.77 wt%), phosphorus (1.46% wt%), manganese (0.7 wt%), iron (0.15 wt%), strontium (0.77 wt%), aluminium (0.61 wt%) and copper (0.35 wt%) were also present in limited amounts. It can be seen from Fig. 5b that the C 1s signal is split into three parts along the binding energy through deconvolution. The peaks obtained can be attributed to the presence of adventitious carbon (283.53 eV), C![[double bond, length as m-dash]](https://www.rsc.org/images/entities/char_e001.gif) O (284.53 eV) and CO32− (288.33 eV).52 However, in the O 1s core level spectrum (Fig. 5c), the presence of three different peaks at 529.63, 530.81 and 532.54 eV is due to the inhabitancy of metal oxide, alumina, and metal carbonates respectively in the MAFPA catalyst.47
O (284.53 eV) and CO32− (288.33 eV).52 However, in the O 1s core level spectrum (Fig. 5c), the presence of three different peaks at 529.63, 530.81 and 532.54 eV is due to the inhabitancy of metal oxide, alumina, and metal carbonates respectively in the MAFPA catalyst.47
 | ||
| Fig. 5 XPS spectra of MAFPA: (a) survey, (b) C 1s, (c) O 1s and (d) K 1S core level spectra. | ||
Two peaks seen at 291.7 and 294.4 eV for K 2p indicated the presence of potassium bonded with carbonate and oxides (Fig. 5d).53 The peaks obtained at 345.66 and 350.18 eV testify the presence of calcium carbonate and calcium oxide in the catalyst [Fig. S1a, ESI†]. From the Si 2p spectrum (Fig. S1b, ESI†), it can be stated that the peak at 104.4 eV is due to SiO2, whereas the peak obtained at 101.36 eV can be attributed to silicate species.
Similarly, the Mg 1s spectrum shows two peaks at 1303.54 and 1301.46 eV respectively (Fig. S1c, ESI†). This can be credited to the bonding of Mg with O to form MgO and CO32− to form MgCO3 (Fig. S1c, ESI†). Sulfur (S 2p) was found to be present in the catalyst in the form of sulfide and sulfate at 168.18 and 169.93 eV respectively (Fig. S1d, ESI†). The peaks at 131.73 and 133.99 eV in the P 2p spectrum were due to the presence of phosphate species (Fig. S1e, ESI†). Likewise, the peaks obtained at 197.7 and 199.7 eV respectively in the Cl 2p spectrum (Fig. S1f, ESI†) hint toward the presence of chloride species in the catalyst.
Determining the basic strength of the catalyst is important as the reaction rate in the base catalytic approach is highly influenced by its inherent basicity. The basic catalytic strength has been measured by the Hammett indicator method which was found to be in between 15 < H_ < 18.4. This finding estimated that the banana flower petal ash catalyst is a strong base which can boost the transesterification at a faster rate. The high basic strength of the catalyst is mainly due to the presence of the metal-O group. Birla et al. found a similar basic strength value from a snail shell catalyst.54 Pathak et al. observed the presence of various alkaline earth metals and alkali metals from Musa acuminata peel ash which is probably responsible for serving basic sites in transesterification reaction.47 Here it is worth noting that the K in Musa acuminata peel ash is the major element. Thus K2O acts as a strong base which is primarily responsible for high basic strength of the catalyst. Though the percentage of constituents varies marginally, a striking resemblance with respect to ingredients has been observed in between MAFPA and Musa acuminata peel ash. This similarity in characteristics can be a probable reason behind the high basic strength of MAFPA.
3.2 Optimisation of WCME conversion using RSM
The experimental value of WCME conversion was examined by CCD to obtain a regression model. The fit summary (Table 4) has suggested a quadratic model because of high values of R2. This has fixed the quadratic equation as the best suited fit model for biodiesel conversion. A polynomial equation (eqn (4)) of second order was obtained through ANOVA analysis using Design Expert software to predict the WCME conversion.| WCME conversion % = 86.27 + 11.41 × A − 2.25 × B + 19.61 × C − 2.72 × A × B + 5.76 × A × C + 2.07 × B × C − 9.94 × A2 − 9.01 × B2 − 12.47 × C2 | (6) |
| Source | Sequential P value | Lack of fit P value | R 2 | Adjusted R2 | Predicted R2 | |
|---|---|---|---|---|---|---|
| Linear | 0.0017 | <0.001 | 0.6157 | 0.5437 | 0.4657 | |
| 2FI | 0.6115 | <0.0001 | 0.6468 | 0.4838 | 0.0798 | |
| Quadratic | <0.0001 | 0.3405 | 0.9991 | 0.9982 | 0.9946 | Suggested |
| Cubic | 0.2131 | 0.6108 | 0.9995 | 0.9984 | 0.9654 | Aliased |
From the ANOVA analysis shown in Table 5 it can be seen that the probability (p) value of the model is less than 0.0001 which signifies that the model is statistically significant and can accurately predict the experimental values. The R2 value of 0.9991 too is a good indication of the model's ability to predict the experimental values with high accuracy. The significance of each factor was evaluated through P-value and Fisher's test (F-Test). The experimental data are significant with a confidence level of 95% because the model's F and p values are 1188 and <0.0001 respectively. The adjusted R2 of 0.9982 implies that the variability between predicted and actual values is 99.82%. The R2 value of 0.9991 signifies negligible deviation of predicted values from the actual ones. The lack of fit p-value as obtained from the lack of fit test is 0.31 which shows the lack of fit to be insignificant. This testifies the fact that the experimental data have fitted successfully by considering interaction and contribution of all the factors in making regression response.40,55
| Source | Sum of squares | df | Mean square | F-Value | p-Value | |
|---|---|---|---|---|---|---|
| Model | 11518.81 | 9 | 1279.87 | 1188.10 | <0.0001 | Significant |
| A-MAFPA concentration | 1778.11 | 1 | 1778.11 | 1650.61 | < 0.0001 | |
| B-Methanol/oil ratio | 69.30 | 1 | 69.30 | 64.33 | < 0.0001 | |
| C-Time | 5251.64 | 1 | 5251.64 | 4875.07 | < 0.0001 | |
| AB | 59.40 | 1 | 59.40 | 55.15 | < 0.0001 | |
| AC | 264.96 | 1 | 264.96 | 245.96 | < 0.0001 | |
| BC | 34.20 | 1 | 34.20 | 31.74 | 0.0002 | |
| A 2 | 1424.53 | 1 | 1424.53 | 1322.39 | < 0.0001 | |
| B 2 | 1170.99 | 1 | 1170.99 | 1087.03 | < 0.0001 | |
| C 2 | 2241.66 | 1 | 2241.66 | 2080.92 | < 0.0001 | |
| Residual | 10.77 | 10 | 1.08 | |||
| Lack of fit | 6.62 | 5 | 1.32 | 1.60 | 0.3104 | Not significant |
| Pure error | 4.15 | 5 | 0.8302 | |||
| Cor total | 11529.9 | 19 |
Fig. 6a presents the actual versus predicted WCME conversion and it is clearly seen that the predicted values were very close to the actual values. The normal probability plot of residual is illustrated in Fig. 6b. It was seen that the errors were distributed normally around the straight line. Any value outside the interval ±5 is interpreted as a probable cause of operational error in the experimental data.56 However, in the present case the standard residual values falling in between ±2 have been obtained as seen in Fig. 7.
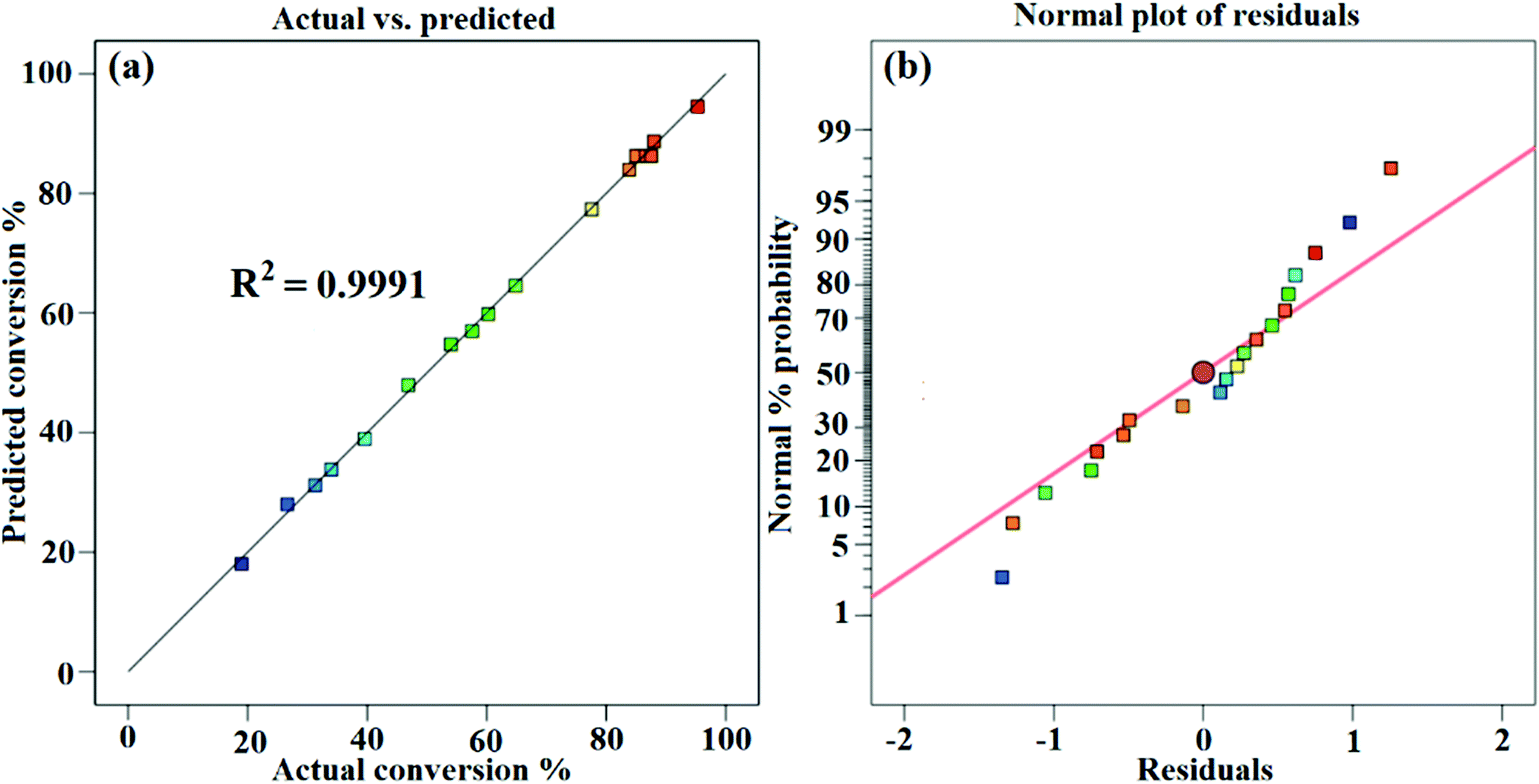 | ||
| Fig. 6 Actual vs. predicted conversion (a) and normal plot of residual (b). | ||
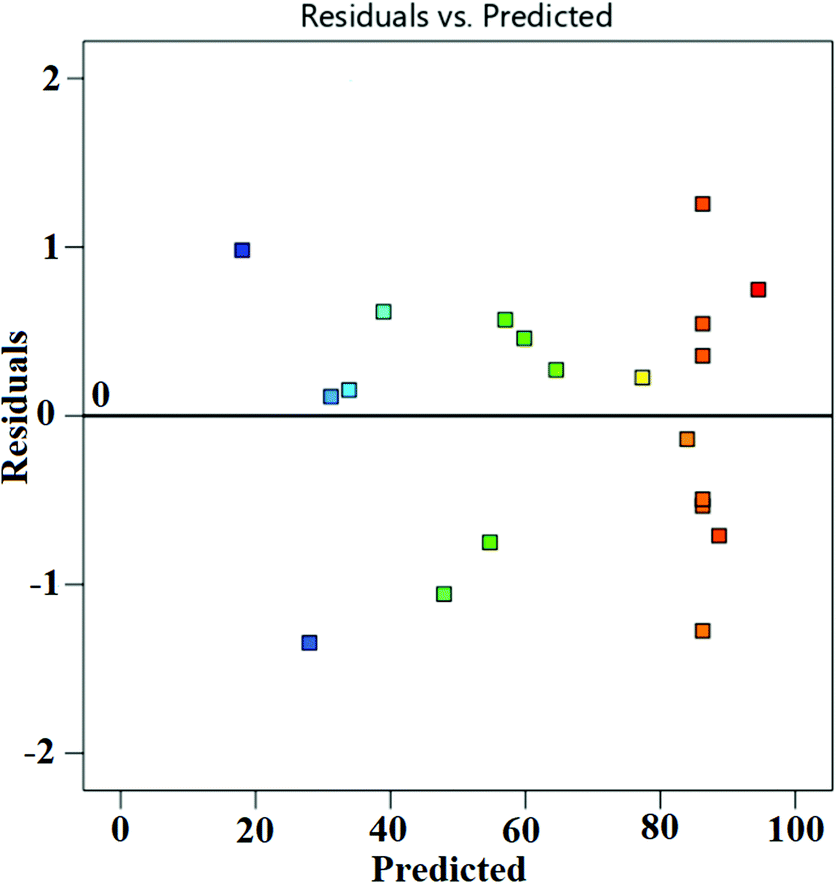 | ||
| Fig. 7 Residual vs. predicted. | ||
3.3 Reaction parameter interactive effects on WCME conversion
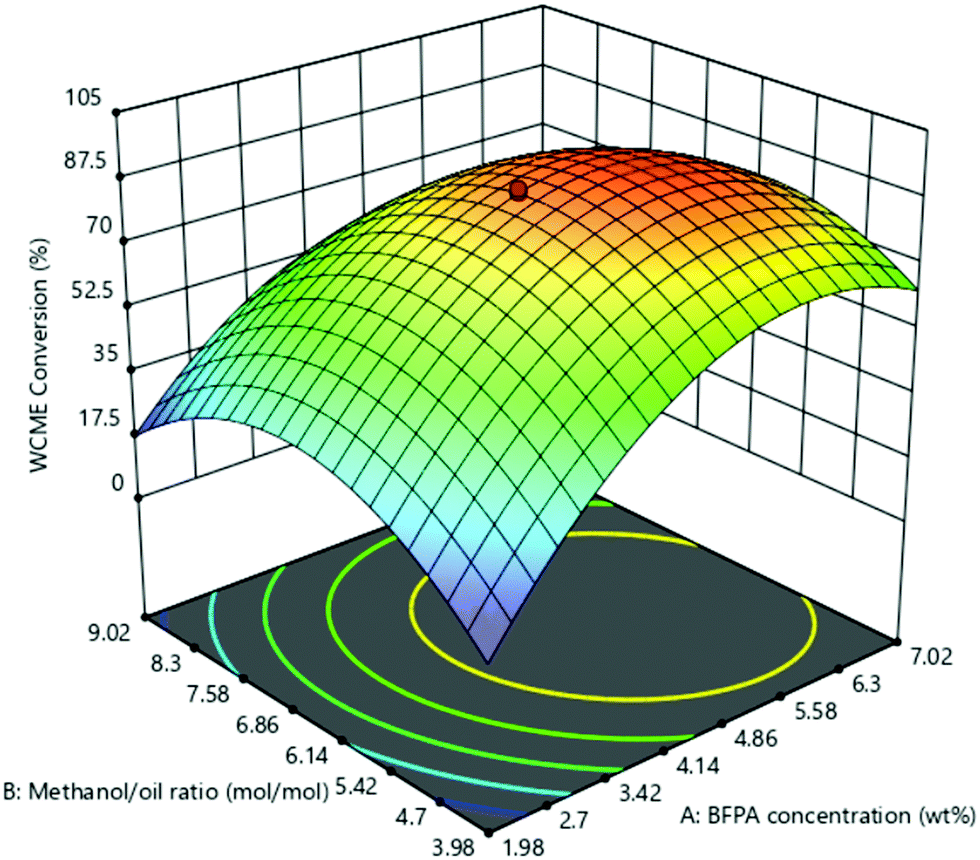
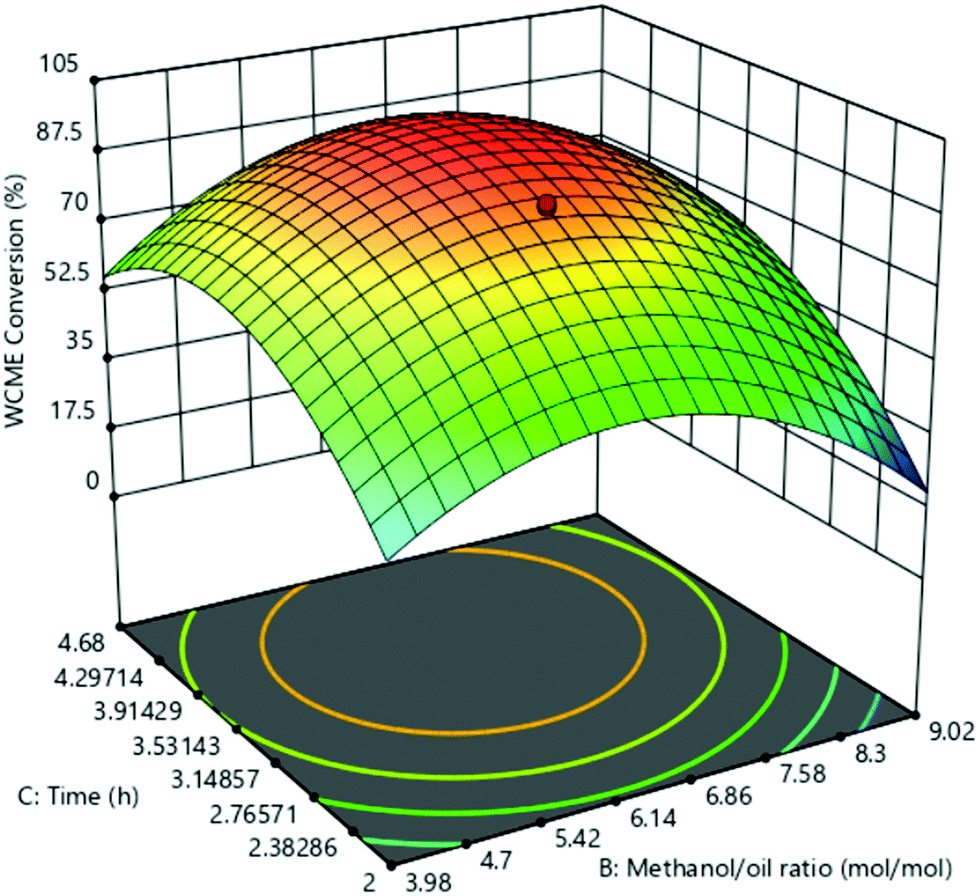
The effect of the interaction of MAFPA concentration (A) and M/O molar ratio (B) on WCME conversion is presented on Fig. 8. The MAFPA concentration range was varied in between 1.98–7.02 wt% and the M/O molar ratio was varied in between 3.98:1–9.02:1, whereas the third parameter time was fixed to 3 h at the middle level. WCME conversion increased with the increase of parameter A and parameter B at the minimum level (3.98). However, after 6.63 wt% the WCME conversion started falling with the rise in parameter A. The reason behind this can be attributed to the unavailability of methanol to shift the reaction forward. Hence, surplus methanol is required to take forward the reaction towards completion. A similar observation has also been reported by Mendonça et al.16 On the other hand, the WCME conversion is affected by increasing the parameter B while keeping A fixed at 1.98 wt%. When the parameter B increased beyond 6.86:1 M/O molar ratio, the conversion of WCME started dwindling. This trend of increase in conversion rate up to a certain limit is seen for all ranges of catalyst loading. A probable reason behind this is due to inhibition of the active catalyst surface by additional methanol. This results in lesser interaction or reaction of the catalyst with WCO.57 The downfall in conversion can also be ascribed to the occurrence of reversible reaction. WCME reduction after a certain value has also been reported with Musa acuminate peduncle as a catalyst.58 It can be noticed from the 3-D surface plot that the maximum conversion of WCME was attained in a range of 5.58–6.3 wt% and in a range of 6:14–6.86:1. The significant interaction among MAFPA concentration (A) and M/O molar ratio (B) is indicated by the lower P-value (<0.0001) of AB from Table 5.
 | ||
| Fig. 8 Interaction effects of MAFPA concentration and M/O ratio. | ||
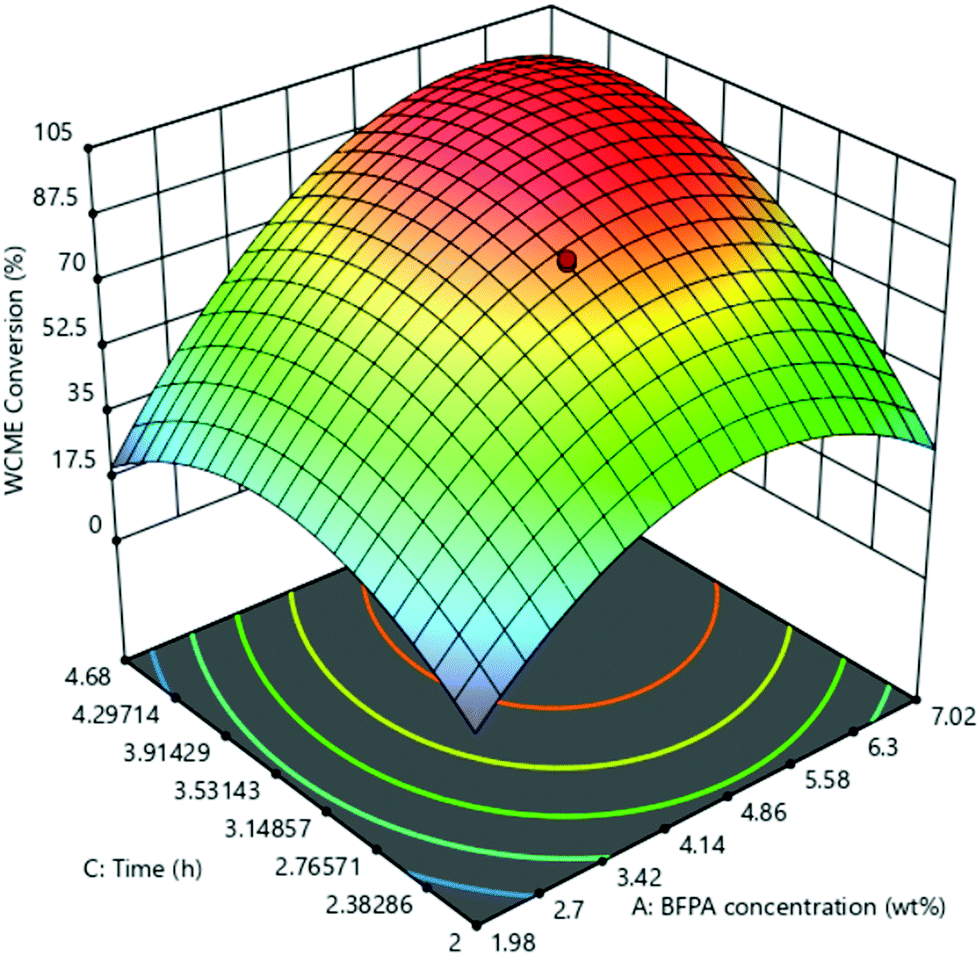
The interaction of MAFPA concentration (A) and the reaction time (C) in the transesterification influenced WCME conversion which is shown in Fig. 9. The interaction of A and C has been elucidated by keeping the parameter B constant at 6:5 M/O ratio. The WCME conversion of <35% was seen from the graph for the parameters A and C at low level which is ascribed to less active surfaces present in the reaction and inadequate time for the complete transformation of WCO into WCME.59 WCME conversion was increased sharply when the parameter A increased alone within a specific limit. This occurred because of the reactant's access to the high surface area (79.33 m2 g−1) of MAFPA catalyst resulting in high active sites to react and to move the reaction forward. A similar trend has also been obtained by other researchers in the past. Balajii et al. reported that the abrupt rise in biodiesel conversion with the rise in catalyst loading is due to the high surface area of Musa acuminate peduncle ash catalyst while converting Ceiba pentandra oil to biodiesel.58 Mendonça et al. noticed that the biodiesel conversion raised from 62.5% to 95.7% when catalyst loading is increased from 1 to 5 wt%.16 But WCME conversion started to decline when the MAFPA concentration (A) loading exceeded 5.58 wt% and parameter C was at low level (2 h). This reduction in WCME conversion is due to the increase in the viscosity of the reaction mixture which leads to poor diffusion of reactants.49,60 Betiku et al. noticed a similar observation and found that biodiesel yield gets reduced after 3.5 wt% catalyst loading.13 Conversely, WCME conversion is greatly affected when time (C) is increased keeping A at low level. The conversion was seen to increase up to 3.91 h after which it decreased steadily. The increase in conversion is due to the availability of sufficient time for the active catalyst sites to react. However the fall after 3.91 h is due to the hydrolysis of esters which begins with a further increase in reaction time.58 It was noticed from the 3-D plot (Fig. 10) that the maximum conversion was seen around 5.58–6.3 wt% for parameter A and 3.53–3.91 h for parameter C. The minimum P-value (<0.0001) obtained by ANOVA (Table 5) is due to the effect of interaction between A and C. This obtained P-value testifies the statistical significance of the parameters.
 | ||
| Fig. 9 Interaction effects of time and MAFPA concentration. | ||
 | ||
| Fig. 10 Interaction effects of time and M/O ratio. | ||
The effect of parameters B and C on WCME conversion was simulated by keeping constant parameter C in the middle level as shown in Fig. 10. WCME conversion of <40% was noticed at low values of both parameters B and C which indicated the need of extra methanol for the reaction to proceed further to completion. This fact is validated by the observed improvement in WCME conversion by increasing parameter B from 4:1 to 6.5:1. A similar observation has also been noticed by Balaji et al.58
With the rise in parameter C keeping B constant at low values the WCME comnversion increased immensly. This is due to the fact that the active sites of MAFPA got more time to come into contact with the reactants, resulting in more collisions which eventually enhanced the WCME conversion.57 The parameter B after 6.86:1 M/O ratio with a time of 2 h deteriorated the WCME conversion. With high M/O ratio, reaction mixtures became dilute which decreased the contact between active surfaces of MAFPA and reactants.16 Similarly at high M/O ratio and time, WCME conversion reduced due to glycerol's affinity to disolve in the reaction mixture coupled with dilution of MAFPA concentration in surplus methanol.58 From Fig. 10, the maximum conversion was noted in between 6.14:1–6.86:1 M/O ratio and 3.53–3.91 h. The statistical significance is registered since interaction of M/O ratio (B) and time (C) yielded a p-value of 0.0002 and high F-value of 46.59. All the plots displayed a drop in WCME conversion when all the parameters were kept at high level.
3.4 Optimization of transesterification parameters
:1 and time of 3.68 h. To validate the proposed result, proper global optimization of the parameters has been performed using PSO in the next section (Fig. 12).
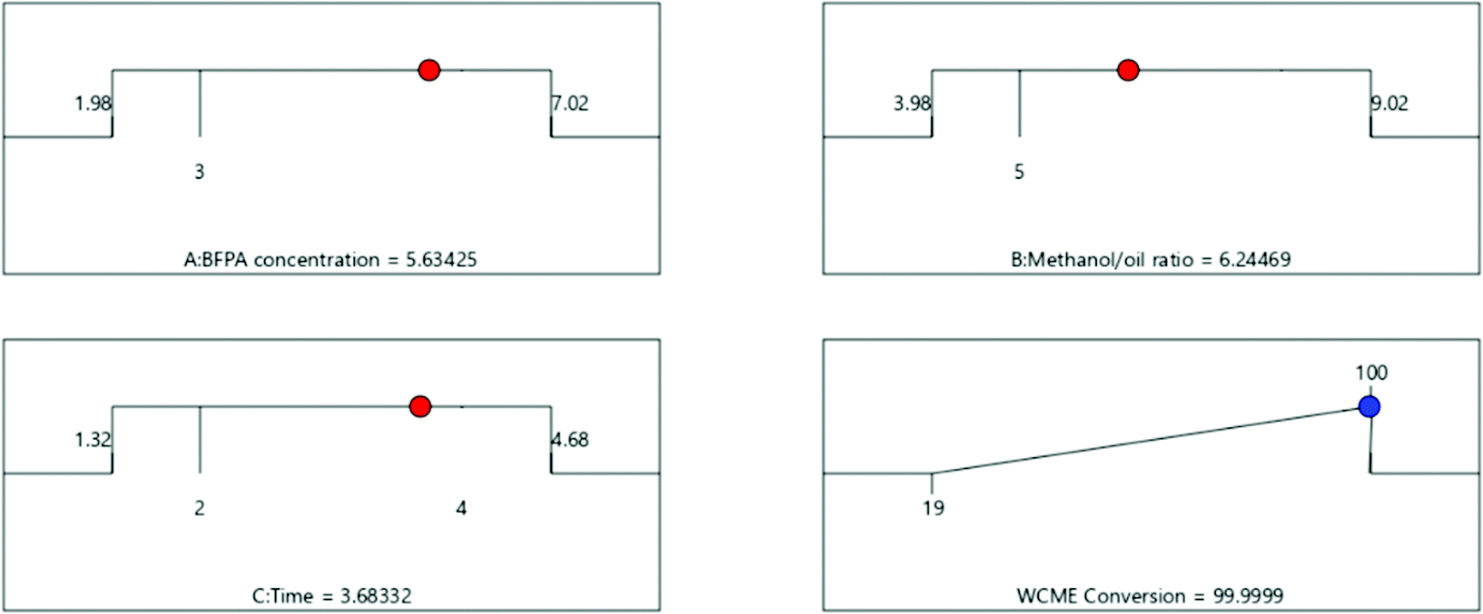 | ||
| Fig. 11 Optimized operating conditions for WCME conversion. | ||
 | ||
| Fig. 12 Convergence plots of (a) variables and (b) WCME yield obtained by PSO. | ||
| Algorithms | Parameters | Values |
|---|---|---|
| PSO | Number of birds | 25 |
| Number of iterations | 100 | |
| c 1 | 1 | |
| c 2 | 1 | |
| w | Linearly decreasing from 0.9 to 0.4 |
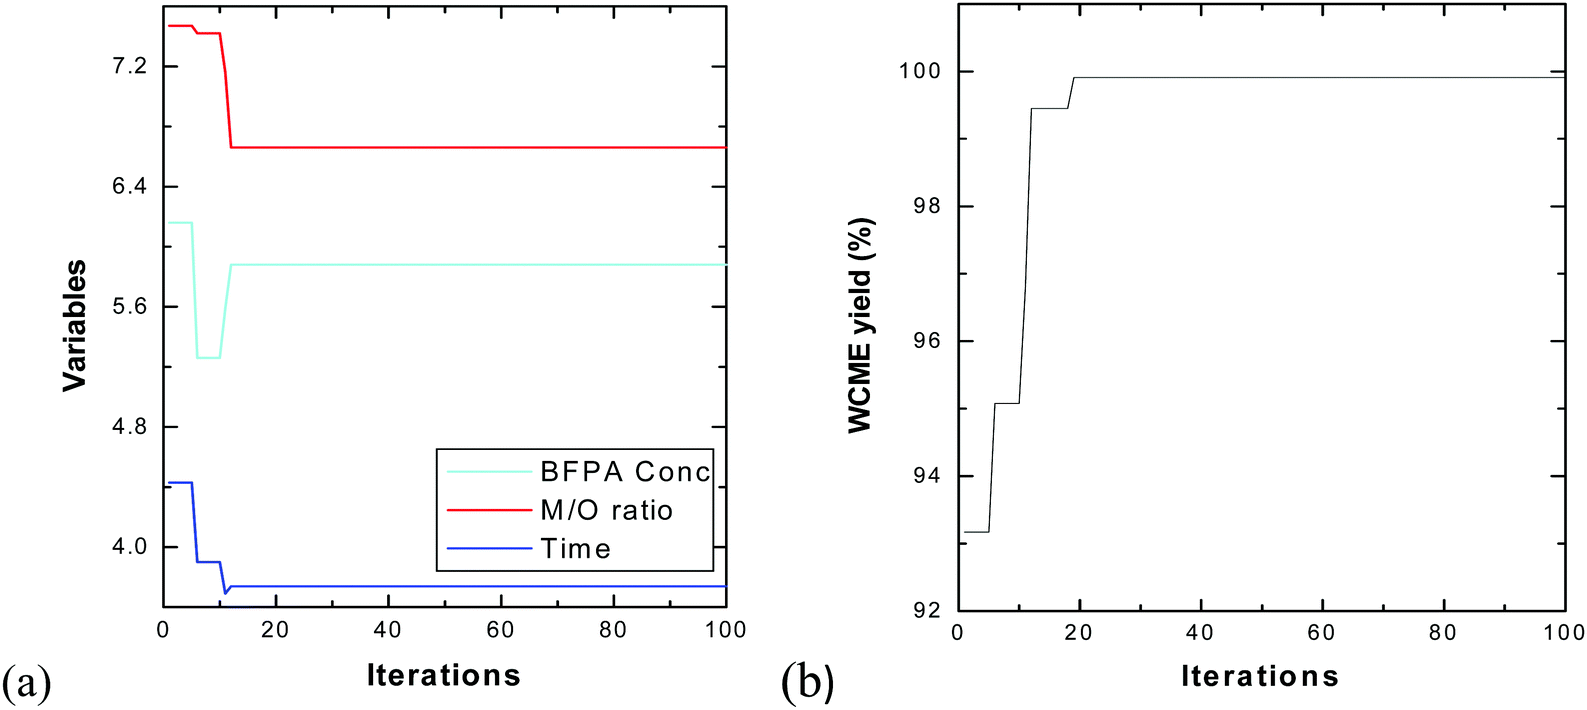
The swarm of 25 particles have converged around the 15th iteration. However, the algorithm was run for 100 iterations each time to make sure the particles do not fluctuate to newer points in the domain. From Table 7, it can be seen that the results obtained by PSO and CCD differ by a negligible amount of 0.08% which authenticates the findings. The transesterification of WCO is then performed experimentally under optimal conditions obtained from CCD using MAFPA catalyst and a conversion of 98.55 ± 0.4% (using eqn (1)) has been obtained.
| Methods | MAFPA (in %) | M/O | Time (in hours) | WCME yield (in %) |
|---|---|---|---|---|
| CCD | 5.63 | 6.24:1 |
3.68 | 99.99 |
| PSO | 5.88 | 6.66:1 |
3.74 | 99.91 |
3.5 Biodiesel charecterisation
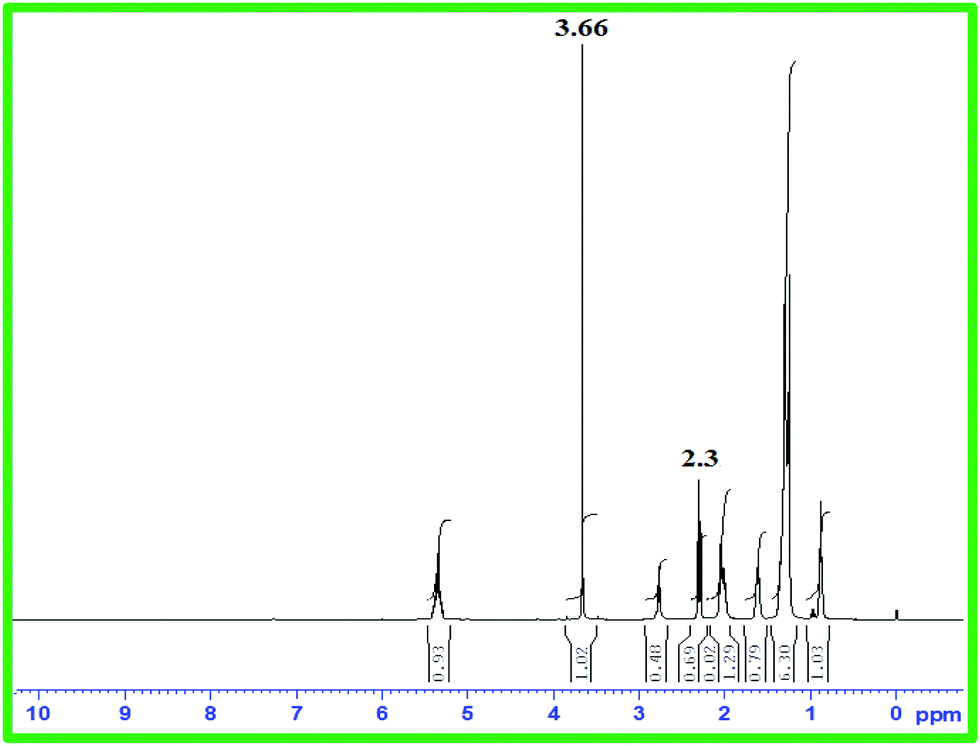 | ||
| Fig. 13 1H NMR of soybean oil biodiesel. | ||
:0) was equated with the corresponding area of WCME. The identified components of WCME are listed in Table 8.
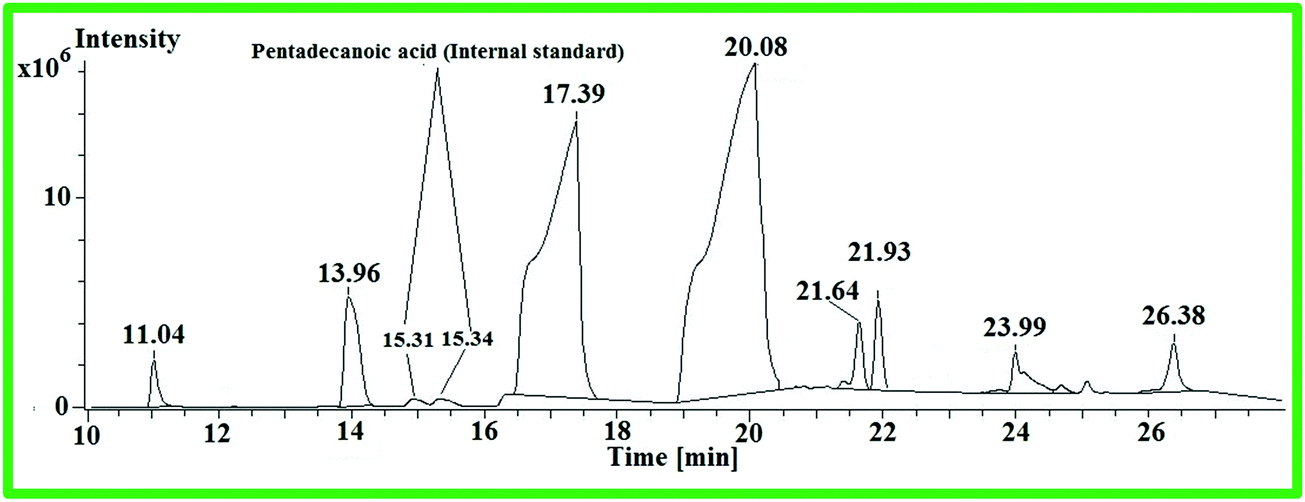 | ||
| Fig. 14 GC spectra of WCME. | ||
| Peak No | R.t. (min) | Identified compound | Corresponding acids | Quantity (%) |
|---|---|---|---|---|
| 1 | 11.04 | Methyl dodecanoate | C12:0 |
1.16 |
| 2 | 13.96 | Methyl tetradecanoate | C14:0 |
5.36 |
| 3 | 17.39 | Methyl hexadecanoate | C16:0 |
34.31 |
| 4 | 20.08 | Methyl 11-octadecanoate | C18:1 |
52.3 |
| 5 | 21.64 | Methyl-11-ecosenoate | C20:1 |
0.84 |
| 6 | 21.93 | Methyl-nonadecanoate | C20:0 |
2.22 |
| 7 | 23.99 | Methyl-docosaanoate | C22:0 |
1.97 |
| 8 | 26.38 | Methyl tetracosanoate | C24:0 |
1.81 |
From the GC–MS analysis, it was observed that the principle components present in WCME are some unsaturated methyl esters such as methyl 11-octadecadienoate (52.3%) and methyl-11-ecosenoate (0.84%) as well as saturated methyl esters such as methyl hexadecanoate (34.31%), methyl tetradecanoate (5.36%) and methyl-nonadecanoate (2.22%), methyl -docosaanoate (1.97%), methyl tetracosanoate (1.81%), and methyl dodecanoate (1.16%). The physicochemical properties of WCO and WCME were evaluated and the results are compiled in Table 9.
| Properties | WCO | WCME | ASTM standard |
|---|---|---|---|
| Saponification value (mg KOH g−1) | 184.37 | — | D 5558 |
| Acid value (mg KOH g−1) | 1.95 | 0.52 | D 664 |
| FFA (%) | 0.98 | 0.26 | D 664 |
| Kinematic viscosity (cst at 40 °C) | 34.65 | 5.37 | D 445 |
| Density (g cm−3) | 0.924 | 0.865 | D 1448–1972 |
| Cetane number | — | 52 | D 6890 |
| Flash point (°C) | 315 | 142 | D 7215 |
| Cloud point (°C) | −5 | 0 | D 97 |
| Pour point (°C) | −7 | −2 | D 2500 |
| Copper strip corrosion | 1 (a) | 1 (a) | D 130 |
3.6 Catalyst reusability
In order to ensure the efficiency of the catalyst in retaining the catalytic activity in successive cycles, reusability study has been performed.After the completion of each cycle, the catalyst was reactivated for its application in the next cycle. Once the reaction completed, the catalyst was collected through centrifugation and separated from undesirable materials by washing with distilled water and acetone followed by drying in an oven for 10 h at 100 °C. The recovered catalyst was tested for the subsequent reaction cycle under the optimal reaction conditions and the results are depicted in Fig. 15.
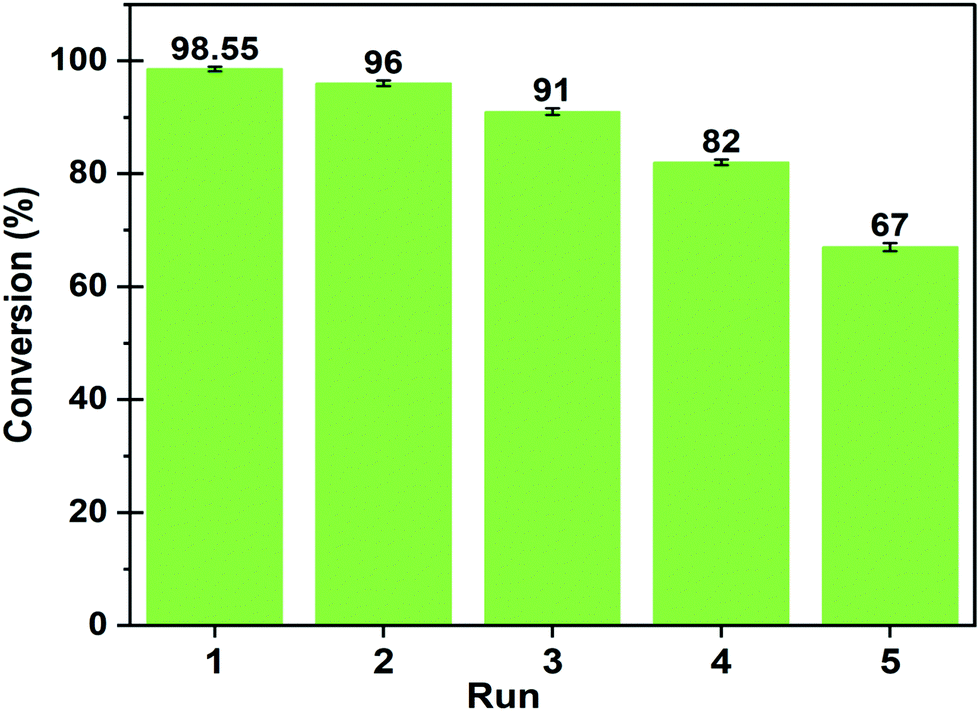 | ||
| Fig. 15 Reusability of MAFPA catalyst at a catalyst concentration of 6 wt%, methanol/oil ratio of 6:1 and time of 4 h. | ||
It has been deduced from the reusability study that a minimal fall in oil conversion to biodiesel yield occurs up to the 4th cycle. The oil conversion has abruptly dropped to 67% in the 5th cycle from 82% (4th cycle). This rapid downfall of catalytic activity in reaction was probably attributed to leaching of active sites of the presented catalyst. The EDS analysis of the spent catalyst (after the 5th cycle) clearly confirmed that the concentration of K significantly drops from 45.44 wt% to 21.82 wt% (see Fig. S2, ESI†) which is equivalent to 51.9% loss in potassium after the 5th cycle. The spent catalyst (after the 5th cycle) was also analyzed using XPS to identify the remaining elements in the catalyst after its repeated re-use in the reaction. The results of the analysis are listed in the ESI,† Table S1. The potassium percentage was found to fall from 23.5 wt% (fresh catalyst) to 13.79 wt% for the spent catalyst, which signifies a drop of 41 wt%. The full scan spectra and core level spectra of C 1s, O 1s, and K 2p are presented in the ESI† (Fig. S3). Hence, it is understood from XPS results that potassium (K = 23.5%) occupies a large portion of the fresh catalyst. In the reused catalyst (after the 4th cycle), K concentration is quite high compared to other elements. Thus, K primarily in the form of K2O and K2CO3 takes part in the transesterification reaction. Hence, the decrease in the K percentage in the catalyst affects the catalytic activity in the reaction to a large extent.
Moreover, the poor performance of the catalyst may also be due to the fact that the MAFPA surface absorbed oil, CO2, moisture, impurities, glycerol and ester during its repeated use which resulted in agglomerated and larger particle size than the fresh MAFPA.61 A larger particle size resulted in lesser exposed surface area, thereby reducing the active sites on MAFPA surfaces to interact with the reactant. This, along with leaching of active sites, is probably the reason for the significant drop in oil conversion in the 5th cycle.29,62 This fact may be confirmed from the SEM, TEM and BET analysis of the reused catalyst (after the 5th cycle). SEM and TEM clearly exhibited agglomerated and larger size particles (Fig. S4, ESI†). A reduction in surface area has been seen from the BET analysis of the spent catalyst (after the 5th cycle). The BET surface area (53.335 m2 g−1) and pore volume (0.171 cm3 g−1) of the reused catalyst have remarkably decreased from the original value obtained for the fresh catalyst (Fig. S5, ESI†). In the fresh catalyst only a mesoporous structure was observed. However, in the pore size distribution of the reused catalyst, both micro and meso pores with an average diameter of 6.96 nm have been recorded. The occurrence of these micro pores in the reused catalyst may be due to partial blockage of pores.
4. Conclusion
In conclusion, a novel catalyst from waste banana flower petals was reported for the transesterification of WCO to biodiesel, WCME. The parameters of transesterification responsible for shaping WCO into WCME were optimized with CCD of RSM to maximize the conversion. The results were validated with a powerful global metaheuristic optimization technique, Particle Swarm Optimization (PSO), where all the important variables were simultaneously optimized to get a true picture of the fitness landscape. The regression model of the numerical method anticipated a highest conversion of 99.99% with an MAFPA concentration of 5.63 wt%, M/O molar ratio of 6.24:1 and time of 3.68 h. The presence of several oxides such as K2O, SiO2, CaO, MgO, MnO, CuO, SrO, etc. in the in the presented catalyst has resulted in high basic strength. The MAFPA catalyst can be reused up to the 4th cycle, affording a high 82% conversion of WCO to biodiesel. However, the catalyst activities reduced drastically on the 5th cycle, where a relatively low 67% biodiesel conversion was observed. The ash catalyst is extremely useful considering some crucial factors such as ease in synthesis, biodegradability, low cost, high reaction activity, biogenic and eco-friendly nature. These traits make the catalyst a “green and sustainable catalyst” for industrial scale biodiesel production.
Conflicts of interest
There are no conflicts to declare.Acknowledgements
The authors gratefully acknowledged SAIF (NEHU Shillong, IIT Bombay, IIT Delhi and IIT Guwahati) for analysis. IB Laskar acknowledged MHRD, India, for providing research fellowship.References
- E. Betiku and S. O. Ajala, Ind. Crops Prod., 2014, 53, 314–322 CrossRef CAS.
- B. Changmai, C. Vanlalveni, A. P. Ingle, R. Bhagat and S. L. Rokhum, RSC Adv., 2020, 10, 41625 RSC.
- S. J. Malode, K. K. Prabhu, R. J. Mascarenhas, N. P. Shetti and T. M. Aminabhavi, Energy Convers. Manag.: X, 2021, 10, 100070 CAS.
- M. A. H. Shaah, M. S. Hossain, F. A. S. Allafi, A. Alsaedi, N. Ismail, M. O. A. Kadirb and M. Idayu Ahmad, RSC Adv., 2021, 11, 25018 RSC.
- Sahar, S. Sadaf, J. Iqbal, I. Ullah, H. N. Bhatti, S. Nouren, Habib-ur-Rehman, J. Nisar and M. Iqbal, Sustain. Cities Soc., 2018, 41, 220–226 CrossRef.
- A. Piker, B. Tabah, N. Perkas and A. Gedanken, Fuel, 2016, 182, 34–41 CrossRef CAS.
- S. Elias, A. M. Rabiu, B. Okeleye, V. Okudoh and O. Oyekola, Appl. Sci., 2020, 10, 3153 CrossRef CAS.
- S. Rezania, B. Oryani, J. Park, B. Hashemi, K. Kumar Yadav, E. E. Kwon, J. Hur and J. Cho, Energy Convers. Manag., 2019, 201, 112155 CrossRef CAS.
- P. Sharma, M. Usman, E.-S. Salama, M. Redina, N. Thakur and X. Li, Waste Manage., 2021, 136, 219–229 CrossRef CAS PubMed.
- G. Sahu, N. K. Gupta, A. Kotha, S. Saha, S. Datta, P. Chavan, N. Kumari and P. Dutta, ChemBioEng Rev., 2018, 5, 231–252 CrossRef CAS.
- C. Zhao, L. Yang, S. Xing, W. Luo, Z. Wang and P. Lv, J. Clean. Prod., 2018, 199, 772–780 CrossRef CAS.
- M. Balajii and S. Niju, Renewable Energy, 2020, 146, 2255–2269 CrossRef CAS.
- N. Daimary, P. Boruah, K. S. H. Eldiehy, T. Pegu, P. Bardhan, U. Bora, M. Mandal and D. Deka, Renewable Energy, 2022, 187, 450–462 CrossRef CAS.
- B. Nath, B. Das, P. Kalita and S. Basumatary, J. Clean. Prod., 2019, 239, 118112–118121 CrossRef CAS.
- M. Gohain, A. Devi and D. Deka, Ind. Crops Prod., 2017, 109, 8–18 CrossRef CAS.
- I. M. Mendonça, O. A. R. L. Paes, P. J. S. Maia, M. P. Souza, R. A. Almeida, C. C. Silva, S. Duvoisin and F. A. de Freitas, Renewable Energy, 2019, 130, 103–110 CrossRef.
- B. Changmai, S. Putla and L. Rokhum, Ind. Crops Prod., 2020, 145, 111911 CrossRef CAS.
- E. K. Sitepu, Y. Sembiring, M. Supeno, K. Tarigan, J. Ginting, J. A. Karo-karo and J. B. Tarigan, S. Afr. J. Chem. Eng., 2022, 40, 240–245 Search PubMed.
- M. Babaki, M. Yousefi, Z. Habibi and M. Mohammadi, Renewable Energy, 2017, 105, 465–472 CrossRef CAS.
- T. S. Singh and T. N. Verma, Energy Convers. Manage., 2019, 182, 383–397 CrossRef CAS.
- Y. H. Tan, M. O. Abdullah, J. Kansedo, N. M. Mubarak, Y. S. Chan and C. Nolasco-Hipolito, Renewable Energy, 2019, 21, 101317–101326 Search PubMed.
- F. Hussain, S. Alshahrani, M. M. Abbas, H. M. Khan, A. Jamil, H. Yaqoob, M. E. M. Soudagar, M. Imran, M. Ahmad and M. Munir, Catalysts, 2021, 11, 630 CrossRef CAS.
- Y. H. Tan, M. O. Abdullah, J. Kansedo, A. Saptoro and C. N. Hipolito, J. Appl. Sci. Process Eng., 2018, 5, 277–285 CrossRef CAS.
- M. D. Putra, C. Irawan, Udiantoro, Y. Ristianingsih and I. F. Nata, J. Clean. Prod., 2018, 195, 1249–1258 CrossRef CAS.
- J. M. Jung, J. I. Oh, K. Baek, J. Lee and E. E. Kwon, Energy Convers. Manage., 2018, 165, 628–633 CrossRef CAS.
- S. Niju, K. M. Meera, S. Begum and N. Anantharaman, Arab. J. Chem., 2016, 9, 633–639 CrossRef CAS.
- D. Mohapatra, S. Mishra and N. Sutar, J. Sci. Ind. Res., 2010, 69, 323–329 CAS.
- H. Wang, Y. Li, F. Yu, Q. Wang, B. Xing, D. Li and R. Li, Chem. Eng. J., 2019, 364, 111–122 CrossRef CAS.
- A. F. Lee and K. Wilson, Catal. Today, 2015, 242, 3–18 CrossRef CAS.
- A. Carrero, G. Vicente, R. Rodríguez, M. Linares and G. L. Del Peso, Catal. Today, 2011, 167, 148–153 CrossRef CAS.
- S. Dharma, H. H. Masjuki, H. C. Ong, A. H. Sebayang, A. S. Silitonga, F. Kusumo and T. M. I. Mahlia, Energy Convers. Manage., 2016, 115, 178–190 CrossRef CAS.
- K. Rajkumari, D. Das, G. Pathak and L. Rokhum, New J. Chem., 2019, 43, 2134–2140 RSC.
- G. Pathak, K. Rajkumari and L. Rokhum, Nanoscale Adv., 2019, 1, 1013–1020 RSC.
- B. Changmai, P. Sudarsanam and L. Rokhum, Ind. Crops Prod., 2019, 145, 111911–111921 CrossRef.
- I. B. Laskar, K. Rajkumari, R. Gupta, S. Chatterjee, B. Paul and L. Rokhum, RSC Adv., 2018, 8, 20131–20142 RSC.
- K. Rajkumari and L. Rokhum, Biomass Convers. Biorefin., 2020, 10, 839–848 CrossRef CAS.
- N. Mansir, S. H. Teo, U. Rashid, M. I. Saiman, Y. P. Tan, G. A. Alsultan and Y. H. Taufiq-Yap, Renewable Sustainable Energy Rev., 2018, 82, 3645–3655 CrossRef CAS.
- G. Knothe and J. A. Kenar, Eur. J. Lipid Sci. Technol., 2004, 106, 88–96 CrossRef CAS.
- K. V. Yatish, H. S. Lalithamba, R. Suresh, S. B. Arun and P. V. Kumar, Process Saf. Environ. Prot., 2016, 102, 667–672 CrossRef CAS.
- M. G. Nayak and A. P. Vyas, Renewable Energy, 2019, 138, 18–28 CrossRef CAS.
- M. Barekati-Goudarzi, D. Boldor and D. B. Nde, Bioresour. Technol., 2016, 201, 97–104 CrossRef CAS PubMed.
- J. Kennedy and R. C. Eberhart, Proc. ICNN’95 – Int. Conf. Neural Networks, Perth, WA, Aust. IEEE Xplore, 1995, vol. 4, pp. 1942–1948.
- T. Deshamukhya, D. Bhanja and S. Nath, Proc. Inst. Mech. Eng. Part A J. Power Energy, 2020, 234, 1–14 Search PubMed.
- I. B. Laskar, L. Rokhum, R. Gupta and S. Chatterjee, Environ. Prog. Sustainable Energy, 2019, 39, 1–11 Search PubMed.
- A. M. Rabie, M. Shaban, M. R. Abukhadra, R. Hosny, S. A. Ahmed and N. A. Negm, J. Mol. Liq., 2019, 279, 224–231 CrossRef CAS.
- R. Madhuvilakku and S. Piraman, Bioresour. Technol., 2013, 150, 55–59 CrossRef CAS PubMed.
- G. Pathak, D. Das, K. Rajkumari and L. Rokhum, Green Chem., 2018, 20, 2365–2373 RSC.
- M. Sharma, A. A. Khan, S. K. Puri and D. K. Tuli, Biomass Bioenergy, 2012, 41, 94–106 CrossRef CAS.
- I. B. Laskar, K. Rajkumari, R. Gupta, S. Chatterjee, B. Paul and L. Rokhum, RSC Adv., 2018, 8, 20131–20142 RSC.
- I. B. Laskar, K. Rajkumari, R. Gupta and L. Rokhum, Energy Fuels, 2018, 32, 12567–12576 CrossRef CAS.
- C. X. A. Da Silva, V. L. C. Gonalves and C. J. A. Mota, Green Chem., 2009, 11, 38–41 RSC.
- L. M. Correia, R. M. A. Saboya, N. de Sousa Campelo, J. A. Cecilia, E. Rodrguez-Castelln, C. L. Cavalcante and R. S. Vieira, Bioresour. Technol., 2014, 151, 207–213 CrossRef CAS PubMed.
- B. Changmai, I. B. Laskar and L. Rokhum, J. Taiwan Inst. Chem. Eng., 2019, 102, 276–282 CrossRef CAS.
- A. Birla, B. Singh, S. N. Upadhyay and Y. C. Sharma, Bioresour. Technol., 2012, 106, 95–100 CrossRef CAS PubMed.
- H. Jaliliannosrati, N. A. S. Amin, A. Talebian-Kiakalaieh and I. Noshadi, Bioresour. Technol., 2013, 136, 565–573 CrossRef CAS PubMed.
- G. T. Ang, S. N. Ooi, K. T. Tan, K. T. Lee and A. R. Mohamed, Energy Convers. Manage., 2015, 99, 242–251 CrossRef CAS.
- M. A. Olutoye, S. C. Lee and B. H. Hameed, Bioresour. Technol., 2011, 102, 10777–10783 CrossRef CAS PubMed.
- M. Balajii and S. Niju, Energy Convers. Manage., 2019, 189, 118–131 CrossRef CAS.
- M. Gohain, A. Devi and D. Deka, Ind. Crops Prod., 2017, 109, 8–18 CrossRef CAS.
- S. H. Dhawane, T. Kumar and G. Halder, Energy Convers. Manage., 2016, 122, 310–320 CrossRef CAS.
- S. Sirisomboonchai, M. Abuduwayiti, G. Guan, C. Samart, S. Abliz, X. Hao, K. Kusakabe and A. Abudula, Energy Convers. Manage., 2015, 95, 242–247 CrossRef CAS.
- G. Joshi, D. S. Rawat, B. Y. Lamba, K. K. Bisht, P. Kumar, N. Kumar and S. Kumar, Energy Convers. Manage., 2015, 96, 258–267 CrossRef CAS.
Footnote |
| † Electronic supplementary information (ESI) available. See DOI: https://doi.org/10.1039/d2ya00011c |
| This journal is © The Royal Society of Chemistry 2022 |