Electronic structure manipulation via composition tuning for the development of highly conductive and acid-stable oxides†
Young-Woon
Byeon
 a,
Jonathan
Mailoa
 b,
Mordechai
Kornbluth
 b,
Gi-Hyeok
Lee
 c,
Zijian
Cai
 ad,
Yingzhi
Sun
 ad,
Wanli
Yang
 c,
Christina
Johnston
 e,
Jake
Christensen
 e,
Soo
Kim
 *b,
Lei
Cheng
 *e and
Haegyeom
Kim
 *a
*a
aMaterials Sciences Division, Lawrence Berkeley National Laboratory, 1 Cyclotron Rd, Berkeley, CA 94720, USA. E-mail: haegyumkim@lbl.gov
bResearch and Technology Center, Robert Bosch LLC, 1 Kendall Square Suite 7-101, Cambridge, MA 02139, USA. E-mail: skcheme@gmail.com
cAdvanced Light Source, Lawrence Berkeley National Laboratory, Berkeley, CA 94720, USA
dDepartment of Materials Science and Engineering, University of California Berkeley, Berkeley, CA 94704, USA
eResearch and Technology Center, Robert Bosch LLC, 384 Santa Trinita Ave., Sunnyvale, CA 94085, USA. E-mail: Lei.Cheng2@us.bosch.com
First published on 11th October 2022
Abstract
Exploring materials that simultaneously possess high conductivity and electrochemical stability is critical for various energy-conversion applications. In this study, our combined computations and experiments suggest the Mg–Ti–O chemical space for novel ternary oxide compounds offering high electrical conductivity and corrosion stability in acidic conditions to be potentially used as catalyst supporter of polymer electrolyte membrane fuel cells. High electrical conductivity (6.09 × 10⁻¹ S cm−1) is achieved at room temperature by tuning the chemical composition of Mg1−xTi2+xO5 while still maintaining good corrosion stability (1.2 × 10⁻⁴ mA cm−2 after six days) in acidic conditions. Furthermore, we discover that a reducing gas environment during the synthesis increases the Ti solubility in Mg1−xTi2+xO5 with a reduced valence state of Ti, thus resulting in high conductivity.
Introduction
There is often a trade-off between functionality and compatibility in materials, where a single material cannot simultaneously fulfill all the material properties required in applications. Electrical conductivity and electrochemical stability are needed in materials for nearly all clean-energy electrochemical technologies, including batteries, solar cells, fuel cells, water splitting, and CO2 reduction.1–3 Good examples are protective coatings of battery current collectors, bipolar plate coatings in fuel cells, electrolyzers, and catalyst supporters.4–7 These properties are essential for increasing the energy efficiency and reliability and reducing maintenance costs. In particular, the electrical conductivity and electrochemical stability in an acidic environment are important for energy conversion in polymer electrolyte membrane fuel cells (PEMFCs).Generally, transition-metal oxides offer better electrochemical stability in acidic environments at the expense of conductivity. Various metal oxides such as TiO2, WO3, RuO2, MoO3, SnO2, CeO2, and MnO2 have been investigated as acid-stable compounds.8–10 Among the set of materials explored in the literature, TiO2 has been found to be quite stable in acidic medium.11–13 However, its less conducting nature results in a low electronic conductivity, thereby contributing significantly to the ohmic overpotential in PEMFCs.14–16 According to a recent study from Kumar et al.,9 WO3 nanorods exhibit good electrochemical stability for catalyst-support applications. Their stability in an acidic environment appears to be quite good, with a negligible relative decrease in the electrochemically active surface area after 10![[thin space (1/6-em)]](https://www.rsc.org/images/entities/char_2009.gif) 000 cycles. However, its low electronic conductivity (7.8 × 10⁻⁵ S cm−1) requires further improvement.
000 cycles. However, its low electronic conductivity (7.8 × 10⁻⁵ S cm−1) requires further improvement.
To develop a highly conductive and highly corrosion-resistant material, one typical strategy is the aliovalent substitution into acid-stable but less conductive materials to improve their electrical conductivity.10 Various binary metal oxides, including Nb-doped TiO2, Sn-doped In2O3, and Sb-doped SnO2 have been reported thus far.10,13,14,17 Recently, a high-throughput computational approach was used to search for appropriate alternatives among ∼48![[thin space (1/6-em)]](https://www.rsc.org/images/entities/char_2009.gif) 000 oxides in the Materials Project database.18 As a result of this effort, Wang et al. proposed 68 ternary and quaternary metal oxides after evaluating the aqueous stability of all candidates in strong acid and further ruling out the materials with a large energy bandgap (Eg), i.e., low electrical conductivity. Ternary or quaternary oxide compounds are good systems to explore because the valence state of the transition-metal ions and electronic structure can be tuned, thereby improving the electrical conductivity while maintaining electrochemical stability in an acidic environment.
000 oxides in the Materials Project database.18 As a result of this effort, Wang et al. proposed 68 ternary and quaternary metal oxides after evaluating the aqueous stability of all candidates in strong acid and further ruling out the materials with a large energy bandgap (Eg), i.e., low electrical conductivity. Ternary or quaternary oxide compounds are good systems to explore because the valence state of the transition-metal ions and electronic structure can be tuned, thereby improving the electrical conductivity while maintaining electrochemical stability in an acidic environment.
In this work, we conducted a combined computational and experimental study to investigate ternary oxide compounds that exhibit both high electrical conductivity and stability in an acidic environment. Our computational density functional theory (DFT) study proposed Mg–Ti–O chemical space as a promising candidate, and the chemical space is thoroughly investigated experimentally. Despite Mg–Ti–O compounds commonly being considered insulating materials,19,20 we achieved high electrical conductivity (6.09 × 10⁻¹ S cm−1) and good electrochemical stability in acidic environments by controlling the composition of Mg1−xTi2+xO5 (hereafter, MTO) and synthesis conditions.
Experimental details
DFT calculations
First-principles DFT calculations were performed using the Perdew–Burke–Ernzerhof (PBE) formulation of the generalized gradient approximation (GGA) with the projected augmented wave method, as implemented in the Vienna Ab Initio Simulation Package (VASP).21–25 To screen the various oxide materials, we used the GGA to consistently perform the binding energy comparison, rather than applying the U value (i.e., material-dependent empirical parameters).26 A plane-wave basis set cutoff energy of 520 eV and a minimum of 1000 k-points per reciprocal atom were used for the calculations. We used a vacuum thickness of at least >12 Å to avoid the interactions between the top and bottom surfaces. For additional details regarding the computational details, please see the ESI.†Material synthesis
The MTO materials used in the study were prepared using a solid-state method. First, we weighed and mixed precursor powders (MgCO3 (Acros Organics, reagent grade), MgO (Sigma-Aldrich, 99.99%), TiO (Sigma-Aldrich, 99.9%), Ti2O3 (Sigma-Aldrich, 99.9%), and TiO2-anatase nanoparticle (Sigma-Aldrich, 99.7%)) to the appropriate stoichiometry. To prevent the hydration of MgCO3 powder or any potential contamination of the mixtures, most of the preparation procedures were conducted in an Ar-filled glove box. The mixture was then pelletized and sintered at 1100–1500 °C for 5 h under various gas environments of H2 (2%)/Ar (98%) mixed gas, Ar gas (99.999%), and ambient air.Microstructural and chemical analyses
The crystal structure of each sample was analyzed using X-ray diffraction (XRD; Rigaku Miniflex 600) with Cu Kα radiation, and the structural parameters were determined using the Rietveld method and Profex software.27 For the XRD analysis, the as-synthesized MTO pellets were ground well using a mortar and pestle. High-angle annular dark-field scanning transmission electron microscopy (HAADF-STEM) and electron energy-loss spectroscopy (EELS) spectra were collected on a FEI Tecnai F20 UT microscope equipped with a Gatan imaging filter at an acceleration voltage of 200 kV. TEM samples were prepared using a dual-beam focused ion beam-scanning electron microscopy (SEM) system (FIB-SEM, FEI Helios UX). X-ray photoelectron spectroscopy (XPS) measurements were performed on a Thermo Scientific K-Alpha XPS System with a monochromatic Al Kα X-ray source. The spectra were acquired with a passing energy of 50 eV and a dwell time of 50 ms. Each sputtering was performed with a 1 keV Ar+ beam for 20 s. All the instruments for FIB, TEM, and XPS analyses were located at the Molecular Foundry at Lawrence Berkeley National Laboratory (LBNL).Hard X-ray absorption spectroscopy (hXAS) at the Ti K-edge were measured in transition mode at beamline 20-BM-B of the Advanced Photon Source, Argonne National Laboratory. An Si (111) monochromator was used for selecting the incident beam energy. An Rh-coated mirror was applied to obtain harmonic rejection. The energy calibration was accomplished by simultaneously measuring the spectra of Ti-metal foil. Normalization, calibration, and linear combination fitting of raw data were performed by Athena software.28 Ti L3-edge resonant inelastic X-ray scattering (RIXS) spectra were obtained in the iRIXS endstation at beamline 8.0.1 of the Advanced Light Source at LBNL. The MTO samples were mounted on a copper sample holder and transferred to the ultrahigh vacuum chamber for the measurement. The resolving power of the incident X-rays is around 1500, and the samples were continuously moved within a 5 mm range to minimize photon-beam damage. The emission spectra at each excitation energy were collected for 200 s. The excitation energy of 458 eV was used for the measurement of RIXS, which corresponds to the t2g resonance for the Ti L3-edge.
Evaluation of conductivity and corrosion stability
The electrical conductivities of the MTOs were measured using the direct-current (DC) polarization method. DC voltages of 0.1–1 V were applied, and the saturated currents at each applied voltage were measured using a multipotentiostat (Biologic VMP-300). For the electrical/electrochemical analyses of the synthesized MTO, as-sintered pellets were used to ensure a higher pellet density (∼85%). Static corrosion current measurements were performed in a three-electrode liquid-cell setup. The counter electrode used in our experiments was a ∼16 cm2 Pt mesh, and the reference electrode was a Ag/AgCl electrode in KCl solution. MTO pellets with a high relative density (∼85%) were used for the corrosion current measurements. The MTO sample with an effective area of 1 cm2 was used as the working electrode. Before the corrosion measurement, all the sample surfaces (including SS316 and graphite sheets) were polished using 320 to 800 grit sandpaper. This was performed to achieve a similar surface roughness for the different samples for static corrosion current measurements; sulfuric acid (pH = 2) was used as the electrolyte. The static corrosion current was recorded at 1.0 V bias vs. a Ag/AgCl reference electrode for 144 h at 60 °C in a temperature chamber.Results
Materials prediction
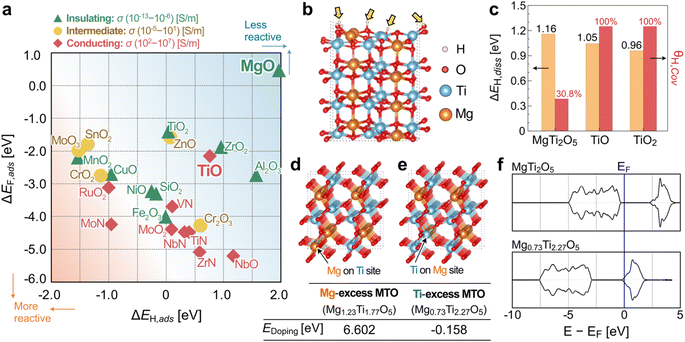
To search for chemically protective oxides, first-principles DFT calculations were conducted between various adsorbing corrosive chemical molecules and the oxide substrate DFT slab models. Fig. 1a presents the DFT single-adsorption calculation results of ΔEF,ads as a function of ΔEH,ads for 23 binary oxide and nitride materials tested in this work and the approximate range of experimental conductivities, σ, in S m−1 (see Table S1 in ESI†). For further details and rationales on our theoretical calculation procedure and analysis, please refer to ESI Note 1 and Fig. S1–S4.† In Fig. 1a, MgO is observed to be the most protective chemical species against H and F adsorption (i.e., more positive binding energies); however, MgO is also known to have an experimental bandgap greater than 5 eV (i.e., insulating). Most conducting materials such as NbO, MoO2, RuO2, and nitrides are located near the lower-left quadrant of Fig. 1a – i.e., not very protective against corrosive species. We note in Fig. 1a that TiO, which is typically observed as a matrix within reduced titanium oxide (TiOx), is moderately protective and electronically conducting. According to our theoretical analysis in Fig. 1a, we propose a hypothesis that a ternary Mg–Ti–O compound may be able to have both anti-corrosive and conductive characters if the oxidation state of Ti can be controlled (i.e., less than +4). Here, we made an admittedly simple assumption that the surface characteristics of a ternary Mg–Ti–O compound may be similar to that of Mg–O and Ti–O octahedrons in binary oxide systems. There are several different stable MTO compounds, including MgTiO3, Mg2TiO4, and MgTi2O5, that are experimentally accessible (i.e., synthesizable). Among these, we selected the Ti-excess MgTi2O5 (orthorhombic, Cmcm) as a model system, as shown in Fig. 1b, to verify our proposed hypothesis of Mg–O and Ti–O contributing to the anti-corrosive character and increased conductivity, respectively, for a ternary Mg–Ti–O chemical system.Furthermore, we performed hydrogen-dissociation DFT calculations on MgTi2O5, TiO, and TiO2, as shown in Fig. S5.† The (110), (100), and (101) surface facets were selected for MgTi2O5, TiO, and TiO2, respectively, because they are the most energetically stable (i.e., lowest surface energy) surface facet for each material. We report in Fig. 1c that the calculated hydrogen dissociation energies (ΔEH,diss) for MgTi2O5, TiO, and TiO2 are similar: approximately 1 eV per adsorption site. However, a significantly reduced hydrogen coverage (θH,cov, the ratio between H atoms to surface oxygen atoms) was observed in the (110) MgTi2O5 system (∼30.8%), whereas the (100) TiO and (101) TiO2 surfaces were fully covered by hydrogen. This finding directly hints at the possibility of the improved anticorrosive characteristic of MgTi2O5-based compounds.
Next, we examined the electronic structures of various MgTi2O5-based compounds by varying the composition ratio of Mg/Ti to find the conductive phase of MTO compounds. Fig. 1d–e present the chemical structures of Mg1.23Ti1.77O5 and Mg0.73Ti2.27O5, which were selected as representative phases where an extra Mg or Ti atom is occupying the Ti or Mg site in MgTi2O5, respectively. According to our DFT calculations, while Ti substitution on the Mg site is energetically favored (−0.158 eV per site with respect to elemental Mg and Ti), Mg substitution at the Ti site is not very feasible (+6.602 eV per site). We find in Fig. 1f that the Ti-excess MTO system (here, Mg0.73Ti2.27O5) drastically modifies the electronic structure of pristine MgTi2O5. The calculated density of states (DOS) of MgTi2O5 clearly shows a DFT bandgap of ∼2.5 eV, underestimated from the experimentally reported bandgap of 3.4 eV.29,30 Although it is well known that DFT underestimates band gaps for semiconductors,31 our DFT calculation proves the insulating nature of the pristine MgTi2O5 compound. We observe that the Fermi level (EF) of Mg0.73Ti2.27O5 is now being occupied from the DOS analysis in Fig. 1f for the Ti-excess MTO system. This indicates that the electronic structures can be tuned to become metallic for Ti-excess MTO phases (for details, see Fig. S6 in ESI†). Our DFT calculations also suggest that oxygen vacancy formation is challenging in the MTO system. For both bulk and (110) surface cells, the calculated oxygen vacancy formation energies are higher than +5 eV: for bulk MTO cell (Mg12Ti24O59, equivalent to MgTi2O4.92), EOvac,bulk = +5.694 eV per site. For (110) surface of MTO cell (Mg16Ti32O79, equivalent to MgTi2O4.94), EOvac,surf = +5.271 eV per site. It is slightly easier to take O from the surface, but in either case, the oxygen vacancy formation energy is huge. In other words, +5 eV of the energy means that it is extremely difficult to remove the oxygen from bulk MTO or (110) facet of MTO surface. Therefore, in our XRD studies below, we assume that MTOs have a full oxygen occupancy. In the following section, we will discuss our experimental efforts to find the optimal chemical composition of MTO compounds that preserve both conductivity and anti-corrosive character.
Understanding synthesis parameters to make conductive MTO
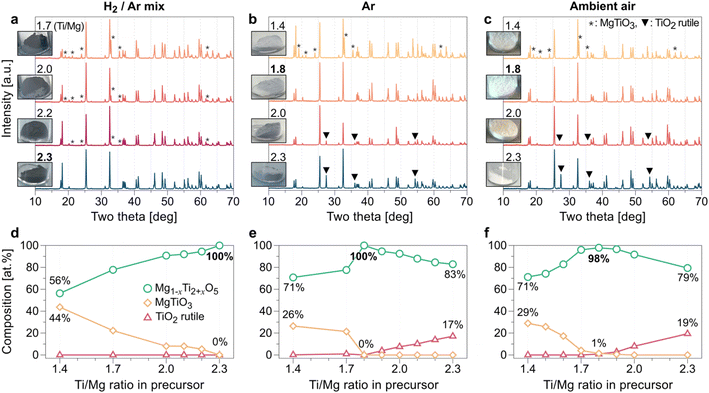
To select the appropriate precursors for practical access to the Mg–Ti–O ternary compounds, we first tested various precursors of Mg and Ti, including MgO, MgCO3, TiO, Ti2O3, and TiO2 (see Fig. S7 in ESI†). According to the XRD results of the products from each precursor set, MgCO3 and TiO2 precursors were selected to form the pure MgTi2O5 phase. Subsequently, we applied a systematic approach by tuning the precursor ratio and the gas environments (H2 (2%)/Ar (98%) mixed gas, Ar gas, and ambient air) to achieve the lowest oxidation state of Ti within the solubility limit in MTO (Fig. 2). When MgCO3 is excessive (Ti/Mg < 2.3) in the precursor mixture, a MgTiO3 phase (denoted * in Fig. 2a) appears in the synthesized MTO as an impurity under H2/Ar mixed gas flow. Similarly, we observed the MgTiO3 phase as an impurity (denoted * in Fig. 2b and c) under Ar gas flow or ambient air environment when the Ti/Mg ratio is smaller than 1.8. In contrast, a rutile TiO2 phase (denoted ▼ in Fig. 2b and c) remains as an impurity after the synthesis reactions in Ar gas and ambient air environments when relatively more TiO2 precursor (Ti/Mg > 1.8) is used. In contrast, MTOs synthesized under the mixed gas (H2/Ar) do not contain the rutile TiO2 impurity until the Ti/Mg ratio reaches 2.3, where a pure MTO phase forms. MTOs synthesized under H2/Ar mixed gas flow are expected to have the most Ti3+ components compared with the MTOs synthesized under the other gas environments due to their expected composition (Ti-rich composition) and darkest powder color. In general, a darker color of titanium-based oxide powder indicates that their electrical conductivity is high.32–34 For the Ti/Mg precursor ratio = 2.3, the highest Ti content in the test (Fig. 2a and d), we observed that Mg0.77Ti2.23O5 is formed, according to Rietveld refinement results. This corresponds to Ti3.80+ as an average oxidation state of Ti (see Fig. S8a†). Under the Ar gas environment, the purest MTO phase is produced at a lower TiO2 precursor ratio, compared with the H2/Ar mixed gas flow (Fig. 2b and e). For Ti/Mg = 1.8, according to the Rietveld refinement results, Mg0.89Ti2.11O5 (Ti3.90+) is formed (see Fig. S8b†). Under ambient air, the purest MTO phase is produced for Ti/Mg = 1.8 (Fig. 2c and f), and we confirmed the formation of Mg0.97Ti2.03O5 (Ti3.97+) using Rietveld refinement (see Fig. S8c†). Notably, regardless of the Ti content in the precursors, the color of the synthesized MTO is likely to be determined by the gas environment (see Fig. 2a–c and S9†). To better understand the roles of temperature and the gas environment in the synthesis of MTO, we conducted temperature- and gas-controlled experiments (see Fig. S10†). We found that a lower temperature always results in less purity of MTO regardless of the gas environment. This can be explained by previous reports on the formation of the MgTi2O5 phase, which requires high temperature for phase transformation.35,36 H2/Ar mixed gas flow could form a black MTO powder even at a relatively low temperature (1100 °C). This clearly demonstrates that the synthesis of black MTO powder is determined by H2/Ar gas (i.e., reducing environment), which will likely help in reducing the oxidation state of Ti in MTO.Improving electrical conductivity of MTOs
The electrical conductivities of the MTOs were evaluated using the DC polarization test on the as-sintered MTO pellets (Table 1). As expected from its dark color, MTO synthesized under H2/Ar mixed gas (Mg0.77Ti2.23O5) exhibits the highest conductivity among the other gas environments. The measured value from the MTO synthesized under H2/Ar gas is ∼5 orders of magnitude higher than that of the MTO under Ar. The MTO synthesized under ambient air exhibited insulating properties. Its conductivity was beyond the range of our instrument.| Gas environment | H2/Ar mixed | Ar gas | Ambient air |
|---|---|---|---|
| Precursor ratio (Ti/Mg) | 2.3 | 1.8 | 1.8 |
| Formula | Mg0.77Ti2.23O5 | Mg0.89Ti2.11O5 | Mg0.97Ti2.03O5 |
| Color of powder | Black | Gray | White |
| Conductivity [S cm−1] | 3.1 × 10⁻³ | 5.0 × 10⁻⁸ | — |
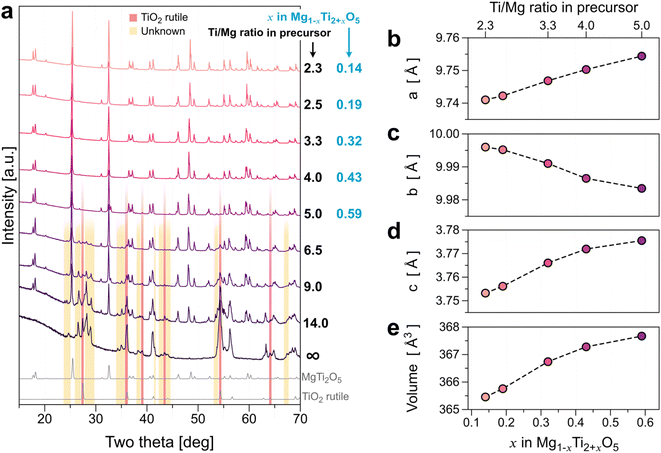
To improve the conductivity of MTO, we increased the Ti component to further reduce the oxidation state of Ti. Fig. 3 presents the series of XRD results of MTO synthesized from varied TiO2 precursor, Ti/Mg ≥ 2.3. No noticeable impurity peak was observed for the MTOs ranging from 2.3 ≤ Ti/Mg ≤ 4.0. This implies that the Ti solubility limit in the reductive environment (H2/Ar mixed gas) is much higher than that of the other gas environments (Ti/Mg = 1.8 for both cases of Ar gas and ambient air). For a greater Ti content in the precursor mixture than Ti/Mg = 4.0, the TiO2 rutile phase (indicated by the red box in Fig. 3) appears as an impurity. For the higher TiO2 precursor mixing composition with Ti/Mg ≥ 6.5, unknown additional peaks appeared at 25°–30°, 34°–35°, etc. (indicated by the yellow box in Fig. 3) while the peak intensity of MTO decreases, indicating phase transformation or decomposition. Therefore, we will only discuss the effect of the Ti content of the MTOs for Ti/Mg ratios ranging from 2.3 to 5.0 in the precursor. Fig. 3b–d illustrate the lattice parameters and unit cell volume of the MTOs synthesized in this study with no impurity peaks (i.e., ≦5.0 of Ti/Mg ratios in precursor). Lattice parameters a and c increase as Ti content increases in the precursor, whereas b decreases. The overall volume of the unit-cell (Fig. 3e) increases monotonically as Ti content increases, indicating solid-solution of Mg1−xTi2+xO5. The unit-cell volume increase could be explained by the reduction of the Ti's oxidation state as the Ti content increases. We also performed SEM-EDS quantitative analysis (Table 2) to better understand the composition of the samples. Note that the characteristic X-ray signal from the EDS measurement is generated at ∼500 nm depth from the sample surface. Given the particle size of the MTO samples are ∼6.2 μm as shown in Fig. S11,† the EDS results will show the composition information of the surface rather than the bulk.
| Ti/Mg ratio in precursor | Ti/Mg = 2.3 | Ti/Mg = 3.3 | Ti/Mg = 4.0 | Ti/Mg = 5.0 | ||||
|---|---|---|---|---|---|---|---|---|
| Mg | Ti | Mg | Ti | Mg | Ti | Mg | Ti | |
| XRD | 0.86 | 2.14 | 0.68 | 2.32 | 0.57 | 2.43 | 0.41 | 2.59 |
| SEM-EDS | 0.72 | 2.28 | 0.43 | 2.57 | 0.42 | 2.58 | 0.37 | 2.63 |
To evaluate the electrical conductivity dependence on the increased Ti content (x in Mg1−xTi2+xO5), we also need to consider the relative density of the samples. Fig. 4a shows the relation among the three parameters (Ti content, relative density, and electrical conductivity) in a single plot. The x values were determined from the Rietveld refinement of the XRD results, and they have a positive relationship with the Ti/Mg ratio in the precursor mixture. The graph shows that as the density of the sample increases, the conductivity increases on a logarithmic scale. It also clearly shows that if the MTO samples have the same (or at least similar) density, the conductivity increases as the Ti content increases (i.e., x in Mg1−xTi2+xO5). The highest conductivity we obtained as 6.09 × 10⁻¹ S cm−1, measured for the Mg0.57Ti2.43O5 (x = 0.43, Fig. S8d†) pellet with a density of 85.5% (indicated by the arrow in Fig. 4a). The activation energy of its electrical conduction, calculated from the Arrhenius eqn (1), is 0.139 eV (Fig. 4b).
 | (1) |
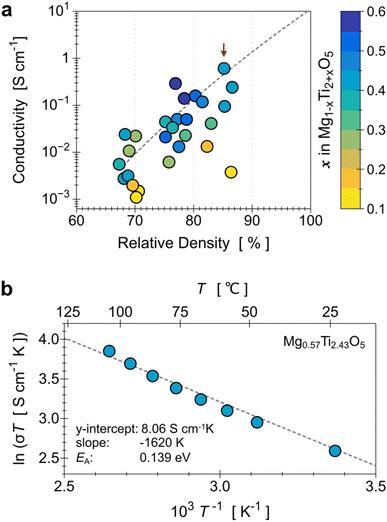 | ||
| Fig. 4 (a) Relation between the electrical conductivity, relative density of the MTO pellet, and relative Ti content (x in Mg1−xTi2+xO5). Note that the dotted line is the fit of the MTOs with a similar valence state of Ti (+3.65 ± 5%), which is the condition that resulted in the best conductivity in the present study (6.09 × 10⁻¹ S cm at Mg0.57Ti2.43O5, indicated by the red arrow). (b) Temperature dependence of the conductivity of Mg0.57Ti2.43O5, plotted as ln(σT) vs. T−1. The dotted line is the best-fit line with eqn (1). | ||
This is much higher than the known experimental conductivities of binary metal oxides, existing ESI (see Table S1).† By using a higher Ti/Mg ratio precursor mixture (Ti/Mg = 5.0), we could increase the x value up to 0.59; however, the TiO2 rutile phase of at least 5% or more formed as an impurity.
Origin of high electrical conductivity of MTO with high Ti content
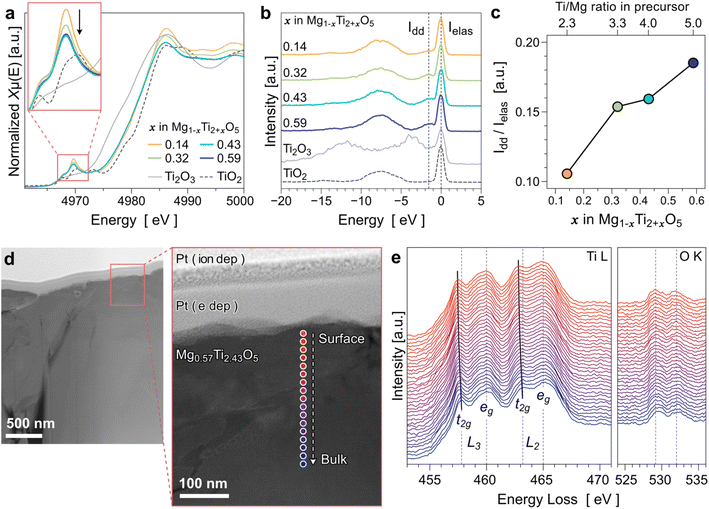
We used various chemical analysis techniques to evaluate how the Ti content determines the electronic structure of MTOs. First, X-ray absorption near-edge structure (XANES) analysis was performed to obtain Ti K-edge spectra. The XANES spectra of four MTO compounds, as well as Ti2O3 and TiO2 standards, are presented in Fig. 5a. The Ti edges of all the MTO compounds are located between Ti2O3 and TiO2, indicating that the valence states of Ti in those MTOs are between +3 and +4. The intensity of the Ti pre-edge in the inset of Fig. 5a decreases, indicating the reduction of the valence state of Ti as the Ti content increases in MTOs. Note that the pre-edge and edge position not only depend on the valence but also on the coordination environment. Therefore, the quantitative analysis for the valence states of Ti in MTOs using XANES may not be reliable.RIXS was also employed to evaluate the oxidation-state changes of Ti in MTOs because the technique is very sensitive to the 3d electron configurations.37 In particular, Ti4+ is a d0 system so RIXS features from excitations of d electrons from occupied to unoccupied state, so-called d–d excitations, is completely missing in contrast with other Ti3+/2+ states,38 as shown by the reference spectra in Fig. 5b. The occurrence of the weak peak close to the elastic line in the MTO samples corresponds to such dd-excitation (indicated by the dotted line under Idd), indicating reduced Ti states.39 The relative peak areas of Idd/Ielas plotted in Fig. 5c increased with increasing Ti content in the MTO. This demonstrates that the oxidation state of Ti in the MTO decreases as the Ti/Mg ratio increases.
Although the Ti reduction trend according to the Ti content is consistent with our initial expectation, the RIXS analysis integrates all signals of the near surface region with a probe depth of about 100 nm. To better understand whether the valence state of Ti is identical throughout the particle from the surface to the inner part, we conducted a comparative study along the depth of the material (i.e., depth profile analysis). This can be evaluated through the Ti 2p3 peak shifts depending on the Ar sputtering cycle via XPS. However, for transition-metal oxides such as MTO, there is a limitation that an accurate chemical evaluation is impossible. This is because the Ar sputter removes oxygen from the surface faster than the other elements of the transition-metal oxide; thus, oxygen vacancies can be artificially formed.40,41 We also confirmed this issue in the preliminary XPS study (see Fig. S12†). Hence, we conducted an electron energy-loss spectroscopy (EELS) line profile analysis using transmission electron microscopy (TEM) at the surface region of the Mg0.57Ti2.43O5 sample (x = 0.43 in Mg1−xTi2+xO5). Fig. 5d presents a STEM-HAADF image recorded at the surface of the sample. Because the sample was prepared via FIB, the Pt layers from the ion-beam and e-beam deposition are clearly observed at the surface. Fig. 5e presents a series of Ti L2,3 near-edge structures of the EELS line profile analysis results. The splitting of the Ti L2,3 edge spectra observed in Fig. 5e indicates that the octahedral crystal field lifts the degeneracy of the Ti 3d states into t2g and eg components.42 The t2g components of the Ti L2,3 edge shift slightly toward the lower energy loss as it is close to the surface, suggesting that the MTO surface has a lower Ti valence than the interior. Therefore, we speculate that the electron conduction is promoted more near the surface of MTOs. We expect that the gradual shift of the Ti valence state near the surface is attributable to the composition change (Ti/Mg ratio). This is also agreed with the fact that the EDS quantitative analysis shows slightly higher Ti concentrations in the MTO samples than the XRD-refined composition results as shown in Table 2. This is because the characteristic X-ray signal from the EDS measurement is generated at ∼500 nm depth from the sample surface.
Corrosion resistance
To evaluate the corrosion resistance of the optimized MTO (i.e., Mg0.57Ti2.43O5), we first measured the structural changes of MTOs before and after exposing the MTO pellets to 0.01 M HCl (pH = 2.0) solution (see Fig. S13†). There was no noticeable structural change in the MTO sample after exposure to the acid solution. In addition, we did not observe any color change in the solution when the MTO sample was stored in the acid solution (inset figure of Fig. S13†), demonstrating that MTO does not react with the acid solution. We also conducted static corrosion current measurements on the MTOs in acidic environments (Fig. 6). We used graphite and 316 stainless steel (SS316) as references because they are typical acid-resistant materials. For Mg0.68Ti2.32O5 (i.e., x = 0.32), its static corrosion current density is 1.2 × 10⁻⁴ mA cm−2, which indicates that the corrosion stability of the optimized MTO is ∼350 times higher than that of SS316 and ∼250 times higher than that of graphite carbon. In addition, we found that the corrosion resistance of Mg0.68Ti2.32O5 (x = 0.32) is better than that of other compositions such as Mg0.57Ti2.43O5 (x = 0.43) and Mg0.41Ti2.59O5 (x = 0.59). It is speculated that this optimal stability composition emerges from the trade-off between the enthalpic penalty of Ti substitution and the entropic gain of added disorder, as described in detail in ESI Note 3† and the subsequent discussion section.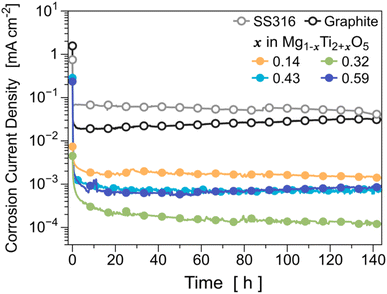 | ||
| Fig. 6 Development of the corrosion rate for MTOs with various compositions during 6 days of exposure in H2SO4 solution, pH = 1. | ||
Discussion
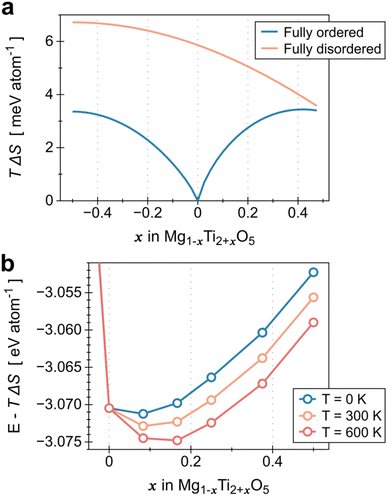
We have demonstrated that the electrical conductivity of MTO can be improved by controlling the relative contents of Mg and Ti in the MTO structure. As the Ti content increases, we can achieve higher electrical conductivity of MTO within the solubility limit (x = 0.43 in Mg1−xTi2+xO5), as shown in Fig. 3a. However, the optimal corrosion resistance is achieved at a specific Mg/Ti composition (x = 0.32), as shown in Fig. 6. To better understand the tunable stability of MTO upon Ti substitution, we analyzed the substitution energy by performing a convex-hull analysis in the MTO phase space.43,44 Although typically, Mg occupies the M1 site and Ti occupies the M2 site, high-temperature processing can stabilize the disordered structures, where some Mg (Ti) moves to M2 (M1);36 this disorder corresponds to the mixing entropy, plotted in Fig. 7a. The Rietveld refinement parameters derived from our experimental results (Table S2 in ESI†) indicate that our materials are highly ordered, with almost all the M2 sites occupied by Ti, leading to the free energies of formation plotted in Fig. 7b. We therefore discovered that excess Ti can stabilize MTO despite the enthalpic penalty, indicating that there is some optimal Ti substitution that could stabilize the MTO. We include further details on the entropy and interfacial reactivity in Fig. S13 and S14.†
One might expect that the black color of the MTO powder and corresponding high electrical conductivity originate from the residual carbon in the sample because MgCO3 was used as a precursor. However, it is less likely that carbon survives under the high-temperature synthesis condition (∼1500 °C). In addition, we confirmed that the black color of the synthesized MTO originates from the reduction of Ti (see Fig. S16†) instead of residual carbon. If the black color originates from carbon, it could not be recovered after a sequential re-sintering under (1) ambient air and (2) H2 (2%)/Ar (98%) gas flow. This is because the residual carbon will be irreversibly removed after the reaction with O2 in the ambient air to form CO2 from the former re-sintering process. However, as observed in Fig. S16,† the black color is recovered after the sequential (1) and (2) re-sintering process. Upon further considering the Rietveld refinement results, we observed that the Ti content of MTO decreased after the first re-sintering under ambient air, indicating decomposition of Ti-rich MTO into Mg-rich MTO and TiO2. After the second re-sintering under H2 (2%)/Ar (98%) gas flow, Ti-rich MTO is recovered.
In addition to the key idea used in the present study (i.e., controlling the Ti/Mg ratio in MTO), we further suggest possible alternative routes to increase the electrical conductivity of MTO. According to our DFT calculations on various MTO models, the same phenomenon with the Ti-excess MTO system (here, Mg0.73Ti2.27O5) may also occur by further tuning the chemical composition by either creating an oxygen vacancy (MgTi2O4.92) or doping Al3+ in MgTi2O5 (Al0.08Mg0.92Ti2O5). The DOS calculation results indicate that the Fermi level (EF) is occupied in all those systems (see Fig. S6d–f†), therefore, we expect that oxygen vacancy and Al3+ doping reduce the Ti oxidation state; thus, they will exhibit increased conductivity.
Although we demonstrate that Ti-rich MTO synthesized under a controlled synthesis condition at high temperature exhibits high electrical conductivity and corrosion resistance, it is challenging to use this MTO material in a practical PEMFC in its current state. This is because the catalyst supporter requires a high surface area to hold large amounts of Pt catalyst. Because Ti-rich MTO can only be synthesized at high temperature in our solid-state synthesis method, we need to reduce the particle size by post-ball milling. Unfortunately, we found that the particle color becomes brighter with increasing ball-milling time, indicating a decrease in the conductivity. Therefore, a low T synthesis method such as the sol–gel method or hydro/solvothermal methods may be required to synthesize Ti-rich MTOs to be used and tested as a catalyst support for PEMFCs.
Conclusion
We presented a strategy to overcome the trade-off between good electrical conductivity and electrochemical stability of ternary oxide materials. A conductive and corrosion-resistive MTO phase (Mg0.68Ti2.32O5) was successfully synthesized under controlled synthesis environments with a reducing reaction environment (H2/Ar mixed gas flow) and high temperature (∼1500 °C). The origin of the high conductivity of MTO was investigated and is attributed to the oxidation state of Ti reaching +3.65 (reduction toward +3 from +4) for the MTO. In addition, we found that a reducing gas environment ensured higher Ti solubility and lower Ti oxidation states, thus promoting the electrical conductivity.Author contributions
Y.-W. B.: formal analysis; investigation; methodology; visualization; writing – original draft; writing – review & editing. J. M., M. K., G.-H. L., Z. C.: formal analysis; investigation; writing – original draft. Y. S.: formal analysis; investigation. W. Y.: formal analysis; supervision; writing – review & editing. C. J., J. C.: supervision; project administration. S. K.: conceptualization; software; supervision; project administration; visualization; writing – original draft. L. C.: conceptualization; methodology; supervision; validation; writing – original draft; writing – review & editing. H. K.: conceptualization; formal analysis; funding acquisition; methodology; supervision; writing – original draft; writing – review & editing.Conflicts of interest
L. C., S. K., M. K., J. C., and J. M. are inventors on several U.S. patent applications assigned to Robert Bosch GmbH related to this work. The other authors declare that they have no competing interests.Acknowledgements
The authors acknowledge Dr Maria Virginia Altoe of the Molecular Foundry (MF), LBNL, for her technical assistance and meaningful discussions. Work at the Molecular Foundry was supported by the Office of Science, Office of Basic Energy Sciences, of the U.S. Department of Energy under contract no. DE-AC02-05CH11231. This research used resources of the Advanced Photon Source, an Office of Science User Facility operated for the US DOE Office of Science by Argonne National Laboratory and is supported by the US DOE under contract no. DE-AC02-06CH11357. Soft X-ray experiments were performed at beamline BL8.0.1 of the Advanced Light Source (ALS), a DOE Office of Science User Facility, under contract no. DE-AC02-05CH11231. G.-H. L. acknowledges the financial support of the ALS fellowship program.References
- P. K. Mohanta, F. Regnet and L. Jörissen, Energy Technol., 2020, 8, 2000081 CrossRef CAS.
- J. Kibsgaard and I. Chorkendorff, Nat. Energy, 2019, 4, 430–433 CrossRef.
- Y.-W. Byeon and H. Kim, Electrochem, 2021, 2, 452–471 CrossRef CAS.
- O. Z. Sharaf and M. F. Orhan, Renew. Sust. Energ. Rev., 2014, 32, 810–853 CrossRef CAS.
- S. J. Peighambardoust, S. Rowshanzamir and M. Amjadi, Int. J. Hydrogen Energy, 2010, 35, 9349–9384 CrossRef CAS.
- B. Millington, S. Du and B. G. Pollet, J. Power Sources, 2011, 196, 9013–9017 CrossRef CAS.
- A. Chandan, M. Hattenberger, A. El-kharouf, S. Du, A. Dhir, V. Self, B. G. Pollet, A. Ingram and W. Bujalski, J. Power Sources, 2013, 231, 264–278 CrossRef CAS.
- S. Siracusano, A. Stassi, E. Modica, V. Baglio and A. S. Aricò, Int. J. Hydrogen Energy, 2013, 38, 11600–11608 CrossRef CAS.
- S. Kumar, S. N. Bhange, R. Soni and S. Kurungot, ACS Appl. Energy Mater., 2020, 3, 1908–1921 CrossRef CAS.
- Z. Zhang, J. Liu, J. Gu, L. Su and L. Cheng, Energy Environ. Sci., 2014, 7, 2535–2558 RSC.
- K. Nakata and A. Fujishima, J. Photochem. Photobiol., C, 2012, 13, 169–189 CrossRef CAS.
- S.-Y. Huang, P. Ganesan and B. N. Popov, Appl. Catal., B, 2011, 102, 71–77 CrossRef CAS.
- E. Antolini and E. R. Gonzalez, Solid State Ionics, 2009, 180, 746–763 CrossRef CAS.
- K.-J. Noh, I. Nam and J. W. Han, Appl. Surf. Sci., 2020, 521, 146330 CrossRef CAS.
- V. C. Anitha, R. Zazpe, M. Krbal, J. Yoo, H. Sopha, J. Prikryl, G. Cha, S. Slang, P. Schmuki and J. M. Macak, J. Catal., 2018, 365, 86–93 CrossRef CAS.
- J. Yoo, R. Zazpe, G. Cha, J. Prikryl, I. Hwang, J. M. Macak and P. Schmuki, Electrochem. Commun., 2018, 86, 6–11 CrossRef CAS.
- J. M. Kim, Y. J. Lee, S.-h. Kim, K.-H. Chae, K. R. Yoon, K. A. Lee, A. Byeon, Y. S. Kang, H.-Y. Park, M. K. Cho, H. C. Ham and J. Y. Kim, Nano Energy, 2019, 65, 104008 CrossRef CAS.
- Z. Wang, Y.-R. Zheng, I. Chorkendorff and J. K. Nørskov, ACS Energy Lett., 2020, 5, 2905–2908 CrossRef CAS.
- E. K. Weise and I. A. Lesk, J. Chem. Phys., 1953, 21, 801–806 CrossRef CAS.
- F. Matteucci, G. Cruciani, M. Dondi, G. Gasparotto and D. M. Tobaldi, J. Solid State Chem., 2007, 180, 3196–3210 CrossRef CAS.
- G. Kresse and J. Hafner, Phys. Rev. B: Condens. Matter Mater. Phys., 1993, 47, 558–561 CrossRef CAS PubMed.
- G. Kresse and J. Furthmüller, Comput. Mater. Sci., 1996, 6, 15–50 CrossRef CAS.
- G. Kresse and J. Furthmüller, Phys. Rev. B: Condens. Matter Mater. Phys., 1996, 54, 11169–11186 CrossRef CAS PubMed.
- G. Kresse and D. Joubert, Phys. Rev. B: Condens. Matter Mater. Phys., 1999, 59, 1758–1775 CrossRef CAS.
- J. P. Perdew, K. Burke and M. Ernzerhof, Phys. Rev. Lett., 1996, 77, 3865–3868 CrossRef CAS PubMed.
- L. Giordano, T. M. Østergaard, S. Muy, Y. Yu, N. Charles, S. Kim, Y. Zhang, F. Maglia, R. Jung, I. Lund, J. Rossmeisl and Y. Shao-Horn, Chem. Mater., 2019, 31, 5464–5474 CrossRef CAS.
- N. Doebelin and R. Kleeberg, J. Appl. Crystallogr., 2015, 48, 1573–1580 CrossRef CAS PubMed.
- B. Ravel and M. Newville, J. Synchrotron Rad., 2005, 12, 537–541 CrossRef CAS PubMed.
- M. A. Ehsan, R. Naeem, V. McKee, A. S. Hakeem and M. Mazhar, Sol. Energy Mater. Sol. Cells, 2017, 161, 328–337 CrossRef CAS.
- N. Zhang, K. Zhang, W. Zhou, B. Jiang, K. Pan, Y. Qu and G. Wang, RSC Adv., 2015, 5, 106151–106155 RSC.
- J. P. Perdew, Int. J. Quantum Chem., 1985, 28, 497–523 CrossRef.
- K. Ariyoshi, T. Ino and Y. Yamada, J. Power Sources, 2019, 430, 150–156 CrossRef CAS.
- A. F. Arif, R. Balgis, T. Ogi, F. Iskandar, A. Kinoshita, K. Nakamura and K. Okuyama, Sci. Rep., 2017, 7, 3646 CrossRef PubMed.
- B. Xu, H. Y. Sohn, Y. Mohassab and Y. Lan, RSC Adv., 2016, 6, 79706–79722 RSC.
- H. Yang and R. M. Hazen, J. Solid State Chem., 1998, 138, 238–244 CrossRef CAS.
- Y. Suzuki and Y. Shinoda, Sci. Technol. Adv. Mater., 2011, 12, 034301 CrossRef PubMed.
- W. Yang and T. P. Devereaux, J. Power Sources, 2018, 389, 188–197 CrossRef CAS.
- A. Augustsson, A. Henningsson, S. M. Butorin, H. Siegbahn, J. Nordgren and J. H. Guo, J. Chem. Phys., 2003, 119, 3983–3987 CrossRef CAS.
- M. Matsubara, T. Uozumi, A. Kotani, Y. Harada and S. Shin, J. Phys. Soc. Jpn., 2002, 71, 347–356 CrossRef CAS.
- G. Greczynski and L. Hultman, Appl. Surf. Sci., 2021, 542, 148599 CrossRef CAS.
- R. Steinberger, J. Walter, T. Greunz, J. Duchoslav, M. Arndt, S. Molodtsov, D. C. Meyer and D. Stifter, Corros. Sci., 2015, 99, 66–75 CrossRef CAS.
- Q. Qiao, Y. Zhang, R. Contreras-Guerrero, R. Droopad, S. T. Pantelides, S. J. Pennycook, S. Ogut and R. F. Klie, Appl. Phys. Lett., 2015, 107, 201604 CrossRef.
- S. P. Ong, L. Wang, B. Kang and G. Ceder, Chem. Mater., 2008, 20, 1798–1807 CrossRef CAS.
- S. P. Ong, A. Jain, G. Hautier, B. Kang and G. Ceder, Electrochem. Commun., 2010, 12, 427–430 CrossRef CAS.
Footnote |
| † Electronic supplementary information (ESI) available. See DOI: https://doi.org/10.1039/d2ta04084k |
| This journal is © The Royal Society of Chemistry 2022 |

