
Water-resistant organic–inorganic hybrid perovskite quantum dots activated by the electron-deficient d-orbital of platinum atoms for nitrogen fixation†
Yixuan
Gao‡
a,
Xiao
Su‡
a,
Juanjuan
Wei‡
a,
Jianghui
Sun
a,
Min
Zhang
a,
Hongwei
Tan
 *a,
Jiangwei
Zhang
*b,
Jin
Ouyang
a and
Na
Na
*a
*a,
Jiangwei
Zhang
*b,
Jin
Ouyang
a and
Na
Na
*a
aKey Laboratory of Radiopharmaceuticals, Ministry of Education, College of Chemistry, Beijing Normal University, Beijing 100875, China. E-mail: nana@bnu.edu.cn; hongwei.tan@bnu.edu.cn
bDalian National Laboratory for Clean Energy & State, Key Laboratory of Catalysis, Dalian Institute of Chemical Physics, Chinese Academy of Sciences (CAS), China. E-mail: zjw11@tsinghua.org.cn
First published on 30th June 2022
Abstract
Due to their special physicochemical properties, organic–inorganic hybrid perovskite quantum dots (OIP QDs) are ideal and potential catalysts for the nitrogen reduction reaction (NRR). However, the OIP QD-based NRR is limited by poor water resistance, competitive suppression by the hydrogen evolution reaction, and inefficient active sites on the catalyst surfaces. Herein, to ensure an efficient NRR in aqueous solution, a water-resistant polycarbonate-part-encapsulated heterojunction of Zn,PtIV co-doped PbO-MAPbBr3 (PtIV/Zn/PbO/PC-Zn/MAPbBr3) is prepared through one-step electrospray-based microdroplet synthesis. Confirmed by both experimental and theoretical examinations, PbO is exposed on the PC-part-encapsulated surface to construct a Type I heterojunction. This heterojunction is further improved by synergistic co-doping with PtIV to facilitate efficient electron transfer for efficient photocatalysis of the NRR. Due to the active sites of the d-orbital electron-deficient Pt atoms (exhibiting a lower reaction energy barrier and highly selective N2 adsorption), the ammonia yield rate is 40 times higher than that without doping. This work initiates and develops on the application of OIP QDs in the NRR.
1. Introduction
Organic–inorganic hybrid perovskite materials have received great attention due to their special physicochemical properties.1–7 Due to their high extinction coefficients,8 wide absorption ranges,9 high carrier mobilities10–12 and tunable bandgaps,13 organic–inorganic hybrid perovskites quantum dots (OIP QDs) are ideal and potential photocatalytic reduction agents.14,15 However, the inherent poor water resistance becomes a major hindrance for OIP QD applications.9,16 Taking methylammonium lead bromide (MAPbBr3, MA: CH3NH3) OIP QDs as an example, MA is structurally located in the interstitial center of the networks of corner-sharing PbBr6 octahedra.17–20 However, water can weaken the interaction between MA and the PbBr6 octahedra via hydrogen bonding with the crystal lattice of MAPbBr3.9,17,21,22 Consequently, the present photocatalytic reduction of OIP QDs is mainly focused on photocatalytic H2 evolution and CO2 reduction in nonaqueous media.9,23–29 The application of MAPbBr3 in nitrogen fixation by the nitrogen reduction reaction (NRR) in water is yet to be developed.To improve the water resistance of OIP QDs, encapsulations using hydrophobic polymer matrices, AlOx-passivated films or SiO2 coating core–shell structures have been reported.30 However, these encapsulations are not feasible for NRR due to the insulating shells restricting charge transport, which is crucial for photocatalytic reductions.31,32 The microdroplet reaction has been newly developed for fast synthesis and nanoparticle preparation, which is achieved by spraying charged droplets for accelerated reactions. In particular, water-resistant encapsulations of OIP QDs by polymers can be obtained.33 However, polymer encapsulation results in transport restriction, which restricts the wider application of OIP QDs.34–36 Consequently, the NRR performance catalyzed by OIP QDs is still limited due to the following reasons. (1) The competing hydrogen evolution reaction (HER) seriously limits the production selectivity and yield rate of NH3 in the NRR.37–39 This is due to the high favorability of electron transfer for the HER as well as the preferential adsorption of H atoms over N2 molecules.40 (2) The intrinsic catalytic activity of the active metal centers on the catalyst surface is inefficient.41,42 This arises from the weak affinity of N2 to the catalysts, which lack electron deficient sites to accept the lone pair electrons of N2.43 Therefore, further surface engineering of OIP QD structures is expected to overcome the traditionally favored H adsorption and improve the intrinsic photocatalytic activity towards the NRR.44–46
An emerging strategy to kinetically boost the NRR performance is by creating electron deficient catalytic sites via electronic structure modifications on active metal centers.47–49 For instance, the transition metal Pt has exhibited an effective way to improve the activity and selectivity toward HER.50–52 However, the NRR of Pt element was normally suppressed by HER competition, which excessively adsorbed H atoms to occupy the active sites instead of N2 activation.37,53 This is normally generated from the strong Pt–H interaction (unfulfilled 5d orbitals of Pt with the s orbital of H) because the metal d-band states are close to the Fermi level (Ef).54–56 In fact, the adsorption on the catalysts can be tailored by tuning the d orbitals of the transition metals.57 Therefore, the selectivity of NRR would be improved by rationally controlling the microstructure and electronic properties of photocatalysts.41,58 Consequently, for selective NRR, the ideal catalysts of OIP QDs should be further designed with (1) a lower d-band state to weaken H adsorption and (2) abundant electron deficient sites with strong N2 affinity.54,59–61
Herein, a water-resistant OIP QDs was rapidly prepared by the one-step ESI-based microdroplet synthesis in microseconds, termed as polycarbonate (PC)-part-encapsulated Zn,PtIV-codoped PbO-MAPbBr3 heterojunction (PtIV/Zn/PbO/PC-Zn/MAPbBr3). During the fast ESI, the core of Zn/MAPbBr3 was crystallized, followed by PC encapsulation to obtain good water-resistance without environmental pollution. In this rapid process, Zn/PbO was exposed on the surface through the substitution of Zn by the internal Pb of MAPbBr3, which resulted in a heterojunction. Significantly, this heterojunction was further improved by co-doping with PtIV, which obtained Zn,PtIV-co-doped PbO-MAPbBr3. Therefore, the PtIV/Zn co-doped PbO acted as a shell on PtIV/Zn/PbO/PC-Zn/MAPbBr3, forming an improved heterojunction with a straddling gap (Type I) for NRR. Compared to lower valent PtII-doped materials (PtII/Zn/PbO), the PtIV/Zn/PbO species created electron-deficient sites with strong affinity toward N2 and suppressed H adsorption. Consequently, the metal atom was positively charged with high-valence states, which improved electron delocalization of PtIV d-orbitals for electron transfer to N2. Simultaneously, the electron deficient sites of PtIV lowered d-band center to inhibit H adsorption, while it enhanced the affinity toward N2 to suppress HER. The preferential N2 adsorption over H atom at electron deficient sites was further confirmed by the density functional theory (DFT) calculations. The PtIV/Zn/PbO/PC-Zn/MAPbBr3 exhibited a higher ammonia production rate than the single Zn-doped one, which was 40 times higher than that without doping.
2. Experimental
2.1 Synthesis of PC-part-encapsulated Zn,PtIV-codoped PbO-MAPbBr3 heterojunction
Polycarbonate resin (PC, M.W. 45![[thin space (1/6-em)]](https://www.rsc.org/images/entities/char_2009.gif) 000, Acros), methylamine hydrobromide (CH3NH3Br, MABr, 98%, Innochem), lead(II) bromide (PbBr2, Puratronic, 99.9%, Macklin), N,N-dimethylformamide (DMF, 99.9%, extra dry, Innochem), H2PtCl6 (99.9%, Macklin), K2PtCl4 (99.9%, Macklin), and C4H8O4Zn (Macklin, AR). Ultrapure water (Mill-Q, Millipore, 18.2 MΩ) was used in all experiments. All chemicals were used without further purification.
000, Acros), methylamine hydrobromide (CH3NH3Br, MABr, 98%, Innochem), lead(II) bromide (PbBr2, Puratronic, 99.9%, Macklin), N,N-dimethylformamide (DMF, 99.9%, extra dry, Innochem), H2PtCl6 (99.9%, Macklin), K2PtCl4 (99.9%, Macklin), and C4H8O4Zn (Macklin, AR). Ultrapure water (Mill-Q, Millipore, 18.2 MΩ) was used in all experiments. All chemicals were used without further purification.
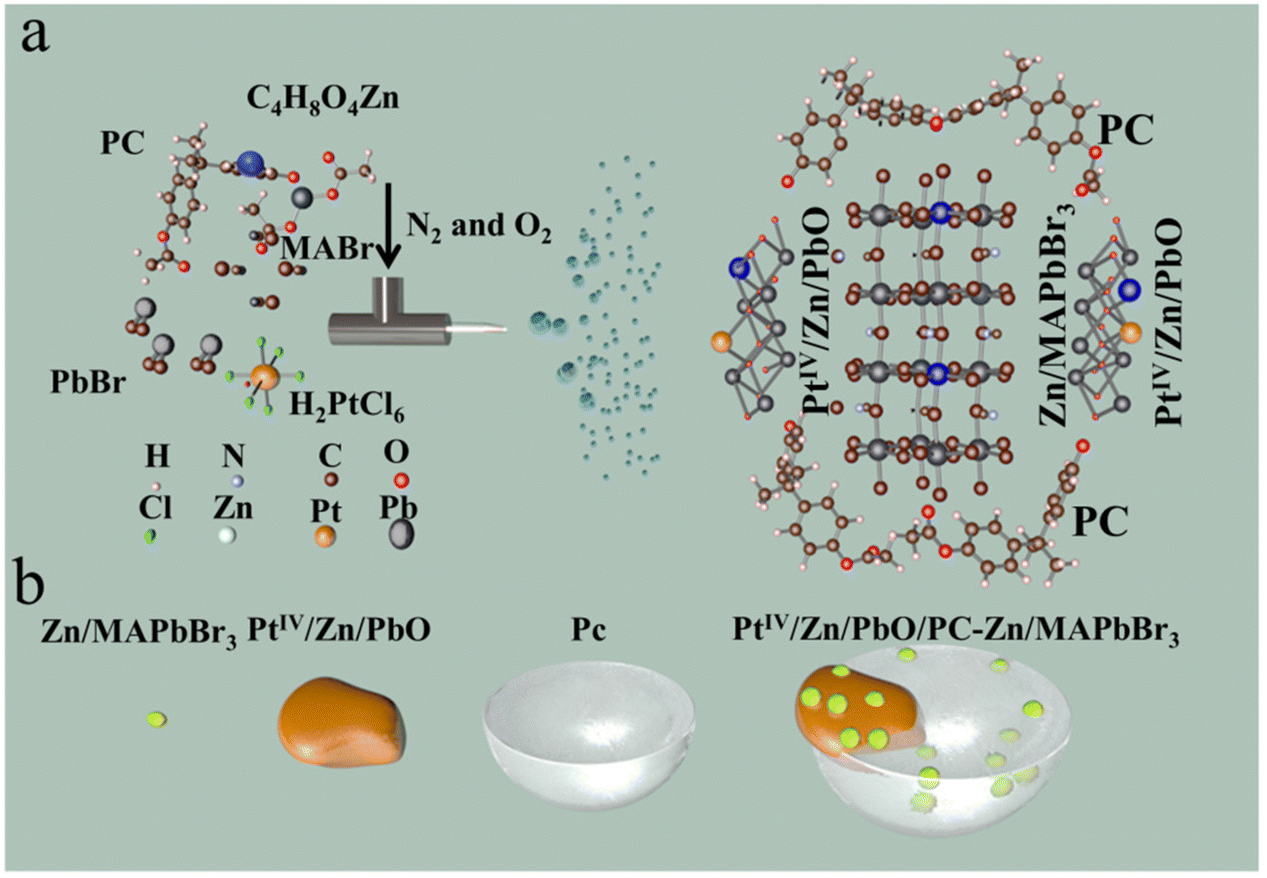
The synthesis of polycarbonate-part-encapsulated Zn,PtIV co-doped PbO-MAPbBr3 (PtIV/Zn/PbO/PC-Zn/MAPbBr3) was accomplished by one-step electrospray (ESI) microdroplet synthesis. As shown in Scheme 1a, the DMF solution containing PC, CH3NH3Br (MABr), C4H8O4Zn, H2PtCl6, and PbBr2 was fed into a centrifuge tube, whose flow rate was controlled by the fluxion mixture of N2 and O2 (160 L min−1). The electrospray voltage of the DC voltage was +20 kV (Scheme 1a). Therefore, the sprayed electropositive droplets containing PtIV/Zn/PbO/PC-Zn/MAPbBr3 products were collected on a conical flask receptor attached to a negative electrode. Finally, the yellow dry PtIV/Zn/PbO/PC-Zn/MAPbBr3 nanocatalyst on the receptor was then dispersed in ultrapure water. Subsequently, the mixture was centrifuged under 7000 rpm for 10 min to collect the precipitate. After that, the obtained yellow dry PtIV/Zn/PbO/PC-Zn/MAPbBr3 products were dispersed in ethanol.
 | ||
| Scheme 1 The preparation of the PtIV/Zn/PbO/PC-Zn/MAPbBr3 heterojunction materials. (a) A schematic illustration of the ESI-based microdroplet synthesis. (b) A schematic image of the structure. | ||
2.2 Characterization
High voltage was supplied by a DC high-voltage power supply (China, HB-Z303-1AC). Transmission electron microscopy (TEM) imaging was performed on an FEI Talos 200 s TEM with an operating voltage of 200 kV. X-ray diffraction measurement was performed with a Maxima XRD-7000 (Shimadzu, Japan). The Fourier transform infrared (FT-IR) spectra of the samples were recorded on a PerkinElmer TGA 7 infrared spectrometer to identify the functional groups on the surface of all the samples. Raman spectra were recorded at room temperature using a Raman spectrometer (Renishaw RM-1000) in a back-scattering geometry with a 532 nm laser as the excitation source. The XPS spectra were recorded using a PHI-5300 ESCA spectrometer (PerkinElmer) equipped with an Al Kα excitation source. Photoluminescence spectroscopy measurements were employed by an FLS980 fluorescence spectrophotometer. The photocurrent and electrochemical impedance spectra were acquired with an electrochemical workstation (CHI 660e). The work functions in the PtIV/Zn/PbO and Zn/MAPbBr3 were investigated using ultraviolet photoemission spectroscopy (UPS, AXIS-Nova).2.3 X-ray absorption fine structure spectra measurements
The X-ray absorption fine structure spectra (XAFS) of the Pb, Zn, and Pt K-edge was collected at the 1 W1B beamline of Beijing Synchrotron Radiation Facility (BSRF). The EXAFS spectra were obtained by subtracting the post-edge background from the overall absorption and then normalized with respect to the edge-jump step. Subsequently, the χ(k) data was Fourier transformed to real (R) space to separate the EXAFS contributions from different coordination shells. To obtain the quantitative structural parameters around the central atoms, least-squares curve parameter fitting was performed using the Artemis module. The following EXAFS equation was used for the calculation of the theoretical scattering amplitudes, phase shifts, and the photoelectron mean free paths.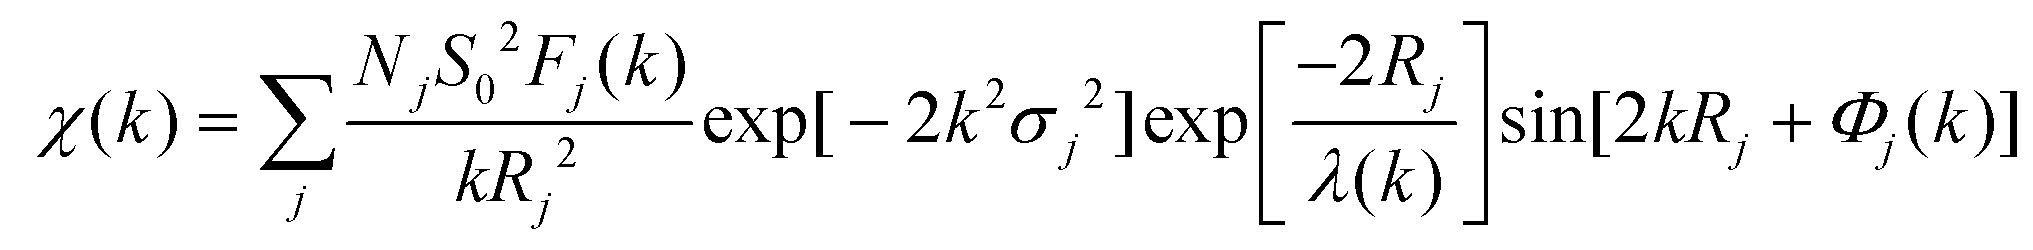 | (1) |
2.4 Photocatalytic N2 reduction reaction measurements
The photocatalytic N2 reduction reaction (NRR) performances of the photocatalysts were evaluated in a photocatalytic reactor with a quartz glass window. During the photocatalytic NRR experiment, 30 mg catalyst was dispersed in 120 mL ultrapure water. The reaction was carried out in a cell equipped with water circulation using a 300 W Xe lamp as the light source. The light source was positioned at a distance of 10 cm to the quartz reactor, whose intensity was 300 mW cm−2, as measured using a visible-light radiometer. The mixture was continuously stirred in the dark and purified N2 (purity ≥99.9%). Then, the light source was used to conduct photocatalytic NRR. During light irradiation, an aliquot (4 mL) of the dispersion was taken out of the photocatalytic reactor at set intervals (0 h, 1 h, 2 h, 3 h, 4 h, and 5 h) for NH4+ analysis. The concentration of NH4+ produced was quantified through the colorimetric method using Nessler's reagent (detected by absorbance at 420 nm) on a UV 2600 UV-vis spectrometer (Shimadzu, Japan). In a typical procedure, the aliquot was separated by centrifugation at 10000 rpm for 15 min and transferred into a 3 mL colorimeter tube. Then, 100 μL of the potassium sodium tartrate solution was added to the sample tube. After adequate blending, 100 μL of Nessler's reagent was added to the sample tube and mixed for 10 min for ageing. Then, the UV absorption was measured by a UV 2600 spectrometer. The photocatalytic NRR sample was analyzed three times during all the measurements.
2.5 1H NMR spectra analysis
The isotope labelling experiments were carried out with 20 mg Zn/PbO/PC-Zn/MAPbBr3 photocatalyst under 15N2 atmosphere. Then, 40.0 mL of the suspension was taken out from the photocatalytic reactor and separated by centrifugation at 10000 rpm. The diluted 0.05 M HCl was concentrated to 4.0 mL by the reduced pressure distillation method to remove the solvent. D2O/electrolyte mixed solution with a VD2O to Velectrolyte ratio of 1:2 for 1H NMR measurements was employed by the superconducting Fourier transform nuclear magnetic resonance spectrometer (Bruker Avance-400). The result is illustrated in Fig. 4c.
2.6 First-principles calculations
All spin-polarized DFT calculations were performed by the Vienna Ab Initio Simulation Package (VASP, version 5.4.4) with dispersion correction (DFT + D3). The interaction among the core electrons and valence electrons was implemented through the projected augmented-wave (PAW) method, and the energy cutoff was set to 450 eV for the plane-wave basis sets. The Perdew–Burke–Ernzerhof (PBE) functional within the generalized gradient approximation (GGA) was employed to describe the electronic exchange correlation interaction. It was well known that standard DFT was not good at dealing with strongly correlated systems containing d electrons, which would lead to an error. An intra-site Coulomb repulsion U-term was introduced to solve this problem, i.e., the Hubbard U model, Ueff = 7.5 eV, was applied for Pt 5d electrons throughout the study.To evaluate the computational capabilities and the impurity concentration obtained from the experiments, a model containing 192 atoms was established (95 Pb atoms, 1 Zn atom, and 96 O atoms for the Zn doped model; 94 Pb atoms, 1 Zn atom, 1 Pt atom, and 96 O atoms for Zn/Pt co-doped model). Except for 64 atoms in the bottom layer, all atoms of the slab models were allowed to relax in the process of structural optimization. The vacuum layer of all the slab models was set to 15 Å to avoid the interaction between the atoms in adjacent units perpendicular to the surface. A gamma-centered 1 × 1 × 1 k-point grid was set in the Brillouin zone, while the k-point grid was set to 3 × 3 × 1 for DOS calculation. The adsorption energies (Ead) of N2 or H atom were calculated using the following equations.
| Ead = Etotal − Esurface − EN2/H | (2) |
The free energies of the species were calculated as:
| ΔG = ΔE + ΔZPE − TΔS | (3) |
2.7 The ESI-based microdroplet synthesis
In the typical ESI-based microdroplet synthesis, physical and chemical processes were involved sequentially or simultaneously. For the cone-jet mode, the size of the droplets is usually determined by the following equation.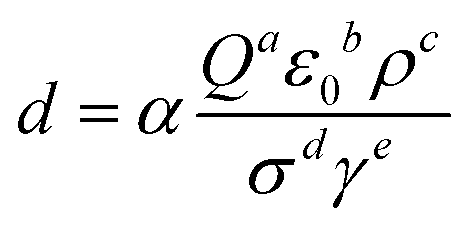 | (4) |
The normalized time-resolved PL decay plots can be mathematically expressed by a bi-exponential equation.
| Fit = A + B1exp(−t/τ1) + B2exp(−t/τ2) | (5) |
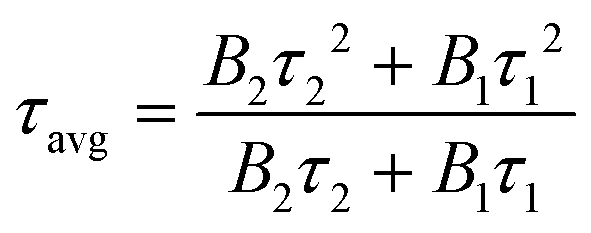 | (6) |
τ avg reflects the overall emission decay behavior of PbO/PC-MAPbBr3, Zn/PbO/PC-Zn/MAPbBr3, and PtIV/Zn/PbO/PC-Zn/MAPbBr3.
3. Results and discussion
3.1 Preparation of PC-part-encapsulated Zn,PtIV-co-doped PbO-MAPbBr3 heterojunction
The PC-part-encapsulated Zn,Pt-codoped PbO-MAPbBr3 heterojunction of PtIV/Zn/PbO/PC-Zn/MAPbBr3 was prepared by a one-step ESI-based microdroplet synthesis in microseconds.32 In brief, a DMF solution containing MABr, PC, PbBr2, H2PtCl6, and C4H8O4Zn were fed into ESI flow. As illustrated (Scheme 1), under supersonic N2 flow (160 L min−1) and a DC voltage (+20 kV), ESI was employed to generate reactors of charged microdroplets. With rapid solvent evaporation in the accelerated gas (N2 and O2), the reactants were highly reactive to accelerate both PtIV/Zn/MAPbBr3 crystallization and PC encapsulation. In this rapid synthesis, surface Zn was active for the substitution of internal Pb to obtain Zn/PbO/PC-Zn/MAPbBr3 heterojunction. Simultaneously, the heterojunction was further co-doped by PtIV, which formed the Type I heterojunction (PtIV/Zn/PbO/PC-Zn/MAPbBr3) to enhance the NRR.3.2 Morphology characterizations
Morphology characterizations were employed to evaluate the synthesis of the PtIV/Zn/PbO/PC-Zn/MAPbBr3 heterojunction. Three nanomaterials, including PbO/PC-MAPbBr3 without any surface doping, single Zn-doped Zn/PbO/PC-Zn/MAPbBr3, and the present PtIV/Zn co-doped one were prepared for the comparison. As demonstrated by transmission electron microscopy (TEM) images in Fig. 1a–c, three nanomaterials were well dispersed. The particle diameters varied from 20–25 nm for non-doped PbO/PC-MAPbBr3 to 60–80 nm for single Zn-doped Zn/PbO/PC-Zn/MAPbBr3, and to 40–45 nm for PtIV/Zn/PbO/PC-Zn/MAPbBr3. This could be generated from their difference in the liquid conductivity of ESI.62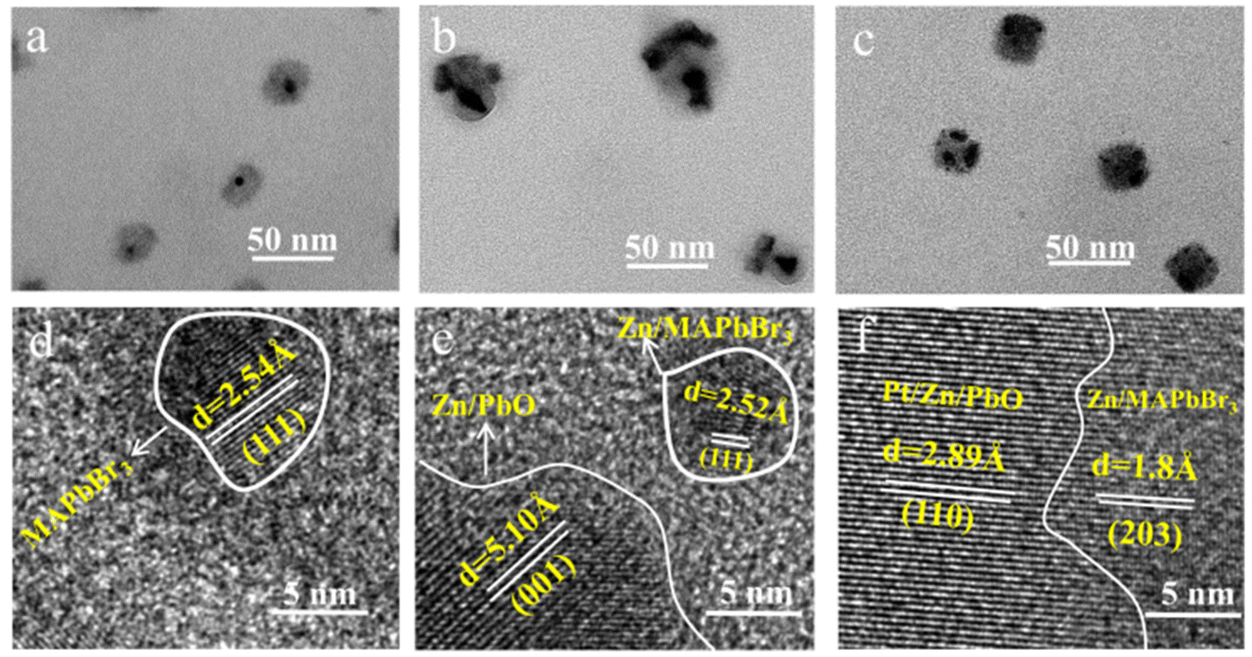 | ||
| Fig. 1 Morphological characterization. TEM images of (a) PbO/PC-MAPbBr3, (b) Zn/PbO/PC-Zn/MAPbBr3 and (c) PtIV/Zn/PbO/PC-Zn/MAPbBr3. HRTEM images of (d) PbO/PC-MAPbBr3, (e) Zn/PbO/PC-Zn/MAPbBr3 and (f) PtIV/Zn/PbO/PC-Zn/MAPbBr3. | ||
In more detail, successfully obtaining the PC-part-encapsulated Zn,Pt-codoped PbO-MAPbBr3 heterojunction was confirmed by multiple characterizations. As demonstrated by high-resolution transmission electron microscopy (HRTEM), only significant (111) planes of MAPbBr3 with a spacing of 2.5 Å were recorded (Fig. 1d) for PbO/PC-MAPbBr3, while the (001) plane of Zn/PbO (5 Å spacing) and (110) plane of Pt/Zn/PbO (2.9 Å spacing) were recorded for single Zn-doped and PtIV/Zn-codoped ones, respectively (Fig. 1e and f). Compared to the non-doped materials (Fig. 1a), more PbO were exposed on two doped surfaces (Fig. 1b and c, Fig. S1†). This PC-part-encapsulated structures, by doping with Zn or PtIV/Zn, were further confirmed by high-angle annular dark field-scanning transmission electron microscopy (HAADF-STEM) (Fig. S2 and S3†). This exposure of PbO or doped-PbO was essential for heterojunction construction, which promoted charge transfer to boost the photocatalytic NRR. Moreover, as confirmed by EDX line scanning from HAADF-STEM (Fig. S4 and S5†), ∼10 nm of internal Zn/MAPbBr3 OIP QDs connected with the surface Zn/PbO or PtIV/Zn/PbO to form the heterojunction. Therefore, OIP QDs cores were partly encapsulated by PC, whose surfaces were confirmed to be doped with the exposed species of Zn/PbO or PtIV/Zn/PbO.
3.3 Chemical characterization
The crystal and chemical properties of the three OIP QDs were further examined. As demonstrated in the X-ray diffraction (XRD), the characteristic peaks of cubic MAPbBr3 and PbO were recorded in the XRD patterns of the three materials (labelled in Fig. 2a). Compared with the non-doped one, the XRD peaks of PbO slightly shifted toward a higher angle when doped with Zn (red line, Fig. 2b), while a shift toward a lower angle was recorded after co-doping with PtIV/Zn (blue line, Fig. 2b). These shifts indirectly confirmed the successful doping with Zn or PtIV/Zn due to the changing PbO interplanar spacing.63 Furthermore, the successful encapsulation of OIP QDs by PC was demonstrated by Fourier Transform infrared (FTIR) (Fig. 2c) and Raman spectroscopy (Fig. 2d). The assignments of FTIR and Raman peaks for PC are summarized in Tables S1 and S2,† respectively.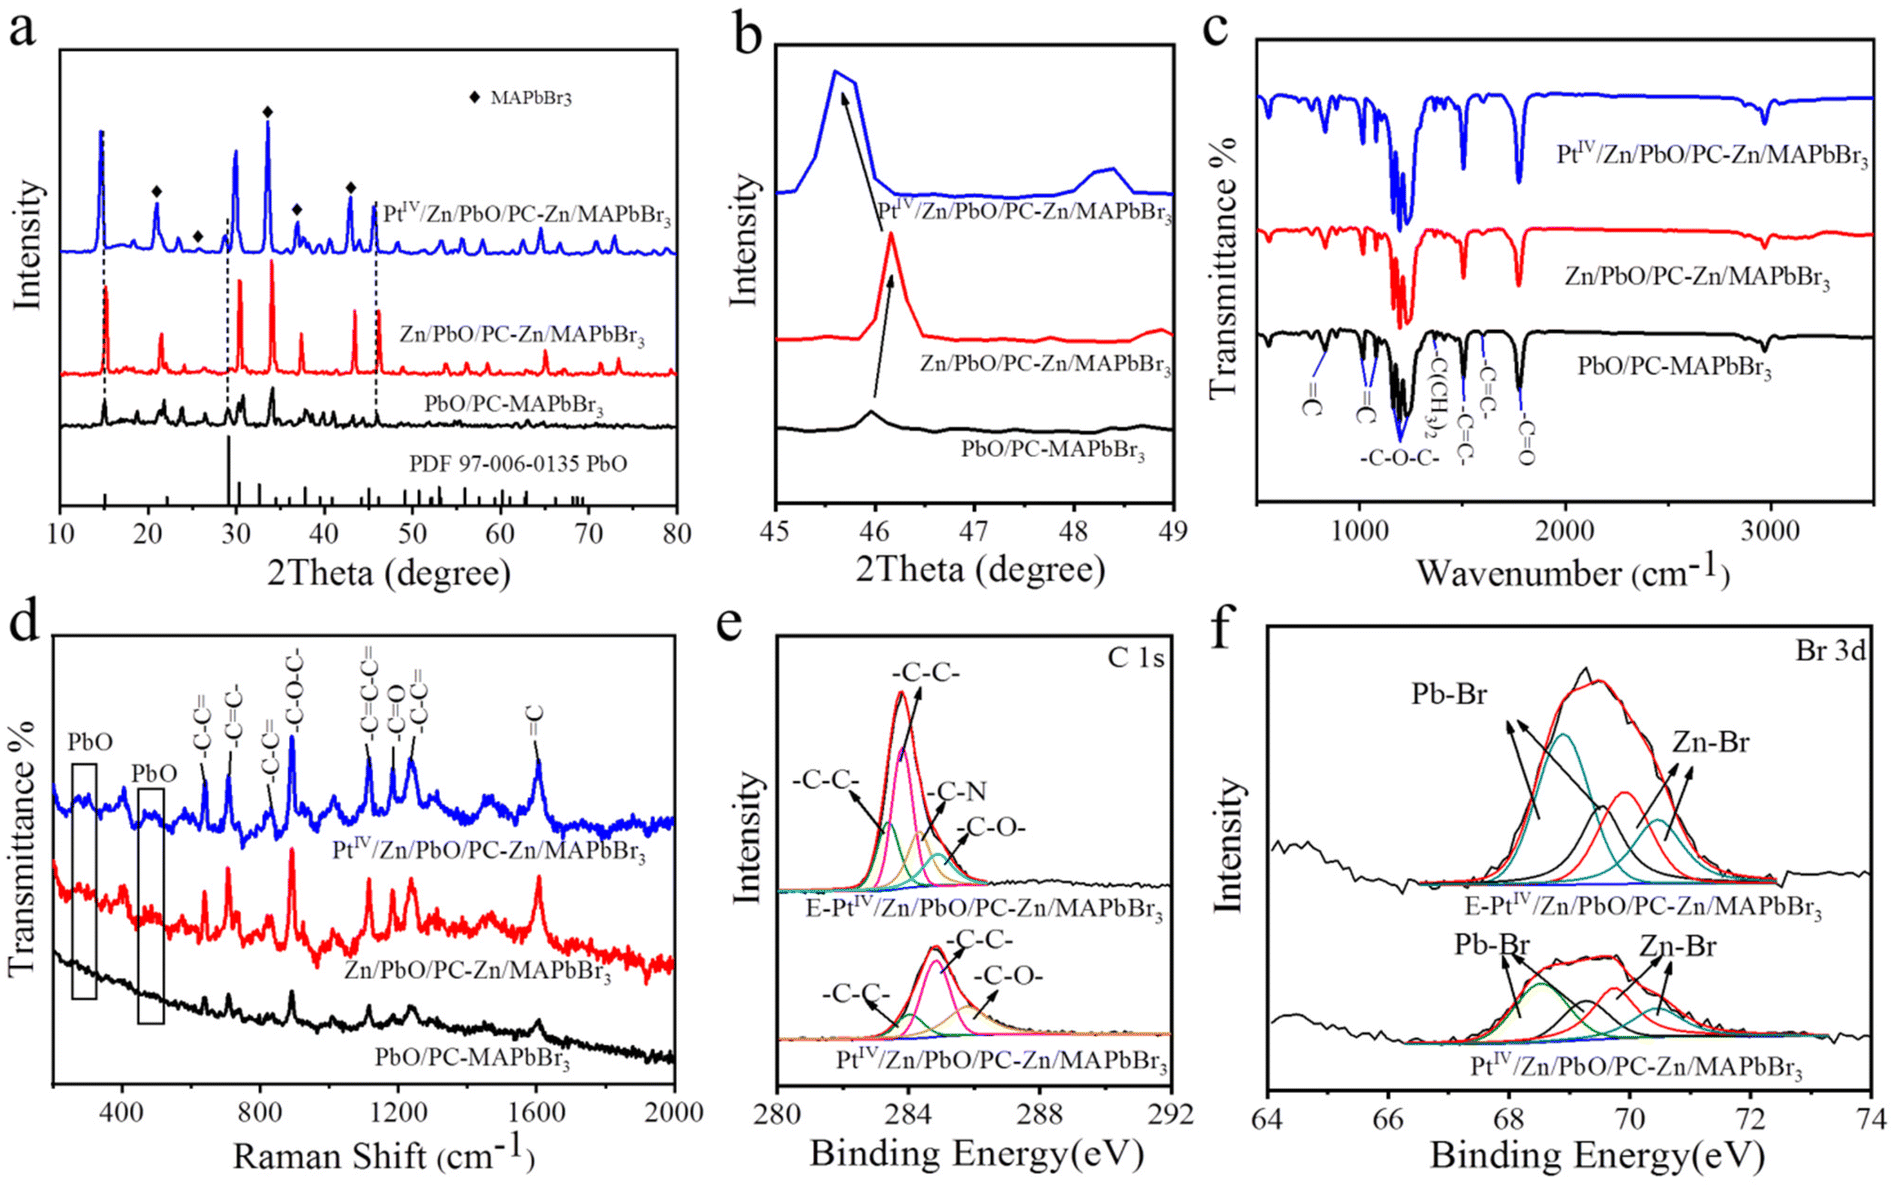 | ||
| Fig. 2 Chemical characterization of PbO/PC-MAPbBr3, Zn/PbO/PC-Zn/MAPbBr3 and PtIV/Zn/PbO/PC-Zn/MAPbBr3. (a) XRD patterns. Dotted lines are the sectional PbO characteristic patterns. (c) FTIR spectra. (d) Raman spectra. XPS spectra of C 1s (e) and Br 3d (f) for PtIV/Zn/PbO/PC-Zn/MAPbBr3 with and without etching. | ||
Besides, the PC encapsulation of OIP QDs in three materials was also confirmed by the X-ray photoelectron spectra (XPS) of C 1s (Fig. 2e, Fig. S6c†). The –C–N characteristic peaks were recorded after etching, which belonged to the main component of MA in the Zn/MAPbBr3 core. The corresponding PC peaks were also observed (summarized in Table S3†). Furthermore, the higher Pb–Br signals were interiorly exhibited in PtIV/Zn/PbO/PC-Zn/MAPbBr3 (Fig. 2f), also generated from the core components of Zn/MAPbBr3. These observations were in accordance with the PC-encapsulated structure of Zn/MAPbBr3 OIP QDs. Besides, the Pb–O Raman peaks increased after doping corresponding to the link region of Pb–O in the ending mode (Fig. 2d). This demonstrated that the content of exposed PbO on the surface increased after doping. Therefore, the OIP QDs were confirmed to be part-encapsulated by PC with PbO exposed on the surface, which was beneficial for guaranteeing the NRR in aqueous solutions.
Moreover, the doping details were examined by the comparison of XPS signals on the surface and inside PtIV/Zn/PbO/PC-Zn/MAPbBr3. To characterize the inside components, the materials were etched by Ar ion. Without etching, the significant peaks of Pb–O (on Pb 4f spectra, Fig. 3a), Zn–O (on Zn 2p spectra, Fig. 3b), and Pt–O (on PtIV 4f spectra, Fig. 3c) were observed on the surface of PtIV/Zn/PbO/PC-Zn/MAPbBr3. This was in accordance with the surface co-doping by PtIV/Zn. After etching, the interior signals of Pb–Br and Zn–Br are higher than those of Pb–O and Zn–O (Fig. 3a and b), which indicated that Zn/MAPbBr3 PQDs were the main core components. In addition, Pt was mainly distributed on the surface of PtIV/Zn/PbO/PC-Zn/MAPbBr3 because no significant interior PtIV signal was observed after etching (Fig. 3c). Except for the aforementioned species observed on the surface, the C 1s peaks of PC (Fig. 2e, Table S3†) were also recorded, demonstrating the part-encapsulation by PC. This guaranteed the good water-resistance of PtIV/Zn/PbO/PC-Zn/MAPbBr3 for NRR in aqueous conditions.
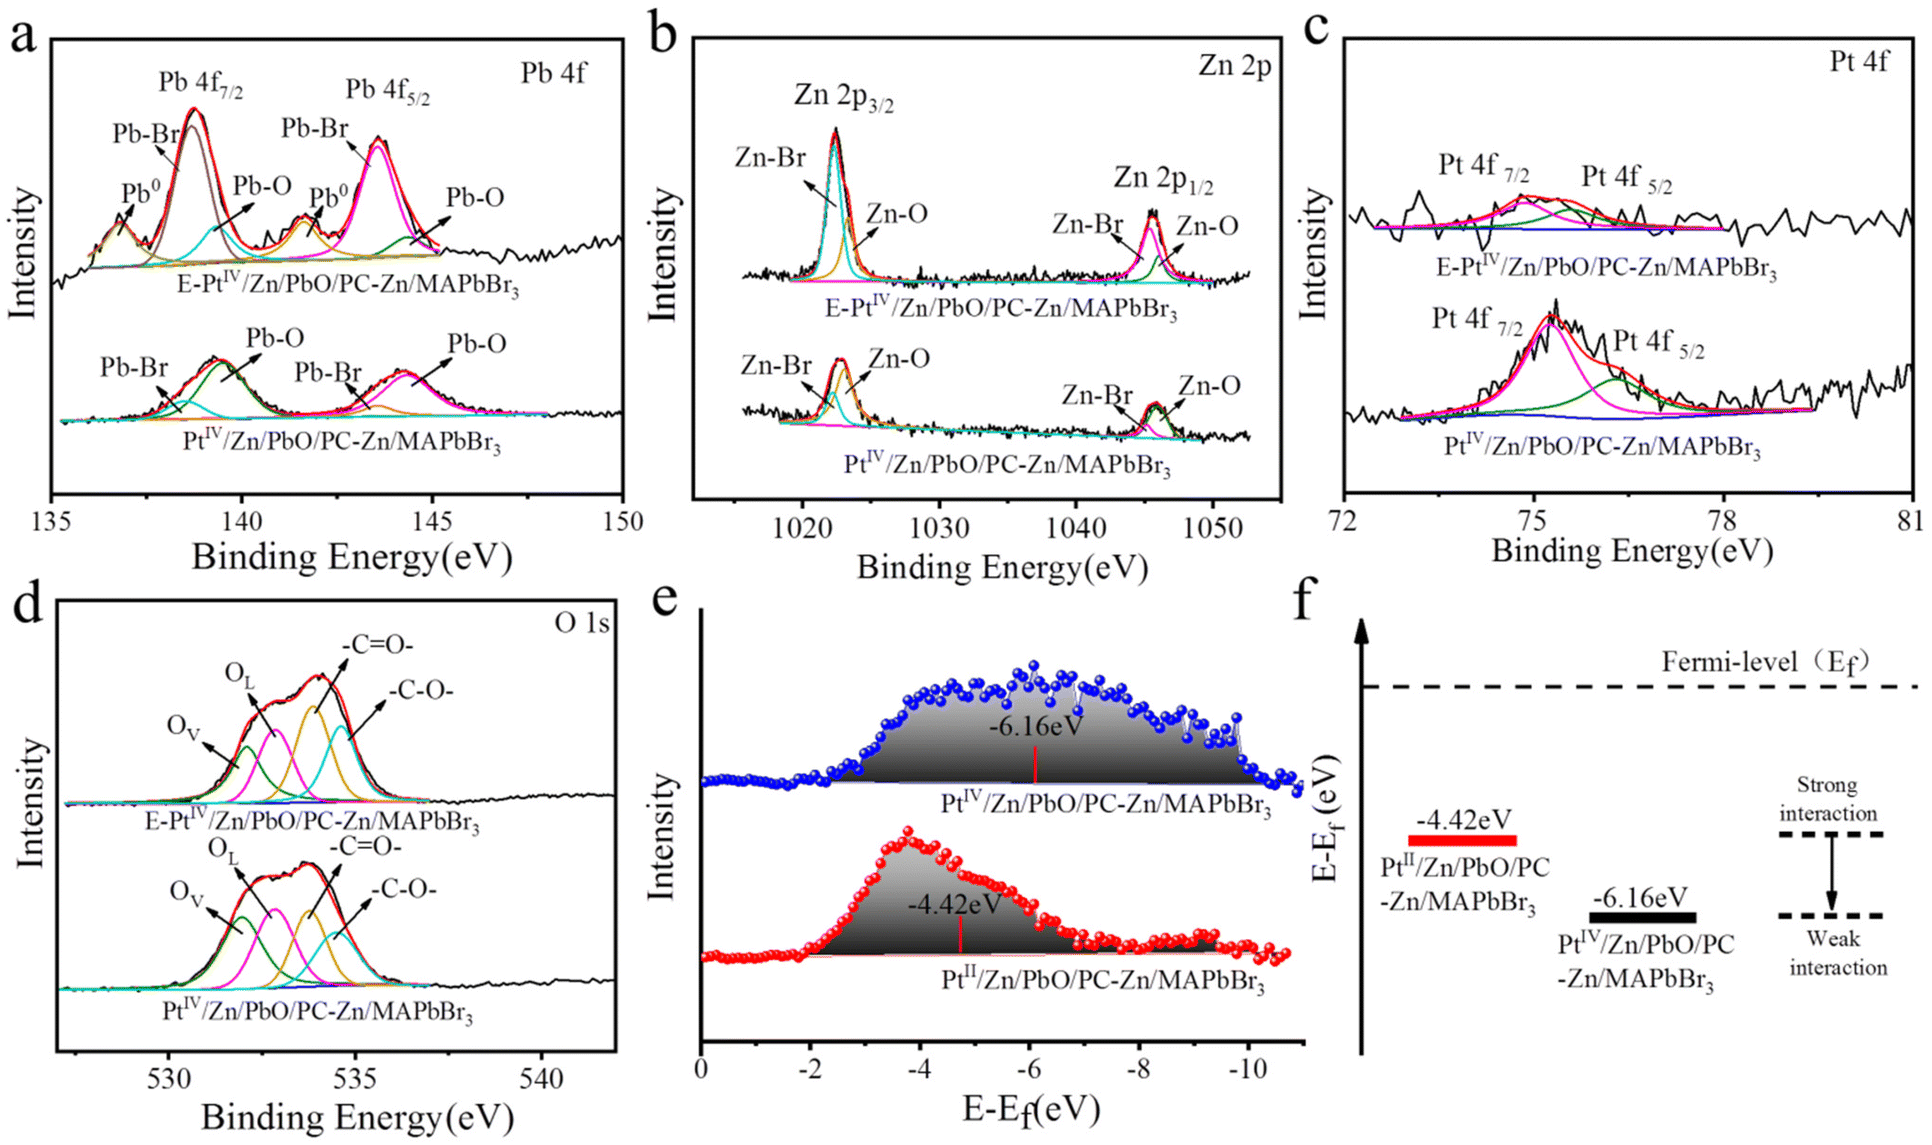 | ||
| Fig. 3 XPS spectra of Pb 4f (a), Zn 2p (b), Pt 4f (c), and O 1s (d) of non-etched and 20 nm-etched PtIV/Zn/PbO/PC-Zn/MAPbBr3. (e) The d-band center of PtII/Zn/PbO/PC-Zn/MAPbBr3 and PtIV/Zn/PbO/PC-Zn/MAPbBr3. (f) Schematic illustrating the shift of the d-band away from the Fermi level to weaken the metal–H interaction. The red and black lines represent their d-band centers. | ||
Furthermore, the doping by Zn species promoted the substitution of Pb by Zn atoms to expose PbO on the surface. This was demonstrated by the comparsion of surface PbO between PbO/PC-MAPbBr3 and Zn/PbO/PC-Zn/MAPbBr3 (Fig. S6†), which was beneficial for further PtIV/Zn co-doping to obtain the heterojunction with active sites. Moreover, the O 1s XPS spectra (Fig. 3d) indicated the presence of Pb–O lattice oxygen (OL) and oxygen vacancy (OVs) on the PtIV/Zn/PbO/PC-Zn/MAPbBr3 surface, in addition to –C![[double bond, length as m-dash]](https://www.rsc.org/images/entities/char_e001.gif) O– and –C–O– species of PC (at 533.85 eV and 538.51 eV of BE). The C 1s peaks of PC (Fig. S6c, Table S3†) also confirmed the PC encapsulation. Therefore, the co-doped PtIV/Zn/PbO was on the PC-part-encapsulated PtIV/Zn/PbO/PC-Zn/MAPbBr3, which constructed a core–shell-like heterojunction to improve photocatalytic NRR in aqueous solutions.
O– and –C–O– species of PC (at 533.85 eV and 538.51 eV of BE). The C 1s peaks of PC (Fig. S6c, Table S3†) also confirmed the PC encapsulation. Therefore, the co-doped PtIV/Zn/PbO was on the PC-part-encapsulated PtIV/Zn/PbO/PC-Zn/MAPbBr3, which constructed a core–shell-like heterojunction to improve photocatalytic NRR in aqueous solutions.
As we know, the d-band center is related to the adsorption between the catalysts and adsorbates, which can be used to predict the catalytic reactivities.54,64 Therefore, the d-band states of the PtIV for Pt–H interaction were examined to predict the competition reaction between NRR and HER. As shown in Fig. 3c, the wide XPS peaks on the Pt 4f spectra were deconvoluted into two peaks of PtIV oxide states (75.3 eV and 76.3 eV), which indicated the decreased Pt electron density on the surface. For comparison, the PtII-doped nanomaterials of PtII/Zn/PbO/PC-Zn/MAPbBr3 were prepared using K2PtCl4 as the PtII source. As shown in Fig. S7,† two wide peaks of PtII oxide states (at ∼75.5 eV and ∼72 eV) were recorded. Thereafter, the d-band states of both PtIV and PtII-doped nanomaterials were calculated based on their corresponding XPS data. As shown in Fig. 3e, the initial d-band center of PtIV/Zn/PbO/PC-Zn/MAPbBr3 (−6.16 eV) was much lower than that of PtII/Zn/PbO/PC-Zn/MAPbBr3 (−4.42 eV). This resulted in the weaker Pt–H interaction in PtIV/Zn/PbO/PC-Zn/MAPbBr3 than in PtII/Zn/PbO/PC-Zn/MAPbBr3, which exhibited a lower d-band state far away from its Fermi level (Fig. 3f). Hence, Pt d-orbitals were tuned by PtIV/Zn co-doped PbO on the surface, resulting a low d-band center far away from the Fermi level. Thus, the Pt–H interaction was weakened to suppress the HER, which resulted in increased NRR selectivity.
3.4 Evaluation on the NRR performance
The performance of photocatalytic NRR catalyzed by the PtIV/Zn/PbO/PC-Zn/MAPbBr3 nanomaterials was examined using Ar or N2 as the feed gas. Fig. 4a shows the NH3 yields versus the irradiation times (10 h) for the materials PbO/PC-MAPbBr3, Zn/PbO/PC-Zn/MAPbBr3, and PtIV/Zn/PbO/PC-Zn/MAPbBr3. Fed by N2, only significant NH3 was generated on catalysis by the doped nanomaterials of Zn/PbO/PC-Zn/MAPbBr3 and PtIV/Zn/PbO/PC-Zn/MAPbBr3. The comparison of the NH3 yields obtained by different catalysts are shown in Fig. 4b. The NH3 yield catalyzed by PtIV/Zn/PbO/PC-Zn/MAPbBr3 (116.56 μmol gcat−1 h−1) was higher than Zn/PbO/PC-Zn/MAPbBr3 (40.87 μmol gcat−1 h−1), which exhibited an approximate linear increase with time (Fig. 4a). It should be noted that the present PtIV/Zn/PbO/PC-Zn/MAPbBr3 exhibited a much higher NRR efficiency than the Pt-loaded nanoparticles (Pt-PtIV/Zn/PbO/PC-Zn/MAPbBr3) (Fig. S9†), which could be caused by the stronger interaction between the loaded catalysts and H proton. Using Ar as the feed gas, trace NH3 was also recorded by PtIV/Zn/PbO/PC-Zn/MAPbBr3, which could be generated from the trace N element on the surface. In addition, the PtII/Zn co-doped catalyst exhibited a much lower NH3 yield of 18.39 μmol gcat−1 h−1 (Fig. S8†) due to the poor suppression of NRR to HER (demonstrated in Fig. 3f). Moreover, PtIV/Zn/PbO/PC-Zn/MAPbBr3 was stable enough for the NRR reaction, even retaining about 95% of the orignial intensity in aqueous solutions at the 10th day (Fig. S10†). Therefore, the present materials were demonstrated to be water resistant and possessed good stability in aqueous solutions after the NRR reaction, which is attributed to the PC-encapsulation to protect perovskite QDs.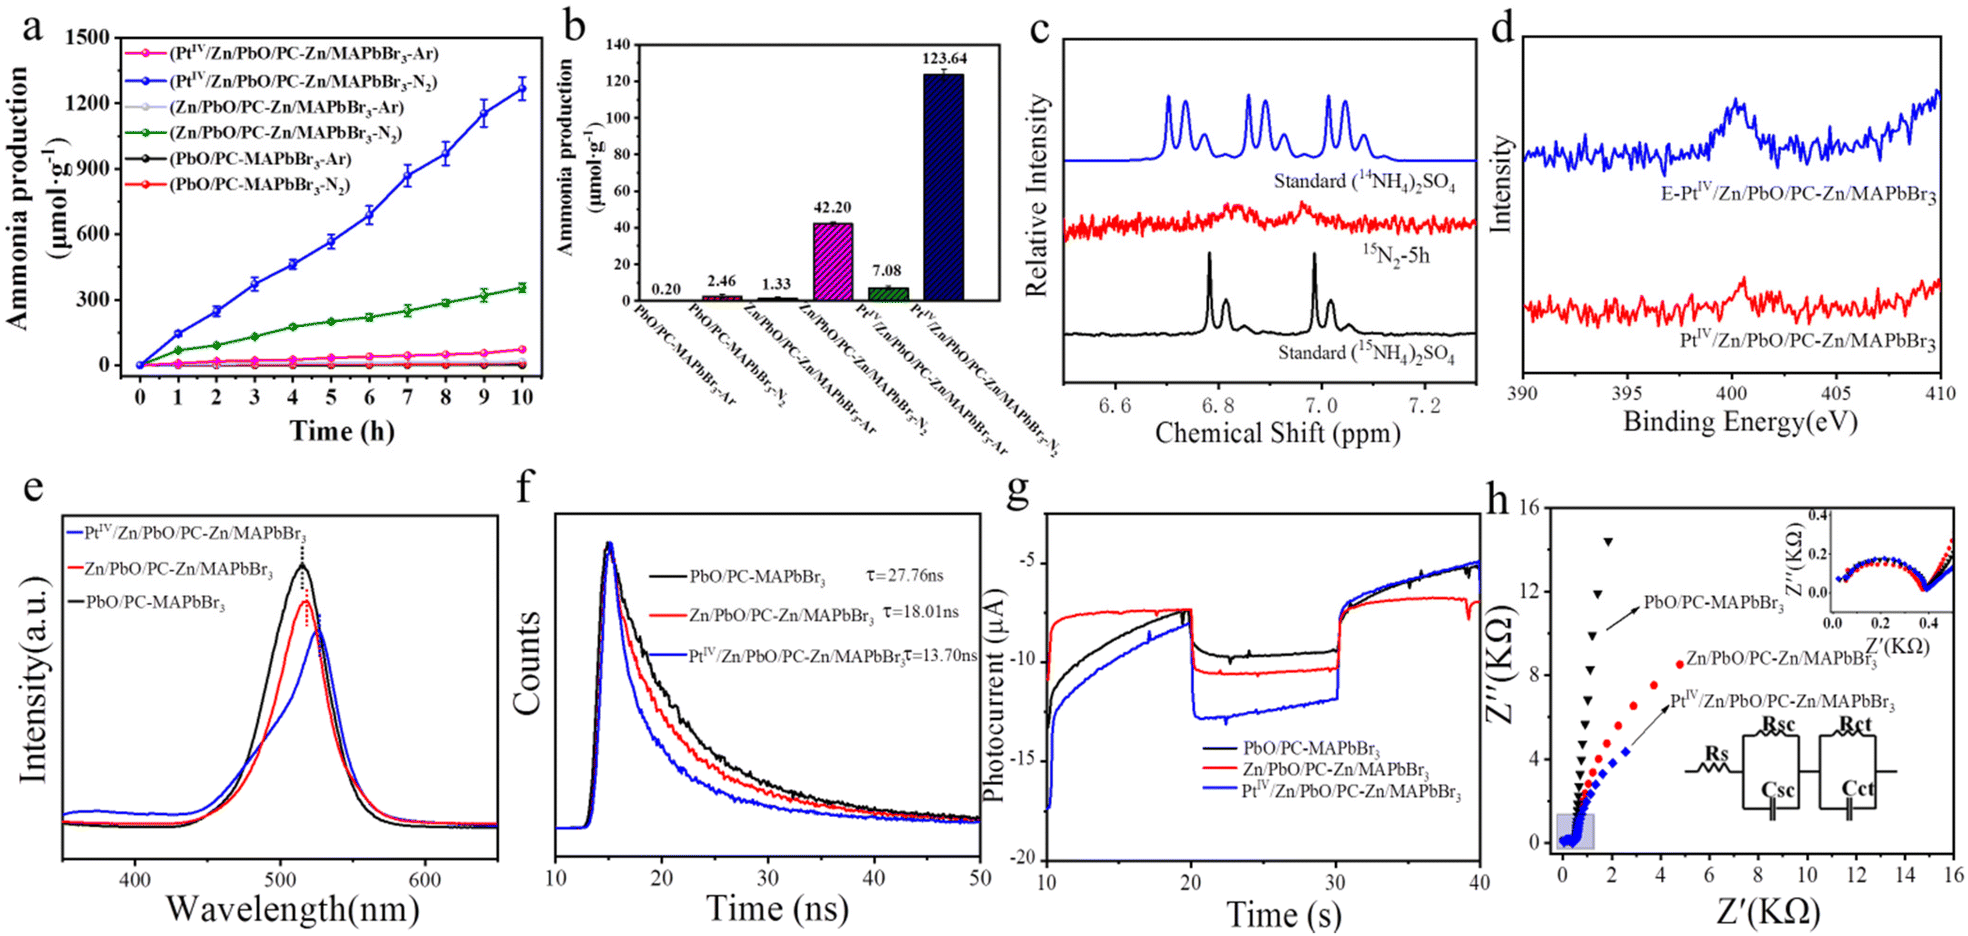 | ||
| Fig. 4 Evaluation of the photocatalytic NRR catalyzed by PbO/PC-MAPbBr3, Zn/PbO/PC-Zn/MAPbBr3 and PtIV/Zn/PbO/PC-Zn/MAPbBr3. (a) NH3 yield versus irradiation time with N2 and Ar as feed gases. (b) Average NH3 yields. (c) 1H NMR spectra of the NRR system with 15N2 (99%) as the feed gas. Standards: 14NH4SO4 and 15NH4SO4. (d) N 1s XPS spectra of PtIV/Zn/PbO/PC-Zn/MAPbBr3 and E-PtIV/Zn/PbO/PC-Zn/MAPbBr3. (e) PL spectra, (f) TRPD spectra (excited at 280 nm), and (g) transient photocurrent responses of PbO/PC-Zn/MAPbBr3, Zn/PbO/PC-Zn/MAPbBr3 and PtIV/Zn/PbO/PC-Zn/MAPbBr3. Conditions: +0.5 V vs. Ag/AgCl at pH 6.4 under chopped illumination with a fixed time interval. (h) Impedance curves for the materials before the stability test under 1.5 G illumination. Insets: Enlarged view of the blue area; equivalent circuit to fit the impedance data. RS: The series resistance (including materials resistance and contact resistance of the system). RSC: Charge transfer resistance at the electrode interface. Rct: Charge transfer resistance at the electrolyte interface. | ||
To further confirm N2 fixation via photocatalytic NRR catalyzed by PtIV/Zn/PbO/PC-Zn/MAPbBr3, an isotope-labelling experiment was employed using 15N2 (99%) as the feed gas. NRR was employed in 120 mL H2O containing 30 mg catalyst, and the production was characterized by 1H NMR measurements. As shown in Fig. 4c, two peaks of 15NH4+ (at 6.88 and 6.96 ppm) were observed after 5 h, confirming the N2 fixation via NRR. Nevertheless, the trace N (Fig. 4d) on the surface could also contribute to the generation of a small amount of NH3 at the beginning.
The comparison of the photoluminescence (PL) responses of the three materials was further employed to examine the PtIV/Zn co-doped performance. The steady-state PL spectra in Fig. 4e exhibits the relatively weak and red-shift emission with PtIV/Zn co-doped. This indicated a suppressed irradiative recombination of the photoexcited electron-holes in PtIV/Zn/PbO/PC-Zn/MAPbBr3, which resulted in the fast transfer of internal photogenerated electron-holes to the shell. Furthermore, the faster charge transfer was also confirmed by the decay traces of the time-resolved photoluminescence decay (TRPD) spectra. Excited at 280 nm, the decay traces were fitted using biexponential decay kinetics with low uncertainties (χ) (Table S4†). As shown in Fig. 4f, the PtIV/Zn/PbO/PC-Zn/MAPbBr3 composite (τaverage = 13.70 ns) decayed distinctly faster than Zn/PbO/PC-Zn/MAPbBr3 (τaverage = 18.01 ns) and PbO/PC-MAPbBr3 (τaverage = 27.76 ns). Therefore, the decreased τaverage confirmed the rapid charge transfer between the Zn/MAPbBr3 core and the PtIV/Zn/PbO shell in a facile nonradiative quenching channel.24 This could be attributed to more exposed electron-withdrawing active sites of PtIV.57
Subsequently, the photoelectrochemical (PEC) performances of the three catalysts were evaluated by photocurrent and electrochemical impedance examinations in N2 conditions. As shown in Fig. 4g, the highest transient photocurrent responses by PtIV/Zn/PbO/PC-Zn/MAPbBr3 were recorded with an interval chopped illumination. This indicated a more efficient separation of photogenerated electron–hole by the co-doped PtIV/Zn catalyst.41 This was attributed to the formation of the improved Type I heterojunction with the PtIV active sites exposed on the surface of PtIV/Zn/PbO/PC-Zn/MAPbBr3. The consistent charge-transfer properties by the heterojunction were further examined by electrochemical impedance spectroscopy tests. As a result, the RSC and RCT of PtIV/Zn/PbO/PC-Zn/MAPbBr3 were the lowest under AM 1.5 G illumination (Fig. 4h, the fitting data are list in Table S5†) and showed good stability even after the NRR stability test (Fig. S11,† the fitting data are list in Table S6†). This demonstrated that the PtIV/Zn co-doped nanomaterials facilitated the charge transfer and promoted electron delocalization at the interface between the heterojunction and the semiconductor/electrolyte. Therefore, codoped with the electron-deficient sites of PtIV, the d-band center was lowered to improve the heterojunction. This would increase the N2 adsorption on the PtIV active sites, therefore enhancing charge transfer and separation to benefit NRR.
3.5 The band structures of PtIV/Zn/PbO/PC-Zn/MAPbBr3
To understand the dynamics of light absorption as well as the charge separation and charge transfer during NRR, the band structure of PtIV/Zn/PbO/PC-Zn/MAPbBr3 was investigated. Firstly, the Tauc plots of the PtIV/Zn/PbO shell and the Zn/MAPbBr3 core were obtained based on UV-vis absorption spectroscopy. As shown in Fig. 5a, the calculated energy band gaps were 3.3 and 3.6 eV for PtIV/Zn/PbO and Zn/MAPbBr3, respectively. Deduced by the secondary-electron emission (SEE) spectra recorded by an ultraviolet photoelectron spectrophotometer (UPS), the work functions of PtIV/Zn/PbO and Zn/MAPbBr3 were plotted (Fig. 5b). The valence band X-ray photoelectron spectra (VBXPS) revealed the energy difference between the Fermi level and the valence-band maximum (EF − EV). As demonstrated in Fig. 5c, the energy differences were 2.38 and 2.48 eV for PtIV/Zn/PbO and Zn/MAPbBr3, respectively. The schematic energy band diagrams of PtIV/Zn/PbO and Zn/MAPbBr3 are shown in Fig. 5d, indicating an efficient Type (I) heterojunction with PtIV/Zn co-doped on the surface.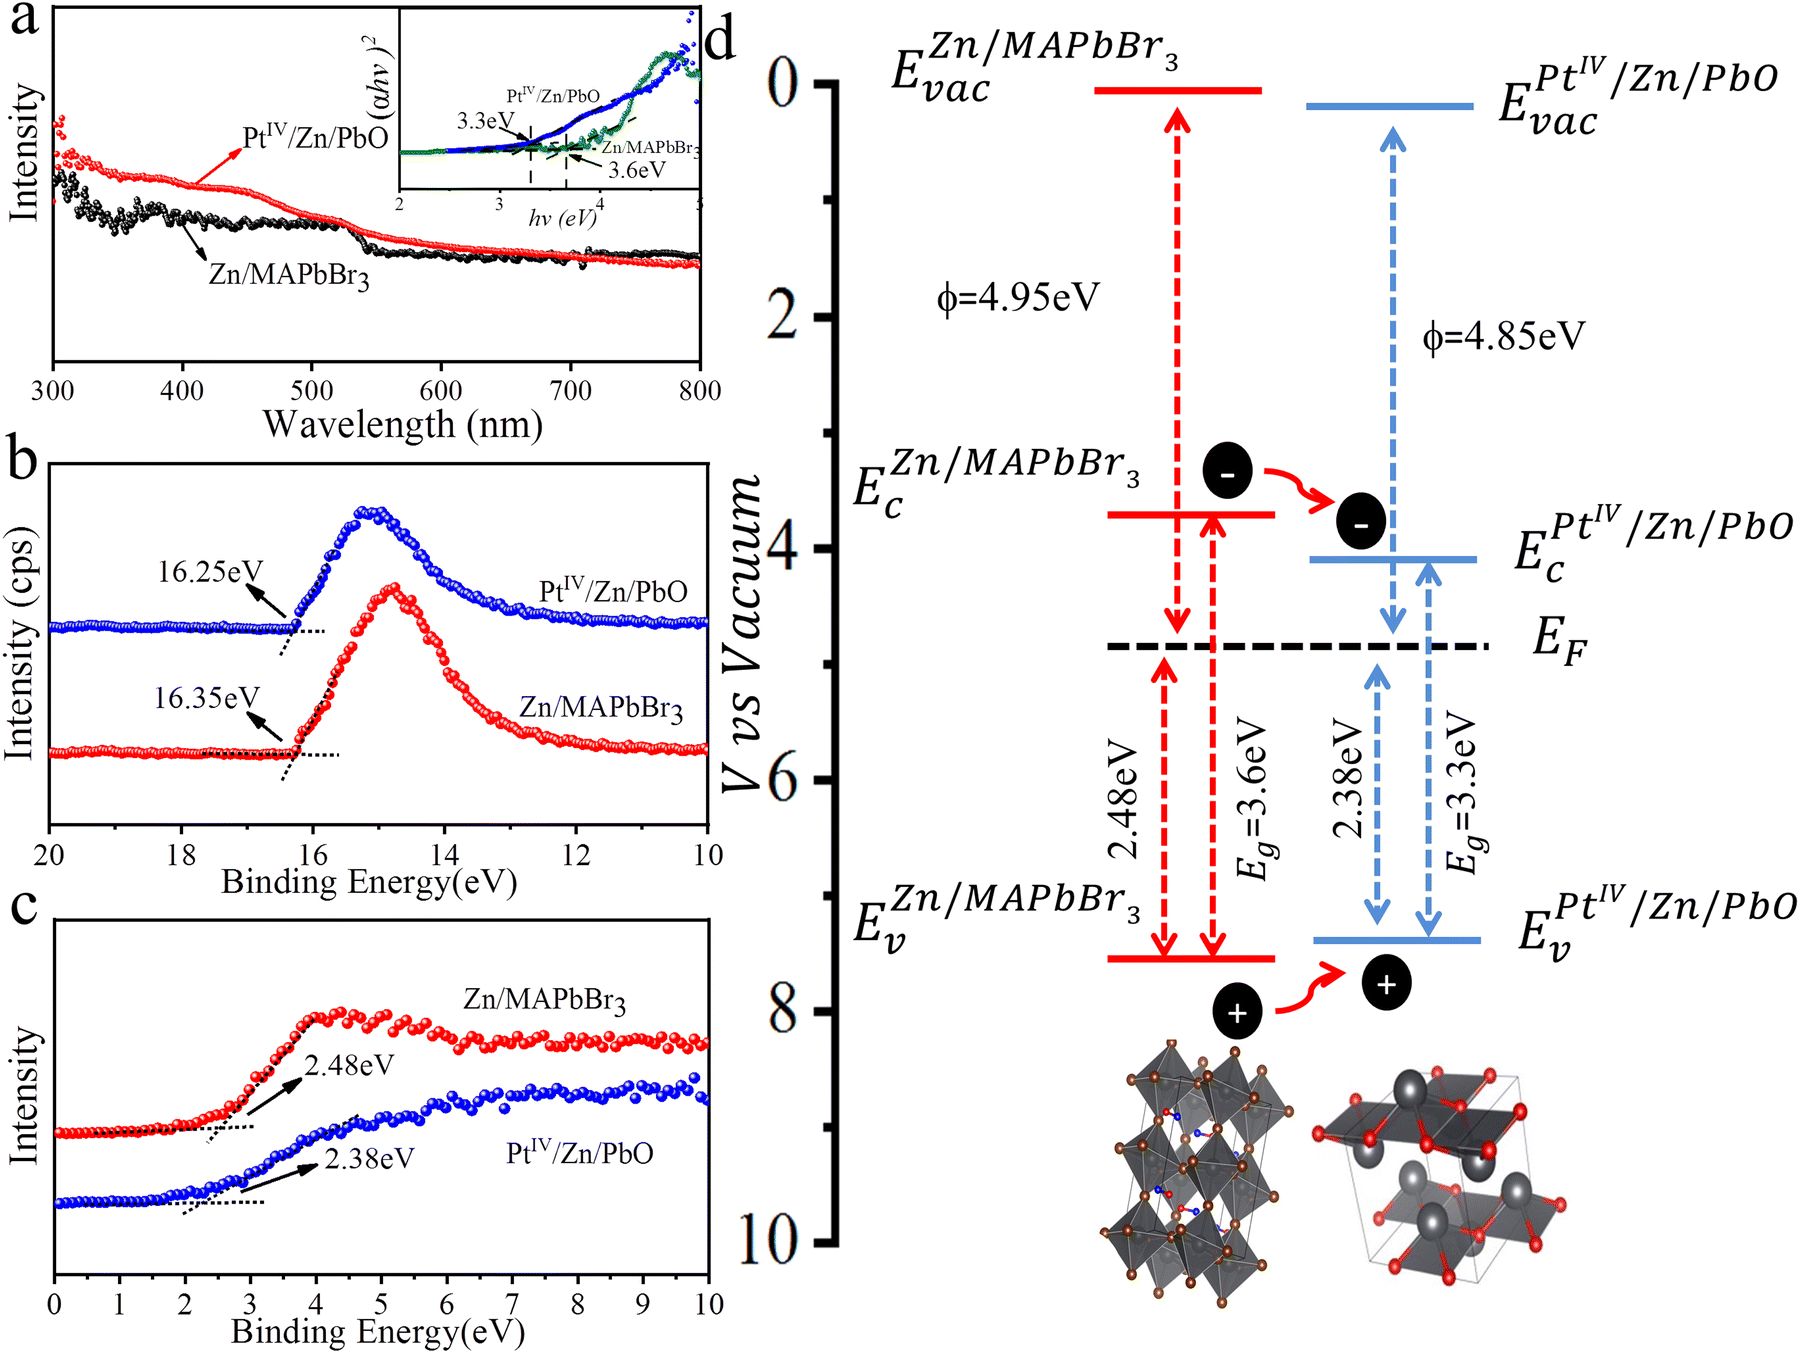 | ||
| Fig. 5 Band structures of PtIV/Zn/PbO/PC-Zn/MAPbBr3. (a) The calculations of the optical band gap. (b) UPS spectra. (c) VBXPS spectra. (d) Schematic energy band diagram of the PtIV/Zn/PbO/PC-Zn/MAPbBr3 heterojunction. | ||
3.6 The examination of the atomic dispersions of PtIV/Zn/PbO/PC-Zn/MAPbBr3
The atomic dispersions of Pb, Zn, and PtIV as well as their coordination environments were further examined by X-ray absorption near-edge structures (XANES) and extended X-ray absorption fine structure (EXAFS) measurements (Fig. S12†). As shown in Fig. 6a, the metallic signals of Pb–O at about 2.163 Å was recorded on the surface of PtIV/Zn/PbO/PC-Zn/MAPbBr3. This manifested that the PbO was exposed on the surface of PC-encapsulated OIP QDs to guarantee the charge transport in NRR. In addition, the Fourier transformation (FT) of the Zn K-edge spectra was conducted with Zn foil, ZnBr2, and ZnO as references. As demonstrated (Fig. 6b), the typical Zn–O scattering paths of Zn/PbO/PC-Zn/MAPbBr3 and PtIV/Zn/PbO/PC-Zn/MAPbBr3 at about 1.802 Å and 1.809 Å, respectively, were recorded on the surface, while the signals of Zn–Br (at 2.310 Å and 2.220 Å) were observed for the Zn-doped and PtIV/Zn co-doped nanomaterials.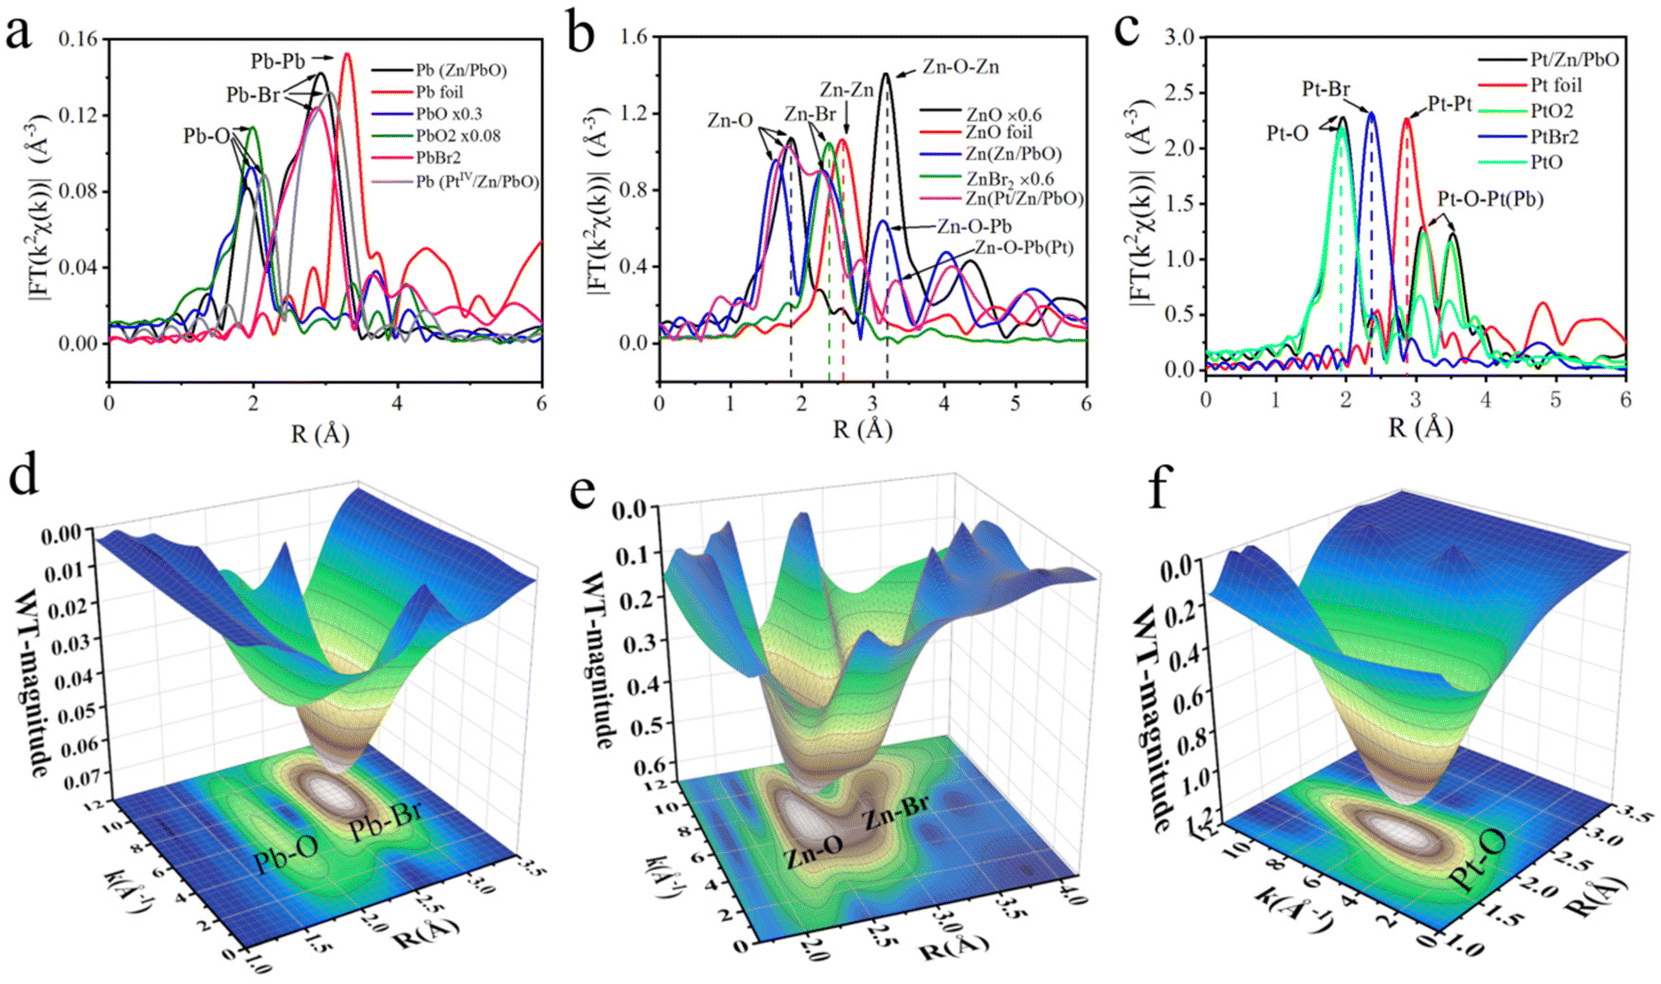 | ||
| Fig. 6 FT K2-weighted XANES spectra of (a) Pb and (b) Zn and the (c) PtIV K-edge radial distance spectra χ(R) for three OIP QDs, as well as the references of Pb foil, PbO, PbO2, PbBr2, Zn foil, ZnBr2, ZnO, Pt foil, PtO2, PtBr2 and PtO at the K-edge. Wavelet transform extended X-ray absorption fine structure (WTEXAFS) of PtIV/Zn/PbO/PC-Zn/MAPbBr3 for (d) Pb, (e) Zn and (f) PtIV. | ||
Moreover, the FT K2-weighted XANES spectrum of Pt in PtIV/Zn/PbO/PC-Zn/MAPbBr3 was also recorded. As shown in Fig. 6c, with PtO2 (5d6) as the reference, the Pt–O coordination at about 1.993 Å was recorded. This indicated a high valence state of ∼4+ with a larger population of unoccupied Pt 5d states in the PtIV/Zn co-doped OIP QDs. Thus, the electron-deficient catalytic sites with strong affinity toward N2 were formed. Compared with the FT K2-weighted XANES spectra of Pb (Fig. 6a) and Zn (Fig. 6b), this dispersion of Pt and Zn on the surface could be generated from the substation of Pb species by Zn and Pt on the surface. Furthermore, there were no Pt–Pt and Pt–Br peaks on the surface of PtIV/Zn/PbO/PC-Zn/MAPbBr3 (Fig. 6c), suggesting that only the atomically dispersed Pt element existed on the surface. The recorded electron deficient sites of PtIV and Zn together with the Pb–O signals on the surface are in accordance with the XPS observations.
To better demonstrate the dispersed state of Pb, Zn, and Pt in PtIV/Zn/PbO/PC-Zn/MAPbBr3, the wavelet transform (WT) of χ(R) was employed compared with the corresponding references (Pb foil, PbO, PbO2, PbBr2, Zn, ZnBr2, ZnO, Pt foil, PtO2, PtBr2, and PtO in Fig. S14–S16†). In the wavelet transform extended X-ray absorption fine structure (WTEXAFS) of Pb (Fig. 6d), the significant signals of Pb–O and Pb–Br were observed on the surface of the PtIV/Zn co-doped nanomaterials. This confirmed the exposure of PbO on the surface to construct the heterojunction for NRR. As demonstrated in Fig. 6e, the scattering path signal of Zn–O bonding at [χ(k), χ(R)] of [7.012, 1.809] was recorded on the surface, which was under the internal Zn–Br signal (at [χ(k), χ(R)] of [6.502, 2.221]). This demonstrated the successful doping of Zn to form a coordination shell on the surface. More interestingly, compared with the reference signal of Pt–Pt in Pt foil at [7.493, 2.850] (Fig. S14†), no Pt–Pt bonding was observed in PtIV/Zn/PbO/PC-Zn/MAPbBr3, while only a significant Pt–O signal at [χ(k), χ(R)] of [5.812, 1.990] was recorded on the surface (Fig. 6f), and no other scattering path signal of Pt was observed. This indicated the atomically dispersed state of PtIV atoms on the PtIV/Zn/PbO/PC-Zn/MAPbBr3 nanomaterials, which lowered the d-band to weaken H adsorption. The formation of an Zn/PbO oxide shell might be due to the oxidation of the nanostructure in air. Quantitative χ(R) space spectra fitting was also performed to investigate the local atomic structure for determining the coordination numbers of Pb, Zn, or Pt on the surface (Tables S7–S9†). Br was mainly in the core structure, which was one of the main components of OIP QDs. Therefore, the significant signals of the co-doped species of PtIV and Zn were confirmed to be connected to PbO exposed on the surface.
3.7 Mechanism studies by theoretical calculations
To further explore the roles of Pt/Zn co-doped atoms on the surface of Pt/Zn/PbO/PC-Zn/MAPbBr3 for photocatalytic NRR, first-principle theoretical calculations were employed. Herein, a series of DFT calculations were performed to examine the atomic structure of Zn-doped and Pt/Zn co-doped active sites. Fig. S17† shows the optimized models, in which the bond lengths are 1.868 Å and 2.142 Å for Zn–O and Pb–O, respectively. These lengths are in accordance with the structural parameters in the Zn and Pb K-edge χ(R) space spectral fitting of PtIV/Zn-PbO (Fig. 6). The N2 molecule is able to be adsorbed on the catalyst surface either in side-on or end-on configurations. Based on the calculated adsorption energy and bond length (Fig. 7), the end-on configuration on the PtIV/Zn co-doped surface is the favorable one with an adsorption energy of −1.18 eV (Fig. 7(v)). This is obviously superior to the adsorption energy on the Zn-doped surface (−0.48 eV) (Fig. 7(ii)). By energy minimization, N2 would eventually lean toward the Pt site after adsorbing on the surface either in end-on or side-on configuration. This demonstrated that Pt acted as the active site for NRR. Therefore, the active sites of Pt on the catalyst surface were identified to enhance the adsorption of N2 for NRR.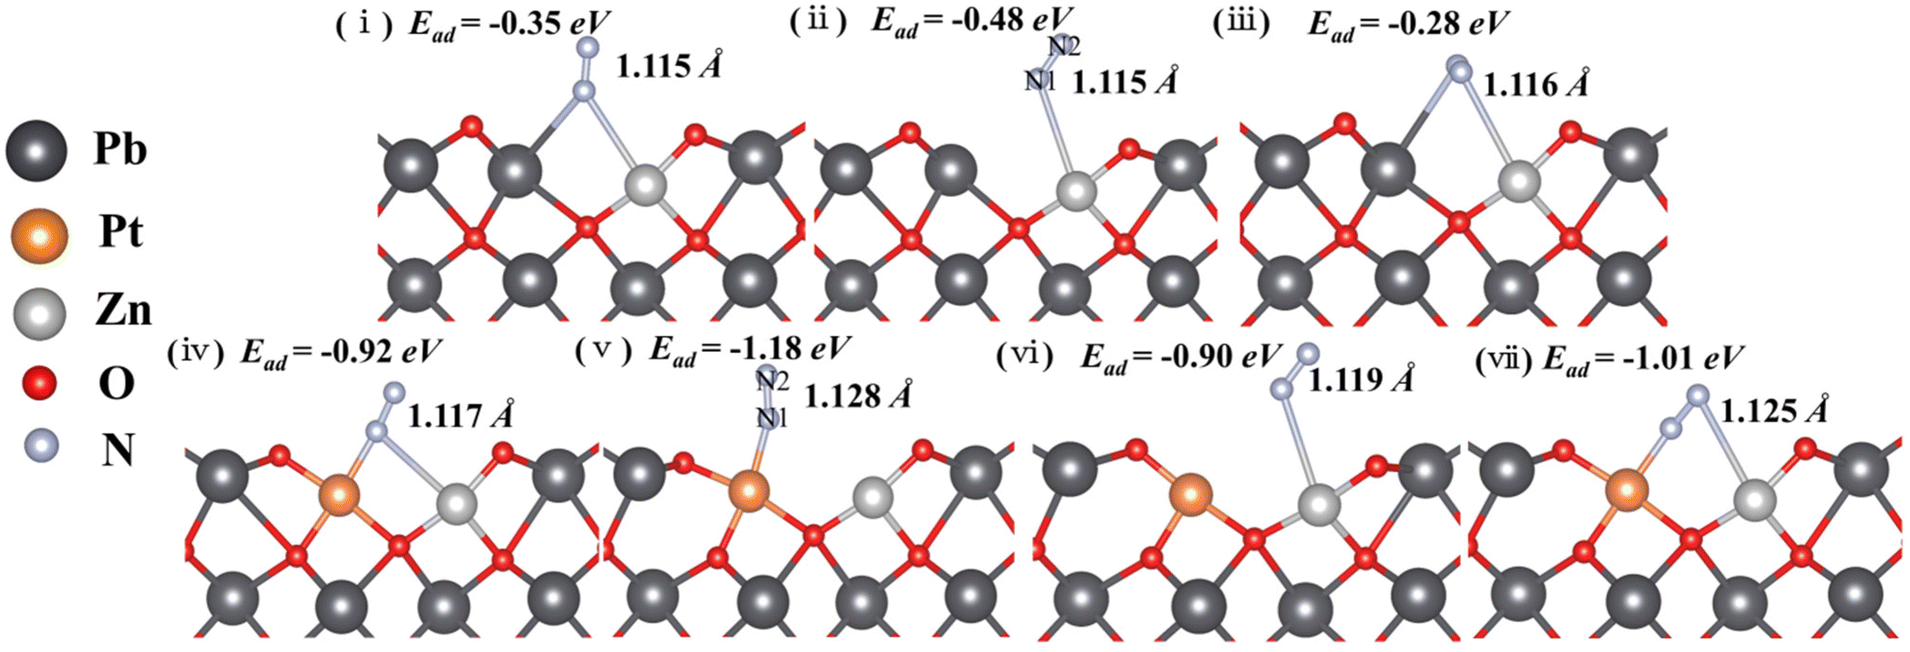 | ||
| Fig. 7 Adsorption energy and the bond length of N2 absorbed on the surface of Zn-doped (i, ii and iii) and PtIV/Zn co-doped (iv, v and vi) catalysts in both end-on and side-on configurations. The interactions between the oxygen vacancy and Pb, Pt and Zn were examined. | ||
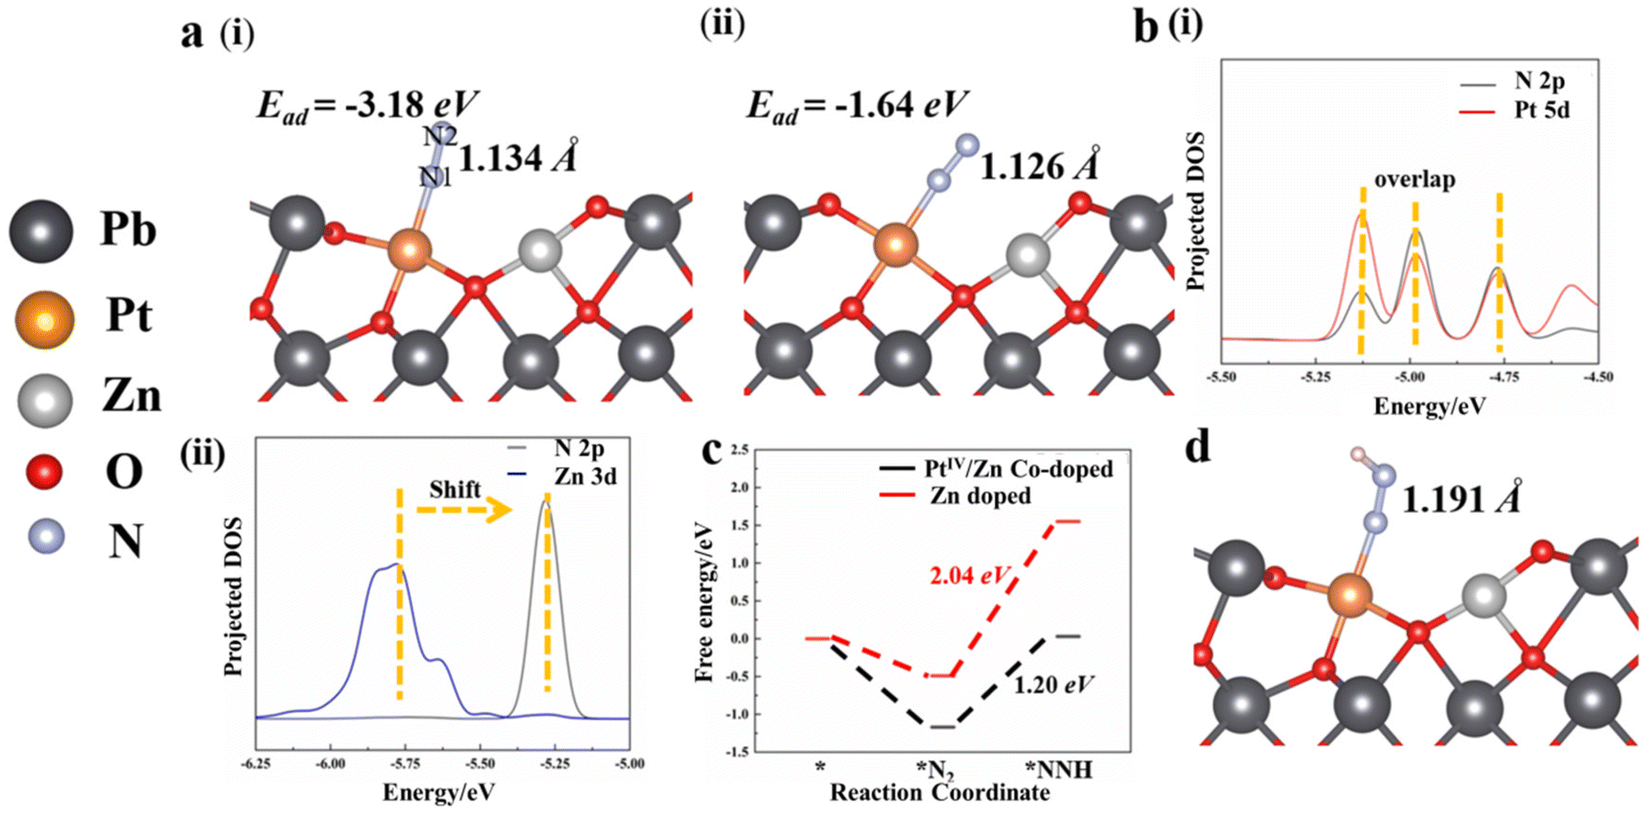
In addition, Bader charge analysis was performed to evaluate the polarization of N2 by the catalysts. The charges on N1 and N2 of the Zn-doped catalyst model are +0.09e and −0.09e, respectively (Fig. 7(vi)), while in the Pt/Zn co-doped one, the charges on the two nitrogen atoms are +0.22e and −0.27e, respectively (Fig. 7(v)). This indicates that the doped Pt facilitates the polarization of N2. The adsorption of N2 on PtIV was further examined by removing two electrons from the aforementioned Pt–Zn co-doped system, which displayed a higher adsorption energy of −3.18 eV (Fig. 8a(i)). The N–N triple bond is correspondingly activated and extended to 1.134 Å between the length of triple bond (1.091 Å) of N2 and the double bond (1.200 Å) of diazene. Meanwhile, in this charged system, in the end-on configuration, the polarization of N2 is further enhanced with electronic charges of +0.33 and −0.23e on N1 and N2, respectively (Fig. 8a(i)). On the contrary, the adsorption of N2 on PtIV in the side-on configuration is not stable, which is eventually converted into the adsorption to PtIV in the end-on configuration after energy minimization (Fig. 8a(ii)). Therefore, the end-on configurations with N2 adsorbed on PtIV in the PtIV/Zn co-doped model as well as the Zn-doped one were adopted for the following calculations.
 | ||
| Fig. 8 (a) N2 absorbed on the (i) PtIV site and oxygen vacancy in the Zn/PtIV co-doped model with (ii) side-on configuration in the charged system. (b) Projected DOS of the (i) Zn/Pt co-doped and (ii) Zn-doped model. (c) Free energy profiles of the formation of *NNH in the Zn-doped and Zn/PtIV co-doped systems. (d) The optimized structure of *NNH adsorbed on the Zn/PtIV co-doped system. | ||
The suppression of NRR to HER by the PtIV/Zn co-doped catalysts was further examined by calculating the adsorption energies of H and N2 on the surface. Significantly, in both neutral and charged systems, the H atom always tends to be adsorbed to the adjacent O atom, irrespective of its initial location (on top of PtIV or Zn, Fig. S18†). On the other hand, with stronger metal–N2 interaction, PtIV is favored to adsorb N2 over H to enhance the NRR activity because the PtIV d-band states were far from the Fermi level (Ef).54 Thus, the active site of PtIV tends to adsorb N2, which suppresses HER to increase the NRR efficiency, indicating that water would not act as the electron acceptor.
To further investigate the origin of the catalytic activity of the PtIV/Zn co-doped system, the electronic properties of the contacting interface were examined. As demonstrated by the projected DOS, the Pt 5d and N 2p overlap significantly (Fig. 8b(i)), while a significant shift is observed between the DOS signals of Zn 3d and N 2p (Fig. 8b(ii)). This confirms the intensive electron transfer between PtIV and N, which plays a dominant role in the catalytic activity for NRR. Considering that the formation of *NNH was generally regarded as the rate-determining step of NRR, the reaction energy barrier of the proton-coupled electron transfer process (*N2 + H+ + e− → *NNH) was calculated. It was found that the reaction from *N2 to *NNH requires an uphill free energy of 2.04 eV on Zn-doped and 1.20 eV on PtIV/Zn co-doped system, respectively (Fig. 8c). This results in a significantly elongated length of the N–N bond from 1.134 Å (in *N2) to 1.191 Å (in *NNH) (Fig. 8d), indicating that N2 tends to be dissociated at the *NNH state. In addition, the lower reaction energy barrier of the PtIV active site is also obtained to facilitate catalytic NRR.
4. Conclusion
In conclusion, by ESI-based preparation, the PC-part-encapsulated type I heterojunction of PtIV/Zn co-doped PbO-MAPbBr3 was successfully constructed in microseconds. In this rapid process, the core of Zn/MAPbBr3 was crystallized, followed by the encapsulation of the PC shell to obtain the water-resistant properties. Significantly, the synergistic co-doping structure of PtIV/Zn with exposed PbO was constructed on the surface. This facilitated the formation of active sites of electron-deficient d-orbital of Pt atoms with strong affinity towards N2 to suppress HER. Therefore, NRR was boosted by PtIV/Zn co-doped active sites with lower reaction energy barrier due to the improved electron delocalization of PtIV d-orbitals for electron transfer to N2. The developed enhanced heterojunction of water-resistant PtIV/Zn co-doped OIP QDs has encouraged the applications of OIP QDs in the aqueous phase. Furthermore, this could also be helpful in more photocatalytic applications of green synthesis.Conflicts of interest
The authors declare that they have no known competing financial interests or personal relationships that could have appeared to influence the work reported in this paper.Acknowledgements
N. N., Y. G., X. S., J. S., J. W., and H. T. gratefully acknowledge the financial support provided by the National Natural Science Foundation of China (NNSFC, 21874012) and the National Key Research and Development Program of China (NKRDPC, 2019YFC1805600). J. O. is grateful for the financial support provided by NNSFC (21974010). J. Z. is grateful for NKRDPC 2020YFA0406101 and Liaoning Natural Science Foundation (20180510050). The authors thank BSRF and NSRL for synchrotron beam time.References
- H. Huang, J. Raith, S. V. Kershaw, S. Kalytchuk, O. Tomanec, L. H. Jing, A. S. Susha, R. Zboril and A. L. Rogach, Nat. Commun., 2017, 8, 8 CrossRef PubMed.
- M. M. Lee, J. Teuscher, T. Miyasaka, T. N. Murakami and H. J. Snaith, Science, 2012, 338, 643–647 CrossRef PubMed.
- Y. Cao, N. Wang, H. Tian, J. Guo, Y. Wei, H. Chen, Y. Miao, W. Zou, K. Pan, Y. He, H. Cao, Y. Ke, M. Xu, Y. Wang, M. Yang, K. Du, Z. Fu, D. Kong, D. Dai, Y. Jin, G. Li, H. Li, Q. Peng, J. Wang and W. Huang, Nature, 2018, 562, 249–253 CrossRef.
- N. Li, L. Song, Y. Jia, Y. Dong, F. Xie, L. Wang, S. Tao and N. Zhao, Adv. Mater., 2020, 32, 1907786 CrossRef PubMed.
- C. Wang, G. Dai, J. Wang, M. Cui, Y. Yang, S. Yang, C. Qin, S. Chang, K. Wu, Y. Liu and H. Zhong, Nano Lett., 2022, 22, 1338–1344 CrossRef PubMed.
- Q. Cui, X. Song, Y. Liu, Z. Xu, H. Ye, Z. Yang, K. Zhao and S. Liu, Matter, 2021, 4, 2490–2507 CrossRef.
- J. Zhao, L. Zhao, Y. Deng, X. Xiao, Z. Ni, S. Xu and J. Huang, Nat. Photonics, 2020, 14, 612–617 CrossRef.
- Y. X. Wang, R. X. Lin, P. C. Zhu, Q. H. Zheng, Q. J. Wang, D. Y. Li and J. Zhu, Nano Lett., 2018, 18, 2772–2779 CrossRef.
- Y. Q. Wu, P. Wang, X. L. Zhu, Q. Q. Zhang, Z. Y. Wang, Y. Y. Liu, G. Z. Zou, Y. Dai, M. H. Whangbo and B. B. Huang, Adv. Mater., 2018, 30, 6 Search PubMed.
- X. Tian, S. D. Stranks and F. You, Nat. Sustain., 2021, 4, 821–829 CrossRef.
- S. Tan, T. Huang, I. Yavuz, R. Wang, T. W. Yoon, M. Xu, Q. Xing, K. Park, D.-K. Lee, C.-H. Chen, R. Zheng, T. Yoon, Y. Zhao, H.-C. Wang, D. Meng, J. Xue, Y. J. Song, X. Pan, N.-G. Park, J.-W. Lee and Y. Yang, Nature, 2022, 605, 268–273 CrossRef.
- J. Zeng, L. Bi, Y. Cheng, B. Xu and A. K.-Y. Jen, Nano Res. Energy, 2022, e9120002 Search PubMed.
- J. H. Heo, S. H. Im, J. H. Noh, T. N. Mandal, C.-S. Lim, J. A. Chang, Y. H. Lee, H.-j. Kim, A. Sarkar, M. K. Nazeeruddin, M. Graetzel and S. I. Seok, Nat. Photonics, 2013, 7, 487–492 CrossRef.
- Y. Q. Wu, P. Wang, Z. H. Guan, J. X. Liu, Z. Y. Wang, Z. K. Zheng, S. Y. Jin, Y. Dai, M. H. Whangbo and B. B. Huang, ACS Catal., 2018, 8, 10349–10357 CrossRef.
- F. Chen, C. X. Xu, Q. Y. Xu, Y. Z. Zhu, F. F. Qin, W. Zhang, Z. Zhu, W. Liu and Z. L. Shi, ACS Appl. Mater. Interfaces, 2018, 10, 25763–25769 CrossRef PubMed.
- L. Wang, H. Xiao, T. Cheng, Y. Li and W. A. Goddard III, J. Am. Chem. Soc., 2018, 140, 1994–1997 CrossRef.
- B. Wenger, P. K. Nayak, X. M. Wen, S. V. Kesava, N. K. Noel and H. J. Snaith, Nat. Commun., 2017, 8, 10 CrossRef PubMed.
- Y. Wu, P. Wang, Z. Guan, J. Liu, Z. Wang, Z. Zheng, S. Jin, Y. Dai, M.-H. Whangbo and B. Huang, ACS Catal., 2018, 8, 10349–10357 CrossRef.
- L. Quyet Van, K. Hong, H. W. Jang and S. Y. Kim, Adv. Electron. Mater., 2018, 4, 1800335 CrossRef.
- J. Shamsi, A. S. Urban, M. Imran, L. De Trizio and L. Manna, Chem. Rev., 2019, 119, 3296–3348 CrossRef.
- C. Caddeo, M. I. Saba, S. Meloni, A. Filippetti and A. Mattoni, ACS Nano, 2017, 11, 9183–9190 CrossRef PubMed.
- S. Park, W. J. Chang, C. W. Lee, S. Park, H.-Y. Ahn and K. T. Nam, Nat. Energy, 2017, 2, 16185 CrossRef.
- M. Ou, W. G. Tu, S. M. Yin, W. N. Xing, S. Y. Wu, H. J. Wang, S. P. Wan, Q. Zhong and R. Xu, Angew. Chem., Int. Ed., 2018, 57, 13570–13574 CrossRef PubMed.
- Y. F. Xu, M. Z. Yang, B. X. Chen, X. D. Wang, H. Y. Chen, D. B. Kuang and C. Y. Su, J. Am. Chem. Soc., 2017, 139, 5660–5663 CrossRef.
- H. W. Huang, H. F. Yuan, K. P. F. Janssen, G. Solis-Fernandez, Y. Wang, C. Y. X. Tan, D. Jonckheere, E. Debroye, J. L. Long, J. Hendrix, J. Hofkens, J. A. Steele and M. B. J. Roeffaers, ACS Energy Lett., 2018, 3, 755–759 CrossRef.
- Q. L. Wang, L. M. Tao, X. X. Jiang, M. K. Wang and Y. Shen, Appl. Surf. Sci., 2019, 465, 607–613 CrossRef.
- S. Park, W. J. Chang, C. W. Lee, S. Park, H. Y. Ahn and K. T. Nam, Nat. Energy, 2017, 2, 8 CrossRef.
- Y.-F. Xu, M.-Z. Yang, B.-X. Chen, X.-D. Wang, H.-Y. Chen, D.-B. Kuang and C.-Y. Su, J. Am. Chem. Soc., 2017, 139, 5660–5663 CrossRef PubMed.
- M. Ou, W. Tu, S. Yin, W. Xing, S. Wu, H. Wang, S. Wan, Q. Zhong and R. Xu, Angew. Chem., Int. Ed., 2018, 57, 13570–13574 CrossRef PubMed.
- Z. J. Li, E. Hofman, J. Li, A. H. Davis, C. H. Tung, L. Z. Wu and W. W. Zheng, Adv. Funct. Mater., 2018, 28, 7 Search PubMed.
- H. Y. Liu, Y. S. Tan, M. H. Cao, H. C. Hu, L. Z. Wu, X. Y. Yu, L. Wang, B. Q. Sun and Q. Zhang, ACS Nano, 2019, 13, 5366–5374 CrossRef.
- Y. X. Gao, X. Su, J. W. Zhang, H. W. Tan, J. H. Sun, J. Ouyang and N. Na, Small, 2021, 17, 10 Search PubMed.
- Z. Long, Y. Wang, Q. Fu, J. Ouyang, L. He and N. Na, Nanoscale, 2019, 11, 11093–11098 RSC.
- Z. Guan, Y. Wu, P. Wang, Q. Zhang, Z. Wang, Z. Zheng, Y. Liu, Y. Dai, M.-H. Whangbo and B. Huang, Appl. Catal., B, 2019, 245, 522–527 CrossRef.
- G. Gao, Q. Xi, H. Zhou, Y. Zhao, C. Wu, L. Wang, P. Guo and J. Xu, Nanoscale, 2017, 9, 12032–12038 RSC.
- Y. Chen, R. Guo, X. Peng, X. Wang, X. Liu, J. Ren, J. He, L. Zhuo, J. Sun, Y. Liu, Y. Wu and J. Luo, ACS Nano, 2020, 14, 6938–6946 CrossRef PubMed.
- R. Hao, W. M. Sun, Q. Liu, X. L. Liu, J. L. Chen, X. W. Lv, W. Li, Y. P. Liu and Z. R. Shen, Small, 2020, 16, 7 Search PubMed.
- M. V. Pavliuk, M. Abdellah and J. Sa, Mater. Today Commun., 2018, 16, 90–96 CrossRef CAS.
- J. Xu, S. Lai, D. Qi, M. Hu, X. Peng, Y. Liu, W. Liu, G. Hu, H. Xu, F. Li, C. Li, J. He, L. Zhuo, J. Sun, Y. Qiu, S. Zhang, J. Luo and X. Liu, Nano Res., 2021, 14, 1374–1381 CrossRef CAS.
- Y. Ren, C. Yu, X. Tan, H. Huang, Q. Wei and J. Qiu, Energy Environ. Sci., 2021, 14, 1176–1193 RSC.
- H. Li, J. Shang, Z. H. Ai and L. Z. Zhang, J. Am. Chem. Soc., 2018, 140, 526–526 CrossRef CAS.
- L. M. Azofra, Curr. Opin. Electrochem., 2022, 101073 CrossRef.
- D. F. Yan, H. Li, C. Chen, Y. Q. Zou and S. Y. Wang, Small Methods, 2019, 3, 21 Search PubMed.
- Y. Guo, J. X. Gu, R. Zhang, S. C. Zhang, Z. Li, Y. W. Zhao, Z. D. Huang, J. Fan, Z. F. Chen and C. Y. Zhi, Adv. Energy Mater., 2021, 11, 8 Search PubMed.
- Y. Deng, Z. Y. Xiao, Z. C. Wang, J. P. Lai, X. B. Liu, D. Zhang, Y. Han, S. X. Li, W. Sun and L. Wang, Appl. Catal., B, 2021, 291, 8 CrossRef.
- W. Liu, L. Han, H.-T. Wang, X. Zhao, J. A. Boscoboinik, X. Liu, C.-W. Pao, J. Sun, L. Zhuo, J. Luo, J. Ren, W.-F. Pong and H. L. Xin, Nano Energy, 2020, 77, 105078 CrossRef CAS.
- F. L. Lai, W. Zong, G. J. He, Y. Xu, H. W. Huang, B. Weng, D. W. Rao, J. A. Martens, J. Hofkens, I. P. Parkin and T. X. Liu, Angew. Chem., Int. Ed., 2020, 59, 13320–13327 CrossRef CAS PubMed.
- L. Han, Z. Ren, P. Ou, H. Cheng, N. Rui, L. Lin, X. Liu, L. Zhuo, J. Song, J. Sun, J. Luo and H. L. Xin, Angew. Chem., Int. Ed., 2021, 60, 345–350 CrossRef CAS PubMed.
- X. Peng, Y. Mi, H. Bao, Y. Liu, D. Qi, Y. Qiu, L. Zhuo, S. Zhao, J. Sun, X. Tang, J. Luo and X. Liu, Nano Energy, 2020, 78, 105321 CrossRef CAS.
- F. Li, G. F. Han, H. J. Noh, J. P. Jeon, I. Ahmad, S. S. Chen, C. Yang, Y. F. Bu, Z. P. Fu, Y. L. Lu and J. B. Baek, Nat. Commun., 2019, 10, 7 CrossRef.
- W. Tong, B. L. Huang, P. T. Wang, Q. Shao and X. Q. Huang, Natl. Sci. Rev., 2021, 8, 10 Search PubMed.
- X. Guo, X. Y. Li, Y. C. Li, J. R. Yang, X. Wan, L. Y. Chen, J. Y. Liu, X. F. Liu, R. H. Yu, L. R. Zheng and J. L. Shui, Nano Energy, 2020, 78, 9 Search PubMed.
- J. J. Li, Q. Q. Guan, H. Wu, W. Liu, Y. Lin, Z. H. Sun, X. X. Ye, X. S. Zheng, H. B. Pan, J. F. Zhu, S. Chen, W. H. Zhang, S. Q. Wei and J. L. Lu, J. Am. Chem. Soc., 2019, 141, 14515–14519 CrossRef CAS PubMed.
- H. Y. F. Sim, J. R. T. Chen, C. S. L. Koh, H. K. Lee, X. M. Han, G. C. Phan-Quang, J. Y. Pang, C. L. Lay, S. Pedireddy, I. Y. Phang, E. K. L. Yeow and X. Y. Ling, Angew. Chem., Int. Ed., 2020, 59, 16997–17003 CrossRef CAS.
- F. Calle-Vallejo, M. T. M. Koper and A. S. Bandarenka, Chem. Soc. Rev., 2013, 42, 5210–5230 RSC.
- F. Wang and J. Mao, Diamond Relat. Mater., 2021, 118, 108494 CrossRef CAS.
- Y. Y. Tong, H. P. Guo, D. L. Liu, X. Yan, P. P. Su, J. Liang, S. Zhou, J. Liu, G. Q. Lu and S. X. Dou, Angew. Chem., Int. Ed., 2020, 59, 7356–7361 CrossRef CAS PubMed.
- P. S. Li, Z. Zhou, Q. Wang, M. Guo, S. W. Chen, J. X. Low, R. Long, W. Liu, P. R. Ding, Y. Y. Wu and Y. J. Xiong, J. Am. Chem. Soc., 2020, 142, 12430–12439 CrossRef CAS PubMed.
- Y. Gu, B. Xi, W. Tian, H. Zhang, Q. Fu and S. Xiong, Adv. Mater., 2021, 33, 2100429 CrossRef CAS.
- Y. Zhao, F. Li, W. Li, Y. Li, C. Liu, Z. Zhao, Y. Shan, Y. Ji and L. Sun, Angew. Chem., Int. Ed., 2021, 60, 20331–20341 CrossRef CAS PubMed.
- P. Li, S. Gao, Q. Liu, P. Ding, Y. Wu, C. Wang, S. Yu, W. Liu, Q. Wang and S. Chen, Adv. Energy Sustain. Res., 2021, 2, 2000097 CrossRef.
- C. B. Zhu, Y. P. Fu and Y. Yu, Adv. Mater., 2019, 31, 25 Search PubMed.
- Y. W. Liu, M. Cheng, Z. H. He, B. C. Gu, C. Xiao, T. F. Zhou, Z. P. Guo, J. D. Liu, H. Y. He, B. J. Ye, B. C. Pan and Y. Xie, Angew. Chem., Int. Ed., 2019, 58, 731–735 CrossRef CAS PubMed.
- S. Fang, X. R. Zhu, X. K. Liu, J. Gu, W. Liu, D. H. Wang, W. Zhang, Y. Lin, J. L. Lu, S. Q. Wei, Y. F. Li and T. Yao, Nat. Commun., 2020, 11, 8 CrossRef.
Footnotes |
| † Electronic supplementary information (ESI) available. See DOI: https://doi.org/10.1039/d2nr02662g |
| ‡ These authors contributed equally to this work. |
| This journal is © The Royal Society of Chemistry 2022 |