
Scattering techniques for mixed donor–acceptor characterization in organic photovoltaics
Thomas P.
Chaney†
 a,
Andrew J.
Levin†
a,
Sebastian A.
Schneider
bc and
Michael F.
Toney
*ad
a,
Andrew J.
Levin†
a,
Sebastian A.
Schneider
bc and
Michael F.
Toney
*ad
aMaterials Science and Engineering, University of Colorado, Boulder, CO 80309, USA. E-mail: Michael.Toney@colorado.edu
bDepartment of Chemistry, Stanford University, Stanford, CA 94305, USA
cStanford Synchrotron Radiation Lightsource, SLAC National Accelerator Laboratory, Menlo Park, CA 94025, USA
dDepartment of Chemical and Biological Engineering, University of Colorado, Boulder, CO 80309, USA
First published on 12th November 2021
Abstract
Precise control of the complex morphology of organic photovoltaic bulk heterojunction (BHJ) active layers remains an important yet challenging approach for improving power conversion efficiency. Of particular interest are the interfacial regions between electron donor and acceptor molecules where charge separation and charge recombination occur. Often, these interfaces feature a molecularly mixed donor–acceptor phase. This mixed phase has been extensively studied in polymer:fullerene systems but is poorly understood in state-of-the-art polymer:non-fullerene acceptor blends. Accurate, quantitative characterization of this mixed phase is critical to unraveling its importance for charge separation and recombination processes within the BHJ. Here, we detail X-ray and neutron scattering characterization techniques and analysis methods to quantify the mixed phase within BHJ active layers. We then review the existing literature where these techniques have been successfully used on several different material systems and correlated to device performance. Finally, future challenges for characterizing non-fullerene acceptor systems are addressed, and emerging strategies are discussed.
 Thomas P. Chaney | Thomas P. Chaney received his bachelor's degree in materials science and engineering from the University of Kentucky. He began his PhD studies in 2020 under Professor Michael F. Toney at the University of Colorado at Boulder. He is interested in utilizing X-ray characterization techniques to investigate the factors governing the self-assembly of conjugated molecules for application in organic photovoltaics (OPVs). He aims to guide the design of next generation OPV materials and processing methods to realize high performing OPV devices that are stable and easily fabricated. |
 Andrew J. Levin | Andrew J. Levin is currently a materials science PhD student at the University of Colorado Boulder working in Professor Michael F. Toney's group. He received his BSE degree in materials science and engineering from the University of Connecticut in 2020. His current research is focused on using X-ray and neutron scattering techniques to investigate the morphology and degradation pathways of organic photovoltaic films. |
 Sebastian A. Schneider | Sebastian A. Schneider received his bachelor and master of science degree in chemistry from the Friedrich–Alexander University Erlangen-Nürnberg, Germany. In 2016, he started his PhD studies at Stanford University and the SLAC National Accelerator Laboratory under the supervision of Professor Michael F. Toney. His current research interests focus on organic solar cells (OSCs), in-depth X-ray morphology characterization and printing fabrication. His research aims to realize truly printable high-performance OSC devices and to develop structure–function relationships to guide future material design and device fabrication. |
 Michael F. Toney | Michael F. Toney received his BS from Caltech and his PhD in physics from the University of Washington. After a NATO Postdoctoral Fellowship, he joined the IBM Research Division to focus on the use of X-ray scattering methods for structure determination for polymer thin films, and interfaces. After working at the Stanford Synchrotron Radiation Lightsource (SSRL), he joined CU Boulder in 2020. Toney is a pioneer in the use of X-ray diffraction for in situ investigations of atomic structure at electrified interfaces and in energy storage and of the molecular structure of organic thin films and is a Fellow of APS. |
Introduction
Organic photovoltaics (OPVs) have the potential to deliver low cost, flexible and solution processable photovoltaics. However, they have yet to reach their full potential partly due to recombination losses within the bulk heterojunction.1,2 These losses are attributed to sub-optimal morphologies within the active layer which is a bulk heterojunction (BHJ) consisting of a blend of organic donor and acceptor molecules. A high performing BHJ morphology – amongst other things-must possess three key attributes. First, there must be a mixture of nanoscale domains of electron donor and acceptor molecules so that excitons split, or charge separate, at their interface. Second, the domains must be bi-contiguous such that the separated charges have a path to their respective electrodes. Third, high crystallinity within these domains is believed to aid charge transport and prevent recombination. These design rules have proven useful to explain differences in performance between OPV material systems, but exceptions are known. As we approach 19% power conversion efficiencies in state-of-the-art solar cells,3 it is paramount that we understand charge carrier loss mechanisms in OPVs. The nature of donor–acceptor interfacial regions is an important aspect of BHJ morphology that has significant effects on performance but has received limited attention due in part to the challenges associated with control and characterization of mixed and interfacial regions.2,4,5 It is within this interfacial region that charge transfer (CT) states are formed. Consequently, the morphology of the interfacial regions has significant impact on charge separation and recombination processes. Thus, it is important to optimize the interface as well as the nanophase segregation of donor and acceptor to maximize the overall performance.Research into the effects of interfacial mixing between the donor and acceptor has drawn varied conclusions, sometimes even for similar donor–acceptor systems.6,7 Within this context, it is useful to think of the BHJ as a three-phase system consisting of (I) a relatively pure donor, (II) a relatively pure acceptor, and (III) a molecularly mixed phase. Pure phases in some systems have been shown to improve charge transport and reduce non-geminate recombination.5,8,9 However, some studies have shown that mixed phase can be beneficial by creating an energy cascade promoting CT state separation,2,4 as shown in Fig. 1, and by improving domain interconnectivity.7,10,11 In contrast, the presence of a mixed phase has been found to be detrimental with some studies reporting an increase in bimolecular recombination in systems with significant mixed phase.6,8,12Fig. 2 shows examples of recombination in BHJ's. These (conflicting) reports highlight the importance of accurately quantifying the fraction of mixed phase and the impact of mixing on OPV performance as well as how mixing varies with processing conditions and material systems.
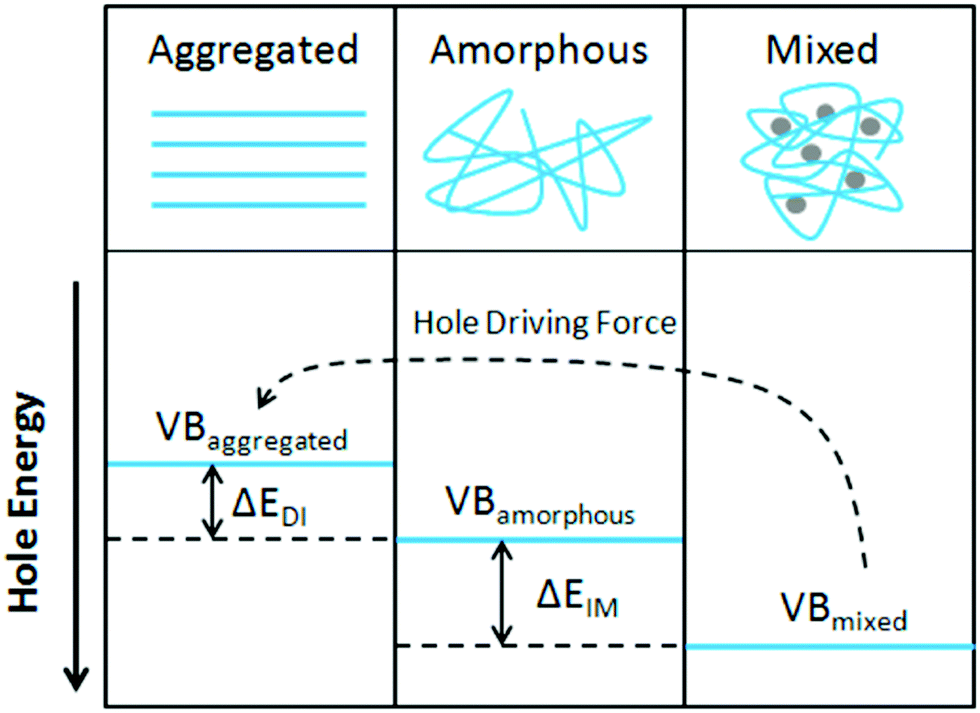 | ||
| Fig. 1 Demonstration of the energy cascade created by mixed phase interfacing with pure amorphous or aggregated phases. The disorder within amorphous and mixed phases drives the valence band deeper in energy creating a driving force for charge separation. Reprinted with permission from S. Sweetnam, K. R. Graham, G. O. Ngongang Ndjawa, T. Heumüller, J. A. Bartelt, T. M. Burke, W. Li, W. You, A. Amassian and M. D. McGehee, J. Am. Chem. Soc., 2014, 136, 14078–14088. Copyright 2014 American Chemical Society. | ||
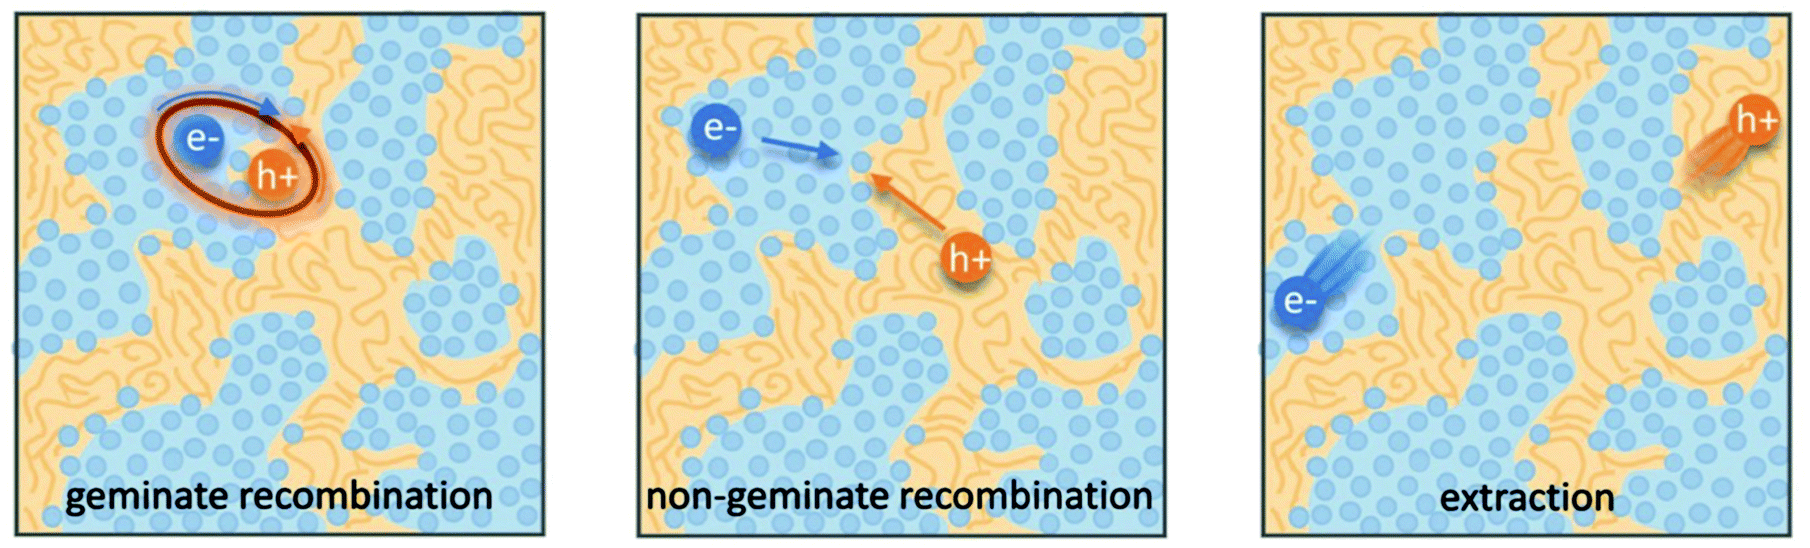 | ||
| Fig. 2 Schematic of the possible fates of generated charges within a bulk heterojunction. Geminate recombination occurs when a charge transfer state forms but is unable to be separated while non-geminate recombination occurs when two separated charges meet at an interface and recombine. Note that both cases of recombination occur at donor acceptor interfaces. In OPVs these recombination mechanisms must be avoided for efficient charge extraction therefore the interface morphology is vital to high performance. Reprinted from Advanced Energy Materials, 8, N. A. Ran, J. A. Love, M. C. Heiber, X. Jiao, M. P. Hughes, A. Karki, M. Wang, V. V. Brus, H. Wang, D. Neher, H. Ade, G. C. Bazan and T. Nguyen, Charge Generation and Recombination in an Organic Solar Cell with Low Energetic Offsets, Adv. Energy Mater., 2018, 8, 1701073, Copyright 2018, with permission from John Wiley and Sons. | ||
To effectively understand the effects of mixed phase on OPV performance, we must first be able to reliably characterize the fraction of mixed phase in BHJ thin films. A variety of techniques have been used to accomplish this including cyclic voltammetry (CV),4,13 scanning transmission electron microscopy (STEM),14 and differential scanning calorimetry (DSC).15,16 Most successful, however, have been X-ray and neutron scattering techniques including grazing incidence wide angle X-ray scattering (GIWAXS),6,7,10,17,18 resonant soft X-ray scattering (RSoXS),5,6,8–10,19–21 and small angle neutron scattering (SANS).22–24 In this focus article we will provide background on the working principles of GIWAXS, RSoXS, and SANS and how they can be leveraged to characterize pure and mixed phases in BHJ films. Then, we will review the current literature characterizing mixed phase in fullerene systems and the potential challenges and outlook for characterizing mixed phases in emerging non-fullerene acceptor systems.
Scattering characterization techniques
GIWAXS
GIWAXS is an X-ray scattering technique that probes structures on the Ångstrom to few nanometers scale. In the context of conjugated polymers and organic small molecules, this corresponds to crystalline features such as π–π and lamellar stacking. GIWAXS is able to probe the existence of these crystalline structures through the diffraction of high energy X-rays (≈5–20 keV). Diffraction occurs when the difference in path lengths of an incident X-ray reflecting off periodic crystal planes is equal to an integer number of wavelengths. This relationship is described through Bragg's law of diffraction: nλ = 2d![[thin space (1/6-em)]](https://www.rsc.org/images/entities/char_2009.gif) sin(θ), where n is a positive integer, λ is the wavelength, d is the periodic spacing between crystal planes, and θ is the reflection angle. In GIWAXS, the incident X-ray beam is held fixed at a grazing incidence to increase the interaction volume of the X-ray beam with the film and reduce background due to the substrate. An area detector is positioned close to the sample (100–200 mm) to capture wide angle scattering as shown in Fig. 3. The satisfaction of Bragg's law appears on the calibrated and corrected detector image as an intensity peak at a radial distance from the beam center corresponding to the scattering vector
sin(θ), where n is a positive integer, λ is the wavelength, d is the periodic spacing between crystal planes, and θ is the reflection angle. In GIWAXS, the incident X-ray beam is held fixed at a grazing incidence to increase the interaction volume of the X-ray beam with the film and reduce background due to the substrate. An area detector is positioned close to the sample (100–200 mm) to capture wide angle scattering as shown in Fig. 3. The satisfaction of Bragg's law appears on the calibrated and corrected detector image as an intensity peak at a radial distance from the beam center corresponding to the scattering vector  . This is quantified by the equation
 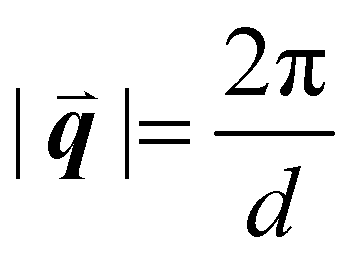 . There is a wealth of information to be gained by analyzing the position, width, and intensity of diffraction peaks from GIWAXS measurements: spacing between crystallite stacking planes (d-spacings) can be determined from the radial position of the peak, preferred crystallite orientation can be resolved from the azimuthal peak position and width, and crystallite coherence length may also be extracted through an analysis on peak widths (e.g., Scherrer and Warren-Averbach).25 Most importantly for the focus of this review is the quantitative analysis of integrated peak intensity that can reveal the relative degree of crystallinity (rDoC) between samples of different processing conditions.
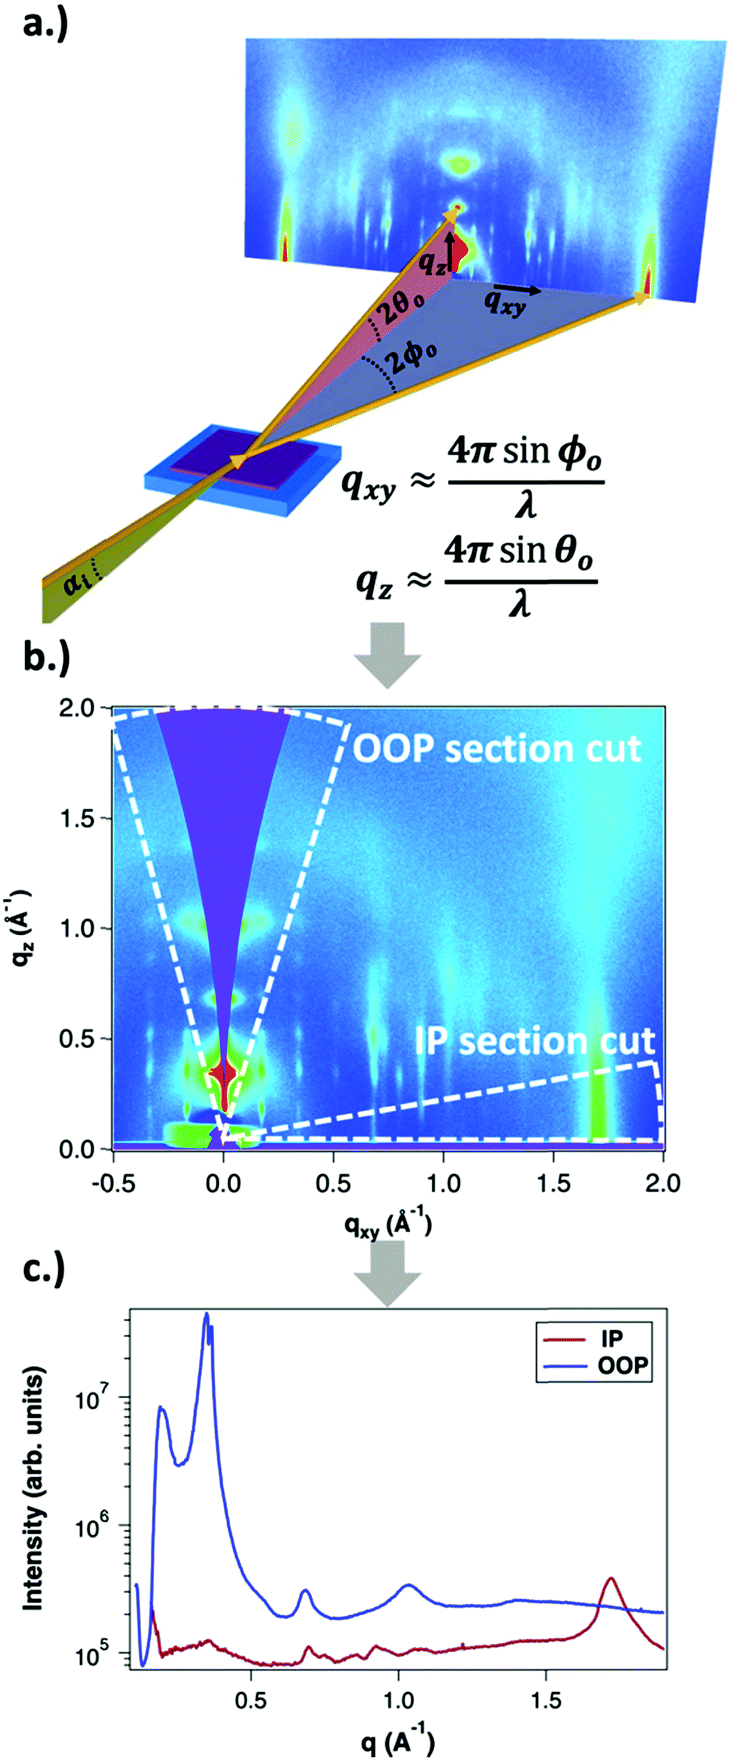 | ||
| Fig. 3 The steps of GIWAXS data processing: (a) data collection geometry with grazing incidence X-ray beam, (b) 2D data conversion to q-space, and (c) azimuthal integration across section cuts into 1D datasets. | ||
Obtaining the rDoC is very powerful when attempting to characterize the pure and mixed phase fractions in a BHJ film. As discussed earlier, the BHJ can be thought of as a film composed of three phases: pure donor, pure acceptor, and molecularly mixed donor and acceptor. The presence of crystallinity is an indicator of pure phase donor or acceptor, and distinction between donor and acceptor can usually be made from known GIWAXS patterns and different d-spacings for donor and acceptor. To elucidate the extent of mixing, GIWAXS can be performed on a series of films with compositions ranging from pure donor to pure acceptor. This methodology, shown in Fig. 4, is basically classic phase diagram determination. When tracking the intensity of a donor crystalline diffraction peak, a maximum value is expected for the pure donor film while a zero value is expected for a pure acceptor film. If there is no intermixing between donor and acceptor, then we expect the intensity to vary linearly with decreasing donor composition in the film. Fig. 4a depicts this relation. However, a negative deviation from this non-mixing linear behavior of peak intensity with composition indicates that the presence of acceptor molecules is disrupting the crystallinity of the donor. This disruption, depicted in Fig. 4b and c, is attributed to the conversion of pure crystalline donor phase to an amorphous non-scattering phase that may be mixed. The extent of negative deviation as a function of composition can therefore be used to provide a relative fraction of non-scattering phase within the BHJ at certain compositions. To determine whether this non-scattering phase is due to molecular mixing or pure amorphous phases, both the donor and acceptor intensity trends with composition must be analyzed together as discussed in the following paragraph.
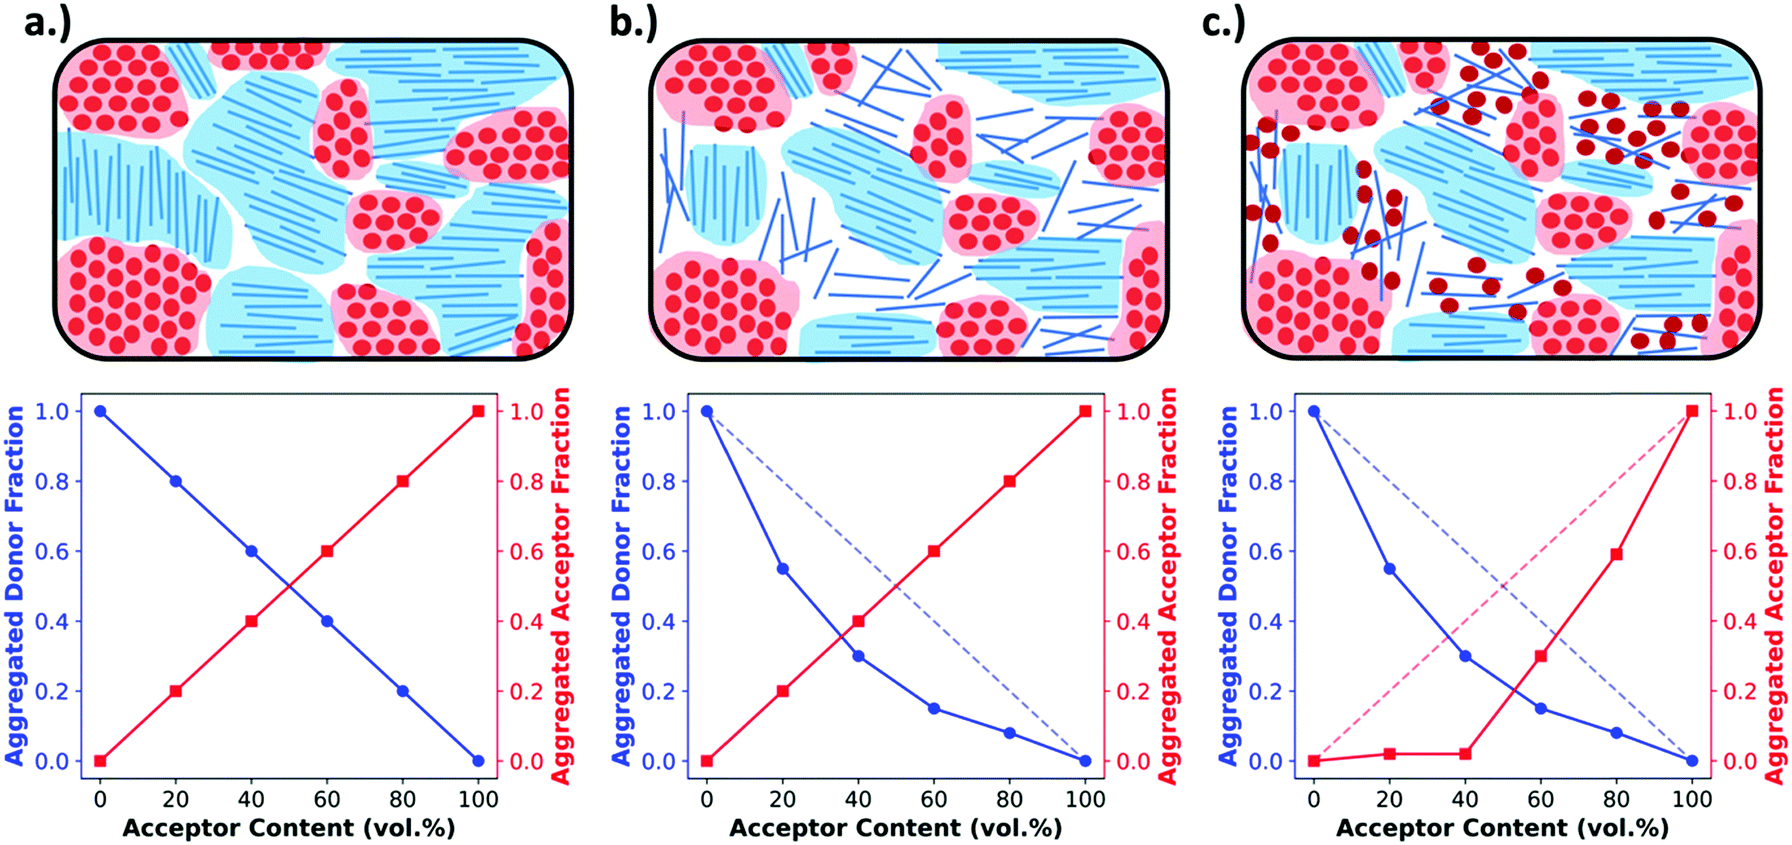 | ||
| Fig. 4 An example of morphologies (top) and the expected GIWAXS peak intensity plotted against acceptor content (bottom). Panel (a) shows an unmixed system composed completely of aggregated pure domains. In this case aggregated peak intensity follows a linear trend with composition. In (b) an unmixed system is shown with a portion of non-aggregated donor. This is reflected in the data by a negative deviation in the donor peak intensity but not in the acceptor peak intensity. Panel (c) shows a system with molecularly mixed phase causing negative deviations from the linear trend in both donor and acceptor aggregate diffraction peaks. | ||
This method has been shown to provide a very powerful analysis of the mixing behavior for donor–acceptor systems.6,7,17,18,26 However, there are some additional complexities that can arise when analyzing the data that is related to the semi-crystalline nature of the polymers and most small molecules, which are feature a significant amorphous fraction even in pure films.27,28 Because of this, different scenarios can be encountered that are not accounted for in the above description. In one scenario, the added acceptor molecules intermix with the already amorphous fraction of donor accounted for in the pure film. This results in a film containing mixed phase but still following the “donor non-mixing linear trend” as the donor crystalline fraction is undisturbed. To avoid mis-interpreting this data both donor and acceptor crystalline diffraction peaks are tracked so that the presence of aggregated acceptor along an acceptor non-mixing linear trend can rule out amorphous mixing at that composition. If the acceptor does not follow this trendline then two scenarios exist: the acceptor is molecularly mixing with the existing amorphous phase of the donor, or the acceptor remains un-mixed yet amorphous within the film. Fullerenes have a high propensity to aggregate in pure domains, so the former can be safely assumed. The opposite case may be encountered as shown in Fig. 4b where in the presence of acceptor, the donor is not fully aggregating, while the acceptor is following the linear trend. Here analysis is made simple in systems with PCBM as an acceptor because it strongly aggregates in a pure film. Therefore, since PCBM follows the linear trend, it must all be aggregated, and the donor simply exists in an amorphous but pure state.
Another complexity that can arise is the appearance of a positive deviation from the non-mixing linear trend. This occurs when the donor and acceptor are particularly immiscible, often quantified by a high Flory–Huggins interaction parameter. The immiscibility between the two species in solution can cause an increase in crystallinity compared to a pure film. Thus, an increase in integrated donor peak area is sometimes observed upon addition of a small amount of acceptor.18
As OPV research transitions to non-fullerene acceptors (NFAs) several new challenges arise in characterizing mixed phases using GIWAXS such as the lack of complete aggregation in pure acceptor films and the presence of overlapping donor and acceptor diffraction peaks. These add uncertainties into the GIWAXS analysis which can complicate the interpretation of the results. Because of this, supplementary techniques, which are discussed at the end of this article, may need to be used to strengthen data interpretation. Despite these challenges GIWAXS remains a powerful technique for quantitatively measuring mixed phase.
RSoXS
RSoXS is an X-ray scattering technique that can tune the contrast between different organic materials, making it particularly useful for studying multicomponent organic systems. This is achieved by varying the X-ray energy to change the complex index of refraction of a material, which affects the scattering in a molecularly dependent fashion. Near edge X-ray fine structure (NEXAFS) spectroscopy, an X-ray absorption spectroscopy technique, is used to find which X-ray energies to use. In NEXAFS, the absorption of X-rays is measured as a function of photon energy. The photon energy that maximizes the difference in optical constants between the donor and acceptor is determined through a calculated contrast function. This is shown in Fig. 5 and is described in more detail in the following paragraph. Peaks near an absorption edge, most commonly the carbon K-edge for organics, correspond to resonant electronic transition from occupied ground states to unoccupied higher energy states. The shape and position of these resonant peaks are sensitive to the type, orientation, and number of bonds an atom forms in specific molecules.29 Thus, different molecules with the same atoms but different local bonding environments generate characteristic NEXAFS profiles. Two techniques based on NEXAFS include scanning transmission X-ray microscopy (STXM) and RSoXS. STXM rasters an X-ray beam over a sample at an energy chosen based on the NEXAFS spectra and measures the absorption at each point, providing spatial composition maps. This is a powerful and widely used technique for studying organic materials; however, it is limited in spatial resolution to about 30 nanometers, there is significant risk of beam damage, and this produces 2D composition maps.30–32 These limitations led to the development of RSoXS, where resonant X-ray energies are used for X-ray scattering instead of X-ray spectro-microscopy and the above issues are mitigated.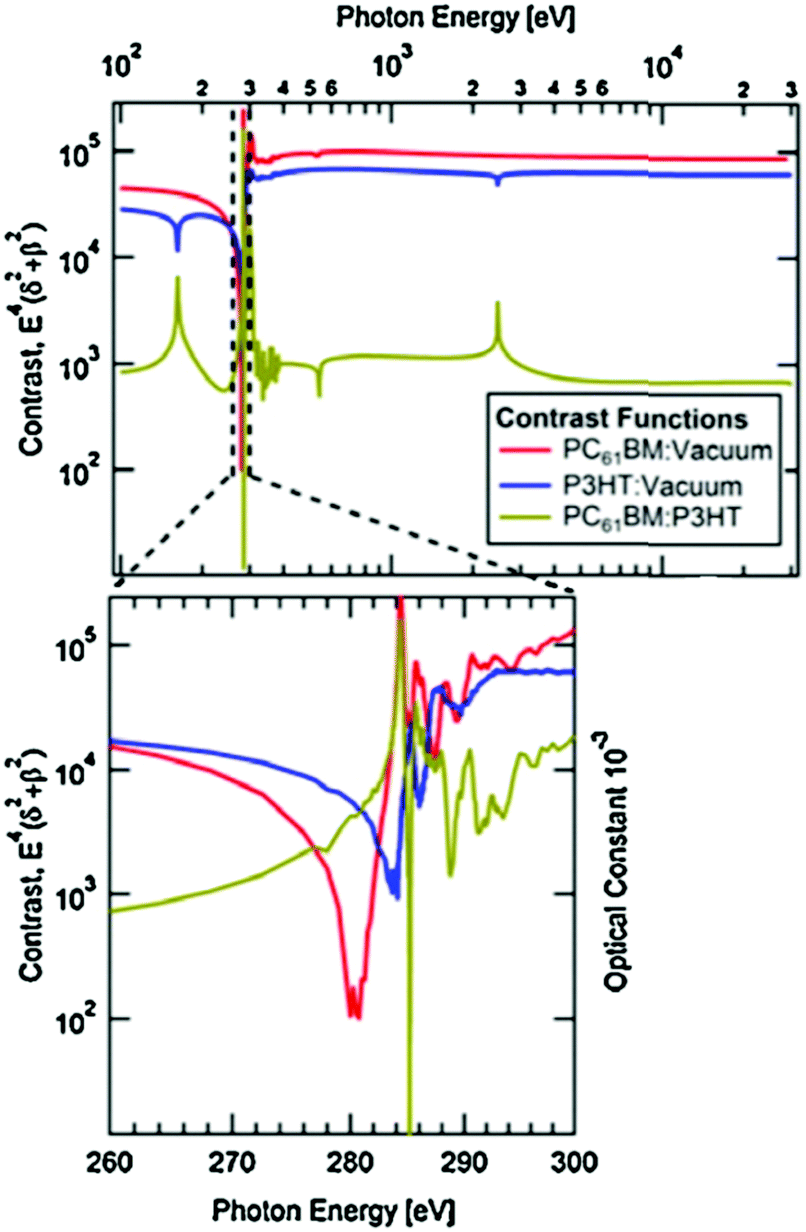 | ||
| Fig. 5 Calculated contrast functions, based on measured NEXAFS, plotted over a range of photon energies for the common P3HT:PC61BM OPV system. The contrast function is plotted for neat films of P3HT (blue) and of PC61BM (red). The difference between the two curves is plotted as gold and is the contrast function between the donor and acceptor. As shown in the expanded view around the carbon K-edge (284 eV), there is a peak in the donor/acceptor contrast by multiple orders of magnitude at ∼282 eV. Reprinted from J. Electron Spectrosc. Relat. Phenom., 2015, 200, Characterizing morphology in organic systems with resonant soft X-ray scattering, 2–14, Copyright 2015, with permission from Elsevier. | ||
Like other scattering techniques, RSoXS extracts statistical morphological information about a sample. It resolves features ranging from single nanometers up to hundreds of nanometers,29 covering the relevant domain sizes in OPVs. The strongest advantage of RSoXS is its ability to tune the contrast between different materials by changing the X-ray energy without requiring sample modification as shown in Fig. 5. At X-ray energies, the complex index of refraction for a material is conventionally written as ñ(E) = 1 − δ(E) + iβ(E), where E is photon energy and δ and β are optical constants related to dispersion and absorption, respectively.33β can be measured from NEXAFS and δ is calculated from β using the Kramers–Kronig relations.29,34,35 RSoXS most commonly uses a transmission geometry on thin film samples, with the incident beam perpendicular to the film. An area detector measures the scattered intensity, I(q), over q ranges from 0.001 nm−1 up to 0.1 nm−1. The measured intensity is proportional to the Fourier transform of the difference in ñ between the two points in the sample: I(q) ∝ |Δñ(q)|2 and Δñ(q) = F{Δñ(r)}, where r is the distance between two points and F{} is a Fourier transform. Therefore, composition variations in a sample at a given length scale determine the measured scattering intensity. For samples consisting of multiple components, a contrast function is usually defined as Cij(E) = E4|Δñij(E)|2 between components i and j. NEXAFS measures ñ(E) for each pure material to determine the energy that maximizes Cij(E) giving the best ability to distinguish two phases. As a result, RSoXS contrast for two different organic materials is often orders of magnitude greater than small angle X-ray scattering (SAXS), a closely related technique that relies on electron density differences for contrast.36 This enhanced contrast is why RSoXS is routinely used in the literature for OPV film characterization. Additionally, RSoXS can provide information on molecular orientation of a sample through use of polarized X-rays. The optical constants are strongly dependent on the orientation of the transition dipole moments of excitations with respect to the polarized X-rays.
A range of models are used to extract morphological information from the scattering intensity data. Quantitative analysis methods require the 2D detector data be reduced to 1D profiles by averaging over angular sectors around the beam center. The simplest analysis can be performed directly by looking at any shoulders or peaks in the 1D profile and assigning their q values to real space characteristic lengths. In OPVs, these features are most commonly used to estimate domain sizes in the BHJ, but this is often an oversimplification. More complex models may be used to determine the morphology more precisely. This often follows a forward simulation procedure, where morphologies are guessed and RSoXS patterns are simulated and compared with experiment and the model changed until they converge.29,37,38
Particularly relevant to the focus of this review in analyzing mixed phases in the BHJ; here Lorentz corrected profiles are used to measure relative composition. The multiplicative correction factor for Lorentz correction is proportional to q squared. This is performed by calculating the integrated scattering intensity (ISI) over a given q range, and since I(q) ∝ |Δñ(q)|2, 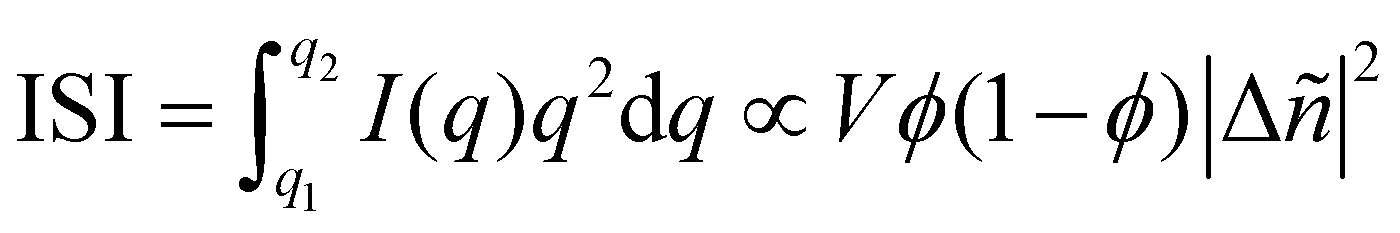 .29,39V is the scattering volume and ϕ is the volume fraction of one of the materials. If ISI is corrected for V and ϕ then it measures |Δñ|2, which is the average composition variation over the integrated spatial frequency range. Two pure phases in the same spatial frequency will maximize ISI while completely mixed phases will give ISI = 0. This is shown schematically in Fig. 6. Total scattering intensity (TSI) is also commonly measured and through Porod's invariant formalism can be expressed as
 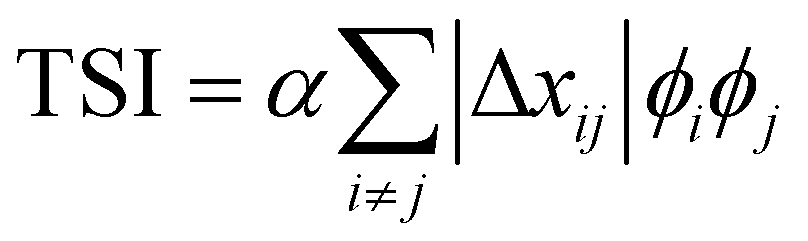 , where Δxij is the composition by mass difference between domains i and j, and ϕ again is the volume fraction of each domain. TSI in this form has been used to calculate the volume fractions of the of the pure and mixed phases in three-phase models as well as the composition of the mixed phase.8,10 In these blends, the volume fraction of one of the pure phases was previously calculated through STXM10 or DSC,8 and then the measured TSI for a series of samples was fit to the above equation to determine the remaining volume fractions and mixed phase composition. RSoXS is therefore an invaluable tool in characterizing OPVs and specifically in characterizing the mixed phase morphology.
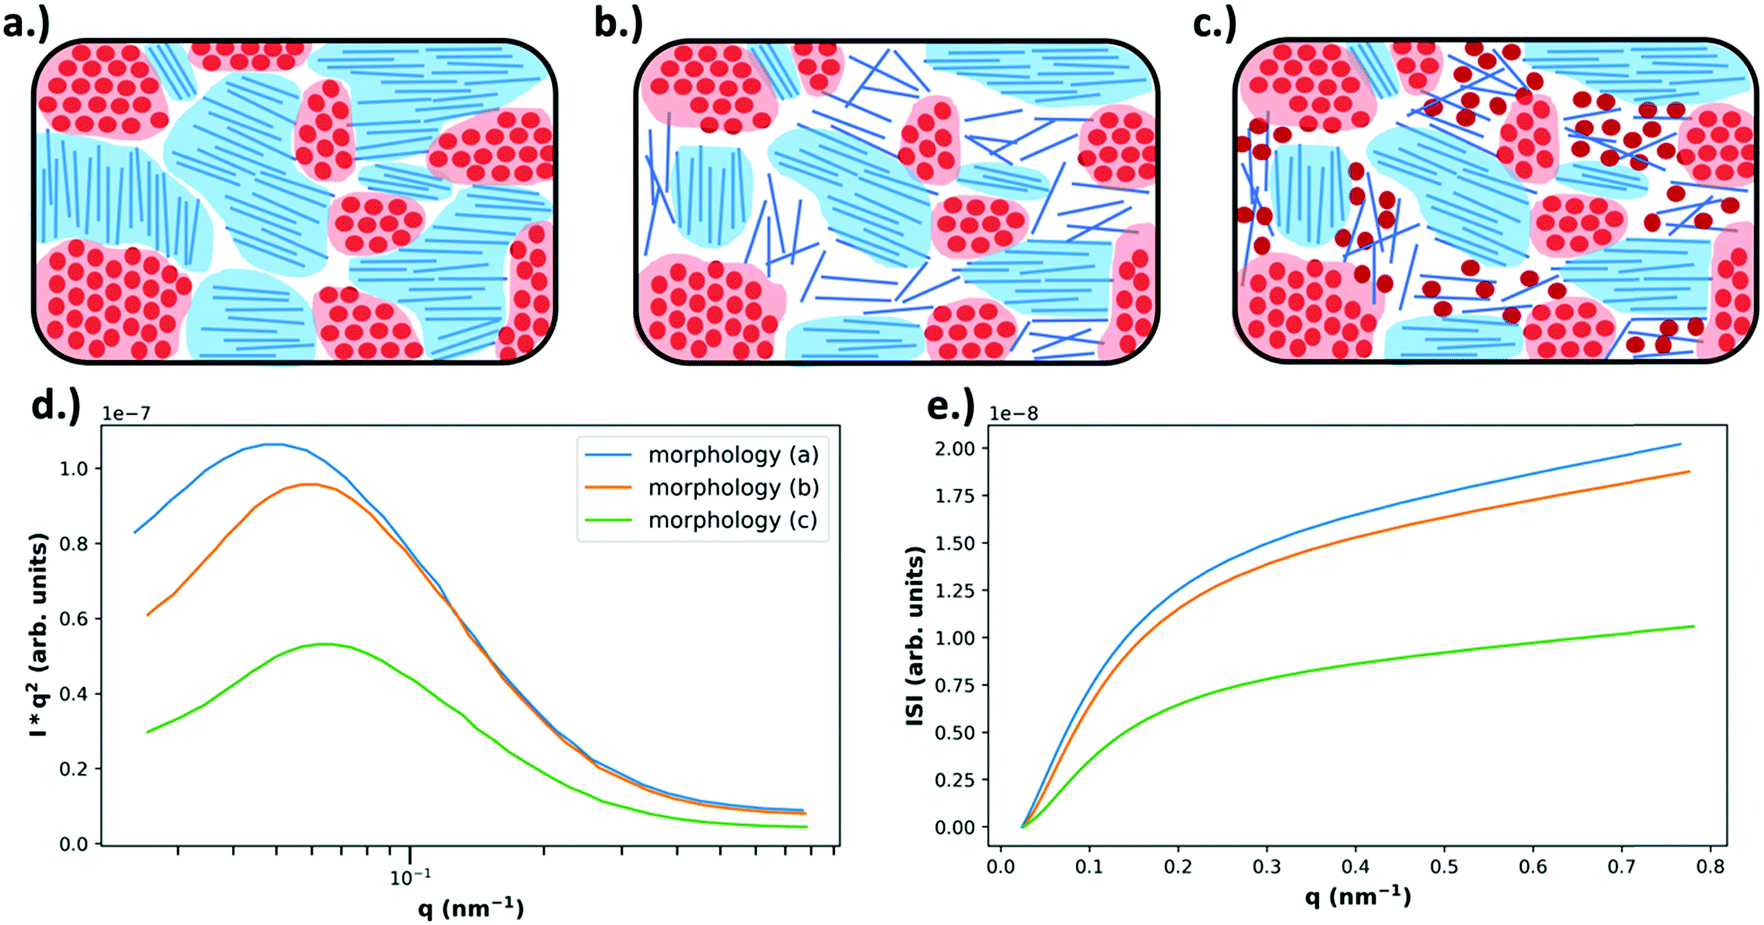 | ||
| Fig. 6 Example morphologies, from Fig. 4 (top), and the expected RSoXS data (bottom). As described in Fig. 4, in (a) there is no mixing and only pure, aggregated domains of acceptor or donor, in (b) there is no mixing but there is a pure donor amorphous fraction, and in (c) there is an amorphous molecularly mixed phase. In (d) the expected Lorentz corrected intensities are plotted for each of the above morphologies, where morphology (a) is expected to yield the most intense scattering due to being composed entirely of pure domains that maximize refractive index contrast. Morphology (b) is expected to display slightly less intense scattering than morphology (a) because, even though the domains are still pure, the amorphous donor domains have reduced density and therefore less intense scattering. Morphology (c) displays the lowest scattering intensity due to the large fraction of mixed phase which does not contribute to scattering. Additionally, due to smaller domain sizes present in morphologies (b) and (c) there is an expected peak shift to higher q. In (e) the integrated scattering intensities as a function of upper integration limit are plotted, calculated from the Lorentz corrected profiles. The ISI as shown is expected to be greatest for morphology (a) and the lowest for morphology (c). | ||
Though a very powerful technique for studying the morphology of BHJs, there are two very important limitations to consider when using RSoXS. One challenge is being able to deconvolute material contrast from orientation contrast.29,39 As mentioned earlier, the scattering intensity depends strongly on how the X-ray beam polarization aligns with the transition dipole moments (TDMs) in the sample. In BHJs, there is usually a local preferred molecular orientation within pure phases. The generality and importance of this limitation is an active area of research, but the presence of orientation contrast may limit the quantification of mixing using this method. Since orientation and material composition both affect the optical constants, scattering intensity is equally affected by both and is challenging to deconvolute. Forward simulations may provide the necessary insight to understand the morphological origins for anisotropic scattering.37,38 Another challenge is being able to definitively determine the domain purity.29 Since RSoXS is a global statistical measurement of the sample, measuring a low integrated scattering intensity (ISI) could indicate either a small volume fraction of pure domains or a large volume fraction of mixed domains. Despite these limitations, RSoXS has been widely used in characterizing OPVs and specifically in characterizing the mixed phase morphology.
SANS
Small angle neutron scattering (SANS) has also been used to characterize the extent of mixing in BHJs.22–24,40–42 In SANS, neutrons instead of X-rays are used to probe samples. Therefore, contrast in neutron scattering arises from nuclear interactions instead of electronic interactions as for X-ray scattering. Advantages of neutrons over X-rays include a greatly reduced possibility for beam damage, since neutrons interact more weakly with the sample, and the ability to tune contrast via deuteration of samples.41,43 SANS is more commonly performed using a transmission geometry, though a grazing incidence geometry (GISANS) has also been used and poses the advantages of increased scattering volume and potentially vertical composition characterization.40 Additionally, there have been studies where time-of-flight GISANS (TOF-GISANS) was used to generate GISANS patterns for multiple neutron wavelengths simultaneously in a single measurement.41–43 By using multiple neutron wavelengths, different scattering depths and a wide q-range can be probed.43 For extracting morphological information from scattering patterns, a wide range of models have been developed. Neutron scattering experiments in the field of OPVs have been used to estimate domain interface morphology, volume fractions of pure phases present, domain sizes, domain spacings, and, importantly for this paper, the miscibility of the different phases.23,24,41,42,44Various qualitative and quantitative methods have emerged to achieve these results. A qualitative method was first demonstrated by Yin and Dadmun22 where calculated Porod exponents were used to describe the domain interface morphology. The Porod exponent is related the surface fractal dimension and can indicate smooth and sharp interfaces or rough and broad interfaces.22 Rougher interfaces were interpreted to imply more mixing between domains, and thus the Porod exponent was used as a metric to qualitatively compare the extent of mixing. A more quantitative approach has been demonstrated by Chen et al.23 and Lan et al.24 and also relies on Porod analysis. In this analysis, the volume fractions for the different phases and the correlation lengths must be approximated first. These values can be extracted directly from the SANS data,44 though other techniques to estimate volume fractions like DSC23 may be necessary. Porod analysis can then be used to determine the scattering length density contrast between two phases, which in turn can be used to calculate the miscibility between the two phases.23 An approach using GISANS to determine miscibility has also been demonstrated by both Ruderer et al.41 and Wang et al.42 in PCBM:P3HT blends. Here, both vertical and horizontal line cuts in the 2D patterns are analyzed. The scattering intensity in the vertical direction contains the so-called Yoneda peak, which is located at the critical angle of a material and is therefore material sensitive41,42 In order to fit the Yoneda peak position in the vertical line cut, the scattering length density (SLD) of the mixture is modified by changing the miscibility of the P3HT-rich phase in the mixture. The miscibility is determined when the fit agrees with the data.
These methods have been demonstrated thus far only in fullerene-based systems, although SANS will likely be a valuable technique in non-fullerene acceptor-based systems due to the ability for contrast to be tuned via partial deuteration. In the case of BHJs, the acceptor or donor could be deuterated prior to sample preparation, providing sufficient contrast to perform SANS (Table 1).
| Probe source | Geometry | Probed length-scale | Contrast | Information gained | |
|---|---|---|---|---|---|
| GIWAXS | Hard synchrotron X-rays (>8 keV) | Reflection | 0.1 nm to ∼5 nm | Unique diffraction peaks | • d-Spacings |
| • Crystalline fraction | |||||
| • Crystalline correlation length | |||||
| • Preferred crystallite orientation | |||||
| RSoXS | Soft synchrotron X-rays (∼100 eV to ∼2 keV) | Transmission | ∼1 nm to ∼100 nm | Energy dependence of the refractive index | • Domain size |
| • Domain purity | |||||
| • Phase volume fraction | |||||
| • Preferred domain orientation | |||||
| SANS | Neutrons from spallation or reactor source (≥3 meV) | Transmission or reflection | ∼1 nm to ∼100 nm | Scattering length density | • Domain size |
| • Domain purity | |||||
| • Phase volume fraction |
Mixed phase reports
Polymer:fullerene systems
Polymer:fullerene devices have been a primary focus of the OPV community since the introduction of bulk heterojunction architectures by Yu et al.45 However, the devices were thought to be composed of two pure non-mixing phases up until about 2010 when X-ray scattering and other techniques were used to identify mixed phases. Interestingly, GIWAXS studies46,47 found some popular donor polymers such as PBTTT actually formed a co-crystal with PCBM. This was revealed through the appearance of an increase in lamellar d-spacings in mixed films compared to pure polymer. Mixing was also found via other characterization methods in polymers such as P3HT which are unable to form co-crystals due to high side chain density or backbone disorder.47,48 Mixed phases in these cases were attributed instead to amorphous miscibility between the donor and acceptor molecules. Amorphous mixing has been observed more commonly than co-crystals in modern high performing BHJs.5–7 These studies established that mixed phases in polymer:fullerene systems are relatively common across many materials systems. Thus, it became important to quantify how much of OPV BHJs are composed of this mixed phase and ultimately the effects of varying amounts of mixed phase on the OPV device performance.One of the first studies to quantify the mixed phase in a polymer:fullerene system was Bartelt et al.7 Here the authors used the GIWAXS method previously described on several films with varying ratios of PBDTTPD and PC61BM. As shown in Fig. 8, the PC61BM scattering intensity remained constant up to 20–30 wt% fullerene suggesting that fullerene was miscible with PBDTTPD domains up to that concentration. After which, a linear trend is observed consistent with the formation of PC61BM pure phases. Bartelt and collaborators additionally studied samples that had been annealed for 90 hours at various temperatures. The large PBDTTPD rich domains formed by this annealing step allowed them to use a more efficient NEXAFS method49 for quantifying fullerene intercalation requiring only a single film. In this method, a focused X-ray beam was used to take NEXAFS spectra of a single donor rich domain which was then fit to a linear combination of neat PBDTTPD and PC61BM spectra. It should be noted that the NEXAFS method suffers from poor spatial resolution requiring domains >100 nm in diameter and assumes a constant composition across the entire domain. Therefore, it underestimates the composition of mixed phases that occur primarily at domain interfaces. Despite these pitfalls, the NEXAFS results were able to definitively show a decreasing amount of fullerene penetration into donor domains with increasing annealing temperature. This suggests that the fullerenes are kinetically trapped in PBDTTPD domains and diffuse out when given enough thermal energy. As the fullerene content decreased due to annealing so did the external quantum efficiency, and therefore the performance of devices. The lack of fullerene percolation in annealed samples is thought to cause “morphological traps” preventing electrons from escaping isolated fullerene domains.11
Interestingly a later study by Savikhin et al.6 showed negligible mixing in the as-cast PBDTTPD:PC71BM system in contrast to Bartelt et al.7 as shown in Fig. 8, suggesting the importance of fullerene choice and processing conditions. This study also used the GIWAXS method to investigate several different branched and linear side chains attached to a PBDTTPD backbone. Molecular structures are shown in Fig. 7. It was found that long linear side chains promoted mixing, but branched side chains like those in the parent PBDTTPD structure resulted in negligible mixing demonstrated by the PC71BM aggregate peak intensity following a linear trend with composition. It should be noted that in this study a solvent additive of 5 vol% 1-chloronaphthalene (CN) in chlorobenzene was used as opposed to neat chlorobenzene in the Bartelt et al. study.7 Therefore, the slower solvent evaporation rate due to low vapor pressure of CN combined with differing miscibility of PC71BM may cause a similar effect on mixed phases as annealing, allowing the fullerene to diffuse out of polymer domains and self-aggregate.50 Further evidence of kinetic trapping of fullerene in polymer domains was found in the GIWAXS intensity plots of the side chain combinations that were more miscible with PC71BM. Instead of remaining constant then increasing linearly at a miscibility limit as seen in previous literature,7 the fullerene peak intensity for these systems initially increased at a shallow slope before hitting the miscibility limit. This initial shallow slope suggests that CN is acting to allow some PC71BM to leave polymer domains as the primary solvent evaporates and the miscibility decreases.
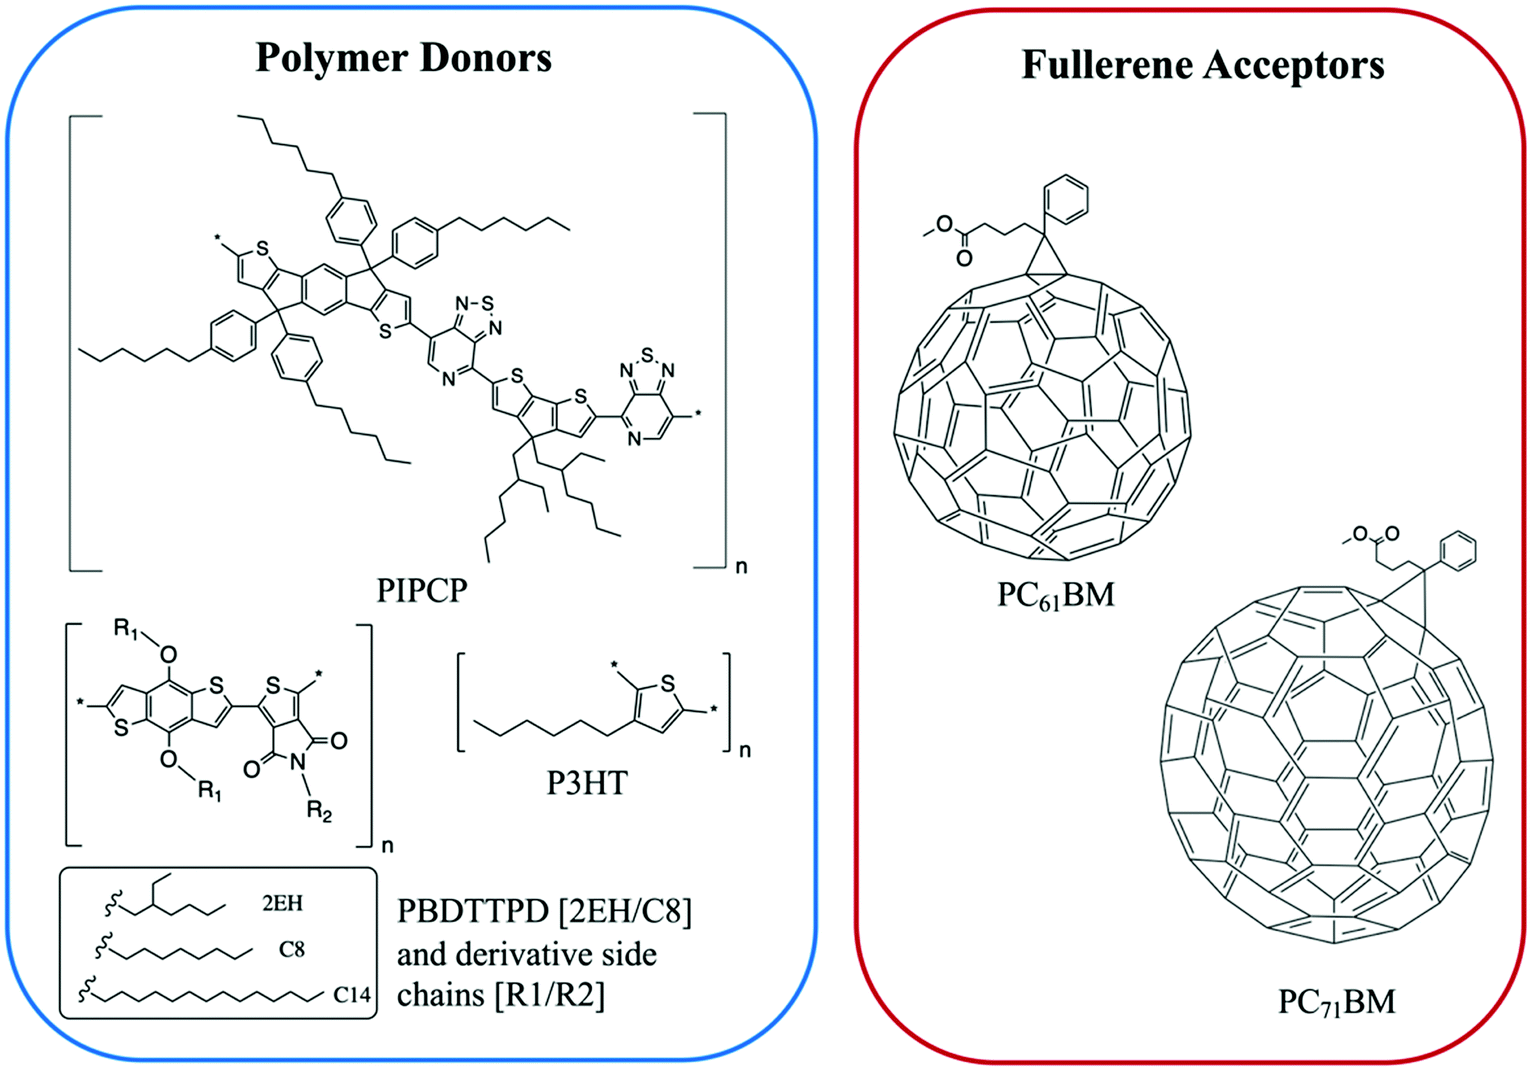 | ||
| Fig. 7 The chemical structures of the polymer donors and fullerene acceptors discussed in this section. | ||
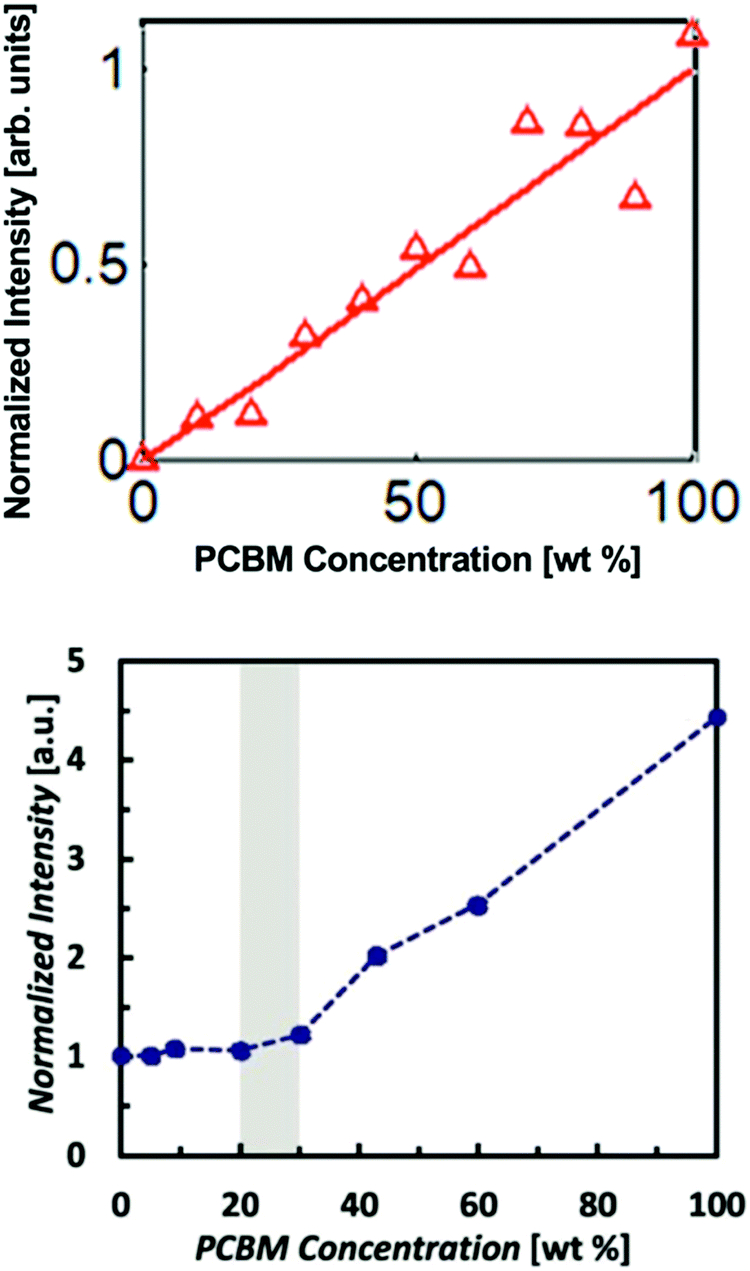 | ||
| Fig. 8 Fullerene aggregate peak intensity against composition from GIWAXS mixing analysis on PBDTTPD:fullerene mixtures. No mixed phase was found in one study depositing with CN solvent additive (top) and evidence of mixed phase was found in another study depositing with neat chlorobenzene (bottom). (top) Reprinted with permission from V. Savikhin, M. Babics, M. Neophytou, S. Liu, S. D. Oosterhout, H. Yan, X. Gu, P. M. Beaujuge and M. F. Toney, Chem. Mater., 2018, 30, 7872–7884. Copyright 2018. American Chemical Society. (bottom) Reprinted from Adv. Energy Mater., 3, J. A. Bartelt, Z. M. Beiley, E. T. Hoke, W. R. Mateker, J. D. Douglas, B. A. Collins, J. R. Tumbleston, K. R. Graham, A. Amassian, H. Ade, J. M. J. Fréchet, M. F. Toney and M. D. McGehee, The Importance of Fullerene Percolation in the Mixed Regions of Polymer–Fullerene Bulk Heterojunction Solar Cells Charge Generation and Recombination in an Organic Solar Cell with Low Energetic Offsets, Adv. Energy Mater., 2013, 3, 364–374, Copyright 2013, with permission from John Wiley and Sons. | ||
Expanding to a different polymer:fullerene system, Huang et al.18 investigated mixing in PIPCP:PC61BM. PIPCP is a polymer with a more rigid backbone and higher density of side chains than the previously discussed PBDTTPD as shown in Fig. 7. Utilizing the same GIWAXS method on samples of varying concentration, an interesting trend of increased PIPCP crystallization with small additions of PC61BM was found with a maximum peak intensity around 30% PIPCP shown in Fig. 9. Combined with the PC61BM peak displaying a linear trend across all compositions, Huang et al. were able to conclude that PC61BM addition surprisingly induces crystallization in PIPCP. It is suggested that the improved backbone ordering of PIPCP leads to reduced recombination and therefore improved fill factors observed in this system. However, without analyzing charge carrier dynamics in conjunction with morphology changes, it is difficult to definitively make conclusions regarding the effects of mixed phases on OPV operation.
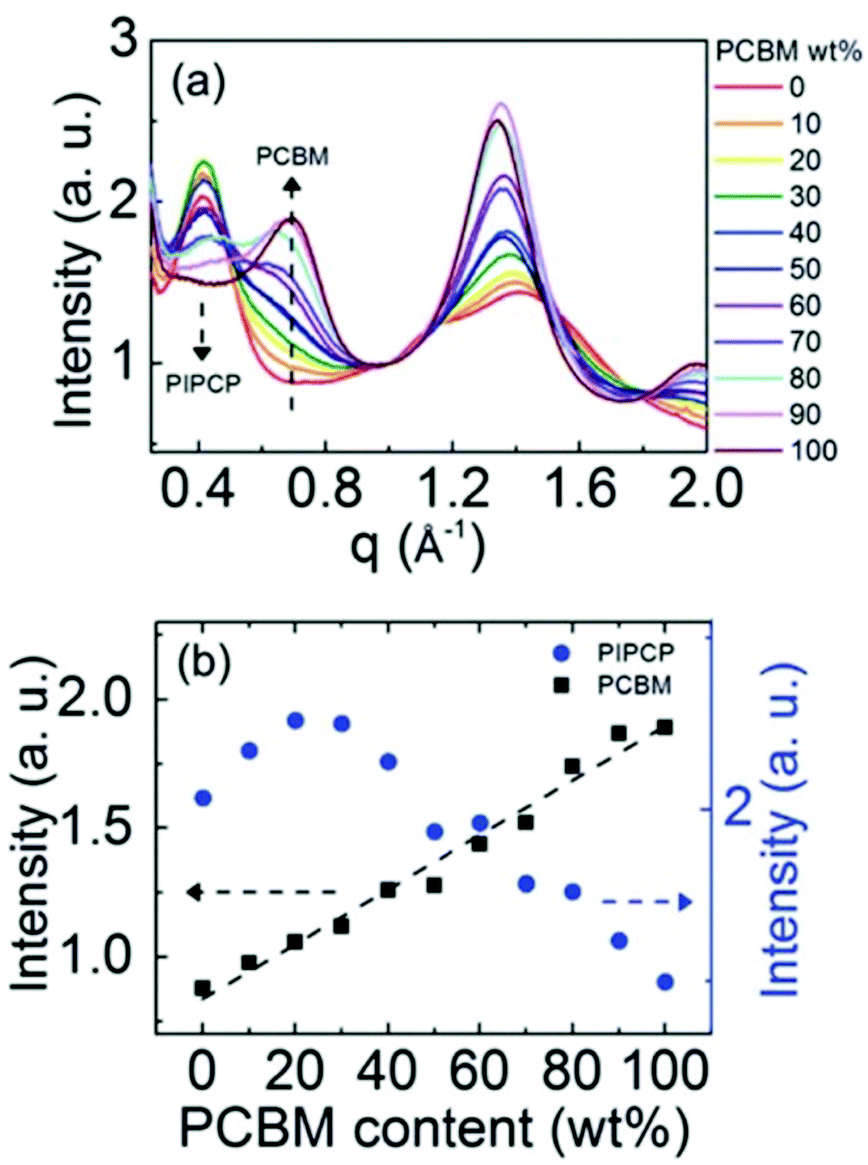 | ||
| Fig. 9 GIWAXS evidence that the addition of an acceptor inducing increased crystallinity in the donor. (a) shows the azimuthally integrated GIWAXS intensities across several compositions and (b) shows the PIPCP and PCBM peak intensities across composition. The positive deviation from the linear trend in aggregated PIPCP intensity suggests the acceptor induced crystallinity in the donor. Reproduced from ref. 19 with permission from the Royal Society of Chemistry. | ||
Direct connection between the three-phase morphology and charge carrier dynamics was achieved in a recent study by Ferron et al.8 Here, UV-vis, photoluminescence quenching (PLQ) and time-delayed collection field (TDCF) measurements51 were taken on a set of P3HT:PC61BM films with 5–50 wt% PC61BM to investigate photocurrent losses. UV-vis and PLQ measurements showed that photon absorption and CT state formation efficiencies were unchanged across different film compositions despite the drastic differences in power conversion efficiency. TDCF measurements revealed an increase in CT state splitting efficiency with increasing PC61BM concentration. Additionally, bimolecular recombination was shown to be the dominating recombination pathway, and the recombination rate constant was found to be 16 times lower in 50 wt% PC61BM films compared to 5 wt% PC61BM films. The researchers then used a variety of techniques to quantify the three-phase morphology and tie the effects of domain mixing to performance. GIWAXS was initially used and surprisingly showed no mixing in contrast to evidence from previous studies.47 It is possible the GIWAXS measurements were unable to accurately detect the fullerene peak because it was obscured by the amorphous background from P3HT. However, using known crystallinity values of P3HT by DSC28 and known film compositions the researchers were able to fit the total scattering intensity (TSI) from RSoXS to a model to reveal volume fractions of pure donor, pure acceptor, and mixed phases as well as the mixed phase composition as shown in Fig. 10. This analysis had been previously used successfully to demonstrate mixed phase in PTB7:PC71BM films.21 In the P3HT:PC61BM system the TSI analysis produced the more expected result of an initial two-phase system composed of pure polymer and mixed polymer-donor phases that reaches a miscibility limit at ∼8 wt% above which pure PC61BM phase forms decreasing the relative amount of mixed phase. The concurrent increase in PC61BM aggregated phase and decrease in mixed phase agrees with an increase in charge separation and extraction efficiencies. It is suggested that the decrease in interfacial mixed phase width leads to these increased efficiencies by removing recombination sites, but the growth of aggregated fullerene phase may also play a role as these domains have been shown to decrease triplet state recombination.52
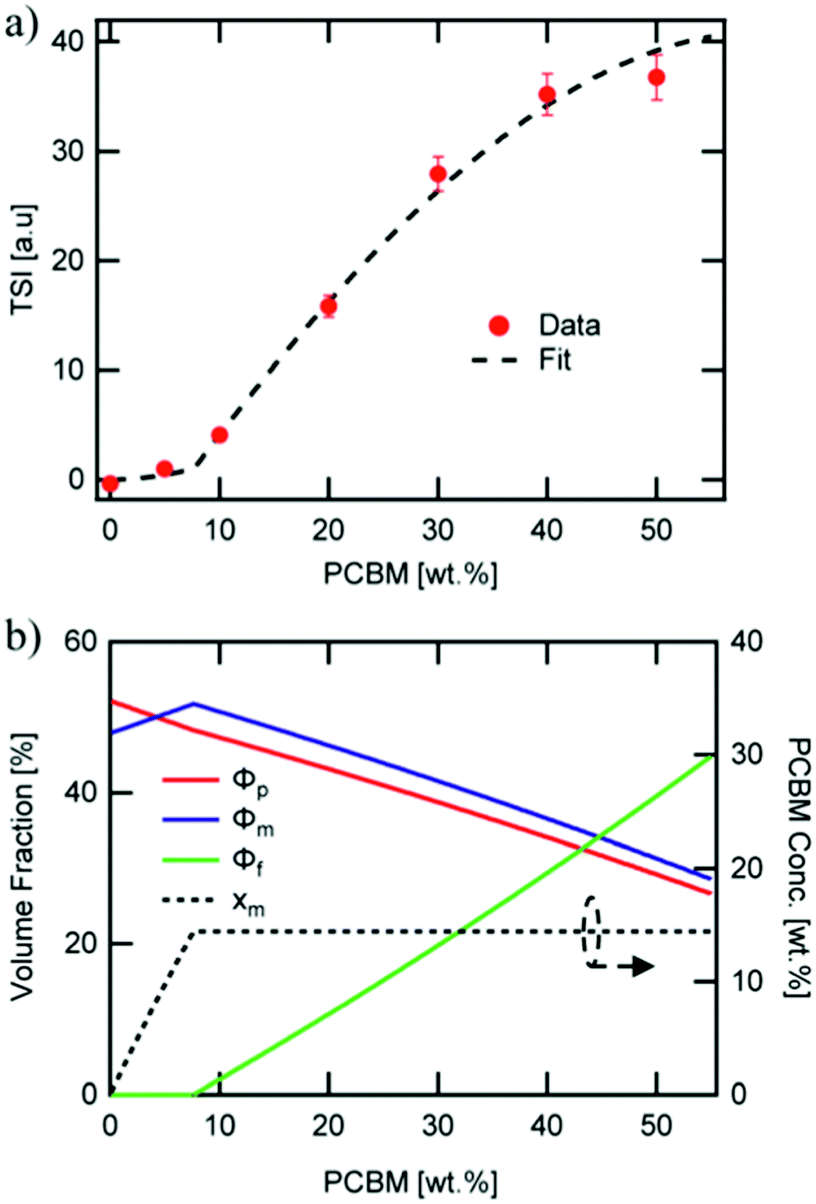 | ||
| Fig. 10 RSoXS analysis of mixing in P3HT:PC61BM system. (a) shows the fit of TSI to a model which produced volume fractions of the three phase system shown in (b). A clear miscibility limit is seen at ∼8 wt% PCBM after which fullerene aggregate begins to appear. Reproduced from ref. 8 with permission from the Royal Society of Chemistry. | ||
Small molecule:fullerene systems
Small molecule (SM) electron donors possess certain advantages over polymer donors. They do not suffer from difficult control of polydispersity and molecular weight and are generally easier to purify after synthesis.10 SM donors generally tend to form highly pure and crystalline aggregates in films compared to polymers because of their uniformity and purity. Generally, in bulk heterojunctions it has been found that these systems mix less than polymer systems due to the stronger self-aggregation. However, similar to polymer systems, the extent of mixing between small molecule donors and fullerenes have been found to depend strongly on the small molecule chemistries and processing conditions.9,10,17,24,26,53 Thus, there has not been a clear consensus on the optimum mixing morphology. Some argue that SM systems must possess a mixed phase because of the lack of tie chains interconnecting domains,10,24 while others have found good performance in unmixed SM systems.9,17,26,53 Here, we review investigations that have characterized the mixing behavior of various SM:fullerene systems and its ultimate effects on device performance.Mukherjee et al.9 was one of the first studies to quantitatively analyze the purity and volume fractions of different phases within SM:fullerene BHJs. They used a range of annealing temperatures as well as an optimized amount of DIO53 to alter the mixing behavior of p-DTS(FBTTh2)2:PC71BM BHJ films and employed X-ray scattering techniques to probe morphology and relate this to device performance. First GIWAXS was performed, and the crystalline coherence lengths were extracted from π–π and lamella diffraction peaks on each film. These crystalline coherence lengths were used as a rough approximation of the pure SM donor phase domain size which was found to increase with annealing temperature. This is consistent with initially kinetically trapped domains seen previously in polymer systems.6,7,50 Additionally, RSoXS measurements revealed four distinct characteristic length scales present in all films. A component scattering intensity (CSI) analysis, which followed the same procedure as the integrated scattering intensity analysis mentioned in the introduction, was also performed for each length scale to reveal the relative purity. Through this analysis Mukherjee et al. were able to correlate the dominant length scale from RSoXS to higher purity domains of donor and acceptor while the two other length scales were attributed to mixed phase and the fourth was not analyzed due to low RSoXS intensity and very large length scales. The high purity phase length scale showed an increase in characteristic size with annealing temperature agreeing with the trend in coherence lengths found from GIWAXS. The average composition variation, found through CSI analysis, loosely increased with annealing temperature and was very high for the film cast with 0.4% DIO additive. This suggests that annealing, and solvent additives can result in films with larger and more compositionally pure domains. The average composition variation values also showed strong correlation with device performance; voltage dependent geminate recombination was strongly suppressed in samples with high average composition variation values resulting in larger fill factors shown in Fig. 12. Thus, a reduction in the amount of mixed phase achieved through annealing or solvent additives may be beneficial in this system. It is suggested that a thin mixed phase bordered by pure domains results in energy cascades promoting CT state separation. These conclusions were further supported in another study by Mukherjee et al. where the amount of DIO additive was altered in p-DTS(FBTTh2)2:PC71BM devices.53 Using the same RSoXS analysis they found that the highest performing device was also the device with the highest domain purity values.
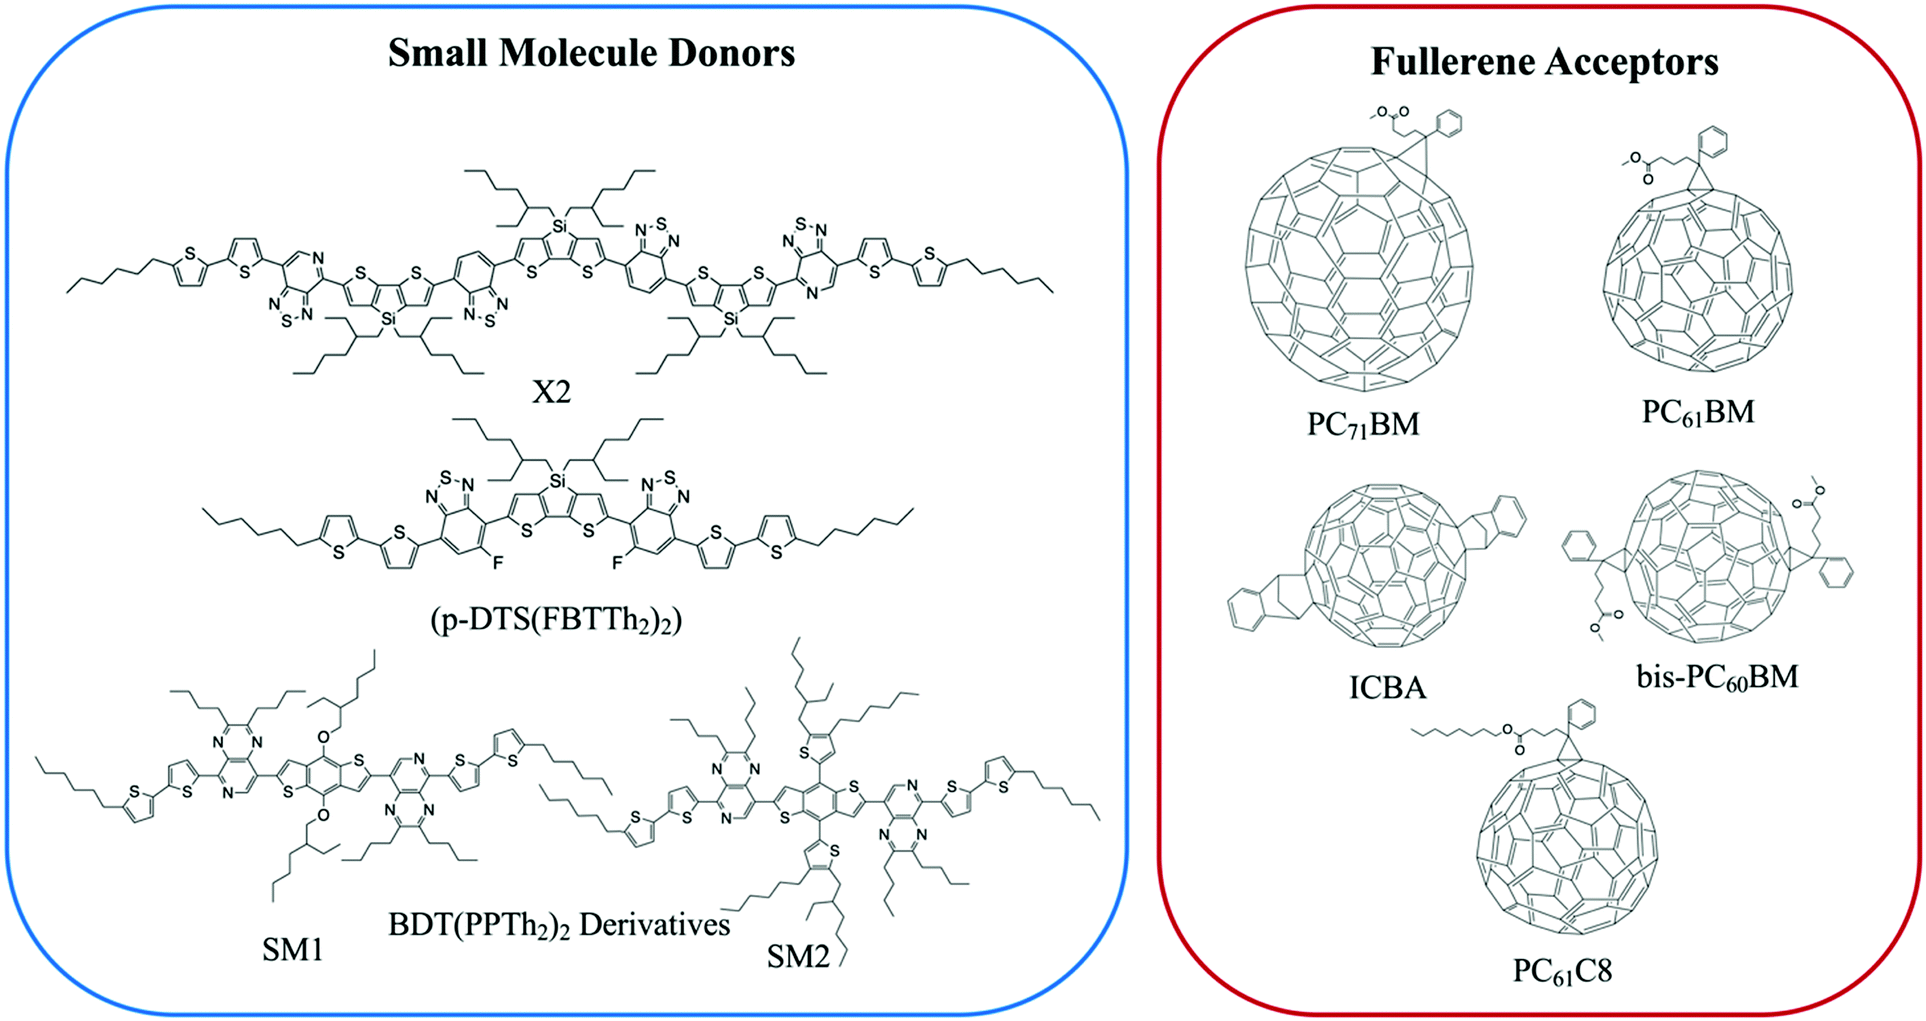 | ||
| Fig. 11 Chemical structures of the small molecule donors and fullerene acceptors discussed in this section. | ||
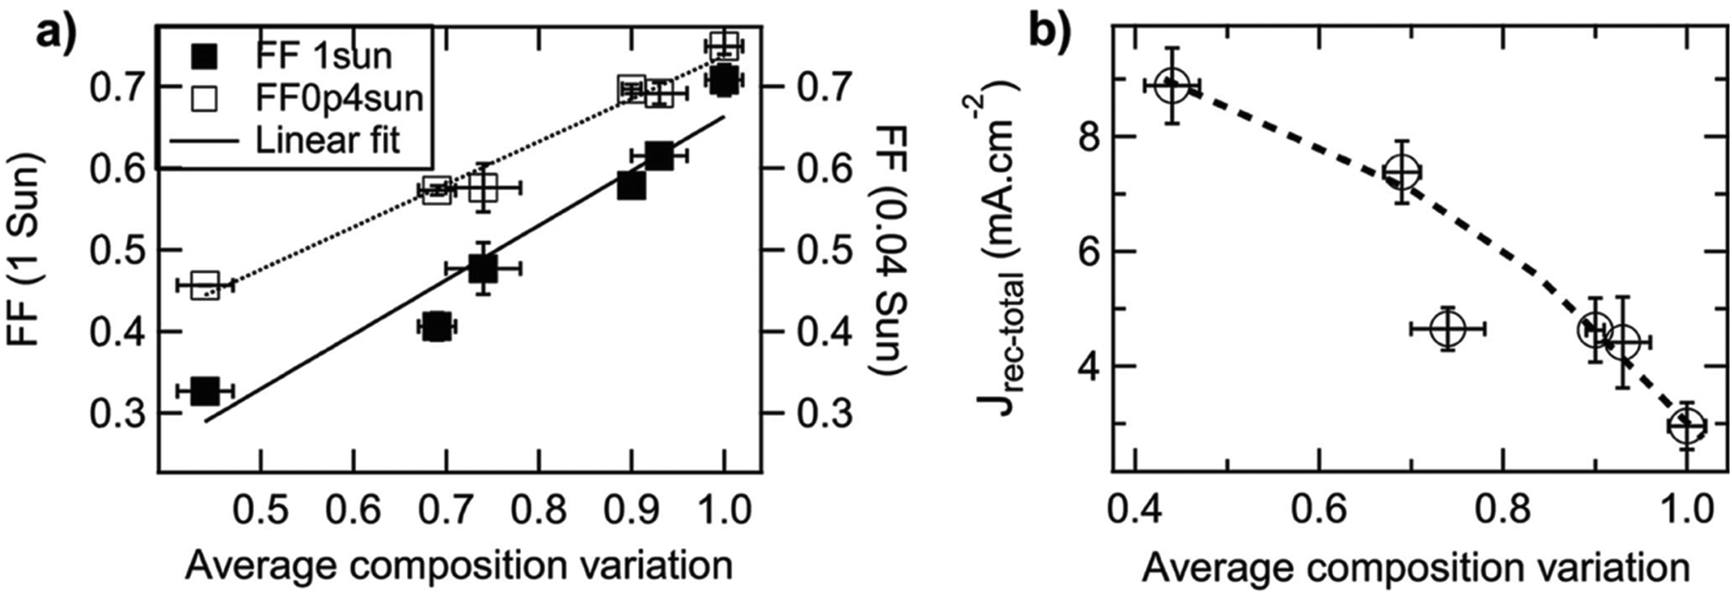 | ||
| Fig. 12 Correlation of fill factor and recombination current with calculated composition variation (i.e. domain purity) for a set of samples with different annealing temperatures and, resultingly, different domain purities. In (a) the fill factor (measured at 1 and 0.04 sun illumination) is shown to monotonically increase with domain purity. In (b) the recombination current, calculated from the difference between photocurrent at large reverse and the photocurrent at the maximum power point at 1 sun illumination, is shown to monotonically decrease with domain purity. Both of these findings support the argument that increasing domain purity correlates with improved device performance. Reprinted from Adv. Energy Mater., 2015, 5, S. Mukherjee, C. M. Proctor, G. C. Bazan, T.-Q. Nguyen and H. Ade, Significance of Average Domain Purity and Mixed Domains on the Photovoltaic Performance of High-Efficiency Solution-Processed Small-Molecule BHJ Solar Cells, 1500877, Copyright 2015, with permission from John Wiley and Sons. | ||
Lan et al.24 also studied the same small molecule donor p-DTS(FBTTh2)2, but here they varied which fullerene derivative was used as the electron acceptor to modify mixing behavior. The fullerene derivatives used were PC71BM, bis-PC60BM, and ICBA. These molecular structures are shown in Fig. 11. Bis-PC60BM and ICBA were chosen because of their shallower lowest unoccupied molecular orbital (LUMO) energy levels as well as demonstrated different miscibility with P3HT.54 To study the morphology changes with different fullerenes, neutron reflectometry and small angle neutron scattering (SANS) were used to probe the depth profile and domain size/purity, respectively.24 Neutron reflectometry measurements showed higher fullerene content at the air interface which would facilitate charge extraction to the cathode, while the donor was found to be more concentrated at the silicon surface which would be the anode side in a conventional device. SANS was then used to study the morphology of domains within the film. SANS contrast arises from the scattering length density (SLD) of different materials. In these systems, there is a significant difference in SLD between the aggregated fullerenes and their surrounding SM donor matrix. However, there is poor contrast between the crystalline donor and the mixed donor–acceptor regions. Therefore, the SANS data enabled extraction of the size, polydispersity of sizes, and volume fraction of aggregated fullerene domains and is shown in Fig. 13. Using this information combined with known blend ratios, the authors calculated the volume fraction of fullerene that was mixed in the donor molecule to give an estimation for the miscibility. The pure PCBM was found to the be most miscible with p-DTS(FBTTh2)2 in this calculation, while bis-PC61BM and ICBA exhibited higher purity p-DTS(FBTTh2)2 phases. GIWAXS showed that the p-DTS(FBTTh2)2 crystal structure is largely unaffected by fullerene choice indicating that mixed regions are amorphous and not co-crystals. By choosing reasonable percent crystallinities of the SM in the blend, they recalculated the fullerene miscibility in the amorphous SM. Though the actual percent crystallinity was unknown, the GIWAXS data supported that there is the same amount of crystallinity in each sample. These calculations confirmed the increased miscibility of PC71BM with p-DTS(FBTTh2)2 compared to bis-PC61BM and ICBA. Relating this morphology to device performance, the authors showed that the bis-PC61BM and ICBA films have higher Voc values, attributed to their higher LUMO levels. However, they exhibited lower overall efficiencies than PC61BM due to recombination losses. The authors concluded that in this case the increased miscibility of PC61BM with p-DTS(FBTTh2)2 resulted in mixed interfacial phases that increased domain connectivity and improved charge extraction efficiencies. Therefore, it is likely that the highest performing films in previous studies by Mukherjee and colleagues9,53 possessed enough mixed phase to connect the aggregated domains and enable charge extraction.
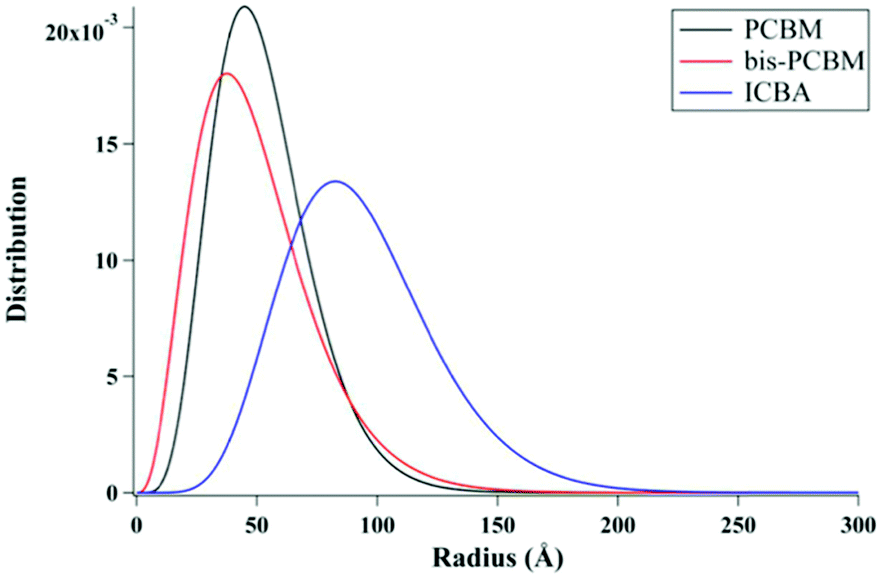 | ||
| Fig. 13 Fullerene domain size distributions based on a Schulz sphere model fit to SANS data of p-DTS(FBTTh2)2 films with different fullerene acceptors. This analysis was also used to extract the fullerene aggregates volume fraction in the whole film, the scattering length density of the small molecule donor, and the fullerene volume fraction within the donor-rich phase. From these extracted values, estimates for the total miscibility of fullerene into the donor were made. Reprinted with permission from S. Lan, H. Yang, G. Zhang, X. Wu, W. Ning, S. Wang, H. Chen and T. Guo, J. Phys. Chem. C, 2016, 120, 21317–21324. Copyright 2016 American Chemical Society. | ||
In two later studies by Oosterhout et al.,17,26 a different small molecule system, X2:PC61BM, was studied utilizing the GIWAXS degree of mixing methodology mentioned in the introduction.17,26 The X2:PC61BM system was chosen because of the unique property that it retains its maximum PCE of 6% over a wide range of PC61BM concentrations. In the first study,26 a set of X2:PC61BM samples were prepared under the same conditions with varying PC61BM content from 0 to 100%. GIWAXS was performed on each film and aggregated X2 and PC61BM peak intensities were plotted against film composition. There is negligible mixing as indicated by the PC61BM peak intensity fitting well to a linear combination fit. Yet, there is a dip in X2 peak intensity below the linear fit which is attributed to pure but amorphous phase at higher PC61BM content. Importantly, if pure PC61BM was partly amorphous then it would be unclear if the amorphous X2 is mixed or pure. However, since fullerenes possess a characteristic nearest neighbor geometry and spacing in neat films, this is unlikely. The robustness of the PCE across films with different PC61BM contents is attributed to a lack of a mixed phase which, when present, would vary in volume fraction and composition with different PC61BM content. Importantly, the authors found that a minimum amount of at least 30 vol% of aggregated donor or acceptor is a requirement in efficient SM:fullerene devices, in agreement with other systems.55,56
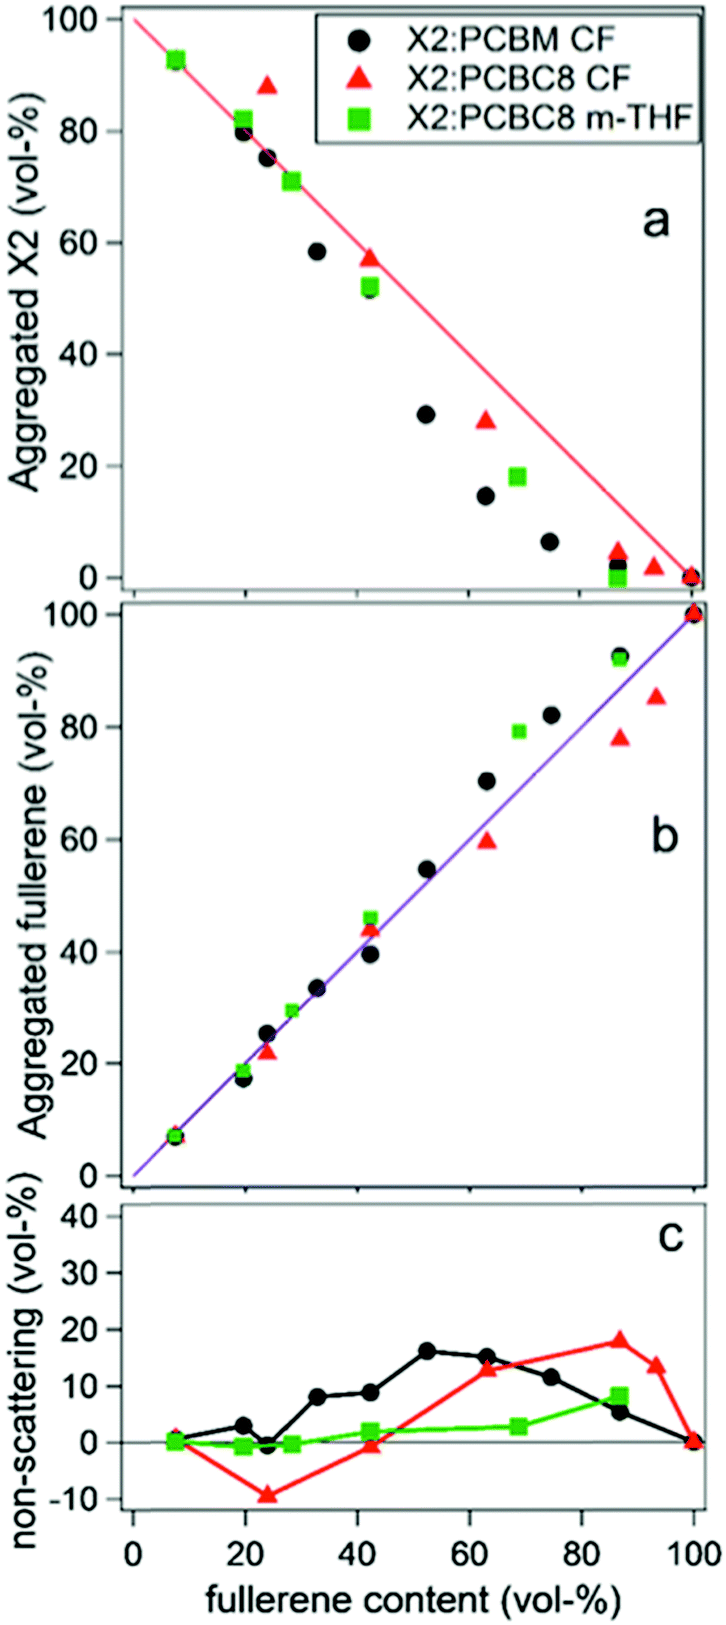
In the second study by Oosterhout et al.,17 different processing solvents were used to further investigate this system's resilience to processing changes and the presence of mixed phase was studied with the same GIWAXS methodology as well as solution phase small angle scattering (SAXS). The “green solvent” 2-methyl-THF (m-THF) was compared to the more common processing solvent chloroform (CF). In these BHJs, the fullerene derivative PC61BC8 was used for its better solubility in m-THF. Solution SAXS of X2, PC61BM, and PC61BC8 in the different solvents determined that the fullerenes are largely dissolved in both solvents while X2 self-aggregates in CF but not in m-THF. Despite these differences in solution behavior, results from GIWAXS phase fraction analysis on dried films, shown in Fig. 14, demonstrates that the resulting morphologies of all films are very similar again exhibiting no mixing. Small fractions of amorphous X2 were also observed at high fullerene loadings, but the fullerene peak followed to linear trend indicating these amorphous X2 phases were not mixed. This is speculated to be the case due to the strong propensity for X2 and PCBM to aggregate upon drying, implying a stronger correlation of morphology on the evaporation rate than on the processing solvent. The negligible mixing of this system demonstrates that, for some systems, mixing is not always a requirement for efficient OPV operation, and that a lack of mixing can help improve both reproducibility and processing flexibility for OPVs. These characteristics are especially important as this technology transfers towards commercial production.
 | ||
| Fig. 14 GIWAXS analysis of X2:fullerene films that displays negligible mixing despite an amorphous, non-scattering, fraction of X2 films at high fullerene loadings. This is determined from the negative deviation in the X2 peak intensity and linear trend in the fullerene peak intensity. Reprinted with permission from S. D. Oosterhout, V. Savikhin, M. A. Burgers, J. Zhang, Y. Zhang, S. R. Marder, G. C. Bazan and M. F. Toney, J. Phys. Chem. C, 2018, 122, 11136–11144. Copyright 2018 American Chemical Society. | ||
Lastly, a study by Alqatahni et al.10 aimed to experimentally determine the connections between mixing behavior and performance by examining two derivatives of BDT(PPTH2)2, referred to as SM1 and SM2 (Fig. 11), with the same backbone but different side groups resulting in different miscibilities with the PC71BM acceptor.57 SM1, bearing methoxy side chains, was shown to be less miscible with PC71BM while SM2, bearing an alkyl-substituted thiophene pendent, was found to be highly miscible with PC71BM. A combination of RSoXS and STXM was used to quantify the differences in mixed phase behavior for the BHJs with SM1 and SM2. STXM images and RSoXS analysis determined that SM1 blends exhibited domain characteristic lengths of 64 nm and up to 143 nm when deposited with DIO additive. SM2, on the other hand showed much smaller domains of ∼15 nm, and the addition of DIO resulted in little change. The improved miscibility in the SM2 system likely suppressed the thermodynamic favorability of domain separation so that even when evaporation is slowed by DIO, minimal domain growth occurs.
Next, domain purity was calculated using the previously mentioned total scattering intensity (TSI) analysis method. Instead of relying on DSC crystallinity data as in Ferron et al.,8 STXM was used to find average domain compositions, while neutron reflectivity measurements revealed density differences between donor rich and acceptor domains in SM1. Together, these values were used to determine a scaling factor which was used to find the compositional differences between donor rich and acceptor domains as a function of domain volume fraction. For SM2 blends, STXM could not be performed because its domains were smaller than STXM resolution. Instead, the previously calculated scaling factor was used to find an average of all domain compositions over a range of possible volume fractions. A two-phase model composed of pure donor phase and a fullerene rich phase was applied to these results. This analysis indicated that the SM2 blends were composed of higher volume of mixed, fullerene rich phase than the SM1 blends. Additionally, in SM2, this “fullerene rich” phase was composed of almost equal amounts of donor and acceptor. GIWAXS measurements further supported this morphology model by measuring more donor crystallinity in the SM1 blends than in the SM2 blends. It should be noted that the presence of aggregated fullerene GIWAXS peaks in both blends suggests that pure acceptor phase is present and the BHJ is really a three-phase system. This means the donor concentration in mixed phases is underestimated and the volume fraction of mixed phase is overestimated from the assumed 2-phase model.
Correlating this detailed picture of the morphology of each film back to performance reveals strong relationships between mixed phase and charge carrier dynamics. Transient absorption measurements demonstrated that the SM1 blends with larger, less mixed domains exhibited slower charge generation, more carrier trapping, and inhibited charge extraction. The reduced mixed phase in SM1 films combined with large domain size resulted in a lack of interconnectivity which isolated charge carriers from the electrodes as shown in Fig. 15. The more miscible SM2 resulted in smaller domains with more extensive mixed phase resulting in a well interconnected morphology. This interconnected morphology was reflected in the improved SM2 device performance where very fast transient photocurrent decay showed little trapping and fast CT state separation resulting in higher PCEs. While it is difficult to deconvolute the performance effect of the individual morphological parameters such as domain size, domain purity, and mixed phase fraction in this study, it can be concluded that improved donor acceptor miscibility resulted in a finer, more intermixed morphology that improved performance. In contrast, the larger domain sizes, reduced interfacial area, and isolated domains most strongly hindered the SM1 blend device performance. This study underscores the importance of mixed phase regarding domain connectivity.
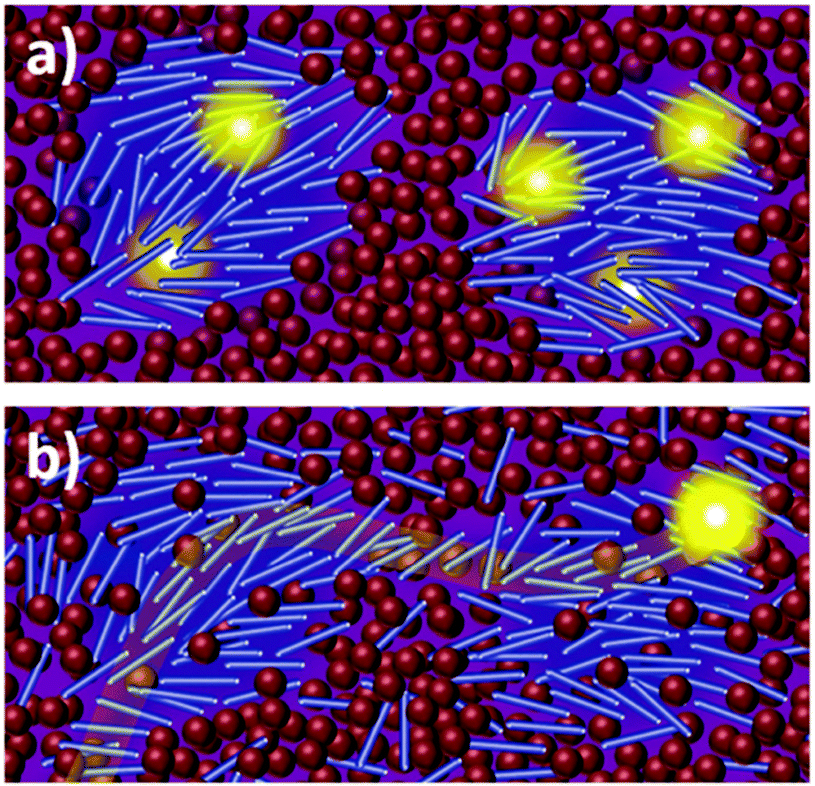 | ||
| Fig. 15 Schematic illustrations of morphologies for the SM1 and SM2 systems studied in Alqatahni et al. In (a) the SM1 morphology is illustrated to show pure, isolated domains that trap charges. In (b) a mixed phase is shown that is thought to enable charges to transport through the device and be collected. Reprinted from Adv. Energy Mater., 8, O. Alqahtani, M. Babics, J. Gorenflot, V. Savikhin, T. Ferron, A. H. Balawi, A. Paulke, Z. Kan, M. Pope, A. J. Clulow, J. Wolf, P. L. Burn, I. R. Gentle, D. Neher, M. F. Toney, F. Laquai, P. M. Beaujuge and B. A. Collins, Adv. Energy Mater., 2018, 8, 1702941, Copyright 2018, with permission from John Wiley and Sons. | ||
Non-fullerene acceptor systems
The recent advent of high performing small molecule, non-fullerene acceptors (SM–NFAs) such as Y6 has spurred new research into morphology control and optimization. It is expected that the optimal BHJ morphology of SM–NFA OPVs will differ from that for fullerene containing OPVs. This is due to several unique characteristics of SM–NFAs. Firstly, experiments have shown that photocurrent strongly depends on ionization potential offset suggesting CT state separation primarily occurs from the acceptor transferring a hole to the donor.58 This is supported by evidence of resonant energy transfer of excitons from the donor to fused ring acceptors.59 Additionally, excitons within fused ring acceptors have exceptional carrier mobilities allowing for larger domains without geminate recombination.60 Perhaps the most important difference in SM–NFA containing devices with regards to interface engineering is the band bending effect of the acceptor's quadrupole moment at donor–acceptor interfaces.61,62 This bending effect, shown in Fig. 16, has been suggested to be the cause of observed barrierless CT state splitting,63 but it also imposes a larger requirement for ionization potential offset between donor and acceptor so that a hole transfer barrier is not created. In blends with proper donor–acceptor energy offset, the former phenomena suggests that mixed phases are not necessary for CT state splitting, while the latter presents potential use for energy cascades created by amorphous and mixed phases within the BHJ. In either case, it is important to be able to quantify the mixed phase fraction and composition so that insight into structure–performance relationships can be made to facilitate rational design. Currently, the effect of mixed phase on performance of NFA OPVs is poorly understood due in part to characterization challenges outlined below.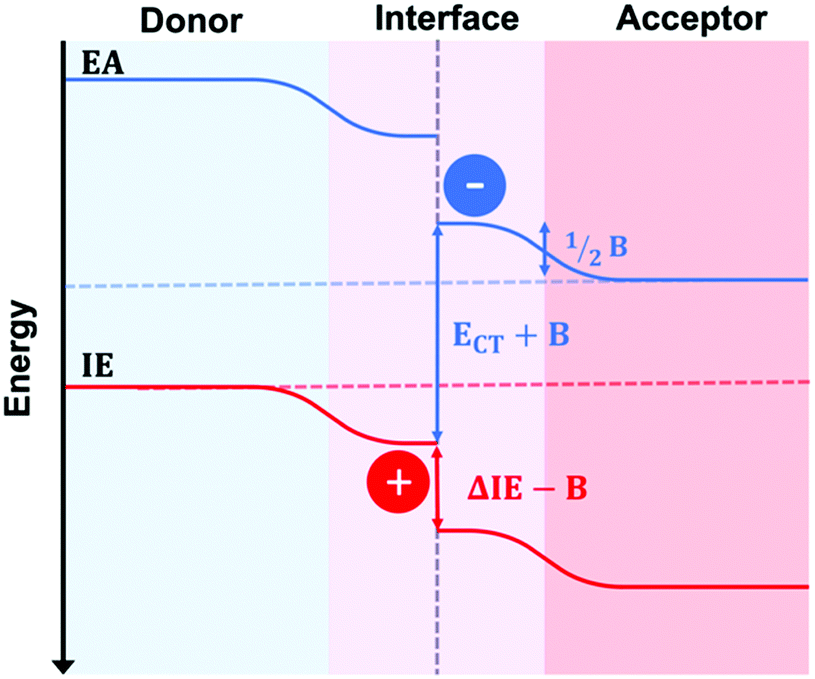 | ||
| Fig. 16 Schematic illustrating the band bending at interfaces in SM–NFA systems due to the acceptor's quadrupole moment. This bending creates a driving force for separation. However, the ionization energy offset between donor and acceptor must be larger than B to avoid creating a barrier to hole transfer. | ||
SM–NFA systems presents several new challenges for characterization of mixed phase using the X-ray scattering techniques proven for fullerene systems. Quantification of mixing through analysis of GIWAXS peak intensity proves difficult primarily due to diffraction peak overlap. Since donor and SM–NFA materials typically have similar crystalline stacking motifs composed of π–π and lamella stacking, the diffraction peaks of donor and acceptor aggregates often occur at similar q-values as shown in Fig. 17. This reduces the accuracy of the calculated peak intensity for donor and acceptor so that it is difficult to determine if a system is deviating from the linear trend for pure, aggregated phases. One strategy to circumvent this issue is to utilize a difference in preferred aggregate orientation between the donor and acceptor so that, for example, the donor crystalline fraction can be tracked by the peak intensity in the in-plane direction and the acceptor crystallinity indicated by the peak intensity in the out of plane direction. Alternatively, increased contrast between different materials may be gained from resonant X-ray diffraction, for example at the sulfur K-edge.64 Another challenge for applying this technique to SM–NFA systems is that many SM–NFAs are not intrinsically aggregated in a pure phase like PCBM. Therefore, the neat acceptor film GIWAXS spectra cannot be assumed to be perfectly aggregated which makes analysis ambiguous in some cases.
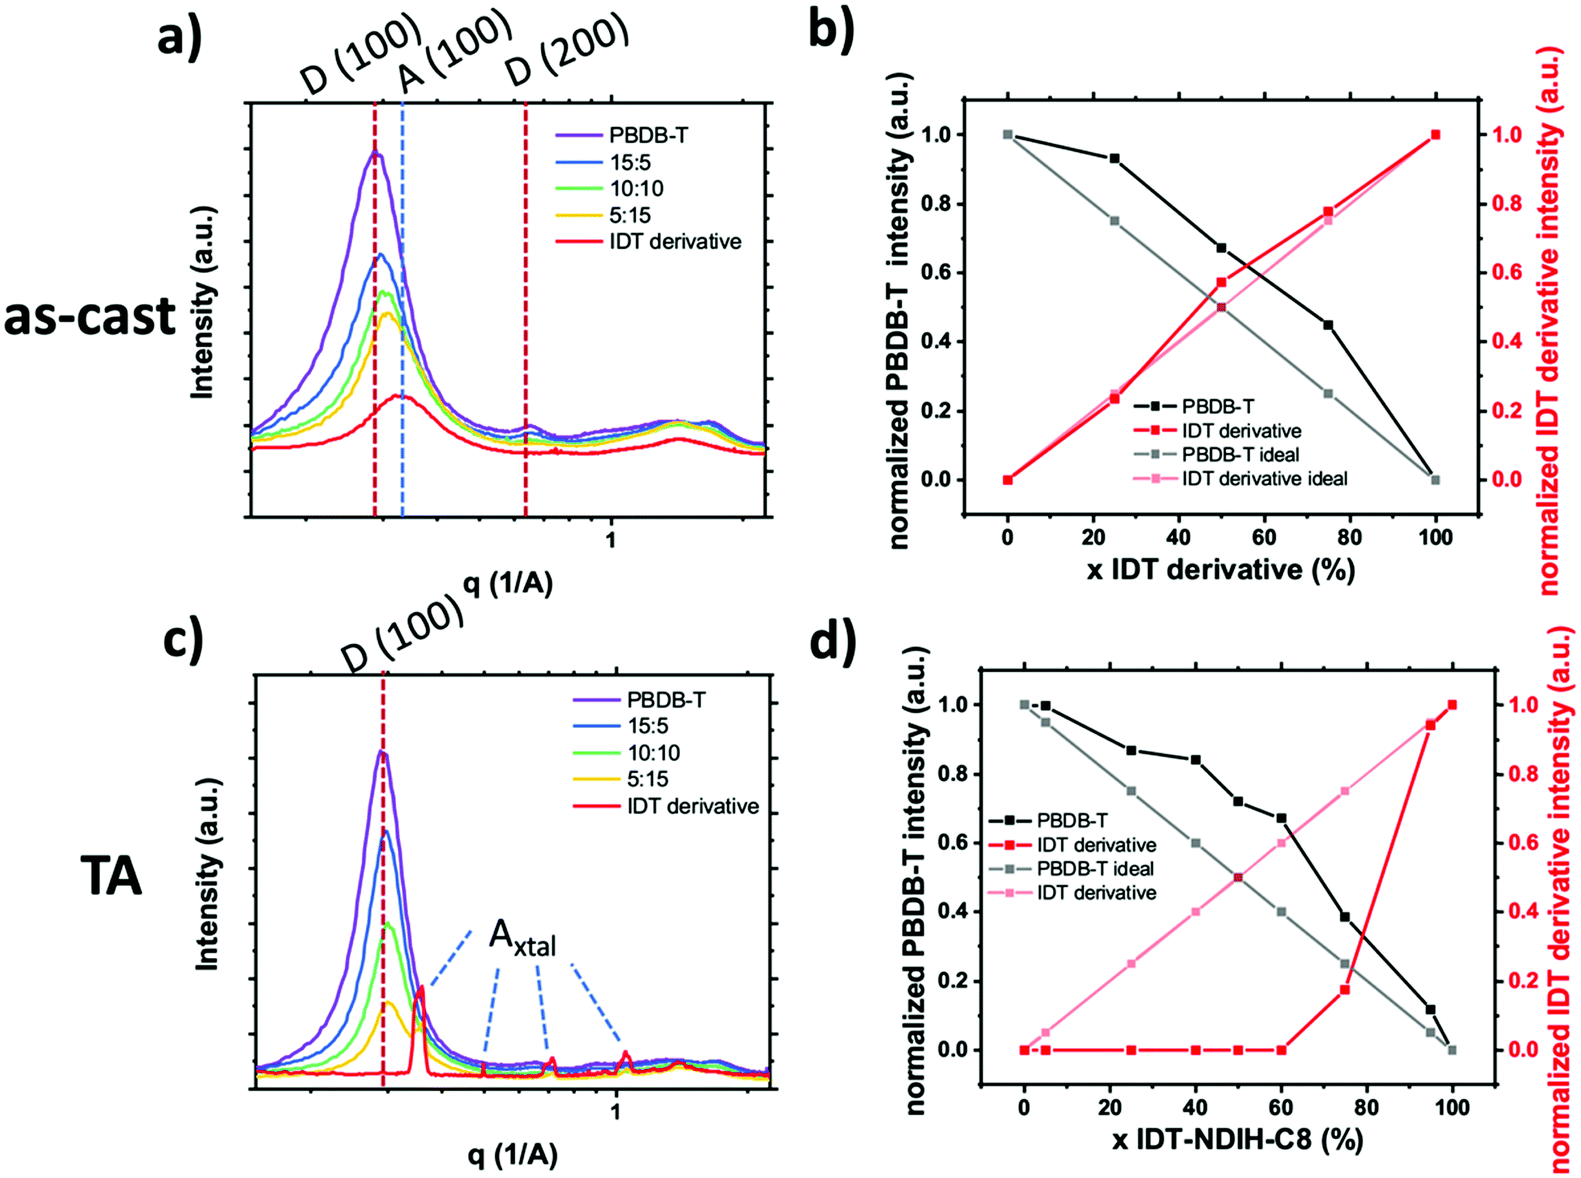 | ||
| Fig. 17 (a) and (b) show in-plane 1D GIWAXS profiles for as-cast and annealed films respectively. The donor lamella stacking and acceptor crystalline peaks used for mixed phase analysis are labeled. Panels (c) and (d) show the resulting normalized peak intensity plotted against composition for as-cast and annealed films respectively. In both processing conditions the presence of acceptor induced donor aggregation while crystalline acceptor was only observed in thermally annealed films with high acceptor loadings. | ||
We have made one of the first quantitative analysis of mixing in donor:SM–NFA systems. Mixing between PBDB-T donor polymer and an IDT derivative SM–NFA acceptor was studied in annealed and as-cast films with varying fraction of acceptor (x = 0, 25, 50, 75, 100%) using the standard GIWAXS method. Instead of utilizing the acceptor (100) aggregate peak which has significant overlap with the donor (100) peak, we used the appearance of acceptor crystalline diffraction peaks labeled Axtal to quantify the crystalline acceptor fraction (see Fig. 17). Additionally, the donor aggregation was able to be traced using (100) and (001) peaks with the same qualitative results giving us confidence in the analysis. From this analysis, we show the presence of the acceptor in as-cast and annealed blend films increases crystallinity in the polymer donor likely due to significant immiscibility similar to what was observed for PC61BM and PIPCP in Huang et al.18 In the as-cast films, the IDT derivative acceptor remains disordered even in a neat film while thermal annealing facilitates extensive crystallization of the IDT derivative. The lack of mixed phase is thought to lead to the high morphological stability under thermal stress in devices made with this material system. With the donor and acceptor already in pure domains, there is no thermally induced phase segregation below the polymer glass or melting temperatures and therefore device performance is less affected by thermal cycling.
The other primary mixing characterization technique used for fullerene containing OPVs is RSoXS which also presents difficulties when applied to donor:SM–NFA systems. The main problem encountered for SM–NFA systems is much lower contrast at the carbon K-edge. This hampers the collection of vital low q scattering signals which correspond to characteristic length scales of donor and acceptor domains. This low-q scattering is vital to accurately quantify total scattering intensity and component scattering intensity analysis methods. While potentially more challenging in SM–NFA systems, the RSoXS integrated scattering intensity method still has potential for probing domain purity in these systems. Qin et al.65 have recently used RSoXS to assess domain purity in a ternary donor polymer:SM–NFA:fullerene acceptor blend. Their results correlated higher ISI values with higher fill factor, but a complete picture of the precise mixing behavior between polymer donor, fullerene acceptor, and non-fullerene acceptor was not provided. One possible method to improve RSoXS contrast further is to use photon energies near other elemental absorption edges such as the sulfur K-edge.66 Alternatively, small angle neutron scattering (SANS) could be used with a similar analysis technique using a deuterated donor or acceptor to improve contrast.
Other non-scattering-based methods have also been used to investigate mixing in NFA containing OPVs. In one case, DSC experiments showed P3HT melting point suppression in P3HT:IDTBR mixtures attributed to IDTBR mixing into P3HT domains and disrupting crystallinity.16 By analyzing the melting and cold crystallization signals of both the P3HT and IDTBR the authors were able to show eutectic mixing behavior in this system. Raman spectroscopy was also used but suffered from low sensitivity towards NFAs resulting in large error bars. Energy filtered TEM is another promising technique that has been used provide a local image of donor–acceptor mixing,14 but it lacks the global statistics of X-ray scattering techniques.
Conclusions
Characterization of mixed phase has allowed for a more detailed understanding of the charge carrier dynamics within organic photovoltaics and has aided the optimization of morphology through chemistry and processing modifications. Among the various techniques used to probe mixed phases, X-ray scattering in the form of GIWAXS and RSoXS were able to provide the most quantitative values of phase volume fraction and purity within the bulk heterojunction film. This has given the field many insights into the structure performance relationships in OPVs.Through characterization of several OPV systems the following conclusions can be drawn. Mixing of the donor and acceptor has potential advantages including increased domain connectivity for charge collection, especially in small molecule systems which lack tie chains between domains. Mixed amorphous domains can provide energy cascades at interfaces giving CT states a driving force to disassociate and reducing recombination losses. However, there are potential disadvantages, as a mixed region likely increases the number of CT states and therefore increases the potential for recombination.7 Additionally, mixed regions have lower charge mobility compared to pure aggregated domains. These advantages and disadvantages have been shown to have varying impacts and there is likely an optimal mixed phase fraction depending on the material system. In all fullerene systems discussed here, better performance was achieved when at least some of the fullerene is aggregated within the BHJ film. This likely provides an energy cascade driving force for CT state separation and reduces recombination. However, the optimal volume fraction of mixed and pure phases varied across different donor chemistries or even donor molecule type (polymer vs. SM). Generally, a small, but non-zero mixed phase volume fraction is found to provide the best results in polymer systems. Yet, some small molecule systems like X2:PC61BM functioned well without any detectible mixed phase despite the suggested lack of interconnectivity in small molecule domains without mixing.
As the OPV field shifts towards non-fullerene acceptors, new design rules for optimal mixed phases will need to be formulated. This effort will require accurate and quantitative characterization of mixed phases and their effect on performance. Such characterization will prove to be more challenging than in fullerene-based systems because of the chemical similarities of non-fullerene acceptors to conjugated donor molecules. With lower electron contrast and more overlapping diffraction peaks, the conventional GIWAXS and RSoXS methods must be improved. Utilization of alternative absorption edges from heteroatoms is a promising way forward to increase the ability to differentiate materials in both GIWAXS and RSoXS techniques. Alternatively, neutron scattering techniques such as SANS may provide the necessary contrast for SM–NFA systems more easily through simple deuteration of one material.
Author contributions
Thomas P. Chaney: writing – original draft(equal); writing – review and editing (equal). Andrew J. Levin: writing – original draft (equal); writing – review and editing (equal). Sebastian A. Schneider: writing – original draft (supporting); writing – review and editing (equal). Michael F. Toney: supervision; funding acquisition; writing – review and editing (equal).Conflicts of interest
There are no conflicts to declare.Acknowledgements
The authors would like to thank Seth Marder for his insight and support over the past many years and for numerous helpful discussions. We thank the Office of Naval Research for support through the Center for Self-Assembled Organic Electronics (SOE), Grant N00014-19-1-2453 (TC, SAS, MFT) and under Grant N00014-21-1-2087 (AL, MFT). Use of the Stanford Synchrotron Radiation Lightsource, SLAC National Accelerator Laboratory, is supported by the U.S. Department of Energy, Office of Science, Office of Basic Energy Sciences under Contract No. DE-AC02-76SF00515.References
- Y. Liu, Z. Zheng, V. Coropceanu, J.-L. Brédas and D. S. Ginger, Mater. Horiz., 2021 10.1039/D1MH00529D.
- T. M. Burke, S. Sweetnam, K. Vandewal and M. D. McGehee, Adv. Energy Mater., 2015, 5, 1500123 CrossRef.
- Y. Lin, A. Magomedov, Y. Firdaus, D. Kaltsas, A. El-Labban, H. Faber, D. R. Naphade, E. Yengel, X. Zheng, E. Yarali, N. Chaturvedi, K. Loganathan, D. Gkeka, S. H. AlShammari, O. M. Bakr, F. Laquai, L. Tsetseris, V. Getautis and T. D. Anthopoulos, ChemSusChem, 2021, 14, 3569–3578 CrossRef CAS.
- S. Sweetnam, K. R. Graham, G. O. Ngongang Ndjawa, T. Heumüller, J. A. Bartelt, T. M. Burke, W. Li, W. You, A. Amassian and M. D. McGehee, J. Am. Chem. Soc., 2014, 136, 14078–14088 CrossRef CAS.
- P. Dhakal, T. Ferron, A. Alotaibi, V. Murcia, O. Alqahtani and B. A. Collins, J. Phys. Chem. Lett., 2021, 12, 1847–1853 CrossRef CAS.
- V. Savikhin, M. Babics, M. Neophytou, S. Liu, S. D. Oosterhout, H. Yan, X. Gu, P. M. Beaujuge and M. F. Toney, Chem. Mater., 2018, 30, 7872–7884 CrossRef CAS.
- J. A. Bartelt, Z. M. Beiley, E. T. Hoke, W. R. Mateker, J. D. Douglas, B. A. Collins, J. R. Tumbleston, K. R. Graham, A. Amassian, H. Ade, J. M. J. Fréchet, M. F. Toney and M. D. McGehee, Adv. Energy Mater., 2013, 3, 364–374 CrossRef CAS.
- T. Ferron, M. Waldrip, M. Pope and B. A. Collins, J. Mater. Chem. A, 2019, 7, 4536–4548 RSC.
- S. Mukherjee, C. M. Proctor, G. C. Bazan, T.-Q. Nguyen and H. Ade, Adv. Energy Mater., 2015, 5, 1500877 CrossRef.
- O. Alqahtani, M. Babics, J. Gorenflot, V. Savikhin, T. Ferron, A. H. Balawi, A. Paulke, Z. Kan, M. Pope, A. J. Clulow, J. Wolf, P. L. Burn, I. R. Gentle, D. Neher, M. F. Toney, F. Laquai, P. M. Beaujuge and B. A. Collins, Adv. Energy Mater., 2018, 8, 1702941 CrossRef.
- K. Vakhshouri, D. R. Kozub, C. Wang, A. Salleo and E. D. Gomez, Phys. Rev. Lett., 2012, 108, 026601 CrossRef.
- E. Buchaca-Domingo, A. J. Ferguson, F. C. Jamieson, T. McCarthy-Ward, S. Shoaee, J. R. Tumbleston, O. G. Reid, L. Yu, M.-B. Madec, M. Pfannmöller, F. Hermerschmidt, R. R. Schröder, S. E. Watkins, N. Kopidakis, G. Portale, A. Amassian, M. Heeney, H. Ade, G. Rumbles, J. R. Durrant and N. Stingelin, Mater. Horiz., 2014, 1, 270–279 RSC.
- H. Cha, G. Fish, J. Luke, A. Alraddadi, H. H. Lee, W. Zhang, Y. Dong, S. Limbu, A. Wadsworth, I. P. Maria, L. Francàs, H. L. Sou, T. Du, J. Kim, M. A. McLachlan, I. McCulloch and J. R. Durrant, Adv. Energy Mater., 2019, 9, 1901254 CrossRef.
- W. Köntges, P. Perkhun, J. Kammerer, R. Alkarsifi, U. Würfel, O. Margeat, C. Videlot-Ackermann, J.-J. Simon, R. R. Schröder, J. Ackermann and M. Pfannmöller, Energy Environ. Sci., 2020, 13, 1259–1268 RSC.
- C. Müller, T. A. M. Ferenczi, M. Campoy-Quiles, J. M. Frost, D. D. C. Bradley, P. Smith, N. Stingelin-Stutzmann and J. Nelson, Adv. Mater., 2008, 20, 3510–3515 CrossRef.
- E. Rezasoltani, A. A. Y. Guilbert, J. Yan, X. Rodríguez-Martínez, M. Azzouzi, F. Eisner, S. M. Tuladhar, Z. Hamid, A. Wadsworth, I. McCulloch, M. Campoy-Quiles and J. Nelson, Chem. Mater., 2020, 32, 8294–8305 CrossRef CAS.
- S. D. Oosterhout, V. Savikhin, M. A. Burgers, J. Zhang, Y. Zhang, S. R. Marder, G. C. Bazan and M. F. Toney, J. Phys. Chem. C, 2018, 122, 11136–11144 CrossRef CAS.
- T.-Y. Huang, H. Yan, M. Abdelsamie, V. Savikhin, S. A. Schneider, N. A. Ran, T.-Q. Nguyen, G. C. Bazan and M. F. Toney, RSC Adv., 2019, 9, 4106–4112 RSC.
- N. A. Ran, J. A. Love, M. C. Heiber, X. Jiao, M. P. Hughes, A. Karki, M. Wang, V. V. Brus, H. Wang, D. Neher, H. Ade, G. C. Bazan and T. Nguyen, Adv. Energy Mater., 2018, 8, 1701073 CrossRef.
- Z. Hamid, A. Wadsworth, E. Rezasoltani, S. Holliday, M. Azzouzi, M. Neophytou, A. A. Y. Guilbert, Y. Dong, M. S. Little, S. Mukherjee, A. A. Herzing, H. Bristow, R. J. Kline, D. M. DeLongchamp, A. A. Bakulin, J. R. Durrant, J. Nelson and I. McCulloch, Adv. Energy Mater., 2020, 10, 1903248 CrossRef CAS.
- B. A. Collins, Z. Li, J. R. Tumbleston, E. Gann, C. R. McNeill and H. Ade, Adv. Energy Mater., 2013, 3, 65–74 CrossRef CAS.
- W. Yin and M. Dadmun, ACS Nano, 2011, 5, 4756–4768 CrossRef CAS.
- H. Chen, J. Chen, W. Yin, X. Yu, M. Shao, K. Xiao, K. Hong, D. L. Pickel, W. M. Kochemba, S. M. Kilbey II and M. Dadmun, J. Mater. Chem. A, 2013, 1, 5309 RSC.
- S. Lan, H. Yang, G. Zhang, X. Wu, W. Ning, S. Wang, H. Chen and T. Guo, J. Phys. Chem. C, 2016, 120, 21317–21324 CrossRef CAS.
- M. Abdelsamie and M. F. Toney, Conjugated Polymers: Properties, Processing, and Applications, CRC Press, 4th edn, 2019 Search PubMed.
- S. D. Oosterhout, V. Savikhin, J. Zhang, Y. Zhang, M. A. Burgers, S. R. Marder, G. C. Bazan and M. F. Toney, Chem. Mater., 2017, 29, 3062–3069 CrossRef CAS.
- J. Martín, N. Stingelin and D. Cangialosi, J. Phys. Chem. Lett., 2018, 9, 990–995 CrossRef.
- C. R. Snyder, R. C. Nieuwendaal, D. M. DeLongchamp, C. K. Luscombe, P. Sista and S. D. Boyd, Macromolecules, 2014, 47, 3942–3950 CrossRef CAS.
- J. H. Carpenter, A. Hunt and H. Ade, J. Electron Spectrosc. Relat. Phenom., 2015, 200, 2–14 CrossRef CAS.
- T. Coffey, S. Urquhart and H. Ade, J. Electron Spectrosc. Relat. Phenom., 2002, 122, 65–78 CrossRef CAS.
- E. G. Rightor, A. P. Hitchcock, H. Ade, R. D. Leapman, S. G. Urquhart, A. P. Smith, G. Mitchell, D. Fischer, H. J. Shin and T. Warwick, J. Phys. Chem. B, 1997, 101, 1950–1960 CrossRef CAS.
- J. Wang, C. Morin, L. Li, A. P. Hitchcock, A. Scholl and A. Doran, J. Electron Spectrosc. Relat. Phenom., 2009, 170, 25–36 CrossRef CAS.
- D. Attwood, Soft X-Rays and Extreme Ultraviolet Radiation: Principles and Applications, Cambridge University Press, Cambridge, 1999 Search PubMed.
- J. M. Virgili, Y. Tao, J. B. Kortright, N. P. Balsara and R. A. Segalman, Macromolecules, 2007, 40, 2092–2099 CrossRef CAS.
- M. Fox, Optical properties of solids, Oxford University Press, Oxford, New York, 2nd edn, 2010 Search PubMed.
- J. H. Carpenter, A. Hunt and H. Ade, J. Electron Spectrosc. Relat. Phenom., 2015, 200, 2–14 CrossRef CAS.
- E. Gann, B. A. Collins, M. Tang, J. R. Tumbleston, S. Mukherjee and H. Ade, J. Synchrotron Radiat., 2016, 23, 219–227 CrossRef CAS.
- J. H. Litofsky and E. D. Gomez, MRS Commun., 2019, 9, 1168–1173 CrossRef CAS.
- X. Jiao, L. Ye and H. Ade, Adv. Energy Mater., 2017, 7, 1700084 CrossRef.
- K. S. Wienhold, X. Jiang and P. Müller-Buschbaum, Appl. Phys. Lett., 2020, 116, 120504 CrossRef CAS.
- M. A. Ruderer, R. Meier, L. Porcar, R. Cubitt and P. Müller-Buschbaum, J. Phys. Chem. Lett., 2012, 3, 683–688 CrossRef CAS.
- W. Wang, L. Song, D. Magerl, D. Moseguí González, V. Körstgens, M. Philipp, J.-F. Moulin and P. Müller-Buschbaum, Adv. Funct. Mater., 2018, 28, 1800209 CrossRef.
- P. Müller-Buschbaum, E. Metwalli, J.-F. Moulin, V. Kudryashov, M. Haese-Seiller and R. Kampmann, Eur. Phys. J.: Spec. Top., 2009, 167, 107–112 Search PubMed.
- H. Chen, Y.-C. Hsiao, B. Hu and M. Dadmun, Adv. Funct. Mater., 2014, 24, 5129–5136 CrossRef CAS.
- G. Yu, J. Gao, J. C. Hummelen, F. Wudl and A. J. Heeger, Science, 1995, 270, 1789–1791 CrossRef CAS.
- A. C. Mayer, M. F. Toney, S. R. Scully, J. Rivnay, C. J. Brabec, M. Scharber, M. Koppe, M. Heeney, I. McCulloch and M. D. McGehee, Adv. Funct. Mater., 2009, 19, 1173–1179 CrossRef CAS.
- N. C. Miller, E. Cho, R. Gysel, C. Risko, V. Coropceanu, C. E. Miller, S. Sweetnam, A. Sellinger, M. Heeney, I. McCulloch, J.-L. Brédas, M. F. Toney and M. D. McGehee, Adv. Energy Mater., 2012, 2, 1208–1217 CrossRef CAS.
- B. A. Collins, E. Gann, L. Guignard, X. He, C. R. McNeill and H. Ade, J. Phys. Chem. Lett., 2010, 1, 3160–3166 CrossRef CAS.
- B. A. Collins and H. Ade, J. Electron Spectrosc. Relat. Phenom., 2012, 185, 119–128 CrossRef CAS.
- C. McDowell, M. Abdelsamie, M. F. Toney and G. C. Bazan, Adv. Mater., 2018, 30, 1707114 CrossRef.
- J. Kniepert, M. Schubert, J. C. Blakesley and D. Neher, J. Phys. Chem. Lett., 2011, 2, 700–705 CrossRef CAS.
- P. C. Y. Chow, S. Gélinas, A. Rao and R. H. Friend, J. Am. Chem. Soc., 2014, 136, 3424–3429 CrossRef CAS.
- S. Mukherjee, C. M. Proctor, J. R. Tumbleston, G. C. Bazan, T.-Q. Nguyen and H. Ade, Adv. Mater., 2015, 27, 1105–1111 CrossRef CAS.
- H. Chen, J. Peet, Y.-C. Hsiao, B. Hu and M. Dadmun, Chem. Mater., 2014, 26, 3993–4003 CrossRef CAS.
- W. Huang, N. Chandrasekaran, S. K. K. Prasad, E. Gann, L. Thomsen, D. Kabra, J. M. Hodgkiss, Y.-B. Cheng and C. R. McNeill, ACS Appl. Mater. Interfaces, 2016, 8, 29608–29618 CrossRef CAS.
- J. Y. Kim and C. D. Frisbie, J. Phys. Chem. C, 2008, 112, 17726–17736 CrossRef CAS.
- J. Wolf, M. Babics, K. Wang, Q. Saleem, R.-Z. Liang, M. R. Hansen and P. M. Beaujuge, Chem. Mater., 2016, 28, 2058–2066 CrossRef CAS.
- S. Karuthedath, J. Gorenflot, Y. Firdaus, N. Chaturvedi, C. S. P. De Castro, G. T. Harrison, J. I. Khan, A. Markina, A. H. Balawi, T. A. D. Peña, W. Liu, R.-Z. Liang, A. Sharma, S. H. K. Paleti, W. Zhang, Y. Lin, E. Alarousu, D. H. Anjum, P. M. Beaujuge, S. De Wolf, I. McCulloch, T. D. Anthopoulos, D. Baran, D. Andrienko and F. Laquai, Nat. Mater., 2021, 20, 378–384 CrossRef CAS.
- L. Krückemeier, P. Kaienburg, J. Flohre, K. Bittkau, I. Zonno, B. Krogmeier and T. Kirchartz, Commun. Phys., 2018, 1, 27 CrossRef.
- S. Chandrabose, K. Chen, A. J. Barker, J. J. Sutton, S. K. K. Prasad, J. Zhu, J. Zhou, K. C. Gordon, Z. Xie, X. Zhan and J. M. Hodgkiss, J. Am. Chem. Soc., 2019, 141, 6922–6929 CrossRef CAS.
- C. Poelking and D. Andrienko, J. Am. Chem. Soc., 2015, 137, 6320–6326 CrossRef CAS.
- J. M. Hodgkiss, Nat. Mater., 2021, 20, 289–290 CrossRef CAS.
- L. Perdigón-Toro, H. Zhang, A. Markina, J. Yuan, S. M. Hosseini, C. M. Wolff, G. Zuo, M. Stolterfoht, Y. Zou, F. Gao, D. Andrienko, S. Shoaee and D. Neher, Adv. Mater., 2020, 32, 1906763 CrossRef.
- G. Freychet, E. Gann, M. Zhernenkov and C. R. McNeill, J. Phys. Chem. Lett., 2021, 12, 3762–3766 CrossRef CAS.
- Y. Qin, Y. Xu, Z. Peng, J. Hou and H. Ade, Adv. Funct. Mater., 2020, 30, 2005011 CrossRef CAS.
- W. Zhong, F. Liu and C. Wang, J. Phys.: Condens. Matter, 2021, 33, 313001 CrossRef CAS.
Footnote |
| † Both authors contributed equally. |
| This journal is © The Royal Society of Chemistry 2022 |