 Open Access Article
Imidazole encapsulated in core–shell MOF@COFs with a high anhydrous proton conductivity†
Shucheng
Liu
ab,
Han
Li
b,
Yu
Shuai
b,
Zhao
Ding
*a and
Yi
Liu
 *b
*b
aCollege of Big Data and Information Engineering, Guizhou University, Guiyang 550025, P. R. China. E-mail: zding@gzu.edu.cn
bSchool of Physical Sciences, Guizhou University, Guiyang 550025, P. R. China. E-mail: yliu9@gzu.edu.cn
First published on 30th September 2022
Abstract
Proton-conductive materials are the most important components in fuel cells. At present, there are still significant challenges for the controllable design of anhydrous proton electrolytes with high conductivity at high temperature (>80 °C). Herein, we propose proton conduction across heterogeneous channels in a metal–organic framework/covalent–organic framework hybrid (MOF@COF). The imidazole molecules are encapsulated into core–shell UiO-67@TAPB–DMTP-COFs (TAPB = 1,3,5-tri(4-aminophenyl)benzene, DMTP = 2,5-dimethoxyterephthalaldehyde), and they achieve the highest anhydrous proton conductivity (σ = 1.4 × 10⁻² S cm−1 at 120 °C) with an ultra-low activation energy. The synergism of porous MOF@COF heterostructures is of great significance for improving proton conduction, which is due to the rearrangement of hydrogen bonds and the enhanced transport of protons across the unique heterogeneous channels. This work provides a novel platform based on a MOF@COF hybrid for high-temperature anhydrous proton conduction.
1. Introduction
With current rapid developments in technology and the global economy, humankind is facing two major problems: environmental pollution and an energy crisis. Fuel cells can quickly convert chemical energy into electrical energy through the chemical reaction of hydrogen and oxygen gas, producing clean energy.1–4 Proton-conductive materials are the most important components in fuel cells, and they have attracted much attention from scientific researchers.5–7 At present, commercial proton-conductive materials constructed from an organic exchange membrane and a solid electrolyte (a perfluorosulfonated polymer called Nafion) can work at temperatures up to 80 °C, and their conductivity can reach 10−2 S cm−1.8,9 However, the conductivity of such sulfonated polymers decreases linearly with the loss of water at high temperatures (>80 °C), and this means that they are far from meeting the needs of high-power fuel cells.To improve the efficiency of high-power fuel cells, the development of new proton-conductive materials with high conductivity under an anhydrous environment has become an important topic. Loading proton carriers, such as imidazole or pyrazole heterocyclic molecules, into the channels of a solid porous framework is well known as a novel method for improving the high-temperature performance of proton-conductive materials.10–12 Using this approach, a unique high-speed proton-transport path can be formed in the channels of these materials.13,14 Recently, functional porous crystals such as metal–organic frameworks (MOFs) and covalent organic frameworks (COFs) have attracted extensive attention. MOFs are hybrid inorganic–organic compounds connected by metal ions through organic ligands.15–19 These new porous materials have adjustable structures, high porosities, and large specific surface areas; they thus have extensive prospects in the design of new proton-conductive materials. Loading carrier molecules such as organic heterocycles, like imidazole or triazole, into the channels of MOFs is one of strategies used to improve the proton conduction at high temperatures. Bureekaew et al.6 first encapsulated imidazole into [Al(OH)(1,4-naphthalenedicarboxylate)]n MOFs, and a proton conductivity of 2.2 × 10⁻⁵ S cm−1 at 120 °C was observed; this far exceeds the conductivity of solid imidazole (∼10−8 S cm−1). Another study was carried out by Shimizu et al., wherein 1,2,4-triazole was used as the guest proton carrier; this was loaded into the one-dimensional channels of Na3(2,4,6-trihydroxy-1,3,5-benzenetrisulfonate) (b-PCMOF2). The b-PCMOF2 framework exhibited a conductivity of 10−8 S cm−1 above 70 °C; however, when 1,2,4-triazole was introduced into the channels of the framework, the conductivity at 150 °C increased to 5 × 10⁻⁴ S cm−1.10
COFs are another kind of porous material formed via covalent bonding between light elements such as C, H, O, B, and N.20–23 These materials have high specific surface areas, low densities, a wide pH tolerance, good water retention and easily modified functionality. Researchers can predesign the topologies of different organic units to form porous crystal materials with different dimensions and shapes through self-assembly. Heterocyclic molecules are introduced into the designed COFs to form excellent proton-conductive materials. Xu et al.5 pioneered the loading of imidazole and pyrazole, respectively, into two-dimensional triphenylbenzene–2,5-dimethoxyterephthalaldehyde (TPB–DMTP) COFs, where the proton conductivity at 130 °C was found to be 4.37 × 10⁻³ S cm−1 for the former and 3.3 × 10⁻³ S cm−1 for the latter. These results demonstrate the potential of microporous and mesoporous frameworks as a platform for proton conduction. Their oriented porous channels enhance the loading of proton carriers, reduce the activation energy, and improve the proton conduction. However, many challenges still remain for these materials. The reported conductivities of host–guest materials are still insufficient for high-power fuel cells. Therefore, it is necessary to further optimize the channel structures (size and shape) of these materials to further reduce the activation energy of the proton carriers.
Although many individual MOFs and COFs have been synthesized, their exploration and applications are unsatisfactory due to their monotonous structures. Hybrid materials constructed from both MOFs and COFs, known as MOF@COFs, combine the advantages both materials, meaning that they are widely used in applications including catalysis, gas separation, and sensing.24–26 Fu et al.27 reported the COF-300@ZIF-8 composite, which showed the highest separation selectivity performance for H2/CO2 gas mixtures. Lan et al.28 provided an integrated porous NH2–UiO-66/TpPa-1-COF hybrid with good photocatalytic H2 evolution under visible light. Lu's group used the NH2–MIL-125@TAPB–PDA-COF hybrid as an excellent photocatalyst for selectively oxidizing alcohols.29 However, MOF/COF hybrid materials have never been explored in the application of proton conduction, especially in the proton conductivity of guest molecules that occupy the heterogeneous channels of MOF@COFs. Core–shell MOF@COFs can combine the pore characteristics of both materials and produce multifunctional porous MOF@COF heterostructures, making them interesting candidates for porous solid supports. Compared with individual MOFs or COFs, MOF/COF heterostructures exhibit many advantages for proton conduction due to the synergistic effects of their different components. Pristine MOFs usually demonstrate unsatisfactory stability and limited conductivity, while COFs show enhanced chemical stability and conductivity due to the π–π conjugated structures in the plane and in the stacking direction.26 Therefore, the hybridization of MOFs and COFs results in increased stability, and electrochemical properties such as the ion-transfer ability can be improved. Moreover, MOF and COF hybrids exhibit designable porous nanostructures, large surface areas and smaller band gaps, which can greatly boost the transfer and diffusion of molecules and benefit the transport of ions.
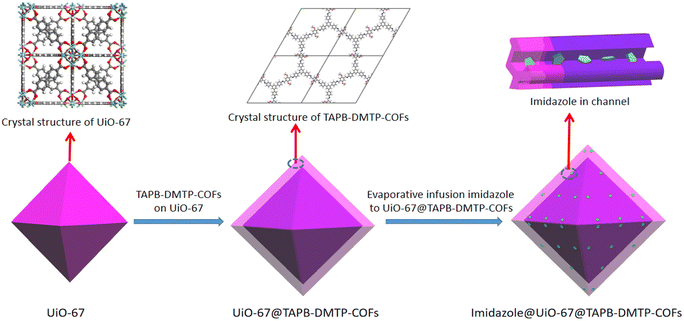
In this work, we synthesized a novel core–shell MOF@COF composite with heterogeneous micro-/mesoporous channels by selecting typical microporous UiO-67 and mesoporous 1,3,5-tri(4-aminophenyl)benzene (TAPB)–2,5-dimethoxyterephthalaldehyde (DMTP)-COFs as the precursors. Here, UiO-67 was prepared using a solvothermal method, and TAPB–DMTP-COF crystals were grown on the surface of UiO-67 in situ. Imidazole molecules were used as proton carriers and were introduced into the heterogeneous channels of the UiO-67@TAPB–DMTP-COFs, as shown in Scheme 1. The composite material imidazole@UiO-67@TAPB–DMTP-COF was found to exhibit an ultra-high anhydrous proton conductivity (10−2 S cm−1 at 120 °C), which is superior to that of any imidazole-encapsulated proton-conducting material reported so far. The remarkable conductivity of this material is due to the special hydrogen-bonding networks in the heterogeneous channels, which provide a low activation energy for proton migration. By varying the shell thickness of the core–shell structure and the amount of imidazole loaded into the channels, we thoroughly examined the proton-transport mechanism and the enhancement effect of the heterogeneous channels.
2. Experimental
2.1. Materials
In this work, all chemicals were used as supplied and were not further purified. Anhydrous zirconium chloride was purchased from J&K Scientific; imidazole was purchased from Adamas; biphenyl-4,4-dicarboxylic acid and 1,3,5-tris(4-aminophenyl)benzene were purchased form TCI; 2,5-dimethoxyterephthalaldehyde was purchased from Aldrich; 1,4-dioxane, n-butanol, methanol, glacial acetic acid, tetrahydrofuran, and N,N-dimethylformamide (DMF) were purchased from Adamas.2.2. Synthesis of UiO-67
UiO-67 was prepared by dissolving ZrCl4 (0.2800 g, 1.2 mmol) and biphenyl-4,4-dicarboxylic acid (0.2906 g, 1.2 mmol) in a mixture of 30 mL DMF and 2 mL acetic acid, with constant stirring at room temperature. The mixture was then transferred to a Teflon-lined stainless-steel autoclave (100 mL) and heated at 120 °C for 2 days. The reaction product was cooled naturally to room temperature, washed three times with DMF and dried at room temperature. Excess ligands and organic solvent in the material were removed via high-temperature treatment at 300 °C for one day. Finally, the light yellow powder UiO-67 was obtained.2.3. Synthesis of TAPB–DMTP-COFs
10.5 mg of TAPB and 8.5 mg of DMTP were dispersed in 4.5 mL of a mixed solution of 1,4-dioxane, n-butanol, and methanol (volume ratio 4![[thin space (1/6-em)]](https://www.rsc.org/images/entities/char_2009.gif) :
:![[thin space (1/6-em)]](https://www.rsc.org/images/entities/char_2009.gif) 4
4![[thin space (1/6-em)]](https://www.rsc.org/images/entities/char_2009.gif) :
:![[thin space (1/6-em)]](https://www.rsc.org/images/entities/char_2009.gif) 1). After the monomer had dissolved completely via ultrasonication for half an hour, 0.1 mL of acetic acid (3.0 mol L−1) was added slowly, and this was allowed to react at room temperature for 2 h. Then, 0.4 mL of acetic acid was added to the above mixture, and the resulting mixture was placed in an oven at 80 °C for 24 h.
1). After the monomer had dissolved completely via ultrasonication for half an hour, 0.1 mL of acetic acid (3.0 mol L−1) was added slowly, and this was allowed to react at room temperature for 2 h. Then, 0.4 mL of acetic acid was added to the above mixture, and the resulting mixture was placed in an oven at 80 °C for 24 h.
After the reaction, the precipitate was washed with tetrahydrofuran three times and finally dried under vacuum at 60 °C for 24 h.
2.4. Synthesis of UiO-67@TAPB–DMTP-COFs (MC-x, x = 1, 3)
19 mg of UiO-67, 10.5 mg of TAPB, and 8.5 mg of DMTP were dispersed in 4.5 mL of a mixed solution of 1,4-dioxane, n-butanol, and methanol (volume ratio 4![[thin space (1/6-em)]](https://www.rsc.org/images/entities/char_2009.gif) :
:![[thin space (1/6-em)]](https://www.rsc.org/images/entities/char_2009.gif) 4
4![[thin space (1/6-em)]](https://www.rsc.org/images/entities/char_2009.gif) :
:![[thin space (1/6-em)]](https://www.rsc.org/images/entities/char_2009.gif) 1). To the above solution 0.1 mL of acetic acid (3.0 mol L−1) was added slowly and the reaction was allowed to proceed at room temperature for 2 hours. Then, 0.4 mL of acetic acid was added to the above mixture and heated at 80 °C for 24 h. After the reaction, the precipitate was washed three times with tetrahydrofuran and dried under vacuum at 60 °C for 24 h to obtain a yellow powder, which was named MC-1 (x = 1, a thick-shell structure). The synthesis of MC-3 (x = 3), which has a thin-shell structure, followed the same procedure, but the amount of UiO-67 was increased threefold (57 mg).
1). To the above solution 0.1 mL of acetic acid (3.0 mol L−1) was added slowly and the reaction was allowed to proceed at room temperature for 2 hours. Then, 0.4 mL of acetic acid was added to the above mixture and heated at 80 °C for 24 h. After the reaction, the precipitate was washed three times with tetrahydrofuran and dried under vacuum at 60 °C for 24 h to obtain a yellow powder, which was named MC-1 (x = 1, a thick-shell structure). The synthesis of MC-3 (x = 3), which has a thin-shell structure, followed the same procedure, but the amount of UiO-67 was increased threefold (57 mg).
2.5. Synthesis of imidazole@UiO-67@TAPB–DMTP-COFs (MC-xy, x = 1, 3; y = 1, 2)
Imidazole was loaded into the UiO-67@TAPB–DMTP-COF using a vapor-evaporation method. Before evaporation, MC-x (x = 1, 3) powder was placed in a vacuum at 120 °C for 12 h to remove the water molecules in the channels, and then it was cooled to room temperature. Next, imidazole and MC-x powder (the mass ratio of imidazole to MC-x was defined as y, which had a value of 1 or 2) were placed in a special container, and these reactants were separated with a 2000-mesh stainless-steel sieve (MC-x was placed on top of the sieve and imidazole was placed at the bottom of the container). The container was then placed in a vacuum incubator and heated to a temperature of 120 °C, which was maintained for 13 h. The imidazole molecules were vaporized and loaded into the channels of MC-x, producing Im@MC-11 (x = 1, y = 1), Im@MC-12 (x = 1, y = 2), Im@MC-31 (x = 3, y = 1), and Im@MC-32 (x = 3, y = 2).2.6. Characterization
Powder X-ray diffraction characterization of the samples was carried out using a Bruker D8 powder diffractometer with CuKα radiation. Scanning electron microscopy (FE-SEM, SU8020, Hitachi, Japan) and transmission electron microscopy (TEM, Tecnai G2 F20, FEI, USA) were used to analyze the morphology of the samples. Thermogravimetric analysis (TGA) was carried out using a TGA analyzer (TG,STA 449 F3, NETZSCHN, Germany) in the range from RT to 800 °C at 10 °C min−1. The pore size and specific surface area of the samples were analyzed using a BET tester (3H-2000PM1, Bester Instrument Technology Co., Ltd, China). Fourier transform infrared (FTIR) spectroscopy was carried out using a Nicolet IS10 spectrometer (Thermo Nicolet Corporation). AC impedance spectra were measured using an AC bridge (LCR, ZL5, Shanghai Haoshun Technology Co., Ltd, China) with a frequency range of 12–100 kHz.2.7. Conductivity measurement
The powder sample (about 200 mg) was pressed into a cylindrical sheet with a surface area of 0.5024 cm2 using a powder tablet press at 9 MPa. Then fix the sheet sample in a special fixture equipped with measuring electrode. The fixture was placed in a vacuum tube furnace, and the AC impedance was measured at 50–130 °C under an argon flow (50 mL min−1). Measurements were taken under anhydrous conditions and at thermal equilibrium by holding for 30 min. The formula for calculating the sample conductivity is as follows:| σ = L/(R × S) | (1) |
The conductivity as a function of the temperature is derived from the Arrhenius equation, which is expressed as follows:
 | (2) |
3. Results and discussion
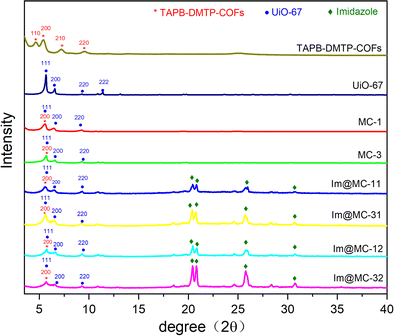
UiO-67 was prepared via coordinating Zr4+ with diphenic acid ligands using a solvothermal method. TAPB–DMTP-COFs were synthesized via condensation of TAPB and DMTP under solvothermal conditions. The targeted core–shell UiO-67@TAPB–DMTP-COFs were fabricated using a one-step synthesis process in which TAPB–DMTP-COFs was grown on the surface of UiO-67 via a condensation reaction. Herein, depending on the amounts of starting materials (see the Experimental section for details), the obtained UiO-67@TAPB–DMTP-COFs were named MC-x (x = 1, 3), where MC-1 represents a thick-shell structure and MC-3 represents a thin-shell structure. Imidazole was loaded into the UiO-67@TAPB–DMTP-COFs, and the resulting materials were named Im@MC-xy (x = 1, 3; y = 1, 2), where y denotes the feed mass ratio of imidazole to the UiO-67@TAPB–DMTP-COF.The crystal structures of the materials were investigated using powder X-ray diffraction (PXRD). As shown in Fig. 1, both UiO-67 and the TAPB–DMTP-COF showed relatively crystalline diffraction patterns as synthesized, and these were consistent with the simulated results (Fig. S1 and S2, ESI†). Fig. 1 also shows the PXRD spectra of UiO-67@TAPB–DMTP-COFs (MC-x) and imidazole@UiO-67@TAPB–DMTP-COFs (Im@MC-xy). The positions and intensities of the characteristic peaks of MC-1 and MC-3 were the same in the PXRD spectra. The diffraction peaks at 5.60° corresponded to the (200) crystal planes of TAPB–DMTP-COFs, and the diffraction peaks at 5.60°, 6.45°, and 9.28° were assigned to the (111), (200), and (220) crystal planes of UiO-67, respectively. These results suggest that core–shell UiO-67@TAPB–DMTP-COFs with different shell thicknesses were successfully prepared. The PXRD results of the four materials evaporated with imidazole (i.e., Im@MC-11, Im@MC-12, Im@MC-31, and Im@MC-32) show that the loading of imidazole molecules does not significantly change the diffraction peaks of the MOF@COFs. With the loading of imidazole molecules, four characteristic peaks for imidazole (Fig. S3, ESI†) appear in the diffraction-angle range of 20–32°. This is due to the aggregation of a large number of imidazole molecules in the channels.
The morphologies of the samples were observed using transmission electron microscopy (TEM). As shown in Fig. 2, the MC-x materials showed typical core–shell structures. The cores of the materials were regular polyhedral UiO-67 crystals, and the shells were stacked with flakes of COFs crystals. For the thin-shell sample MC-3, it can be seen that the shell thickness was about 20 nm and that the overall morphology remained polyhedral (Fig. 2a and b). As shown in Fig. 2c and d, for the thick-shell sample MC-1, the flakes of COFs were stacked into a spherical shell, and the thickness of this shell was about 200 nm. To clearly observe the core–shell structure, energy dispersive X-ray spectroscopy (EDX) was used to map the distributions of the different elements in MC-3 (Fig. 2e) and MC-1 (Fig. 2f). As can be seen from the HAADF-STEM images, there is sharp boundary between the core and the shell of the material. The elemental mapping showed that C, N, O, and Zr were distributed homogeneously throughout individual particles, which further verifies the core–shell structure.
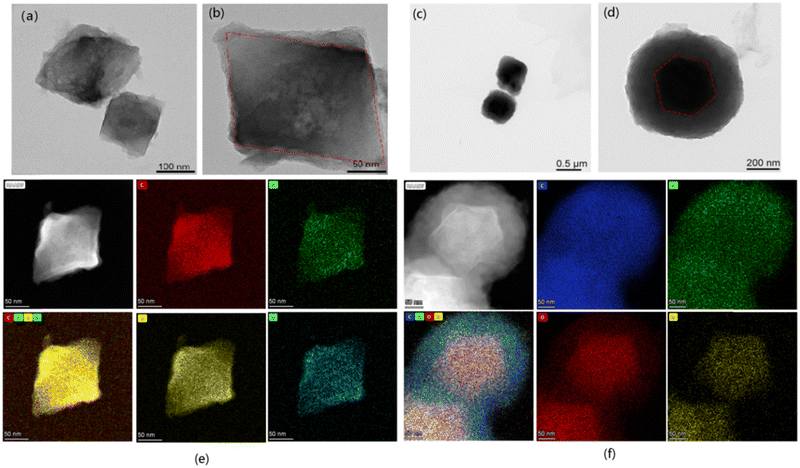 | ||
| Fig. 2 TEM images of core–shell MC-3 (a and b) and MC-1 (c and d); HAADF-STEM images and corresponding element maps of core–shell MC-3 (e) and MC-1 (f). | ||
The nitrogen adsorption–desorption isotherms and Barrett–Joyner–Halenda (BJH) pore-size distributions of UiO-67 and TAPB–DMTP-COFs are shown in Fig. S4 (ESI†). UiO-67 exhibits a typical microporous structure with a pore size center at 1.8 nm; TAPB–DMTP-COFs show a typical mesoporous structure with a pore size center at 2.3 nm and 3.9 nm. As expected, the core–shell MOF@COFs combine the microporous structure of UiO-67 with the mesoporous structure of the TAPB–DMTP-COFs. The adsorption–desorption isotherms of MC-x (x = 1, 3) exhibit the typical characteristics of both micro- and mesoporosity (Fig. 3a and b). The specific Brunauer–Emmett–Teller (BET) surface areas of MC-1 and MC-3 were 1040 m2 g−1 and 1181 m2 g−1, and the total pore volumes were 0.62 cm3 g−1 and 1.05 cm3 g−1, respectively. In addition, the BJH pore-size distribution profiles (Fig. 3c and d) indicate that both samples possessed two distinct sizes of pore: MC-1 had micropores centered at 1.7 nm and there were two mesopore peaks at 2.3 nm and 3.5 nm; MC-3 exhibited a micropore size of 1.8 nm and had two mesopore peaks centered at 2.3 nm and 3.6 nm. When imidazole was loaded, the BET specific surface areas of Im@MC-11, Im@MC-12, Im@MC-31, and Im@MC-32 decreased sharply to 14.0 m2 g−1, 10.0 m2 g−1, 10.0 m2 g−1, and 6.7 m2 g−1, and their total pore volumes decreased to 0.07 cm3 g−1, 0.07 cm3 g−1, 0.07 cm3 g−1, and 0.09 cm3 g−1, respectively. There were also no obvious peaks in the pore-size distribution curves (Fig. 3c and d), indicating that the imidazole molecules fully occupied the pore spaces of the materials. The detailed adsorption data of the materials are given in Table S1 (ESI†).
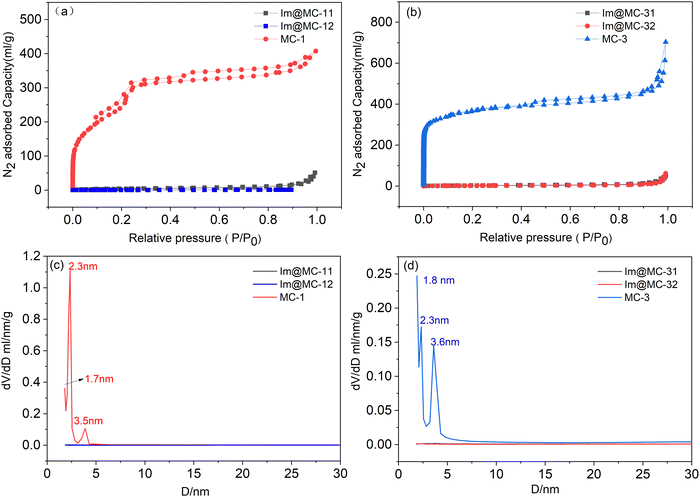 | ||
| Fig. 3 N2 adsorption–desorption isotherms (a and b) and pore-size distributions (c and d) of the samples. | ||
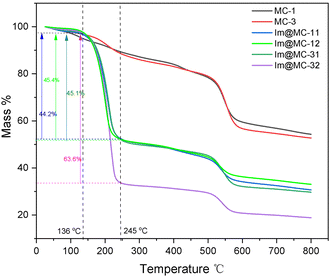
The thermal stability of the samples and the contents of imidazole loading were determined using thermogravimetric analysis (TGA) (Fig. 4). The TGA results of the core–shell MC-1 and MC-3 materials without imidazole loading showed a slow mass loss before 500 °C, which was due to the evaporation of water and excess solvent from the materials. There was an obvious mass loss between 500 °C and 600 °C (where the mass loss values were 19.2% for MC-1 and 21.7% for MC-3), which was attributed to the destruction of the MC-1 and MC-3 frameworks. The thermogravimetric curves of Im@MC-11, Im@MC-12, Im@MC-31, and Im@MC-32 show that the mass loss can be divided into two main stages. The first temperature range is 136–245 °C, which includes the mass loss caused by thermal release of the imidazole molecules from the pores of the materials. We confirmed that the mass loss in this temperature range can be regarded as the mass content of imidazole occupying the pores. The relative imidazole content of Im@MC-11, Im@MC-12, Im@MC-31, and Im@MC-32 was 44.2%, 45.4%, 45.1%, and 63.6%, respectively. The mass loss in the second stage occurred between 500 °C and 600 °C, which is similar to the curves for MC-1 and MC-3. This mass loss is mainly caused by the collapse of the frameworks, which also shows that the introduction of imidazole will not change the original frameworks of the MOF@COF materials.
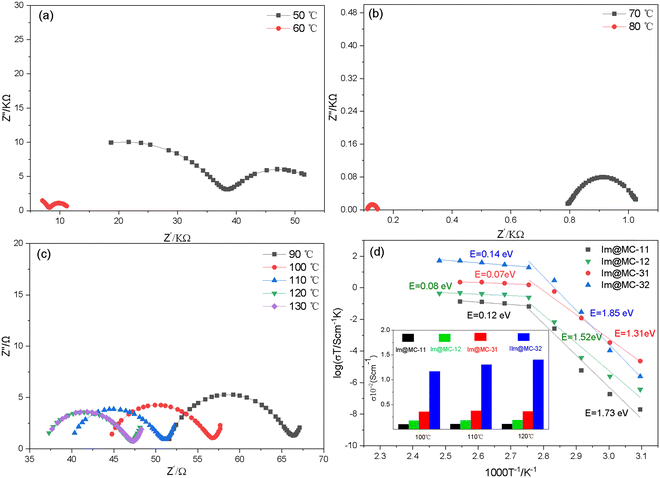
Alternating current (AC) impedance spectroscopy was used to analyze the proton-conduction behavior of the materials in an anhydrous environment. As shown in Fig. 5 and Fig. S5–S7 (ESI†), the impedance spectra of all the imidazole-loaded samples show a semicircular shape in the high-frequency range, which denotes a typical ion-conduction process. Among these, Im@MC-32 exhibits a proton conductivity of 1.14 × 10⁻⁵ S cm−1 at 50 °C. With increasing temperature, the conductivity increases rapidly and reaches 1.40 × 10⁻² S cm−1 at 120 °C; this is much higher than the reported conductivities of MOF- and COF-based proton-conductive materials, as shown in Table S2 (ESI†). Notably, this impressive proton conductivity exceeds the state-of-the-art imidazole-loaded MOFs (UiO-67) of 1.44 × 10⁻³ S cm−1 at 120 °C under anhydrous conditions.30 Moreover, the conductivity is much higher than that of imidazole-loaded TAPB–DMTP-COF (4.49 × 10⁻⁵ S cm−1 at 120 °C), as shown in Fig S8 (ESI†). The growth of the TAPB–DMTP-COFs on the surface of UiO-67 and the formation of micro-/mesoporous heterogeneous channels accounts for the improved proton conductivities of the materials. Within the measured temperature range, no signals were observed for UiO-67@TAPB–DMTP-COFs in AC impedance measurements, which indicates that the proton conductivity of the host frameworks is negligible. This means that the proton conductivity of the material comes from the imidazole in the UiO-67@TAPB–DMTP-COFs. These results show that the proton conductivity can be significantly optimized by coating a COF shell with an appropriate thickness onto the surface of a MOF. Even when the amount of imidazole loaded onto the framework is low (45.1%), Im@MC-31 also showed a high conductivity of 3.6 × 10⁻³ S cm−1 at 120 °C. When the shell thickness of the core–shell structure was increased to about 200 nm, the conductivity of Im@MC-11 was found to decrease to 1.1 × 10⁻³ S cm−1 at 120 °C.
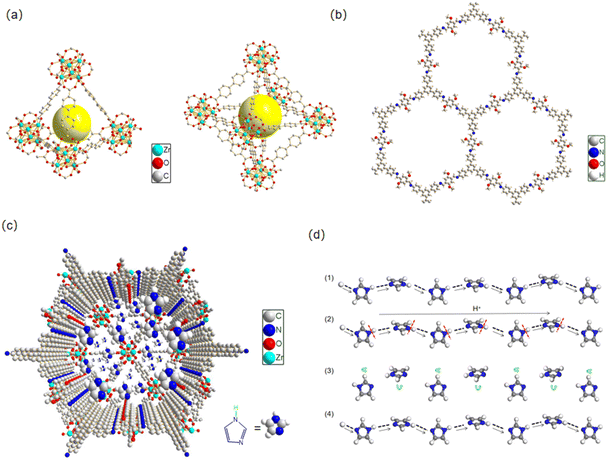
The proton conductivity can be described using the formula σ(T) = ∑niqiμi, where ni is the number of carriers, qi is the charge of the carriers, and μi is the mobility of the carriers. The mobility μi is related to the proton transfer activation energy E via the equation μi = μ0 exp(−E/kBT), meaning that a low activation energy E leads to a high mobility and conductivity. Due to its dense accumulation, the mobility μi of solid imidazole is very low and there is no obvious proton conductivity (∼10−8 S cm−1).31 The turnover of imidazole molecules in the confined space leads to the breaking and rearrangement of hydrogen bonds. The porous channels provide a path of low activation energy for proton hopping and improve the proton mobility. As shown in Fig. 6a, UiO-67 has two types of micropores: tetrahedral cages (Ø 11.5 Å) and octahedral cages (Ø 18 Å), where each octahedral cage is face shared with 8 tetrahedral cages and edge shared with 8 additional octahedral pores in its cubic framework.15 For TAPB–DMTP-COFs (Fig. 6b), the stacking structure ensures the formation of one-dimensional (1D) mesopores with a uniform mesoscopic size (32.6 Å) and hexagonal alignment.5,21 The combination of two types of pores constructs a heterogeneous micro-/mesoporous channel across the core–shell interface of the UiO-67@TAPB–DMTP-COFs. The imidazole molecule, which has a size of 4.3 Å × 3.7 Å, is suitable for loading into these composite pores (Fig. 6c). Our results indicate that the formation of heterogeneous micro-/mesopores is a feasible means of rationally designing proton-conductive porous materials. The synergism of different components in the UiO-67@TAPB–DMTP-COF composites is of great significance for improving their proton conduction. The enhancement of the heterogeneous channel is manifold: due to the synergistic effects of the different components of MOFs and COFs, MOF@COF hybridization can improve the chemical stability and ability to transfer proton carriers, which enhance the loading of proton carriers and facilitate the reorganization of hydrogen bonds; a continuous hydrogen-bonding network of imidazole along the heterogeneous channel lowers the activation energy that facilitates proton transport and improves the conductivity.
On the basis of the temperature-dependent conductivity profiles (Fig. 5d), the activation energy E for the proton conduction of the Im@UiO-67@TAPB–DMTP-COFs was calculated. The samples exhibited a slope change and two activation energies were determined within the temperature range from 50 to 130 °C. At higher temperatures (>80 °C), the activation energy of Im@MC-11, Im@MC-12, Im@MC-31 and Im@MC-32 is 0.14, 0.07, 0.08 and 0.12 eV, respectively, clearly smaller than for the reported anhydrous imidazole-loaded materials (Table S2, ESI†). The ultra-low activation energy reflects a super-ionic phase transition in the conductor at higher temperatures and follows a Grotthuss hopping mechanism for proton conduction.32–36 According to the Grotthuss mechanism, protons are conducted through intermolecular hydrogen bonds. The transfer of protons between heterocyclic molecules is achieved through the continuous breaking and recombination of the intermolecular hydrogen-bond network. Herein, the heterogeneous channel is favorable for the flipping and crossover of confined imidazole, and provides a dynamic environment for recombination of the hydrogen-bond network. As shown in Fig. 6d, protons are transferred along N–H⋯N hydrogen bonds in a hopping manner between imidazole molecules. In the process of proton transfer, the continuous recombination of hydrogen bonds is realized through rotation of the imidazole molecules. Due to the relatively small rotation energy between imidazole molecules, the activation energy required for proton transfer is very low.
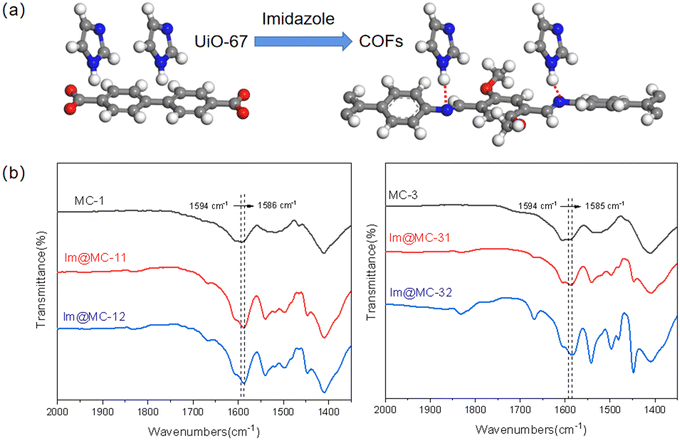
The number and intensity of intermolecular hydrogen-bond networks are the main factors that affect the proton-transfer rate;37 the mobility of protons is expected to become higher and the conduction will increase with the increase in the number and strength of intermolecular hydrogen-bond networks. Here, the imine linker in the COF increases the hydrogen-bonding donation ability of imidazole due to the formation of the heterogeneous channel structure. When the imidazole molecules pass through the heterogeneous interface from UiO-67 to the TAPB–DMTP-COF, as shown in Fig. 7a, the N on the imine linker of the COF ligands forms a hydrogen bond (N–H⋯N) with the H of the imidazole along the channel, which expands the hydrogen bond-network and facilitates the organization of imidazole and further promotes the hopping of protons. The formation of N–H⋯N hydrogen bonds between imidazole and TAPB–DMTP-COFs was confirmed via FTIR measurements (Fig. 7b). The N–C stretching bond in TAPB–DMTP-COFs was shifted to a lower wavenumber and its absorption intensity was also enhanced upon imidazole loading due to the hydrogen bonding between the COF and imidazole.
4. Conclusion
In summary, imidazole was successfully loaded into a core–shell MOF@COFs to prepare a super-ionic conductor. The proton-transport process in the micro-/mesoporous heterogeneous channels was systematically studied. In an anhydrous environment, the proton conductivity of the imidazole@UiO-67@TAPB–DMTP-COF composite was found to exceed 10−2 S cm−1 at 120 °C, and it has an ultra-low activation energy. This outstanding proton conductivity benefits from the unique hierarchical heterogeneous channels of the core–shell MOF@COF complexes. The turnover of restricted imidazole in the channels leads to the breaking and rearrangement of hydrogen bonds, and the conductive behavior of protons follows the Grotthuss mechanism. The optimization of proton migration due to the expansion and enhancement of the hydrogen-bond network across the heterogeneous channels of MOF@COFs accounts for the observed remarkable conductivity. Our results reveal the potential of heterogeneous micro-/mesoporous composites as a platform for super-proton conduction, which is of great significance to its application in fuel cells.Conflicts of interest
The authors declare that there is no competing financial interest.Acknowledgements
This work was supported by the National Natural Science Foundation of China (Grant No. 52062003).References
- H. Chen, F. Y. Dong and S. D. Minteer, Nat. Catal., 2020, 3, 225–244 CrossRef.
- L. Huang, S. Zaman, X. L. Tian, Z. T. Wang, W. S. Fang and B. Y. Xia, Acc. Chem. Res., 2021, 54, 311–322 CrossRef CAS PubMed.
- W. H. Lee, Y. J. Ko, J. H. Kim, C. H. Choi, K. H. Chae, H. Kim, Y. J. Hwang, B. K. Min, P. Strasser and H. S. Oh, Nat. Commun., 2021, 12, 4271–4280 CrossRef CAS PubMed.
- K. Ahmed and K. Foger, Ind. Eng. Chem. Res., 2010, 49, 7239–7256 CrossRef CAS.
- H. Xu, S. S. Tao and D. L. Jiang, Nat. Mater., 2016, 15, 722–726 CrossRef CAS PubMed.
- S. Bureekaew, S. Horike, M. Higuchi, M. Mizuno, T. Kawamura, D. Tanaka, N. Yanai and S. Kitagawa, Nat. Mater., 2009, 8, 831–836 CrossRef CAS PubMed.
- J. A. Dawson, J. A. Miller and I. Tanaka, Chem. Mater., 2015, 27, 901–908 CrossRef CAS.
- P. Sun, Y. Wang, Z. F. Li, H. Guo, X. Y. Yin and H. C. Pei, J. Mater. Sci., 2020, 55, 13075–13084 CrossRef CAS.
- I. Ressam, N. Krins, C. Laberty-Robert, M. Selmane, M. Lahcini, M. Raihane, A. El Kadib, H. Perrot and O. Sel, ChemistrySelect, 2017, 2, 2503–2511 CrossRef CAS.
- J. A. Hurd, R. Vaidhyanathan, V. Thangadurai, C. I. Ratcliffe, I. L. Moudrakovski and G. K. H. Shimizu, Nat. Chem., 2009, 1, 705–710 CrossRef CAS PubMed.
- B. Zhou, J. B. Le, Z. Y. Cheng, X. Zhao, M. Shen, M. L. Xie, B. W. Hu, X. D. Yang, L. W. Chen and H. W. Chen, ACS Appl. Mater. Interfaces, 2020, 12, 8198–8205 CrossRef CAS PubMed.
- Q. Xu, S. S. Tao, Q. H. Jiang and D. L. Jiang, J. Am. Chem. Soc., 2018, 140, 7429–7432 CrossRef CAS PubMed.
- H. B. Luo, Q. Ren, P. Wang, J. Zhang, L. F. Wang and X. M. Ren, ACS Appl. Mater. Interfaces, 2019, 11, 9164–9171 CrossRef CAS PubMed.
- D. Umeyama, S. Horike, M. Inukai, Y. Hijikata and S. Kitagawa, Angew. Chem., Int. Ed., 2011, 50, 11706–11709 CrossRef CAS PubMed.
- J. H. Cavka, S. Jakobsen, U. Olsbye, N. Guillou, C. Lamberti, S. Bordiga and K. P. Lillerud, J. Am. Chem. Soc., 2008, 130, 13850–13851 CrossRef PubMed.
- G. Férey, C. Mellot-Draznieks, C. Serre and F. Millange, Acc. Chem. Res., 2005, 38, 217–225 CrossRef PubMed.
- Y. B. N. Tran, P. T. K. Nguyen, Q. T. Luong and K. D. Nguyen, Inorg. Chem., 2020, 59, 16747–16759 CrossRef CAS PubMed.
- H. Veisi, M. Abrifam, S. A. Kamangar, M. Pirhayati, S. G. Saremi, M. Noroozi, T. Tamoradi and B. Karmakar, Sci. Rep., 2021, 11, 21883–21896 CrossRef CAS PubMed.
- H. T. Wang, H. Y. Zou, Y. Y. Liu, Z. L. Liu, W. S. Sun, K. A. Lin, T. L. Li and S. J. Luo, Sci. Rep., 2021, 11, 21414–21424 CrossRef CAS PubMed.
- P. Cote, A. I. Benin, N. W. Ockwig, M. O'Keeffe, A. J. Matzger and O. M. Yaghi, Science, 2005, 310, 1166–1170 CrossRef PubMed.
- H. Xu, J. Gao and D. L. Jiang, Nat. Chem., 2015, 7, 905–912 CrossRef CAS PubMed.
- T. Zhang, C. W. Gao, W. Huang, Y. L. Chen, Y. Wang and J. M. Wang, Talanta, 2018, 188, 578–583 CrossRef CAS PubMed.
- F. J. Uribe-Romo, J. R. Hunt, H. Furukawa, C. Klock, M. O’Keeffe and O. M. Yaghi, J. Am. Chem. Soc., 2009, 131, 4570–4571 CrossRef CAS PubMed.
- M. Xu, K. Chen, L. Zhu, S. Zhang, M. Wang, L. He, Z. Zhang and M. Du, Langmuir, 2021, 37, 13479–13492 CrossRef CAS PubMed.
- M. K. Cai, Y. L. Li, Q. L. Liu, Z. A. Xue, H. P. Wang, Y. N. Fan, K. L. Zhu, Z. F. Ke, C. Y. Su and G. Q. Li, Adv. Sci., 2019, 6, 1802365 CrossRef PubMed.
- C. P. Guo, F. H. Duan, S. Zhang, L. H. He, M. H. Wang, J. L. Chen, J. Q. Zhang, Q. J. Jia, Z. H. Zhang and M. Du, J. Mater. Chem. A, 2022, 10, 475–507 RSC.
- J. R. Fu, S. Das, G. L. Xing, T. Ben, V. Valtchev and S. L. Qiu, J. Am. Chem. Soc., 2016, 138, 7673–7680 CrossRef CAS PubMed.
- F. Zhang, J. Sheng, Z. Yang, X. Sun, H. Tang, M. Lu, H. Dong, F. Shen, J. Liu and Y. Lan, Angew. Chem., Int. Ed., 2018, 57, 12106–12110 CrossRef CAS PubMed.
- G. Lu, X. Huang, Y. Li, G. Zhao, G. Pang and G. Wang, J. Energy Chem., 2020, 43, 8–15 CrossRef.
- S. C. Liu, Z. F. Yue and Y. Liu, Dalton Trans., 2015, 44, 12976–12980 RSC.
- A. Kawada, J. Chem. Phys., 1970, 52, 3121–3125 CrossRef CAS.
- F. H. Xiang, S. M. Chen, S. H. Zheng, Y. S. Yang, J. L. Huang, Q. J. Lin, L. H. Wang, S. C. Xiang and Z. J. Zhang, ACS Appl. Mater. Interfaces, 2021, 13, 41363–41371 CrossRef CAS PubMed.
- A. Jankowska, A. Zalewska, A. Skalska, A. Ostrowski and S. Kowalak, Chem. Commun., 2017, 53, 2475–2478 RSC.
- J. Li, Z. Z. Wu, H. Li, H. Liang and S. S. Li, New J. Chem., 2018, 42, 1604–1607 RSC.
- J. T. Daycock, G. P. Jones, J. R. N. Evans and J. M. Thomas, Nature, 1968, 218, 672–673 CrossRef CAS PubMed.
- C. Chakraborty, U. Rana, R. K. Pandey, S. Moriyama and M. Higuchi, ACS Appl. Mater. Interfaces, 2017, 9, 13406–13414 CrossRef CAS PubMed.
- S. Li, Y. Z. Liu, L. Li, C. X. Liu, J. N. Li, S. Ashraf, P. F. Li and B. Wang, ACS Appl. Mater. Interfaces, 2020, 12, 22910–22916 CrossRef CAS PubMed.
Footnote |
| † Electronic supplementary information (ESI) available: Additional figures and tables. See DOI: https://doi.org/10.1039/d2ma00580h |
| This journal is © The Royal Society of Chemistry 2022 |

