
 Open Access Article
 This Open Access Article is licensed under a
 Creative Commons Attribution 3.0 Unported Licence
Black single crystals of lead-free perovskite Cs2Ag(Bi:Ru)Br6 with an intermediate band†
Zehao
Zhang‡
a,
Ganghong
Liu‡
a,
Wenhui
Guo‡
a,
Xiangdong
Li
a,
Yuqing
Zhang
a,
Cuncun
Wu
b,
Bo
Qu
 *a,
Jun-jie
Shi
a,
Zhijian
Chen
*a and
Lixin
Xiao
*a
*a,
Jun-jie
Shi
a,
Zhijian
Chen
*a and
Lixin
Xiao
*a
aState Key Laboratory for Mesoscopic Physics and Department of Physics, Peking University, Beijing 100871, China. E-mail: bqu@pku.edu.cn; zjchen@pku.edu.cn; lxxiao@pku.edu.cn
bSchool of Materials Science and Engineering, State Key Laboratory of Reliability and Intelligence of Electrical Equipment, Hebei University of Technology, Tianjin 300130, China
First published on 9th May 2022
Abstract
The toxicity of lead halide perovskites hinders their application in optoelectronics. Lead-free Cs2AgBiBr6 is regarded as a promising candidate due to its excellent photoelectric properties. However, its excessively wide band gap limits its absorption in the visible region. Herein, we incorporated the transition metal Ru3+ into Cs2AgBiBr6 and obtained black single crystals by a hydrothermal method. The absorption edge was extended from ∼660 nm to the near-infrared region (∼1200 nm). When 1.8% of Ru was doped, the double perovskite structure was still maintained and the lattice shrank since some Bi3+ was replaced by smaller Ru3+. Theoretical calculation indicates that after Ru-doping, a new intermediate band was generated inside the pristine band gap of Cs2AgBiBr6 as experimentally confirmed by Valence Band X-ray Photoelectron Spectroscopy. The intermediate band lies below the Fermi surface and is mainly dominated by the Ru-d orbital. Moreover, with the fabrication of a near-infrared (NIR) photodetector, a NIR response from the Ru-doped Cs2AgBiBr6 was realized. This work provides an effective way of regulating the energy band structure of Cs2AgBiBr6 and extends the application of lead-free perovskites for optoelectronic devices, such as NIR detectors and intermediate band solar cells.
1. Introduction
Lead halide perovskites have rapidly advanced in the field of optoelectronics due to their adjustable bandgaps,1 long carrier diffusion length,2 high defect tolerance3 and low-cost process.4 However, the toxicity of water-soluble Pb2+ hinders their broad application.5 The research of low-toxicity elements to replace Pb has become more attractive for the development of next generation perovskites. The Sn-based perovskite that uses Sn2+ to replace Pb2+ exhibits extremely good photoelectric properties, but Sn2+ is easily oxidized to Sn4+.6,7 In addition, most of the perovskite derivatives including 2D A3B23+X9,8 0D A2B4+X69 and 0D A3B23+X910 (A: Cs+, MA+, FA+; B: metal ions; X: Cl−, Br−, I−) have slightly worse optoelectronic properties, due to lower electronic dimensions, large effective mass and poor carrier transport capabilities.11–14 Recently, 3D double perovskites (A2B+B3+X6), especially Cs2AgBiBr6, are considered to be promising candidates for photovoltaics15,16 and detectors,17,18 due to their intrinsic thermodynamic stability and small carrier effective masses.19 However, compared with lead halide perovskites, the excessively wide band gap of Cs2AgBiBr615,20 provides inferior light absorption, which severely limits its application in the photovoltaic field. Therefore, exploring effective strategies to expand its optical absorption is crucial to the development of highly efficient photovoltaics and detectors.Element doping is an effective method to modulate the band structure of a semiconductor. According to previous reports,21,22 however, it is not successful in achieving a narrower band gap through A-site or X-site doping. Therefore, more research groups focus on B-site doping. Karunadasa et al. reduced the band gap of Cs2AgBiBr6 through Tl-doping, and the indirect band gap reaches about 1.4 eV (∼890 nm).23 However, Tl is highly toxic. In their subsequent work, non-toxic but unstable Sn2+ was selected as the doping element, and the band gap of the double perovskite was also significantly reduced, with the indirect band gap reaching 1.48 eV (∼840 nm).24 In addition, there are some reports that Sb-doping can also reduce the band gap to a certain extent.25,26 Gao et al. successfully broadened the absorption edge of Cs2AgBiBr6 to the near-infrared (NIR) region to ∼860 nm via Cu-doping.27 However, according to their experimental results, Cu cannot enter the crystal lattice of Cs2AgBiBr6, and it is also difficult to change the band structure of the double perovskite. The shift of the absorption edge after doping is due to the introduction of sub-bandgap states. Their group also successfully incorporated Fe3+ into Cs2AgInCl6 to realize the red shift of the absorption edge to about 800 nm.28 In addition, they also successfully incorporated Fe3+ into Cs2AgBiBr6 and developed new spintronic materials.29 It is worth noting that based on their sample photos, the original red single crystal changed to black after Fe3+ doping and its absorption tailing reaches ∼800 nm.29 Searching for a stable and non-toxic element to effectively extend the absorption of Cs2AgBiBr6 remains challenging.
In previous work,30 we successfully incorporated Fe into Cs2AgBiBr6 to extend the absorption to the NIR region. As a congener of Fe, Ru has a wide application in dye-sensitized solar cells (DSSC), e.g., N719 dye is a Ru complex.31 Gu et al. reported on the incorporation of Ru3+ into Cs3Bi2I9 to replace partial Bi3+ and experimentally confirmed the feasibility of Ru3+ replacing Bi3+ in perovskite crystals.32 Although Fe and Ru, from the same family, have similar characteristics, they differ in electron configuration (Fe: 3d64s2, Ru: 4d75s1), electronegativity (Ru: 2.2, Fe: 1.8) and ion size.33 To investigate the doping thermodynamic process, we studied the Ru-doping effect on double perovskite. In this work, we successfully doped Ru3+ into Cs2AgBiBr6 to partially replace Bi3+ to form Cs2Ag(Bi:Ru)Br6 and obtained black single crystals. Benefiting from the similar properties, Cs2Ag(Bi:Ru)Br6 has similar characteristics to the Fe-doped one. The absorption edge of Cs2Ag(Bi:Ru)Br6 was extended to ∼1200 nm and the lattice shrunk. Theoretical calculation indicates that after the introduction of Ru3+, a new intermediate band, which was mainly dominated by the Ru-d orbital, was generated inside the pristine band gap. Due to the different electronegativity and ionic size of Fe and Ru, the bond lengths of Ru–Br and Fe–Br in metal bromide are different, which are 2.5 Å and 2.4 Å, respectively. Meanwhile, the bond length of Bi–Br is 2.9 Å. (Crystal data is referenced from mp-22892, mp-752602 and mp-23232, MaterialsProject). Compared with Fe–Br, the bond length of Ru–Br is closer to Bi–Br, so Ru can more easily replace Bi in the lattice than Fe. Therefore, doping can be achieved with Ru at a lower concentration in the precursor. Furthermore, the intermediate band lies below the Fermi surface. Finally, we observed experimentally the existence of the intermediate band by Valence Band X-ray Photoelectron Spectroscope (VB-XPS), revealing that the intermediate band is located at a position about 1 eV above the original valence band maximum (VBM). Cs2Ag(Bi:Ru)Br6 has the potential to be applied in intermediate band solar cells, which may break the Shockley–Queisser limit.34 In addition, a NIR response was observed for Cs2Ag(Bi:Ru)Br6 single crystal, indicating its potential application in NIR detection and other optoelectronic fields.
2. Results and discussion
Ru-doped Cs2AgBiBr6 single crystals (shown in Fig. 1a) were synthesized by a hydrothermal method. The doping level of Ru was tuned by different amounts of RuBr3 in the precursor solution. We named samples according to the molar ratio of Ru (Ru/(Ru + Bi)) in the precursor, e.g., Ru-5 means Ru/(Ru + Bi) × 100% = 5%. And Ru-0 is pristine Cs2AgBiBr6 without Ru-doping. It can be clearly seen that Ru doping causes the single crystals to gradually change their colour from red to black, i.e., Ru-0.5, Ru-0.7, Ru-1, Ru-3 and Ru-5, as shown in Fig. 1. The molar ratio of Ru in the precursor solution does not represent the specific ratio of Ru in the resultant single crystal. Therefore, we used inductively coupled plasma optical emission spectrometry (ICP-OES) to determine the specific molar ratio of Ru in the single crystal. The data is shown in Table S1 (ESI†). Since Ag and Br will form AgBr precipitates during the digestion process, the content of Ag and Br is not measured. This result indicates that Ru actually replaced about 0.30%, 1.07% and 1.85% of Bi in Ru-1, Ru-3 and Ru-5, respectively. Since the concentration of Ru-doping in Ru-0.7 is ultra-low, the actual content of Ru is hardly measured. According to the absorption spectrum (Fig. 1b), the absorption edge of Ru-0 is at about 630 nm, which is consistent with the previous reports.15,20 After introducing Ru-dopants, the absorption spectra of the samples changed significantly. The absorption edges of Ru-3 and Ru-5 were very close, as shown in Fig. S1 (ESI†). For Ru-5, the new absorption edge was located close to 1200 nm.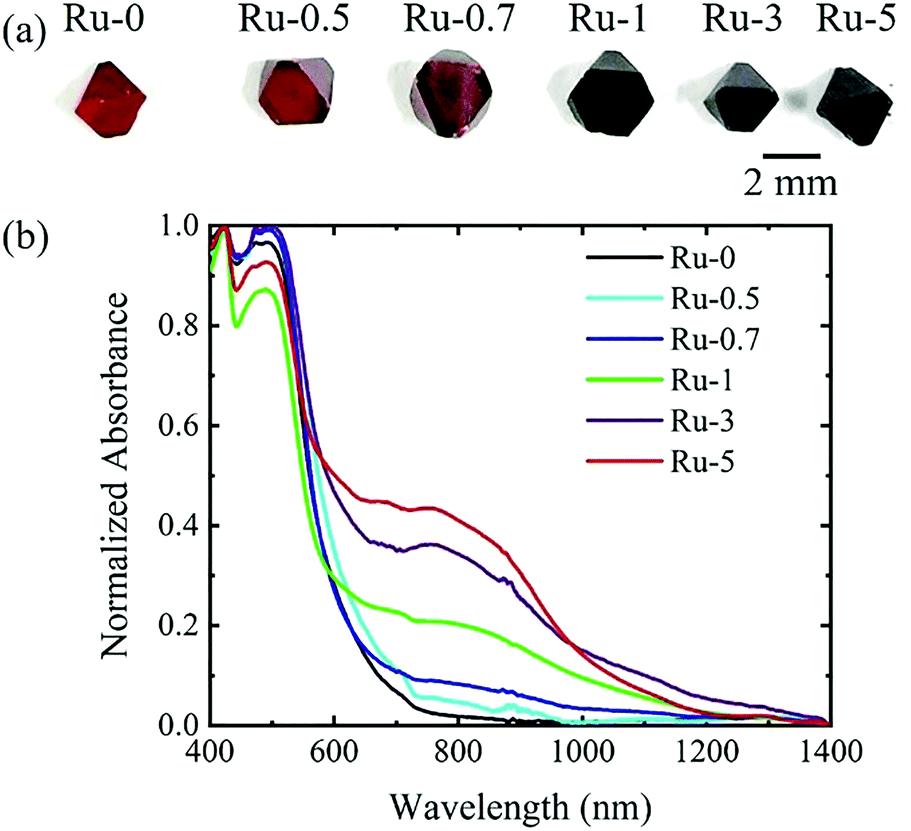 | ||
| Fig. 1 (a) Photographs and (b) the normalized absorption of the samples. | ||
However, by characterizing the PL spectrum of the sample (Fig. S2, ESI†), it is found that the peak position was basically unchanged. However, after Ru doping, the PL peaks of the samples were obviously weakened, indicating that the doping brought defects and led to the enhancement of non-radiative recombination.
XRD measurement was carried out to study the effect of Ru doping on the crystal structure of the double perovskite. According to the XRD patterns (Fig. 2), the crystals of Ru-1, 3 and 5 have a double perovskite structure (Fig. 2a), and their diffraction peaks (220) shift towards a larger angle than that of Ru-0 (Fig. 2b). According to the Bragg equation, a larger diffraction angle means a smaller lattice constant. This lattice shrink phenomenon is caused by the partial replacement of Bi3+ (1.03 Å) by the smaller Ru3+ (0.68 Å).33 As the doping concentration increases, the lattice shrinkage is enhanced. The specific lattice constants are shown in Table S2 (ESI†). Ru-5 is the sample with the largest doping concentration we can get, and thus the following discussion will focus on Ru-5.
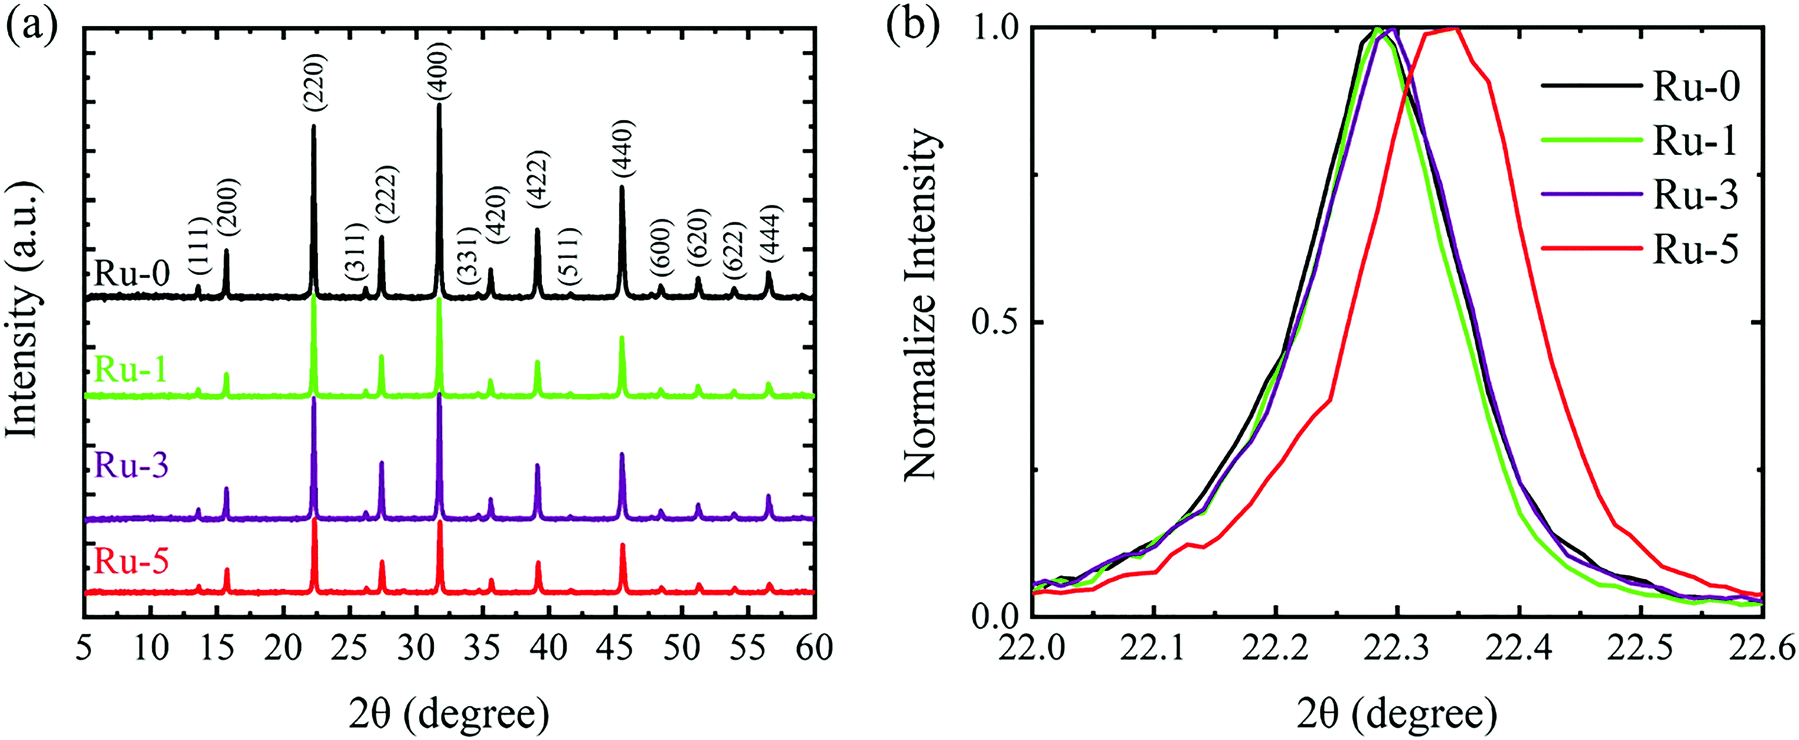 | ||
| Fig. 2 (a) XRD patterns of Cs2Ag(Bi:Ru)Br6. (b) An expansion of the diffraction peak of (220). | ||
To further clarify the effect of Ru-doping on the band structure of the double perovskite and to find out the reason for the change in the absorption spectra, we carried out DFT calculations to study the energy band structure. The simulated crystal structure of Cs2Ag(Bi:Ru)Br6 is shown in Fig. S3 (ESI†). The calculated lattice constant of (11.292 Å) Cs2AgBiBr6 is consistent with the experimental one (11.280 Å), as listed in Table S2 (ESI†). And the experimental and calculated XRD spectra are accordant (Fig. S4, ESI†). The aforementioned results ensure the calculating precision generally. To reduce computational cost, we constructed some small models that were sufficient to describe the effects of Ru doping. For Cs2AgBiBr6, we observed bandgap underestimation (Fig. 3a) which was consistent with previous reports.24Fig. 3b shows that the calculated band gap of Cs2AgBiBr6 is reduced after 25% Ru-doping, which stems from the huge effect on the band structure of Ru. A new energy band appeared after Ru doping, which we named the intermediate band. Obviously, the intermediate band below the Fermi level is dominated by Ru-d orbitals mainly (Fig. S5, ESI†), which causes additional transition channels from the intermediate band to the unoccupied bands. The intermediate band is quite flat, which would lead to high photo-carrier effective mass and small mobility, i.e., the transport property of Cs2AgBiBr6 weakens after Ru-doping. To further discuss the effect of Ru-doping concentration on the band structure of Cs2Ag(Bi:Ru)Br6, we calculate the band structures of Cs2Ag(Bi1Ru0)Br6, Cs2Ag(Bi0.75Ru0.25)Br6, Cs2Ag(Bi0.5Ru0.5)Br6 and Cs2Ag(Bi0.25Ru0.75)Br6, as exhibited in Fig. S6 (ESI†). The energy difference between the intermediate band and CBM decreased with the increase of the Ru doping concentration. The energy level of the intermediate band remains almost constant near the Fermi level for various Ru-doping concentrations. A similar phenomenon was also found in our previous report on Fe-doped Cs2AgBiBr6.30 Therefore, we have abundant proof that there is also such an intermediate band in Cs2Ag(Bi:Ru)Br6, which lead to absorption in NIR region.
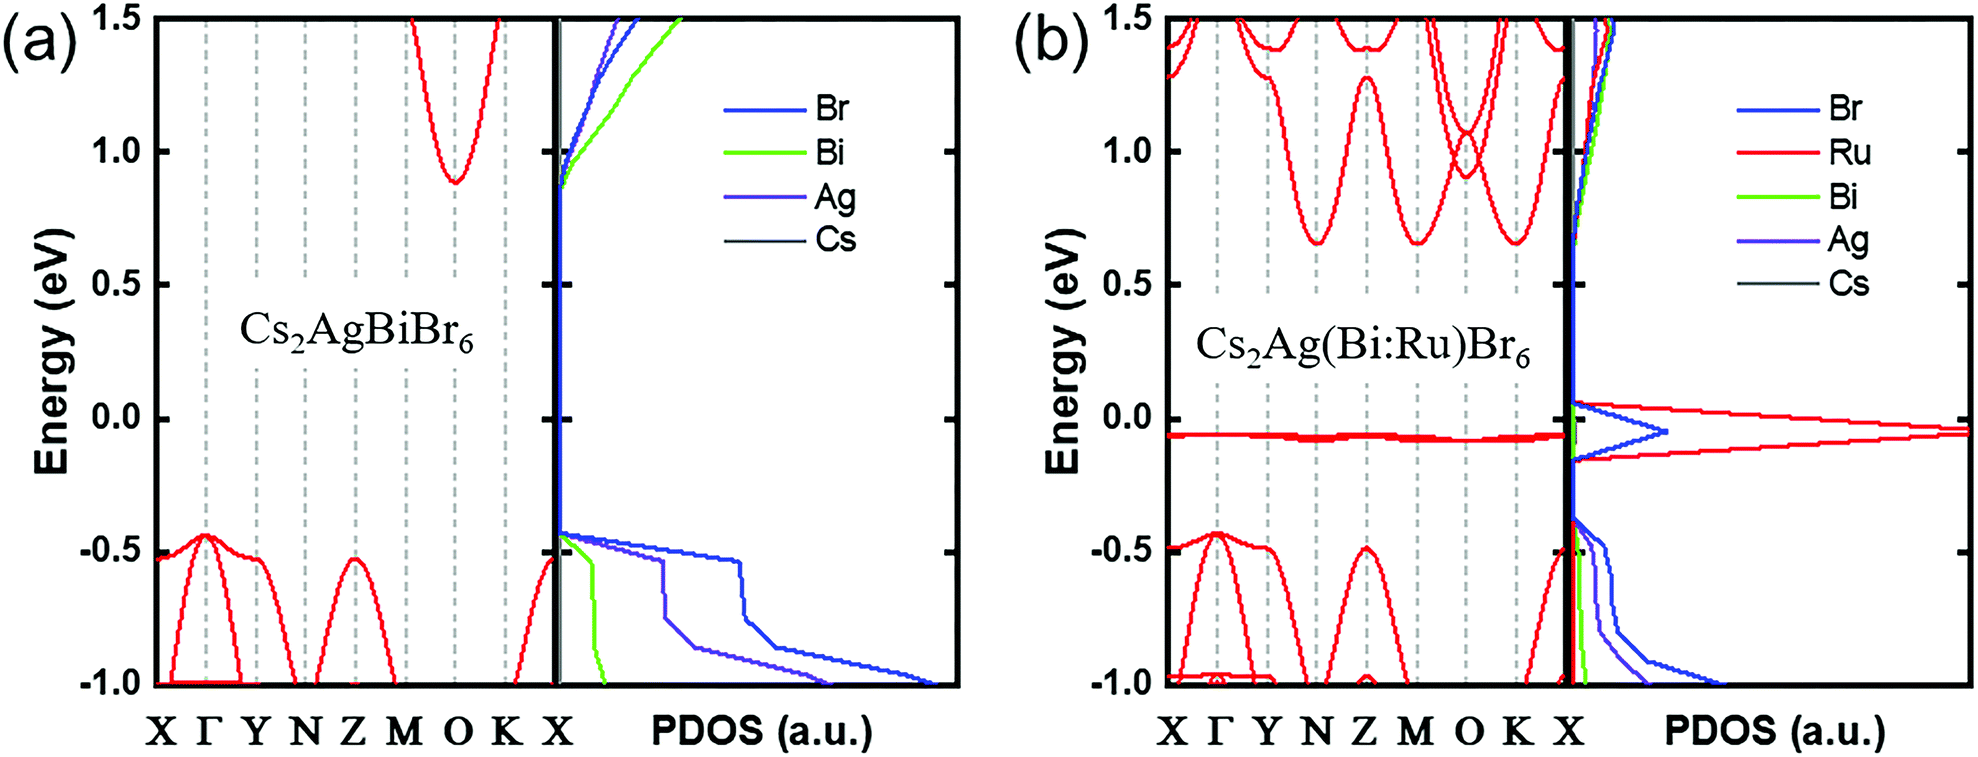 | ||
| Fig. 3 The calculated band structures and partial density of states (PDOS) of (a) Cs2AgBiBr6 and (b) Cs2Ag(Bi0.75Ru0.25)Br6. The Fermi level is set at 0 eV. | ||
VB-XPS was used to confirm experimentally the influence of Ru-doping on the band structure (Fig. 4). The bands with binding energy less than 8 eV show obvious changes (Fig. 4b). In the case of Cs2AgBiBr6, two signal peaks with binding energies of 3.91 eV and 5.64 eV were observed, respectively (Fig. 4c). There are three signal peaks in the spectrum of Ru-5, corresponding to three energy levels with binding energies of 2.74 eV, 3.72 eV and 5.54 eV, respectively (Fig. 4d). Therefore, the intermediate band after Ru-doping was experimentally confirmed at the position of ∼1 eV above the original VBM. It is the intermediate band that causes the absorption edge to redshift towards the NIR region. Materials with intermediate bands have been proposed to fabricate intermediate band solar cells, which may break the Shockley-Queisser efficiency limitation.34
 | ||
| Fig. 4 (a) The VB-XPS spectrum of Ru-0 and Ru-5. (b) An expansion of the region with binding energy below 8 eV. The multi-peak fitting of the spectra of (c) Ru-0 and (d) Ru-5. | ||
The transition process of Ru-doped samples is shown in Fig. 5a. Process (1) is the transition from the VBM to the CBM of Cs2AgBiBr6 constituting the visible part of the absorption spectrum, and process (2) is the transition from the intermediate band to the CBM constituting the near-infrared part of the absorption spectrum. The data of VBM and CBM are referenced from our previous work.15 Motivated by the absorption of Ru-doping samples in the NIR region, we fabricated the device by evaporating Au electrodes on a single crystal of Ru-5. For comparison, a device based on Ru-0 was also manufactured. The schematic diagram of the devices is shown in Fig. 5b. The Volt-Ampere characteristic curves of the devices are shown in Fig. 5c and d. It can be clearly observed that the dark current of the devices after Ru-doping is significantly reduced and there is a clear photoelectric response at 980 nm (the longest wavelength of light source available in our lab). However, the Cs2AgBiBr6 device has no photoelectric conversion capability for 980 nm, but it is suitable for UV and visible light detection as reported in our previous work.17 Thus, Cs2Ag(Bi:Ru)Br6 shows potential for a lead-free perovskite infrared detector.
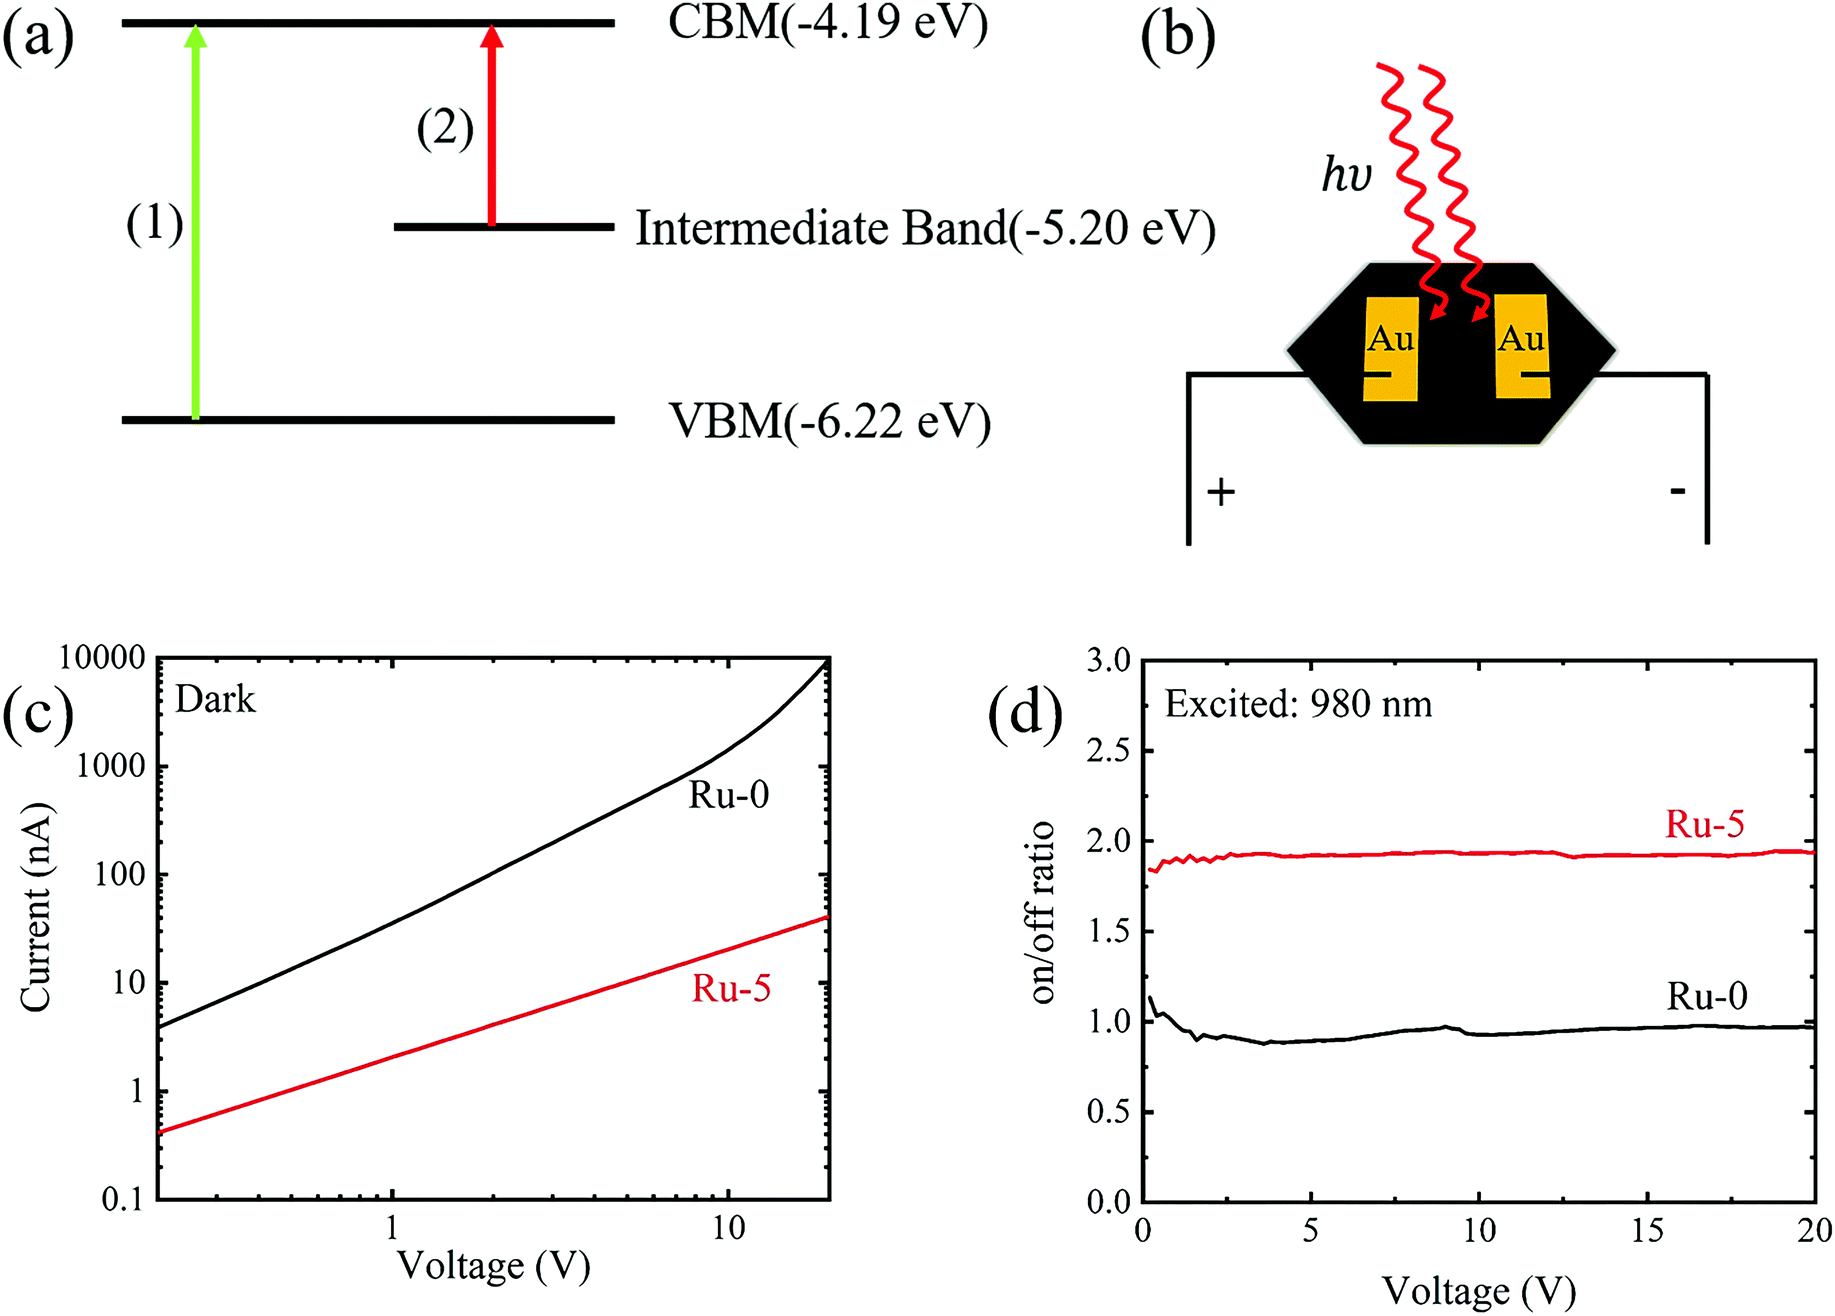 | ||
| Fig. 5 (a) Schematic illustration of the transition process of the Ru-doping samples. (b) Schematic diagram of the devices. (c) The Volt-Ampere characteristic curves of the devices under dark conditions. (d) On/off ratios of the devices under 980 nm. | ||
3. Conclusion
Similar to Fe doping, we have successfully obtained black single crystals and extended the absorption edge of Cs2AgBiBr6 to the NIR region (∼1200 nm) with an intermediate band via incorporating transition metal Ru. The partial substitution of Bi by Ru (<2 mol.%) led to the crystal lattice shrinking. The intermediate band, mainly dominated by Ru-d orbitals, resulted in the absorption redshift. However, due to the difference of Ru and Fe, Ru is more easily doped into Cs2AgBiBr6, and the position of the intermediate band is below the Fermi surface. Moreover, we experimentally confirmed that the intermediate band was located at ∼1 eV above the original VBM of Cs2AgBiBr6 by VB-XPS. The confirmed NIR photoelectric response implied the potential application for intermediate band solar cells and NIR photodetectors. Our work provides an efficient method to reduce the band gap of lead-free perovskites, and extending the optoelectronic response to the NIR region.4. Experimental Methods
The experimental section is provided in the ESI.†Author contributions
Zehao Zhang, Ganghong Liu and Wenhui Guo contributed equally.Conflicts of interest
The authors declare no competing financial interest.Acknowledgements
This work was supported by the National Natural Science Foundation of China (12174013, 61935016, 52173153, 12074011, 62104059). The DFT calculations are supported by the High-performance Computing Platform of Peking University.References
- J. H. Noh, S. H. Im, J. H. Heo, T. N. Mandal and S. I. Seok, Nano Lett., 2013, 13, 1764–1769 CrossRef CAS PubMed.
- G. Xing, N. Mathews, S. Sun, S. S. Lim, Y. M. Lam, M. Grätzel, S. Mhaisalkar and T. C. Sum, Science, 2013, 342, 344 CrossRef CAS PubMed.
- C. Ran, J. Xu, W. Gao, C. Huang and S. Dou, Chem. Soc. Rev., 2018, 47, 4581–4610 RSC.
- X. Li, D. Bi, C. Yi, J.-D. Décoppet, J. Luo, S. M. Zakeeruddin, A. Hagfeldt and M. Grätzel, Science, 2016, 353, 58 CrossRef CAS PubMed.
- A. Babayigit, A. Ethirajan, M. Muller and B. Conings, Nat. Mater., 2016, 15, 247–251 CrossRef CAS PubMed.
- C. Wang, F. Gu, Z. Zhao, H. Rao, Y. Qiu, Z. Cai, G. Zhan, X. Li, B. Sun, X. Yu, B. Zhao, Z. Liu, Z. Bian and C. Huang, Adv. Mater., 2020, 32, 1907623 CrossRef CAS PubMed.
- N. K. Noel, S. D. Stranks, A. Abate, C. Wehrenfennig, S. Guarnera, A.-A. Haghighirad, A. Sadhanala, G. E. Eperon, S. K. Pathak, M. B. Johnston, A. Petrozza, L. M. Herz and H. J. Snaith, Energy Environ. Sci., 2014, 7, 3061–3068 RSC.
- B. Saparov, F. Hong, J.-P. Sun, H.-S. Duan, W. Meng, S. Cameron, I. G. Hill, Y. Yan and D. B. Mitzi, Chem. Mater., 2015, 27, 5622–5632 CrossRef CAS.
- B. Lee, A. Krenselewski, S. I. Baik, D. N. Seidman and R. P.-H. Chang, Sustainable Energy Fuels, 2017, 1, 710–724 RSC.
- B.-W. Park, B. Philippe, X. Zhang, H. Rensmo, G. Boschloo and E. M.-J. Johansson, Adv. Mater., 2015, 27, 6806–6813 CrossRef CAS PubMed.
- W. Ning and F. Gao, Adv. Mater., 2019, 31, 1900326 CrossRef PubMed.
- C. Wu, Q. Zhang, G. Liu, Z. Zhang, D. Wang, B. Qu, Z. Chen and L. Xiao, Adv. Energy Mater., 2020, 10, 1902496 CrossRef CAS.
- Z. Xiao, W. Meng, J. Wang, D. B. Mitzi and Y. Yan, Mater. Horiz., 2017, 4, 206–216 RSC.
- Z. Jin, Z. Zhang, J. Xiu, H. Song, T. Gatti and Z. He, J. Mater. Chem. A, 2020, 8, 16166–16188 RSC.
- C. Wu, Q. Zhang, Y. Liu, W. Luo, X. Guo, Z. Huang, H. Ting, W. Sun, X. Zhong, S. Wei, S. Wang, Z. Chen and L. Xiao, Adv. Sci., 2018, 5, 1700759 CrossRef PubMed.
- W. Ning, F. Wang, B. Wu, J. Lu, Z. Yan, X. Liu, Y. Tao, J.-M. Liu, W. Huang, M. Fahlman, L. Hultman, T. C. Sum and F. Gao, Adv. Mater., 2018, 30, 1706246 CrossRef PubMed.
- C. Wu, B. Du, W. Luo, Y. Liu, T. Li, D. Wang, X. Guo, H. Ting, Z. Fang, S. Wang, Z. Chen, Y. Chen and L. Xiao, Adv. Opt. Mater., 2018, 6, 1800811 CrossRef.
- M. Keshavarz, E. Debroye, M. Ottesen, C. Martin, H. Zhang, E. Fron, R. Küchler, J. A. Steele, M. Bremholm, J. Van de Vondel, H. I. Wang, M. Bonn, M. B.-J. Roeffaers, S. Wiedmann and J. Hofkens, Adv. Mater., 2020, 32, 2001878 CrossRef CAS PubMed.
- X.-G. Zhao, J.-H. Yang, Y. Fu, D. Yang, Q. Xu, L. Yu, S.-H. Wei and L. Zhang, J. Am. Chem. Soc., 2017, 139, 2630–2638 CrossRef CAS PubMed.
- A. H. Slavney, T. Hu, A. M. Lindenberg and H. I. Karunadasa, J. Am. Chem. Soc., 2016, 138, 2138–2141 CrossRef CAS PubMed.
- Z. Zhang, C. Wu, D. Wang, G. Liu, Q. Zhang, W. Luo, X. Qi, X. Guo, Y. Zhang, Y. Lao, B. Qu, L. Xiao and Z. Chen, Org. Electron., 2019, 74, 204–210 CrossRef CAS.
- Z. Yu, Y. Wenjin, Z. Lixiu, W. Cuncun, X. Lixin and D. Liming, J. Semicond., 2021, 42, 120202–120203 CrossRef.
- A. H. Slavney, L. Leppert, D. Bartesaghi, A. Gold-Parker, M. F. Toney, T. J. Savenije, J. B. Neaton and H. I. Karunadasa, J. Am. Chem. Soc., 2017, 139, 5015–5018 CrossRef CAS PubMed.
- K. P. Lindquist, S. A. Mack, A. H. Slavney, L. Leppert, A. Gold-Parker, J. F. Stebbins, A. Salleo, M. F. Toney, J. B. Neaton and H. I. Karunadasa, Chem. Sci., 2019, 10, 10620–10628 RSC.
- K.-z Du, W. Meng, X. Wang, Y. Yan and D. B. Mitzi, Angew. Chem., Int. Ed., 2017, 56, 8158–8162 CrossRef CAS PubMed.
- E. M. Hutter, M. C. Gélvez-Rueda, D. Bartesaghi, F. C. Grozema and T. J. Savenije, ACS Omega, 2018, 3, 11655–11662 CrossRef CAS PubMed.
- F. Ji, Y. Huang, F. Wang, L. Kobera, F. Xie, J. Klarbring, S. Abbrent, J. Brus, C. Yin, S. I. Simak, I. A. Abrikosov, I. A. Buyanova, W. M. Chen and F. Gao, Adv. Funct. Mater., 2020, 30, 2005521 CrossRef CAS.
- F. Ji, F. Wang, L. Kobera, S. Abbrent, J. Brus, W. Ning and F. Gao, Chem. Sci., 2021, 12, 1730–1735 RSC.
- W. Ning, J. Bao, Y. Puttisong, F. Moro, L. Kobera, S. Shimono, L. Wang, F. Ji, M. Cuartero, S. Kawaguchi, S. Abbrent, H. Ishibashi, R. De Marco, A. Bouianova Irina, A. Crespo Gaston, Y. Kubota, J. Brus, Y. Chung Duck, L. Sun, M. Chen Weimin, G. Kanatzidis Mercouri and F. Gao, Sci. Adv., 2020, 6, eabb5381 CrossRef CAS PubMed.
- G. Liu, Z. Zhang, C. Wu, Y. Zhang, X. Li, W. Yu, G. Yao, S. Liu, J.-J. Shi, K. Liu, Z. Chen, L. Xiao and B. Qu, Adv. Funct. Mater., 2021, 2109891 Search PubMed.
- J. M. Kroon, N. J. Bakker, H. J.-P. Smit, P. Liska, K. R. Thampi, P. Wang, S. M. Zakeeruddin, M. Grätzel, A. Hinsch, S. Hore, U. Würfel, R. Sastrawan, J. R. Durrant, E. Palomares, H. Pettersson, T. Gruszecki, J. Walter, K. Skupien and G. E. Tulloch, Prog. Photovoltaics Res. Appl., 2007, 15, 1–18 CrossRef CAS.
- J. Gu, G. Yan, Y. Lian, Q. Mu, H. Jin, Z. Zhang, Z. Deng and Y. Peng, RSC Adv., 2018, 8, 25802–25807 RSC.
- R. D. Shannon, Acta Crystallogr., Sect. A: Cryst. Phys., Diffr., Theor. Gen. Crystallogr., 1976, 32, 751–767 CrossRef.
- A. S. Brown and M. A. Green, J. Appl. Phys., 2003, 94, 6150–6158 CrossRef CAS.
Footnotes |
| † Electronic supplementary information (ESI) available: The experimental details, the data of ICP-OES, lattice constants and the additional figures of XRD patterns. Simulated lattice structure used in calculations and the partial density of states of Ru-s/p/d. See DOI: https://doi.org/10.1039/d2ma00264g |
| ‡ These authors contributed equally. |
| This journal is © The Royal Society of Chemistry 2022 |