 Open Access Article
Organic charge transfer complex at the boundary between superconductors and insulators: critical role of a marginal part of the conduction pathways†
Toshio
Naito
 *abc,
Hayato
Takeda
a,
Yusuke
Matsuzawa
a,
Megumi
Kurihara
a,
Akio
Yamada
a,
Yusuke
Nakamura
a and
Takashi
Yamamoto
abc
aGraduate School of Science and Engineering, Ehime University, Matsuyama 790-8577, Japan. E-mail: tnaito@ehime-u.ac.jp
bGeodynamics Research Center (GRC), Ehime University, Matsuyama 790-8577, Japan
cResearch Unit for Development of Organic Superconductors, Ehime University, Matsuyama 790-8577, Japan
First published on 14th December 2021
Abstract
κ-ET2Cu[N(CN)2]I (ET = bis(ethylenedithio)tetrathiafulvalene) has previously been reported as both a superconductor and an insulator. Examination of each single crystal revealed that the electrical properties are affected by slight differences in the conformation of one of the ethylene groups of ET, which is not involved in the conduction pathways.
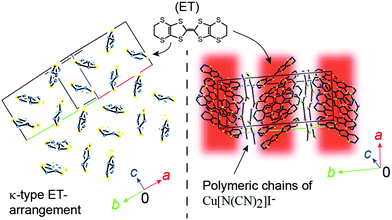
Among the numerous existing conducting and magnetic materials, molecular crystalline materials provide a unique group of compounds with novel electronic states and peculiar physical properties. They comprise both organic and inorganic components, and often exhibit characteristics of ionic, molecular, and metallic crystals. The examples of such materials include organic charge transfer complexes (OCTCs).1 Among the OCTCs, there is a major group of compounds sharing a characteristic molecular arrangement called κ-type (Fig. 1), where a pair (“dimer”) of π-conjugated radical cations facing towards each other are arranged in such a manner that the molecular planes of adjacent dimers are nearly orthogonal to each other. The κ-type OCTCs (κ-OCTCs) are extensively studied as they exhibit various types of conducting behaviour. For example, κ-OCTCs include superconductors that exhibit TCs of ∼10 K, which is among the highest TCs in organic compounds; conversely, they also include Mott insulators, which exhibit conducting properties that are completely opposite to superconductors, despite the similarities in their crystal structures.2 The complicated relationship between the crystal structure and electrical properties in κ-OCTCs is widely observed. This relationship is a challenging problem that needs to be addressed; however, it is also the key to revealing the mechanism of superconductivity. An apparent advantage of κ-OCTCs lies in the rich variety of closely related compounds possessing well-defined crystal and band structures, allowing for a comparative study based on the systematic variation of their conducting and structural properties. Several pressure–temperature (P–T) and other related phase diagrams for κ-OCTCs have been reported, which account for the observed physical properties at the semi-quantitative level.3 These phase diagrams are associated with those of significantly different types of superconductors, such as high-TC cuprates, suggesting a universal mechanism of superconductivity.4 However, a well-known exception, κ-ET2Cu[N(CN)2]I (1, Fig. 1; ET = bis(ethylenedithio)tetrathiafulvalene), was previously controversially reported to remain an insulator (T ≥ 1.1 K and P ≤ 5.2 kbar)5n,u,r as well as a superconductor (TC ∼ 8 K at P > 0.1 GPa)5m under identical thermodynamic conditions (1.1 to ∼ 8 K at 0.1 GPa (= 1 kbar)–5.2 kbar), as no definitive differences were found between the two samples.5 Although the electrical behaviour of single crystals of 1 is anticipated to follow the abovementioned universal phase diagrams for κ-OCTCs, the observed behaviour was substantially different from the trend in the phase diagrams, which was attributed to differences in lattice softness and are strongly influenced by short C–H⋯donor and C–H⋯anion contacts.5u The electrical behaviour of single crystals of 1 was reported to exhibit sample dependencies, which was related to differences in superstructures between crystals.5j More exactly, based on the Laue photographs and electrical resistivity measurements, the authors concluded that the qualitative differences in electrical behaviour should originate from differences in the degree of (dis)order between crystals,5j which is consistent with the electrical resistivity measurements under hydrostatic pressures.5k Coexistence of insulating and superconducting phases, and that of two superconducting phases (TC ∼ 5 K and ∼7 K) were observed by the resistivity measurements under uniaxial strain,5g which is consistent with uniaxial thermal expansion anisotropy observed in 1.5q Apart from the inconsistency on the observed electrical behaviour, many of the previous studies suggest or indicate the importance of the ethylene group disorder in 15u,v,j to interpret the complicated and puzzling electrical behaviour of this salt.
In the present study, in addition to charge and spin degrees of freedom in the conduction pathways, and effect of superstructures on the energy band, we show that a quantitative difference in the conformation of disordered ethylene groups, located at a marginal part of the conduction pathway, also plays a crucial role in the qualitative electrical behaviour.
Pure grade chemicals were purchased and used without purification, unless otherwise noted. Single crystals of 1 were prepared by galvanostatic (2.5–5.0 μA cm−2) electrolysis of a CH2Cl2 (Nacalai Tesque, Spectrum Grade) solution containing ET (Tokyo Chemical Industry, ground in an agate mortar immediately before use), Na[N(CN)2] (Tokyo Chemical Industry), CuI (Wako), and 18-crown-6 (Wako, dried prior to use) in a molar ratio of 1![[thin space (1/6-em)]](https://www.rsc.org/images/entities/char_2009.gif) :
:![[thin space (1/6-em)]](https://www.rsc.org/images/entities/char_2009.gif) 4
4![[thin space (1/6-em)]](https://www.rsc.org/images/entities/char_2009.gif) :
:![[thin space (1/6-em)]](https://www.rsc.org/images/entities/char_2009.gif) 4
4![[thin space (1/6-em)]](https://www.rsc.org/images/entities/char_2009.gif) :
:![[thin space (1/6-em)]](https://www.rsc.org/images/entities/char_2009.gif) 6, under N2 atmosphere at 35 °C, until black shiny platelets formed on the platinum electrode and/or at the bottom of the cell (∼two weeks) (Table S1, ESI†). Large rhombus platelets were selected to confirm crystal quality and identify the lattice parameters using X-ray oscillation photographs. Crystals of good quality were cut into fragments, and those originating from the same single crystals were subjected to X-ray structural analysis (296 and 100 K) and electrical resistivity measurements (2–300 K; Quantum Design PPMS-9) in parallel, the details of which are described in the ESI.† Crystals collected from the same single crystals exhibited nearly identical electrical behaviours (Fig. S1, ESI†) and crystal structures. Meanwhile, we could not find any correlation between electrical behaviour and batches, or any correlation between the values of R and batches. Thus, we will not refer to the differences of batches in the discussion below. The cooling rates down to 100 K were generally applied to the X-ray and resistivity measurements, which were –1 and –10 K min−1 in the slow and fast cooling processes, respectively (Scheme S1, Fig. S5 and Table S6, ESI†).
6, under N2 atmosphere at 35 °C, until black shiny platelets formed on the platinum electrode and/or at the bottom of the cell (∼two weeks) (Table S1, ESI†). Large rhombus platelets were selected to confirm crystal quality and identify the lattice parameters using X-ray oscillation photographs. Crystals of good quality were cut into fragments, and those originating from the same single crystals were subjected to X-ray structural analysis (296 and 100 K) and electrical resistivity measurements (2–300 K; Quantum Design PPMS-9) in parallel, the details of which are described in the ESI.† Crystals collected from the same single crystals exhibited nearly identical electrical behaviours (Fig. S1, ESI†) and crystal structures. Meanwhile, we could not find any correlation between electrical behaviour and batches, or any correlation between the values of R and batches. Thus, we will not refer to the differences of batches in the discussion below. The cooling rates down to 100 K were generally applied to the X-ray and resistivity measurements, which were –1 and –10 K min−1 in the slow and fast cooling processes, respectively (Scheme S1, Fig. S5 and Table S6, ESI†).
The structure of 1 was characterized by alternating the arrangement of two-dimensional (2D) {(ET)2}+ and {Cu[N(CN)2]I}− sheets, where only the ET sheets are responsible for conduction (Fig. 1). Every pair of ET cation radical species share an unpaired π-electron via overlapping HOMOs (HOMO = highest occupied molecular orbital), π-orbitals predominantly comprised sulphur 3s and 3p orbitals. The ET molecules interact to form a 2D delocalized unpaired π-electron system extended across the entire crystal (π-bands), namely 2D conduction sheets. In the unit cell of 1, the asymmetric unit contains one general position ET molecule and the repeating unit of the polymer anion {Cu[N(CN)2]I}− on a mirror plane. Our structural analysis is consistent with that of previous studies (Table S2, ESI†).5
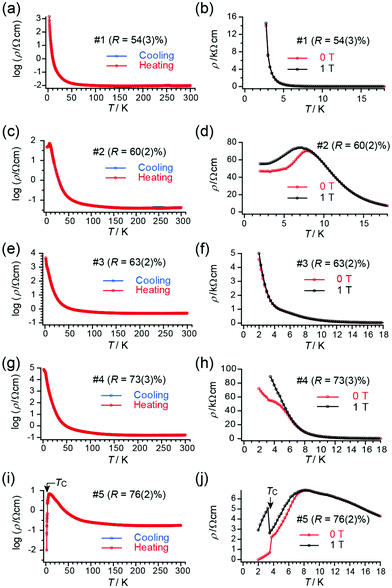
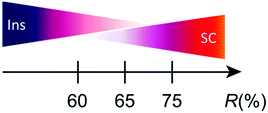
Although the lattice parameters were different from each other beyond the experimental error (esd) in all the single crystals of 1, tight-binding calculation based on the observed structures gave practically identical band structures and Fermi surfaces to each other (Table S5, ESI†). However, closer comparison of overlap integrals revealed a trend that transfer integrals I, III, and IV (Table S5, ESI†) are greater for insulating crystals than those for superconducting crystals. Similarly, the transfer integral II is greater for superconducting crystals than those for insulating crystals. These features may explain the qualitative differences in the observed conducting properties. Typical patterns of electrical behaviour with increasing R (%) (for R, see below) is shown in Fig. 2, exhibiting superconducting (SC), insulating (Ins), and intermediate (IM) behaviour among them. The IM behaviour should originate from a mixed phase of SC and Ins domains as discussed below. The SC behaviour was characterized by a sudden decrease in resistivity at TC and large positive magnetoresistance below TC. The Ins behaviour was characterized by a substantial increase in resistivity after decreasing the temperature to 2 K, in addition to negligible magnetoresistance. Thus, differences in the electrical behaviour under magnetic fields distinguish between superconductors and insulators. The application of magnetic fields indicated that samples #1 and #3 were insulators whereas sample #5 was a superconductor. An Arrhenius plot of the electrical behaviour of #1–#4 (Fig. S2, ESI†) evidently shows that they are not band insulators. Rather, all samples examined in this work exhibit a nearly temperature-independent electrical behaviour above ∼80 K (Fig. 2), indicating a shared metallic band structure governed by the characteristic ET arrangement that forms conduction sheets called κ-type (Fig. 1). Thus 1 crossovers from a metallic to an insulating/superconducting phase or to intermediate behaviour at some lower temperature than 80 K. Furthermore, most samples with SC or IM behaviour exhibited an anomaly at T* ≈ 8 K (Fig. S3, ESI†), below which a large magnetoresistance was commonly observed in the SC and IM samples (Fig. 2). The energy scale of T* is significantly lower than the energy difference between the two conformations (0.81 eV ∼ 9400 K) and was shifted to lower temperatures under an applied magnetic field (Fig. 2(d)).6 Based on these observations, we consider that T* corresponds to the onset of a higher-TC SC transition, whereas the SC domains are still minor parts which have not developed to form a continuous conduction pathway through the crystal. In fact, some crystals exhibited SC transitions at Tc ∼ T* ∼ 8 K (Fig. S4, ESI†). Regardless of whether the SC behaviour was obvious or not, the volume fraction of the SC domains in 1 was often small based on the observed high residual resistivity (Fig. 2(d)), temperature-dependent resistivity below T* (∼ 8 K) (Fig. 2(h)), and limited decrease in resistivity at TC (Fig. 2(j)). The small fraction and rather low TC (∼4 K) often observed for 1 as crystal-dependency observed in this work as well as in previous work5j are consistent with disorder in the ethylene groups, which hinder the coherence from developing in the entire crystal between the wave function of Cooper pairs during the SC transition. Samples #2 and #4 show IM behaviour of a superconductor (#5) and insulator (#1 and #3), exhibiting both SC-like large positive magnetoresistance and Ins-like high resistivity below 8 K. The substantial increase in resistivity at T < ∼80 K is similar between the Ins (#1 and #3) and IM (#4) samples, in sharp contrast with the resistivity behaviour of the SC (#5) and other IM (#2) samples.
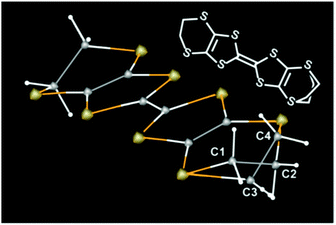
Next, we address the connection between the observed electrical behaviour and the crystal structure. The X-ray structure analyses revealed that all the examined single crystals contained disorder in one of the two ethylene groups on each ET molecule (Fig. 3), without evidence of defects or disorder in the polymer anions. The ET molecules in 1 are classified as eclipsed (E) and staggered (S) conformations.5 We discuss the ratio between the two conformations R at a given temperature T,
| R(T) = S/(S + E) |
The factors such as charge and spin degrees of freedom, bandwidth, Coulomb interactions, and overlap integrals between the HOMOs of ET have been paid attention to explain the observed various types of electrical behavior of the κ-type superconductors.5 However, our findings have revealed that R is also one of the important factors to determine the electrical behaviour and the ground state of 1. Although both effects of ethylene disorder and ethylene conformation on the superconductivity of organic conductors have been known for a long time from various points of view including related κ-OCTCs,51 is unique in that the ethylene conformation sensitively changes in a wide range depending on the details of crystallization conditions and cooling processes. This structural feature makes the electrical behaviour at T ≤ 80 K depend on both R and details of cooling processes at T ≤ 80 K, which in turn makes the behaviour complicated and non-systematic in terms of R or the phase diagrams.
In summary, R is sensitively dependent on temperature and synthetic conditions, and is an important factor to determine the ground states to be SC or Ins properties. The values of R affect on the band structure via superstructures, and can be associated with electronic interactions via electron–phonon interactions in 1. Yet, the weak hydrogen bonds I⋯H–C(ethylene) cause disorder in the ethylene conformations, which in turn cause complicated electrical and structural behaviours, being sensitive to cooling processes, and producing the unique dynamics and the exceptional position of 1 in the universal κ-OCTC diagrams.
Conclusions
We found that the ground state and electrical properties of 1 are affected by the ratio of two kinds of ethylene conformations, which vary from crystal to crystal and are affected by sample preparation. Accordingly, the electrical behaviour cannot be explained by the universal phase diagrams proposed for κ-OCTCs;3 furthermore, inconsistent and/or irreproducible electrical behaviours have previously been observed among different research groups and crystals. Since there remains unsolved problems regarding the structure-conduction correlation in κ-OCTCs,9 our findings shed light on the controversial situation regarding the electrical behaviour and superconducting mechanism of κ-OCTCs. Because superconducting mechanism should be largely based on electron–phonon interactions, the active role of a molecular vibration revealed in this work is an important step forward to the future control of the conduction electrons in molecular crystals exhibiting considerably high TCs.Conflicts of interest
There are no conflicts to declare.Acknowledgements
The assistance of S. Mori and R. Konishi (Ehime University) for X-ray structural analyses is acknowledged. The authors thank K. Konishi (Ehime University) for access to the PPMS (Quantum Design PPMS-9). This work was partially supported by Grant-in-Aid for Challenging Exploratory Research (18K19061) and Grant-in-Aid for Scientific Research (C) (15K05478, 19K05405) of JSPS, the Tokyo Chemical Industry Foundation, the Tokyo Ohka Foundation for the Promotion of Science and Technology, the Kato Foundation for Promotion of Science, the Iketani Science and Technology Foundation (ISTF; 0331005-A), Casio Science Promotion Foundation, and an Ehime University Grant for Project for the Promotion of Industry/University Cooperation.Notes and references
- (a) R. Murase, B. Ding, Q. Gu and D. M. D’Alessandro, Philos. Trans. R. Soc., A, 2019, 377, 20180226 CrossRef CAS PubMed; (b) J.-P. Pouget, P. Alemany and E. Canadell, Mater. Horiz., 2018, 5, 590 RSC; (c) H. Jiang, P. Hu, J. Ye, K. K. Zhang, Y. Long, W. Hu and C. Kloc, J. Mater. Chem. C, 2018, 6, 1884 RSC; (d) F. Kagawa and H. Oike, Adv. Mater., 2017, 29, 1601979 CrossRef PubMed; (e) B. Náfrádi, M. Choucair and L. Forró, Adv. Funct. Mater., 2017, 27, 1604040 CrossRef; (f) S. E. Brown, Phys. C, 2015, 514, 279 CrossRef CAS; (g) P. Monceau, Adv. Phys., 2012, 61, 325 CrossRef CAS.
- (a) S. Fukuoka, S. Fukuchi, H. Akutsu, A. Kawamoto and Y. Nakazawa, Crystals, 2019, 9, 66 CrossRef; (b) J. Wosnitza, J. Low Temp. Phys., 2007, 146, 641 CrossRef CAS; (c) B. J. Powell and R. H. McKenzie, J. Phys.: Condens. Matter, 2006, 18, R827 CrossRef CAS; (d) K. Miyagawa, K. Kanoda and A. Kawamoto, Chem. Rev., 2004, 104, 5635 CrossRef CAS PubMed.
- (a) T. Sasaki, Crystals, 2012, 2, 374 CrossRef CAS; (b) T. Sasaki, Infrared imaging in the strongly correlated molecular conductors in Molecular Electronic and Related Materials–Control and Probe with Light, ed. T. Naito, Transworld Research Network, Kerala, India, 2010, ch. 4, pp. 99–116; (c) D. Faltermeier, J. Barz, M. Dumm, M. Dressel, N. Drichko, B. Petrov, V. Semkin, R. Vlasova, C. Mézière and P. Batail, Phys. Rev. B: Condens. Matter Mater. Phys., 2007, 76, 165113 CrossRef; (d) K. Kanoda, J. Phys. Soc. Jpn., 2006, 75, 051007 CrossRef; (e) T. Sasaki, I. Ito, N. Yoneyama, N. Kobayashi, N. Hanasaki, H. Tajima, T. Ito and Y. Iwasa, Phys. Rev. B: Condens. Matter Mater. Phys., 2004, 69, 064508 CrossRef; (f) P. Limelette, P. Wzietek, S. Florens, A. Georges, T. A. Costi, C. Pasquier, D. Jérome, C. Mézière and P. Batail, Phys. Rev. Lett., 2003, 91, 016401 CrossRef CAS PubMed; (g) D. Fournier, M. Poirier, M. Castonguay and K. Truong, Phys. Rev. Lett., 2003, 90, 127002 CrossRef CAS PubMed; (h) T. Sasaki, N. Yoneyama, A. Matsuyama and N. Kobayashi, Phys. Rev. B: Condens. Matter Mater. Phys., 2002, 65, 060505(R) CrossRef; (i) J. Müller, M. Lang, F. Steglich, J. A. Schlueter, A. M. Kini and T. Sasaki, Phys. Rev. B: Condens. Matter Mater. Phys., 2002, 65, 144521 CrossRef; (j) S. Lefebvre, P. Wzietek, S. Brown, C. Bourbonnais, D. Jérome, C. Mézière, M. Fourmigué and P. Batail, Phys. Rev. Lett., 2000, 85, 5420 CrossRef CAS PubMed; (k) K. Kanoda, Hyperfine Interact., 1997, 104, 235 CrossRef CAS; (l) H. Ito, T. Ishiguro, M. Kubota and G. Saito, J. Phys. Soc. Jpn., 1996, 65, 2987 CrossRef CAS; (m) H. Kino and H. Fukuyama, J. Phys. Soc. Jpn., 1996, 65, 2158 CrossRef CAS.
- (a) R. T. Clay and S. Mazumdar, Phys. Rep., 2019, 788, 1 CrossRef CAS; (b) R. A. Klemm, Phys. C, 2015, 514, 86 CrossRef CAS; (c) S. Mazumdar and R. T. Clay, Int. J. Quant. Chem., 2014, 114, 1053 CrossRef CAS; (d) M. R. Norman, Science, 2011, 332, 196 CrossRef CAS PubMed; (e) E. Demler, W. Hanke and S.-C. Zhang, Rev. Mod. Phys., 2004, 76, 909 CrossRef CAS; (f) Y. Yanase, T. Jujo, T. Nomura, H. Ikeda, T. Hotta and K. Yamada, Phys. Rep., 2003, 387, 1 CrossRef CAS; (g) R. H. McKenzie, Science, 1997, 278, 820 CrossRef CAS; (h) H. Fukuyama and Y. Hasegawa, Physica B + C, 1987, 148, 204 CrossRef CAS.
- (a) T. Kobayashi, A. Suzuta, K. Tsuji, Y. Ihara and A. Kawamoto, Phys. Rev. B: Condens. Matter Mater. Phys., 2019, 100, 195115 CrossRef CAS; (b) A. U. B. Wolter, R. Feyerherm, E. Dudzik, S. Süllow, Ch Strack, M. Lang and D. Schweitzer, Phys. Rev. B: Condens. Matter Mater. Phys., 2007, 75, 104512 CrossRef; (c) C. Strack, C. Akinci, V. Pashchenko, B. Wolf, E. Uhrig, W. Assmus, M. Lang, J. Schreuer, L. Wiehl, J. A. Schlueter, J. Wosnitza, D. Schweitzer, J. Müller and J. Wykhoff, Phys. Rev. B: Condens. Matter Mater. Phys., 2005, 72, 054511 CrossRef; (d) M. Maksimuk, K. Yakushi, H. Taniguchi, K. Kanoda and A. Kawamoto, Synth. Met., 2005, 149, 13 CrossRef CAS; (e) N. Yoneyama, T. Sasaki, T. Nishizaki and N. Kobayashi, J. Phys. Soc. Jpn., 2004, 73, 184 CrossRef CAS; (f) H. Taniguchi, K. Kanoda and A. Kawamoto, Phys. Rev. B: Condens. Matter Mater. Phys., 2003, 67, 014510 CrossRef; (g) V. S. Yefanov, S. Kagoshima, R. Kondo, M. A. Tanatar, N. D. Kushch and E. B. Yagubskii, Synth. Met., 2003, 137, 1295 CrossRef CAS; (h) M. Pinterić, S. Tomić, M. Prester, Đ. Drobac and K. Maki, Phys. Rev. B: Condens. Matter Mater. Phys., 2002, 66, 174521 CrossRef; (i) J. Müller, M. Lang, F. Steglich, J. A. Schlueter, A. M. Kini and T. Sasaki, Phys. Rev. B: Condens. Matter Mater. Phys., 2002, 65, 144521 CrossRef; (j) M. A. Tanatar, T. Ishiguro, S. Kagoshima, N. D. Kushch and E. B. Yagubskii, Phys. Rev. B: Condens. Matter Mater. Phys., 2002, 65, 064516 CrossRef; (k) N. D. Kushch, M. A. Tanatar, T. Ishiguro, S. Kagoshima, E. B. Yagubskii, V. S. Yefanov and V. A. Bondarenko, Synth. Met., 2003, 133–134, 177 CrossRef CAS; (l) V. S. Yefanov, M. A. Tanatar, T. Ishiguro, H. Ito, V. A. Bondarenko, N. D. Kushch and E. B. Yagubskii, Synth. Met., 2001, 120, 959 CrossRef CAS; (m) N. D. Kushch, M. A. Tanatar, E. B. Yagubskii and T. Ishigur, JETP Lett., 2001, 73, 429 CrossRef CAS; (n) M. A. Tanatar, S. Kagoshima, T. Ishiguro, H. Ito, V. S. Yefanov, V. A. Bondarenko, N. D. Kushch and E. B. Yagubskii, Phys. Rev. B: Condens. Matter Mater. Phys., 2000, 62, 15561 CrossRef CAS; (o) H. Akutsu, K. Saito and M. Sorai, Phys. Rev. B: Condens. Matter Mater. Phys., 2000, 61, 4346 CrossRef CAS; (p) M. A. Tanatar, T. Ishiguro, T. Kondo and G. Saito, Phys. Rev. B: Condens. Matter Mater. Phys., 1999, 59, 3841 CrossRef CAS; (q) K. Andres, Synth. Met., 1998, 94, 11 CrossRef CAS; (r) M. Kund, H. Müller, N. D. Kushch, K. Andres and G. Saito, Synth. Met., 1995, 70, 951 CrossRef CAS; (s) T. Burgin, T. Miebach, J. C. Huffman, L. K. Montgomery, J. A. Paradis, C. Rovira, M.-H. Whangbo, S. N. Magonov, S. I. Khan, C. E. Strouse, D. L. Overmyer and J. E. Schirber, J. Mater. Chem., 1995, 5, 1659 RSC; (t) V. Kataev, G. Winkel, D. Khomskii, D. Wohlleben, W. Crump, K. F. Tebbe and J. Hahn, Solid State Commun., 1992, 83, 435 CrossRef CAS; (u) H. H. Wang, K. D. Carlson, U. Geiser, A. M. Kini, A. J. Schultz, J. M. Williams, L. K. Montgomery, W. K. Kwok, U. Welp, K. G. Vandervoort, S. J. Boryschuk, A. V. Strieby Crouch, J. M. Kommers, D. M. Watkins, J. E. Schirber, D. L. Overmyer, D. Jung, J. J. Novoa and M.-H. Whangbo, Synth. Met., 1991, 41–43, 1983 CrossRef; (v) J. M. Williams, A. J. Schultz, U. Geiser, K. D. Carlson, A. M. Kini, H. H. Wang, W.-K. Kwok, M.-H. Whangbo and J. E. Schirber, Science, 1991, 252, 1501 CrossRef CAS PubMed; (w) D. Jung, M. Evain, J. J. Novoa, M.-H. Whangbo, M. A. Beno, A. M. Kini, A. J. Schultz, J. M. Williams and P. J. Nigrey, Inorg. Chem., 1989, 28, 4516 CrossRef CAS; (x) J. M. Williams, M. A. Beno, H. H. Wang, P. C. W. Leung, T. J. Emge, U. Geiser and K. D. Carlson, Acc. Chem. Res., 1985, 18, 261 CrossRef CAS.
- For details of calculation, see ESI†.
- (a) A. Kawamoto, K. Miyagawa, Y. Nakazawa and K. Kanoda, Phys. Rev. Lett., 1995, 74, 3455 CrossRef CAS PubMed; (b) A. Kawamoto, K. Miyagawa, Y. Nakazawa and K. Kanoda, Phys. Rev. B: Condens. Matter Mater. Phys., 1995, 52, 15522 CrossRef CAS PubMed.
- S. Tsuchiya, R. Kuwae, T. Kodama, Y. Nakamura, M. Kurihara, T. Yamamoto, T. Naito and Y. Toda, J. Phys. Soc. Jpn., 2020, 89, 064712 CrossRef.
- T. Kawamoto, T. Mori, A. Nakao, Y. Murakami and J. A. Schlueter, J. Phys. Soc. Jpn., 2012, 81, 023705 CrossRef.
Footnote |
| † Electronic supplementary information (ESI) available: Electrocrystallisation conditions, single crystal X-ray structural analyses, electrical resistivity measurements, quantum chemistry calculations, band calculations (PDF). CCDC 2001301, 2001305, 2001308, 2001310–2001312, 2110351–2110354, 2110364, 2110365, 2114420–2114422, 2126205, 2126206. For ESI and crystallographic data in CIF or other electronic format see DOI: 10.1039/d1ma00933h |
| This journal is © The Royal Society of Chemistry 2022 |


