 Open Access Article
Creative Commons Attribution 3.0 Unported Licence
An experimental and computational study of the reaction between pent-3-en-2-yl radicals and oxygen molecules: switching from pure stabilisation to pure decomposition with increasing temperature†
Timo T.
Pekkanen
a,
László
Valkai
a,
Satya P.
Joshi
a,
György
Lendvay
 b,
Petri
Heinonen
 a,
Raimo S.
Timonen
a and
Arkke J.
Eskola
 *a
*a
aDepartment of Chemistry, University of Helsinki, P. O. Box 55 (A.I. Virtasen Aukio 1), 00014 Helsinki, Finland. E-mail: arkke.eskola@helsinki.fi
bInstitute of Materials and Environmental Chemistry, Research Centre for Natural Sciences, Magyar Tudósok Krt. 2, Budapest H-1117, Hungary
First published on 14th March 2022
Abstract
We have used laser-photolysis–photoionization mass spectrometry, quantum chemical calculations, and master equation simulations to investigate the kinetics of the reaction between (E/Z)-pent-3-en-2-yl  a resonance-stabilised hydrocarbon radical, and molecular oxygen. The time-resolved experiments were performed over a wide temperature range (240–750 K) at relatively low pressures (0.4–7 Torr) under pseudo-first-order conditions (excess [O2]). Helium bath gas was used in most experiments, but nitrogen was employed in a few measurements to investigate the effect of a heavier collider on the kinetics of the studied reaction. The experimental traces were directly used to optimise parameters in the master equation model using the recently implemented trace fitting feature in the MESMER program. At low temperatures (T < 300 K), the reaction proceeds by barrierless recombination reactions to form peroxyl adducts, and the radical traces are single-exponential. Between 326 K and 376 K, equilibration between the reactants and the peroxyl adducts is observed, and the radical traces are multi-exponential. Interestingly, at temperatures above 500 K, single-exponential decays were again observed, although the reaction is much slower than at low temperatures. The master equation simulations revealed that at both low and high temperatures, the radical decay rate is governed by a single eigenvalue. At low temperatures, this eigenvalue corresponds to recombination reactions, and at high temperatures to the phenomenological formation of bimolecular products. Between low and high temperatures (the exact temperature thresholds depend on [O2]), there is a region of avoided crossing in which the rate coefficient “jumps” from one eigencurve to the other. Although chemically significant eigenvalues are not well separated from internal energy relaxation eigenvalues at elevated temperatures (600 K at 0.01 bar, 850 K at 100 bar), we observed that many of the Bartis–Widom rate coefficients produced by the master equation model were valid up to 1500 K. Our simulations predict that the most important reaction channel at high temperatures is the formation of (E/Z)-penta-1,3-diene and hydroperoxyl. The experimentally constrained master equation model was used to simulate the title reaction over a wide range of conditions. To facilitate the use of our results in autoignition and combustion models, modified Arrhenius representations are given for the most important reaction channels.
1 Introduction
Reactions between hydrocarbon radicals and oxygen molecules are key reactions in understanding the oxidation of hydrocarbons both in atmospheric and combustion chemistry. Pent-3-en-2-yl radicals are formed in these environments when an allylic hydrogen is abstracted from the fourth carbon of pent-2-ene. Understanding the oxidation mechanism of pent-2-ene is of particular importance because it is used in surrogate fuels to mimic the behaviour of the alkenes present in real fuels.1 Pent-2-ene is also a minor component of gasoline. Furthermore, pent-2-enes are formed in the oxidation of n-pentane by the reactions| C5H11˙ + O2 → C5H10 + HO2˙ |
| C5H11˙ + O2 ⇌ C5H11O2˙ → C5H10 + HO2˙. |
Pent-3-en-2-yl (see Fig. 1) is a resonance-stabilised hydrocarbon radical (RSHR) and such radicals usually react slower with O2 than similar-sized hydrocarbon radicals that lack resonance stabilisation. RSHRs lose their resonance stabilisation when they recombine with O2 and, consequently, these reactions have shallow wells (zero-Kelvin binding enthalpies). Typical well depths for allylic radicals are between −85 kJ mol−1 and −70 kJ mol−1,2–12 much shallower than those of alkyl and alkenyl(vinylic) radicals. For example, ethyl and ethenyl (vinyl) have well depths of −137 kJ mol−1 and −182 kJ mol−1, respectively.13,14 A consequence of the shallow RSHR + O2 wells for allylic radicals is that the reverse reaction back to reactants becomes significant already at around 300–400 K. As temperature is increased, the equilibrium begins to overwhelmingly favour the reactants and no net reaction is observed unless there are low-barrier reaction channels that permit the peroxyl radical to react further.
Above 500 K, the allylic propenyl, 2-methylpropenyl, and but-3-en-2-yl radicals react slowly with O2 (k < 2 × 10⁻¹⁶ cm3 s−1),3,7,15 whereas relatively fast reactivity has been observed for pent-1-en-3-yl and 2-methylbut-3-en-2-yl (k > 1 × 10⁻¹⁵ cm3 s−1).4,6,16 The phenomenological rate coefficients are comparable to those of propargylic radicals.17–21 For pent-1-en-3-yl and 2-methylbut-3-en-2-yl, the fast reactivity is explained by the presence of low-barrier reaction channels (4–17 kJ mol−1 above the energy of the reactants)
that form conjugated dienes and hydroperoxyl radicals (HO2˙) through formally direct transition states. Conjugated dienes are more stable than regular alkenes, and this additional stabilisation is, to a degree, present in the transition states, which lowers their energy relative to the reactants. The relative energies of the transition states are further lowered by the alkyl substituents next to the radical centres. Substituting hydrogens next to a radical centre with alkyl groups typically makes R˙ + O2 wells deeper and this deepening drags down the energies of formally direct RO2˙ → R–H + HO2˙ transition states as well. For example, the well depths for ethylperoxyl and 2-methylpropyl-2-peroxyl are −137 kJ mol−1 and −150 kJ mol−1, respectively, and the relative energies of the formally direct transition states are −9.54 kJ mol−1 and −23.4 kJ mol−1, respectively.13,22 The propenyl + O2 and 2-methylpropenyl + O2 reactions cannot form conjugated dienes, which likely explains their small rate coefficients at elevated temperatures. The but-3-en-2-yl + O2 reaction can form buta-1,3-diene, but Knyazev and Slagle did not observe any reaction even at 700 K,7 which suggests that the relative energy of the formally direct transition state is appreciably higher for but-3-en-2-yl than for pent-1-en-3-yl and 2-methylbut-3-en-2-yl. For both allylic and propargylic radicals, chemically significant eigenvalues (CSEs) begin to converge with internal energy relaxational eigenvalues (IEREs) at relatively low temperatures because the R˙ + O2 recombination wells are shallow. The exact temperature is system- and pressure-dependent, but it is typically at the low end of temperatures relevant for autoignition (500–1000 K). The convergence and overlapping of CSEs and IEREs is a problem because the Bartis–Widom analysis23 that is used to obtain elementary rate coefficients from master equation (ME) models relies on them being well separated. Thus, it is difficult to obtain (or even define) phenomenological rate coefficients at exactly the temperatures where autoignition models need them. In this work, we look for practical ways of expressing the results of ME simulations when this is an issue. The system we have investigated in this work is the reaction between (E/Z)-pent-3-en-2-yl radicals and oxygen molecules,
 | (1) |
To our knowledge, the kinetics of this reaction have not been studied before. Both experimental and computational methods were used. The experiments consisted of direct kinetic measurements using laser-photolysis–photoionization mass spectrometry. The potential energy surface (PES) of reaction (1) was explored with density functional theory and the energies of the stationary points were refined with wave function methods. A ME model was constructed to simulate reaction (1) over wide temperature and pressure ranges. The results were carefully analysed, particularly at temperatures where IEREs and CSEs overlap, to find ways to express the results in a form that is useable for combustion modelling.
2 Methods
2.1 Experimental
The experimental apparatus has been described in a previous publication,24 so only the details relevant to the current work are given here. The experiments were performed in tubular laminar flow reactors. Stainless steel reactors with inner diameters of 0.80 cm or 1.7 cm were used to perform measurements at low temperatures (238–298 K). Halocarbon wax coating was used with these reactors. The purpose of the coating is to make the reactor surface more inert to minimise the rate at which pent-3-en-2-yl reacts with the surface. Above room temperature, we used Pyrex® (304–376 K) and quartz (304–752 K) reactors with inner diameters of 1.7 cm and 0.85 cm, respectively. The Pyrex® and quartz reactors were coated with polydimethylsiloxane and boric oxide, respectively. The experiments were performed under pseudo-first-order conditions with the bath gas (He or N2) typically being in huge excess over O2. Above 500 K, huge O2 concentrations had to be used in order to observe a reaction; up to half of the flowing gas mixture was O2 in these measurements. Pent-3-en-2-yl radicals were homogeneously produced along the reactor by photolysing 4-bromopent-2-ene
with a pulsed KrF exciplex laser. We also observed that the photolysis forms penta-1,3-diene (and presumably HBr). The laser fluences used were between 18 mJ cm−2 pulse−1 and 250 mJ cm−2 pulse−1. The radical precursor was synthesised in our laboratory as described in the literature.25 The details of the synthesis are given in the ESI.† The purity of the precursor was ∼93%, the main impurities being 1-bromobut-2-ene (∼5%) and methoxymethane. The E
![[thin space (1/6-em)]](https://www.rsc.org/images/entities/char_2009.gif) :
:![[thin space (1/6-em)]](https://www.rsc.org/images/entities/char_2009.gif) Z isomer ratio of the precursor was 11
Z isomer ratio of the precursor was 11![[thin space (1/6-em)]](https://www.rsc.org/images/entities/char_2009.gif) :
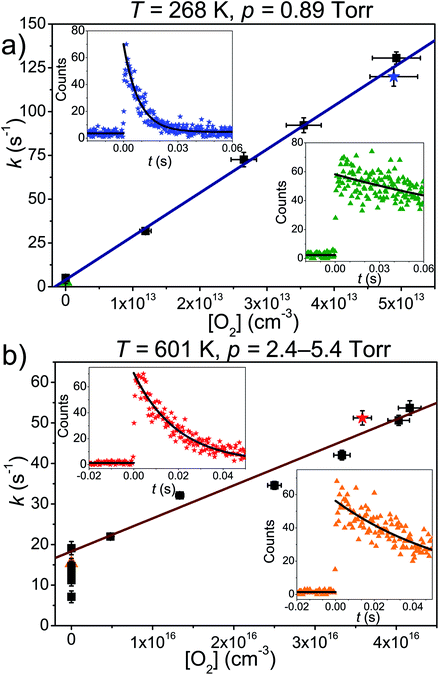
:![[thin space (1/6-em)]](https://www.rsc.org/images/entities/char_2009.gif) 1. The liquid precursor was purified with several freeze–pump–thaw cycles before use. A small hole on the side of the tubular reactor was used to sample a portion (5–20%) of the flowing gas mixture into a vacuum chamber containing a quadrupole mass spectrometer. A nitrogen lamp (7.1 eV) with a quartz or sapphire window was used to ionise the radical for mass spectrometric detection. The purpose of the window is to filter out higher energy lines. A chlorine lamp (8.9–9.1 eV) with a CaF2 window and a hydrogen lamp (10.2 eV) with a MgF2 window were used in the search of reaction products. In a typical bimolecular rate coefficient measurement, we first determined the first-order-loss rate coefficient of pent-3-en-2-yl in the absence of O2. We call this rate coefficient the wall rate (kw) for short. The wall rate mainly describes the rate at which the radical reacts with the reactor surfaces. The self-reaction of the radical and the reaction between the radical and the precursor molecule also contribute to kw, but we minimise these contributions by using very low radical and precursor concentrations. A practical way of checking that these two reactions are not important is that one either double or halves the precursor concentration (or the laser pulse energy) and checks that the wall rate remains unchanged. The wall rate was determined by monitoring the pent-3-en-2-yl trace in real time and fitting a single-exponential function
1. The liquid precursor was purified with several freeze–pump–thaw cycles before use. A small hole on the side of the tubular reactor was used to sample a portion (5–20%) of the flowing gas mixture into a vacuum chamber containing a quadrupole mass spectrometer. A nitrogen lamp (7.1 eV) with a quartz or sapphire window was used to ionise the radical for mass spectrometric detection. The purpose of the window is to filter out higher energy lines. A chlorine lamp (8.9–9.1 eV) with a CaF2 window and a hydrogen lamp (10.2 eV) with a MgF2 window were used in the search of reaction products. In a typical bimolecular rate coefficient measurement, we first determined the first-order-loss rate coefficient of pent-3-en-2-yl in the absence of O2. We call this rate coefficient the wall rate (kw) for short. The wall rate mainly describes the rate at which the radical reacts with the reactor surfaces. The self-reaction of the radical and the reaction between the radical and the precursor molecule also contribute to kw, but we minimise these contributions by using very low radical and precursor concentrations. A practical way of checking that these two reactions are not important is that one either double or halves the precursor concentration (or the laser pulse energy) and checks that the wall rate remains unchanged. The wall rate was determined by monitoring the pent-3-en-2-yl trace in real time and fitting a single-exponential function| [R˙]t = A + [R˙]0e−kwt |
| [Ṙ]t = A + [Ṙ]0e−k′t |
| k′ = kw + k[O2]. |
When equilibration between reactants and products is significant, single-exponential functions cannot be fitted to the radical traces because the radical decays are multi-exponential. If only one peroxyl adduct is formed, a double-exponential function needs to be fitted to obtain all the relevant rate coefficients.26 In the current case, two peroxyl adducts are formed ((E/Z)-pent-3-enyl-2-peroxyl) and the radical decays are, in principle, triple-exponential. Previously, such cases have been handled by fitting a double-exponential function to triple-exponential decays to obtain average rate coefficients for the forward and reverse rate coefficients.7 However, the recently implemented trace fitting feature27 in MESMER largely obviates the need to do this (see the Master equation section). Nonetheless, we performed double-exponential fits to the measured equilibration traces for comparison purposes. These fits also provide reasonable estimates for the peroxyl radical wall rates – information that is needed for trace fits. Fig. 3 describes how the radical trace changes from single- to multi-exponential as temperature is increased from 298 K to 371 K.
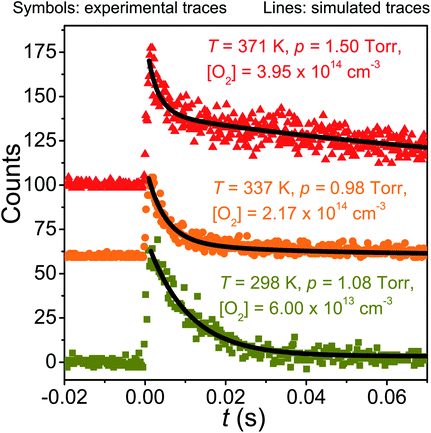 | ||
| Fig. 3 Examples of measured traces and simulated traces produced by the optimised master equation model. | ||
2.2 Quantum chemistry
The geometries of the stationary points of reaction (1) were optimised at the MN15/Def2TZVP level of theory.28,29 This level of theory was also used to obtain harmonic frequencies and one-dimensional hindered rotor potentials (five-degree increments). The harmonic frequencies were scaled by a factor of 0.979 to partially account for anharmonic effects.30 Single-point energies were computed for the stationary points with the ROHF-DLPNO-CCSD(T1) method.31,32 The T1 in the parentheses stands for an improved, iterative calculation of the triples correction33 and is not the T1 diagnostic.34 The tightPNO keyword was specified in the DLPNO calculations. The calculations were performed with the cc-pVDZ, cc-pVTZ, and cc-pVQZ basis sets. The Hartree–Fock (HF) energies were extrapolated to the complete basis set (CBS) limit using a three-parameter exponential function,35| EHF(X) = EHF,∞ + BHFe−αHFX. |
The slower converting correlation energies were extrapolated to the CBS limit using36
| Ecorr(X) = Ecorr,∞ + BcorrX−αcorr. |
Here X = 2, X = 3, and X = 4 for the basis sets cc-pVDZ, cc-pVTZ, and cc-pVQZ, respectively. The CBS energy is obtained in both cases by solving a system of three equations. An analytical solution exists for the former, but the latter needs to be solved numerically. We performed CASPT2 calculations for many of the species to check if multi-reference treatment was needed. The CBS energy difference of these calculations was estimated from37
 | (2) |
The CASPT2 calculations were run with the default settings (no IPEA or level shifts were used). The ORCA software package 4.2.0 was used for the ROHF-DLPNO-CCSD(T1) and CASPT2 calculations.38 The MN15/Def2TZVP calculations were run with Gaussian 16.39 The output files of our electronic structure calculations are available upon request.
2.3 Master equation modelling
We used MESMER 6.1 program to perform our ME simulations.40 It is a one-dimensional ME code, meaning that angular momentum dependence is neglected. Microcanonical rate coefficients were calculated with RRKM theory. For the barrierless pent-3-en-2-yl + O2 recombination reactions, we used the inverse Laplace transform (ILT) approach to obtain the number of states for the loose transition states. The expression we transformed was the modified Arrhenius expressionHere A, m, and Ea are the modified Arrhenius parameters. The exponential factor Ea is typically set to zero for barrierless reactions, and this was also done in this work. Reaction (1) can form two different peroxyl adducts ((E/Z)-pent-3-enyl-2-peroxyl) and both channels were given their own Arrhenius expression. Collisional energy transfer was described with the standard exponential down model
Here 〈ΔE〉down,ref is the average energy transferred downward at 300 K; n accounts for its temperature dependence. The same exponential parameters were used for all intermediates (C5H9O2˙ species). If experimental data is supplied, automated fitting routines in MESMER can be used to optimise the values of the Arrhenius and exponential down parameters. Note that the angular momentum dependence is implicitly accounted for when calculating microcanonical rate coefficients from an experimental k∞(T) expression with the ILT method. Collision frequencies were calculated with Lennard–Jones (LJ) interaction potentials. The LJ parameters for He and N2 were obtained from the literature.41 We assigned the LJ parameters of (E)-pent-3-ene-2-peroxol for the C5H9O2˙ intermediates. These values were estimated with the Joback method using the online resources of Cantherm.42 The used LJ-parameters are listed below:
| εLJ(He) = 10.22 K, σLJ(He) = 2.551 Å |
| εLJ(N2) = 71.4 K, σLJ(N2) = 3.798 Å |
| εLJ(C5H9O2˙) = 466.0 K, σLJ(C5H9O2˙) = 6.55 Å. |
An energy grain of 75 cm−1 was used in all simulations, and the cut-off energy was set to be 25kBT above the energy of the highest stationary point. Tunnelling corrections were calculated for hydrogen abstraction reactions using the Eckart tunnelling model. For species with three or more hindered rotors, we used the method of Gang et al. to treat coupling between internal and external rotations.43 This method is completely classical, so to avoid double-counting the zero-point energy (ZPE) contributions from hindered rotors for a species, we subtracted these ZPEs from the ZPE-corrected energy of the species. The hindered rotor ZPEs were obtained from one-dimensional, quantum mechanical hindered rotor calculations. The current implementation of the method of Gang et al. in MESMER does not explicitly treat potential coupling between hindered rotors. We used the recently implemented trace fitting feature in MESMER for parameter optimization.27 With this feature, simulated and experimental traces are directly compared and parameter optimisation attempts to minimise the difference between the two. This feature is useful when the experimental traces are multi-exponential in nature and/or when CSEs and IEREs overlap. Both of these are issues in the current work. In the former case, it is generally difficult to fit multi-exponential functions to experimental traces and obtain reliable values for the fitting parameters. If the uncertainties in the fitting parameters are large, then this uncertainty will be reflected in the rate coefficients that are functions of these parameters. In the latter case, the Bartis–Widom analysis that is used to obtain phenomenological rate coefficients may not be applicable and, if so, there are no rate coefficients that can be compared with experimental ones. The traces produced by ME simulations are unaffected by the overlap of IEREs and CSEs and can always be compared with experimental traces. Sometimes, wall reactions and/or diffusion can affect the time-dependent behavior of experimental traces, and to account for this, first-order rate coefficients that describe these phenomena need to be specified in the MESMER input file. In the simulations, rotations around allylic  bonds were treated as hindered rotations, meaning that the E and Z isomers of pent-3-en-2-yl were not treated as separate species. At the MN15/Def2TZVP level of theory, the barriers for these rotations were around 60–70 kJ mol−1. Due to the height of the rotation barrier, it would actually be more accurate to treat the isomers as separate species at cold temperatures (T < 300 K). However, because the photolysis of the precursor produces an unknown mixture of E and Z isomers (we cannot be certain that the E/Z ratio of the radicals will be that of the precursors), we chose to lump the isomers into a single species. This also simplifies the simulations by reducing the number of wells by one. Furthermore, at higher temperatures (T > 500 K), it is more appropriate to treat the isomers as a single species.
3 Results and discussion
3.1 Experimental
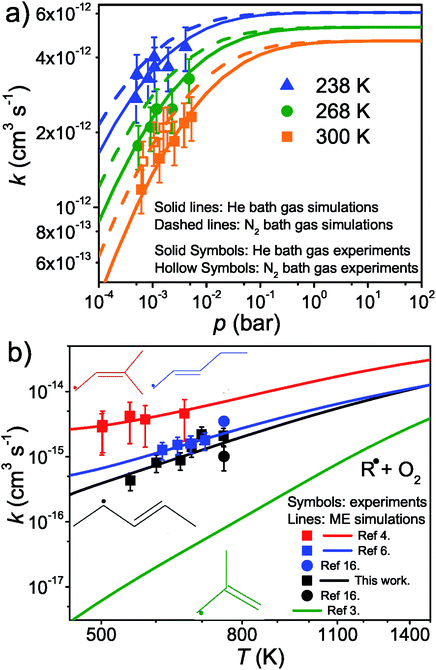
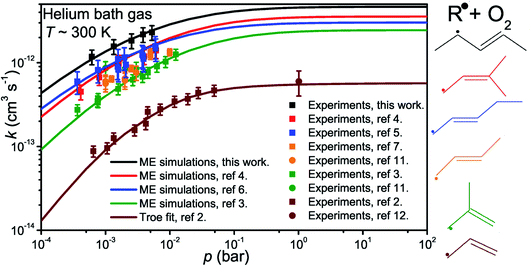
The results and conditions of our bimolecular rate coefficient measurements are reported in the ESI (Table S1†). We observed that there were three different temperature regimes in which the time-dependent behaviours of the measured traces were visibly different. We will refer to these as the low-temperature regime (T ≤ 300 K), the equilibration regime (300 K < T < 500 K), and the high-temperature regime (T ≥ 500 K). Single-exponential decays are observed in the low- and high-temperature regimes, but reaction (1) is several orders of magnitude slower in the high-temperature measurements. Multi-exponential decays are observed in the equilibration measurements. At low temperatures, pent-3-en-2-yl recombines with O2 to form (E/Z)-pent-3-enyl-2-peroxyl. The recombination rate coefficient is pressure-dependent and has negative temperature dependence. A few experiments were performed in N2 bath gas. The bimolecular rate coefficient is roughly 20–30% larger in N2 than He bath gas in the covered pressure range. Since N2 is a more effective collider, this result is as one would expect. However, the He and N2 rate coefficient measurements are within experimental uncertainty (±20%). The low-temperature measurements are depicted in Fig. 4a. We estimate that the overall uncertainty of the low-temperature bimolecular rate coefficient measurements is ±20%. This uncertainty mainly originates from the uncertainties in the measured gas flow rates, particularly that of O2.Fig. 5 displays R˙ + O2 → RO2˙ fall-off curves for several allylic radicals. One can immediately observe that reactivity increases with radical size, both in the fall-off region and at the high-pressure limit. Interestingly, reaction (1) is the fastest of the five-carbon allylic radicals. A possible explanation for this is that the reactivity is enhanced by the presence of alkyl groups next to the radical centres. In pent-3-en-2-yl, both of the possible radical centres are methyl-substituted, whereas in pent-1-en-3-yl and 2-methylbut-3-en-2-yl, only one radical centre is alkyl substituted. In 2-methylbut-3-en-2-yl, the aforementioned radical centre is doubly substituted, but given its lower reactivity compared to that of pent-3-en-2-yl, it would appear that the reactivity enhancing effect of alkyl substitution is subject to diminishing returns. For pent-1-en-3-yl and 2-methylbut-3-en-2-yl, the experiments are in close agreement, well within experimental uncertainty, and it is difficult to assess which one is more reactive. The extrapolated high-pressure rate coefficients are not accurate enough to make that distinction either. The argument based on the reactivity enhancing effects of alkyl substitution can also be used to explain why the five-carbon allylic radicals are more reactive than the four-carbon ones, which in turn are much more reactive than allyl.
At slightly above room temperature (326–376 K), equilibration between the reactants and the peroxyl radicals is observed, and the pent-3-en-2-yl traces are triple-exponential. We were not able to reliably fit a triple-exponential function to these traces, so we fitted a double-exponential function and used the averaging scheme of Knyazev and Slagle7 to obtain “average” forward and reverse rate coefficients. These were then used to evaluate an “average” equilibrium constant. The standard states of the gases were chosen as the pure ideal gas at p⊖ = 1 bar at the temperature of interest. The results and conditions of the equilibration measurements are reported in Table S2 in the ESI† and shown in Fig. 6.
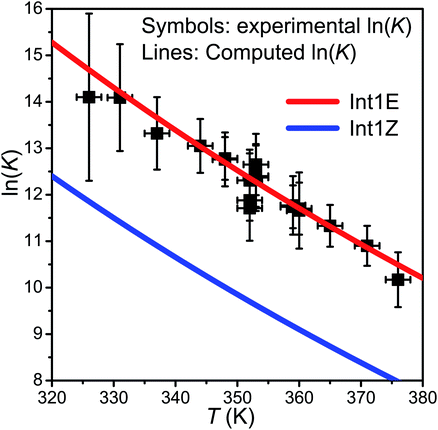 | ||
| Fig. 6 The experimental ln(K) values plotted together with the computed values for the R ⇌ Int1E and R ⇌ Int1Z reactions. | ||
At high temperatures (T > 500 K), single-exponential decays were again observed and bimolecular rate coefficient measurements were resumed. The phenomenological rate coefficient at these temperatures is pressure independent and has positive temperature dependence. The results of the measurements are displayed in Fig. 4b. As can be seen from Fig. 2 and Table S2 in the ESI,† in the high-temperature measurements, the fitted wall rates are systematically about 10 s−1 higher than the measured ones. This kind of behaviour is observed, for example, when the reaction under study forms a product that sticks to the reactor walls, where it can then react with the radical whose trace is monitored. Fig. 2 shows that the [O2]-dependence of k′ is nonetheless linear, which indicates that even a small amount of oxygen is able to saturate the reactor surface with whatever it is that sticks to the walls. Thus, the wall rate remains constant in these measurements, although it is not the same wall rate as the one that is measured in the absence of O2. When we measured the wall rate immediately after a measurement with O2 present, we noticed that the wall rate was higher than the rate measured in the beginning of the day, but it fairly quickly decayed back to its original value, usually within 30 minutes. We have included in the ESI† all the high-temperature bimolecular plots. These show that the discrepancy in the measured and fitted wall rates was systematic. The plots also demonstrate that the [O2]-dependence of k′ was linear in all of the measurements, meaning that the slopes of the linear fits gave the bimolecular rate coefficient of reaction (1). However, this atypical behaviour on the walls adds some uncertainty to our measurements, and therefore, we assign a higher uncertainty to the high-temperature measurements, ±40%.
The expected high-temperature products of reaction (1) are (E/Z)-penta-1,3-diene and hydroperoxyl.4,6,16 We searched for penta-1,3-diene with a hydrogen lamp (10.2 eV) and a formation signal was found at m/z = 68. A similar but noisier signal was also observed with a chlorine lamp (8.9–9.1 eV). Unfortunately, the formation signal was also seen in the absence of O2. The two formation signals were compared, but there is no obvious difference between the two. Thus, the experimental evidence for penta-1,3-diene formation from reaction (1) at high-temperatures is inconclusive. At present, we are unable to give an explanation for the product-like formation signal at m/z = 68 in the absence of O2. Given that a rising signal is observed after photolysis (t = 0), it is clear that the signal must result from chemistry between the photolysis products and the precursor and/or the reactor surface. The measured product signals are displayed in the ESI (Fig. S2†). In Fig. 4b, we compare the current high-temperature results to the estimate of Baldwin et al.16 for the rate coefficient of the phenomenological reaction
3.2 Quantum chemistry
Altogether, three different reaction channels were investigated:P1: this product channel forms (E/Z)-penta-1,3-diene and hydroperoxyl from the peroxyl adducts through a formally direct transition state.
P2: in this product channel, (Z)-pent-3-enyl-2-peroxyl first isomerises to pent-4-en-3-yl-2-peroxol (QOOH) by abstracting an allylic hydrogen from the fifth carbon. The non-terminal oxygen then forms a bond with the adjacent allylic system, simultaneously breaking the O–O bond, leading to the formation of (2R, 3R/2S, 3R)-2,3-epoxypent-4-ene and hydroxyl.
P3: here, the terminal oxygens of the peroxyl adducts react with the double bond, forming five-membered rings. The O–O bond then breaks (a very exothermic reaction), ultimately leading to the formation of ethanal and (R/S)-1,2-epoxypropane. Preliminary ME simulations revealed this product channel to be kinetically unimportant, so it was left out of the final ME model. The structures of the stationary points of this product channel are displayed in the ESI (Fig. S3†).
We assumed the other product channels to have significantly higher barriers than these three and did not investigate them systematically. The results of our quantum chemistry calculations are reported in Table S3 in the ESI.† An optical symmetry number of two was specified for all species with chiral carbons. The zero-Kelvin reaction enthalpy profile used in the ME simulations is shown in Fig. 7.
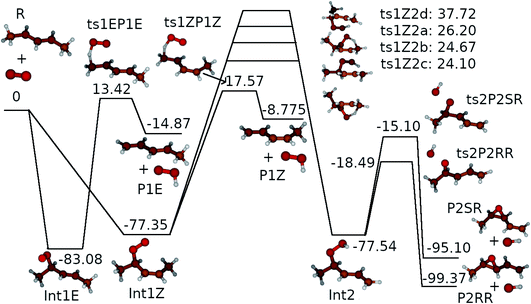 | ||
| Fig. 7 The zero-Kelvin reaction enthalpy (ΔrH⊖0) profile used in the master equation simulations. The energies are in kJ mol−1. | ||
In our CASPT2 calculations, a (13,11) active space was used for product channels P1 and P2. This active space consisted of the bonding and anti-bonding C–O and O–O σ-orbitals (4,4), the bonding and anti-bonding C![[double bond, length as m-dash]](https://www.rsc.org/images/entities/char_e001.gif) C π-orbitals (2,2), the non-bonding lone-pair orbitals of the oxygens (4,2), the radical orbital (1,1), which is either on the terminal oxygen or the non-bonding
C π-orbitals (2,2), the non-bonding lone-pair orbitals of the oxygens (4,2), the radical orbital (1,1), which is either on the terminal oxygen or the non-bonding  orbital, and the bonding and anti-bonding C–H σ-orbitals of the hydrogen that is abstracted from the first and fifth carbons in product channels P1 and P2, respectively. The C–H bond that was chosen was the one closest to the terminal oxygen. For product channel P3, the same active space was selected, except that the C–H orbitals were omitted and the anti-bonding lone pair orbitals of the oxygens were included. This adds up to an (11,11) active space. For the intermediates and the internal hydrogen abstraction transition structures (ts1Z2a–d), the ROHF-DLPNO-CCSD(T1) and CASPT2 energies are in good agreement, generally within 5 kJ mol−1. Single-reference methods appear to be suitable for these species, so we decided to use the ROHF-DLPNO-CCSD(T1) energies for them in the ME simulations. We believe the ROHF-DLPNO-CCSD(T1) method to be more accurate than CASPT2 when non-dynamical correlation is not important. For the other transition structures, there is a clear and systematic disagreement between the ROHF-DLPNO-CCSD(T) and CASPT2 energies, the latter energies being between 10 kJ mol−1 and 30 kJ mol−1 lower in energy. We have observed the same behaviour for other allylic systems.3,4,6 We believe that the large energy differences are a sign that multi-reference effects are important, although the T1 diagnostic does not always reflect this. In the previous studies, we also noticed that the CASPT2 barriers are more consistent with experimental observations. Thus, we used the CASPT2 energies for the other transition structures. The CASPT2 calculations predict the dominant product channel to be the one that produces (E/Z)-penta-1,3-diene and hydroperoxyl (P1). As mentioned in the previous section, we did not find conclusive experimental evidence for this. However, in our previous studies of other allylic systems, we have seen experimental evidence for the diene producing channel.4,6 Furthermore, as already discussed, Baker et al. and Baldwin et al. have observed diene formation for C4- and C5-allylic radical + O2 reactions.16,44 Therefore, we believe that P1 is the dominant reaction channel for reaction (1) at high temperatures.
3.3 Master equation simulations
 . In this optimisation, all other parameters were fixed to the values yielded by the He bath gas fit. Of the fixed parameters, only n was bath gas-dependent. We did not try to optimise n separately for N2 because we did not have enough kinetic data in N2 bath gas to do so. The parameters yielded by the optimisations are tabulated in Table 1. The 〈ΔE〉down,ref values of 164 cm−1 and 330 cm−1 obtained for He and N2, respectively, are reasonable. The well depth and transition state energy adjustments are less than four kJ mol−1, so well within computational uncertainties. It is harder to assess if the modified Arrhenius parameters are reasonable, but the fall-off curves plotted in Fig. 4 and 5 based on these values seem sensible. Simulated traces produced by the optimised ME model are displayed in Fig. 3. The model predicts that reaction (1) primarily forms (E)-pent-3-enyl-2-peroxyl (70–80%), Int1E, at low temperatures. Due to its shallower well, (Z)-pent-3-enyl-2-peroxyl (Int1Z) begins to equilibrate with the reactants much earlier than Int1E and the R˙ + O2 ⇌ Int1Z equilibrium has shifted almost completely to the side of the reactants already at the lower temperature end (∼330 K) of our equilibration measurements. Thus, our measurements between 326 K and 376 K mainly monitor the R˙ + O2 ⇌ Int1E equilibrium reaction and the average forward and reverse rate coefficients obtained from the double exponential fits mostly describe this reaction. In Fig. 6, we plot the experimental equilibrium constant together with the R˙ + O2 ⇌ Int1E and R˙ + O2 ⇌ Int1Z equilibrium constants computed with our ME model, and indeed, one observes that the experimental equilibrium constant is for the R˙ + O2 ⇌ Int1E reaction. From this point onward, all simulations were run in N2 bath gas with the values reported in Table 1.
(1) At low and high temperatures, the bimolecular rate coefficient of reaction (1) is given by the relations krec = −λ4/[O2] and kph = −λ1/[O2], respectively. There is a region of avoided crossing between the two temperature regions in which the rate coefficient “jumps” from eigencurve 4 to eigencurve 1. It is in this temperature range that multi-exponential radical traces and equilibration between reactants and peroxyl adducts are observed. The width of the transition range is pressure-dependent. At 100 bar and [O2] = 1015 cm−3, it spans from 350 K to 450 K. As pressure is reduced, the temperature range gets narrower, eventually disappearing at 10−8 bar, where there is an instantaneous jump from eigencurve 4 to eigencurve 1.
(2) The location of the transition range depends on [O2], as it should. At 1 bar and [O2] = 1010 cm−3, it is located between 250 K and 350 K, whereas at 1 bar and [O2] = 1020 cm−3, it is located between 700 K and 800 K.
(3) The total [O2]-independence of λ3 indicates that it should be associated with well Int2. We also noticed that the total loss rate from this well was equal to λ3.
(4) At high temperatures, λ1 is pressure independent for all practical purposes. Based on this, one would assume that the branching ratios of the different product channels at high temperatures are also pressure independent, and indeed, they were found to be virtually identical at 10−8 bar and 100 bar.
(5) At high temperatures, λ2 and λ4 describe the equilibration between R, Int1E, and Int1Z. The least negative CSE, λ1, describes the loss from the “combined R, Int1E, and Int1Z well”. The reactions between R, Int1E, and Int1Z happen very fast (λ2 and λ4 are orders of magnitude larger than λ1 under realistic pressures and O2 concentrations). Thus, R, Int1E, and Int1Z reach chemical equilibrium almost instantly after the reaction is initiated and the equilibrium is maintained whilst λ1 slowly depletes their populations.
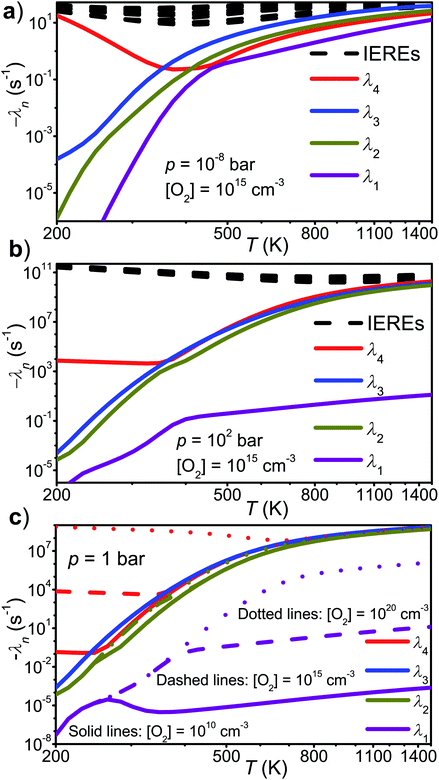 | ||
Fig. 8 The chemically significant eigenvalues of the  reaction plotted as a function of temperature, pressure, and [O2]. reaction plotted as a function of temperature, pressure, and [O2]. | ||
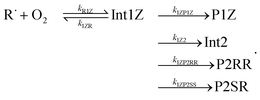
Because chemical equilibrium between the reactants and peroxyl adducts is established very quickly at high temperatures and favours the reactants, the pre-equilibrium approximation can be used to derive a high-temperature phenomenological rate coefficient for reaction (1). An approximate phenomenological description of the reaction system is given by the reactions
The “WS” in the rate coefficients stands for well-skipping. After writing down the rate laws, using the pre-equilibrium approximation, and doing some algebra, an approximate phenomenological rate coefficient is obtained for reaction (1):
 | (3) |
We tested the validity of this expression by comparing it with −λ1/[O2]. The elementary rate coefficients were obtained from Bartis–Widom analysis. The comparison is shown in Fig. 9. As one can see, the two expressions are virtually identical as pre-equilibrium conditions begin to apply at around 450 K. The phenomenological rate coefficient is pressure independent, even though the Bartis–Widom rate coefficients from which it is calculated are not (also shown in Fig. 9). Surprisingly, eqn (3) seems to be valid even at 1500 K, long after CSEs and IEREs have begun to converge. Therefore, we are inclined to believe that the Bartis–Widom rate coefficients in eqn (3) are valid throughout the investigated temperature range (200–1500 K). A possible reason why the Bartis–Widom rate coefficients are valid is that CSEs and IEREs do not overlap until around 1500 K (see Fig. 8), even though the separation between the smallest CSE and largest IERE is less than an order of magnitude at temperatures above 600–850 K (depending on pressure).
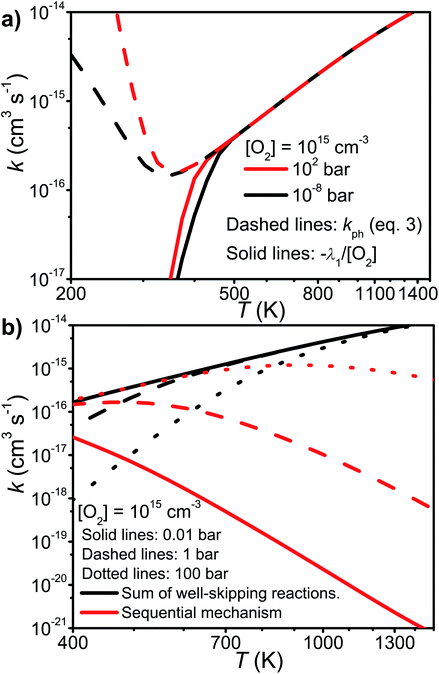 | ||
| Fig. 9 (a) A comparison of the phenomenological rate coefficient given by eqn (3) and −λ1/[O2]. (b) The sum of the well-skipping rate coefficients in eqn (3) and the sequential mechanism plotted as a function of temperature and pressure (see text for details). | ||
In the high-temperature regime, reaction (1) can form products through well-skipping (first row in eqn (3)) or through a sequential mechanism where first the peroxyl intermediates are formed and then decompose (the second and third rows in eqn (3)). At 0.01 bar, the products are almost completely formed by the well-skipping reactions, even at 400 K. As the pressure is increased, the sequential mechanism becomes more important. At 100 bar and 850 K, half of the products are still formed through the sequential mechanism. The emergence of a pressure independent rate coefficient at high temperatures is an interesting phenomenon. The reasons for this have been discussed by Miller and Klippenstein for the ethyl + O2 reaction.45 In their study, they also discovered that the least negative eigenvalue is pressure-independent at high temperature. We believe that the same arguments can be used to explain the pressure-independence of the high-temperature rate coefficient in the current study. At high temperatures, many of the peroxyl radicals that are formed by the recombination reaction will have sufficient energy to well-skip directly to bimolecular products. Increasing the pressure will decrease well-skipping, as Fig. 9b demonstrates, but there will be a compensating increase in the role of the sequential mechanism. Above 400 K, a significant portion of the Boltzmann population of the peroxyl adducts will reside at energy levels that are above the energies of the formally direct transition states (see Fig. 10a). Peroxyl adducts at these levels will be depleted by chemical reactions, but collisions continually repopulate the energy levels as they try to establish thermal equilibrium. So collisions both inhibit and promote reactivity by preventing well-skipping and repopulating reactive states. Fig. 10 also shows how the magnitude of the average energy transferred in activated collisions grows faster with temperature than in deactivating collisions. This helps to repopulate the reactive states and hinders stabilisation to unreactive states.
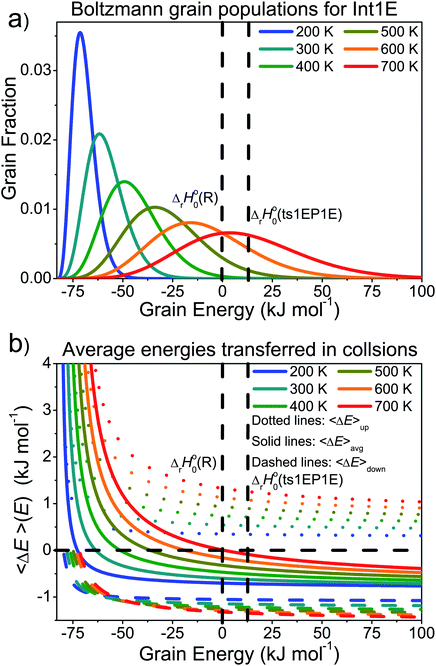 | ||
| Fig. 10 (a) The Boltzmann populations of the energy grains of Int1E as a function of temperature. (b) Average energies transferred as a function of energy at different temperatures. | ||
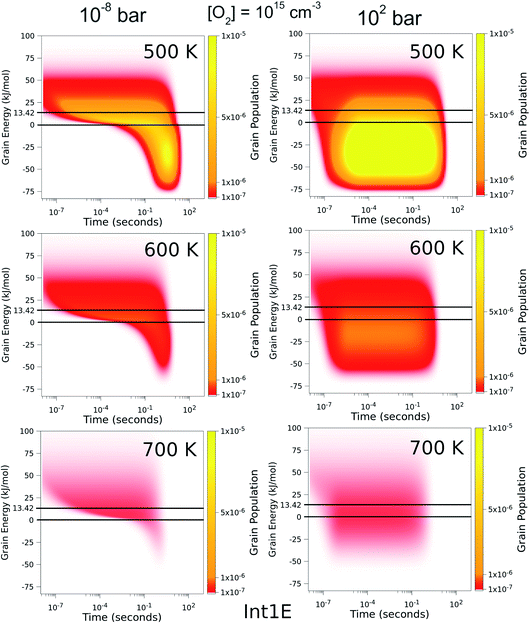
To better understand the pressure-independence of the high-temperature rate coefficient, we investigated how the populations of the energy grains of Int1E evolve in time. These results are presented in Fig. 11 and 12. The shown populations are absolute (the initial condition in the simulations was that the population of the reactants was unity at t = 0). The results are consistent with the arguments we make in the previous paragraph. Three interesting observations can be made from the figures:
(1) At 100 bar, as soon as Int1E is formed, the energy grain populations become thermalised. At 10−8 bar, Int1E grain populations eventually become thermalised at 200 K and 300 K. At higher temperatures and at 10−8 bar, there is not enough time for the Int1E energy grains to become thermalised.
(2) Above 400 K, the populations of the energy grains above the reaction threshold are virtually identical at 10−8 bar and 100 bar.
(3) At 10−8 bar, there is a quasi-stationary population of the energy grains above 0 kJ mol−1 that is maintained as long as there are reactants left (0–0.1 s). At low temperatures, the population in the reactive grains eventually gets stabilised to unreactive grains. As temperature is increased, lower and lower amounts of the population ever get stabilised to the unreactive grains.
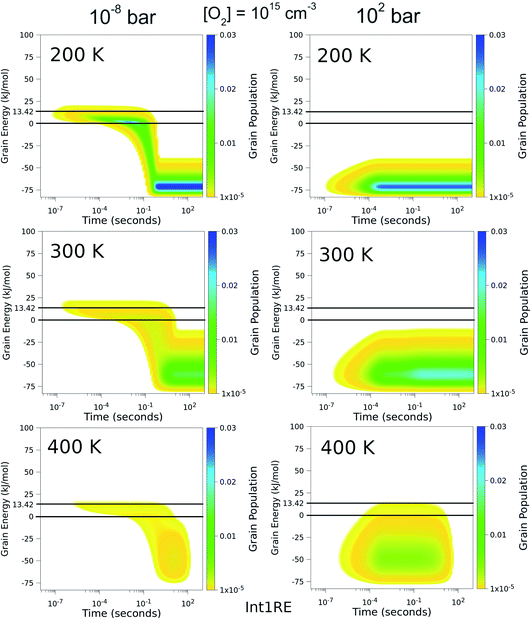 | ||
| Fig. 11 The time-dependent energy grain populations of Int1E at 10−8 bar and 102 bar between 200 K and 400 K. The horizontal lines show where the relative energies of the reactants and ts1EP1E are. | ||
4 Conclusions
We have investigated the kinetics of the reaction between (E/Z)-pent-3-en-2-yl and molecular oxygen using both experimental and computational methods. The experiments were performed with laser-photolysis–photoionization mass spectrometry. The computational work consisted of quantum chemical calculations and master equation simulations. At low temperatures (238–300 K), barrierless (E/Z)-pent-3-en-2-yl + O2 recombination reactions form peroxyl adducts. These reactions are pressure-dependent and exhibit negative temperature dependence. As the temperature is increased above room temperature, the peroxyl adducts begin to equilibrate with the reactants and multi-exponential decays are observed. At around 400 K, the equilibrium is already fully on the side of the reactants with the employed oxygen concentrations. Above 500 K, a phenomenological
reaction is observed. The rate coefficient for this reaction changes from 4.30 × 10⁻¹⁶ cm3 s−1 at 551 K to 22.1 × 10⁻¹⁶ cm3 s−1 at 752 K. Such a fast reaction at these temperatures is most likely explained by low-barrier reaction channels that lead to the formation of (E/Z)-penta-1,3-diene and hydroperoxyl. The computed barriers for these reactions are only 13–18 kJ mol−1 above the energy of the reactants. The high-temperature phenomenological (E/Z)-pent-3-en-2-yl + O2 rate coefficient has positive temperature dependence and is pressure-independent. A master equation model was constructed to simulate the studied reaction over a wide range of conditions. Trace fitting with MESMER was used for parameter optimisation. The master equation model confirms and explains the experimental finding that a pressure-independent phenomenological rate coefficient emerges at higher temperatures. Modified Arrhenius expressions are given for the most important product channels to facilitate the use of our results in autoignition and combustion modelling.
Author contributions
The experiments were conceived of by Arkke Eskola. The kinetic measurements were performed primarily by László Valkai, Satya Joshi, and Timo Pekkanen, with some assistance from Raimo Timonen. The quantum chemical calculations and master equation simulations were performed by Timo Pekkanen with the help of György Lendvay. Petri Heinonen synthesised the radical precursor. Timo Pekkanen primarily wrote the manuscript. The manuscript was substantially amended by Arkke Eskola and György Lendvay. The other authors reviewed and commented the manuscript.Conflicts of interest
There are no conflicts to declare.Acknowledgements
TTP acknowledges support from the Doctoral Programme in Chemistry and Molecular Sciences of the University of Helsinki and the Magnus Ehrnrooth foundation for funding. Project no. K129140 for GL has been implemented with the support provided by the Ministry of Innovation and Technology of Hungary from the National Research, Development and Innovation Fund, financed under the OTKA funding scheme. SPJ, LV, and AJE acknowledge support from the Academy of Finland, grant numbers 288377, 294042, 319353, 325250, and 346374. The authors also acknowledge CSC IT Center for Science in Finland for computational resources.Notes and references
- S. Sarathy, A. Farooq and G. T. Kalghatgi, Prog. Energy Combust. Sci., 2018, 65, 67–108 CrossRef.
- M. P. Rissanen, D. Amedro, A. J. Eskola, T. Kurten and R. S. Timonen, J. Phys. Chem. A, 2012, 116, 3969–3978 CrossRef CAS PubMed.
- T. T. Pekkanen, R. S. Timonen, S. H. Robertson, G. Lendvay, S. P. Joshi, T. T. Reijonen and A. J. Eskola, Phys. Chem. Chem. Phys., 2022, 24, 4729–4742 RSC.
- S. P. Joshi, T. T. Pekkanen, P. Seal, R. S. Timonen and A. J. Eskola, Phys. Chem. Chem. Phys., 2021, 23, 20419–20433 RSC.
- M. Döntgen, T. T. Pekkanen, S. P. Joshi, R. S. Timonen and A. J. Eskola, J. Phys. Chem. A, 2019, 123, 7897–7910 CrossRef PubMed.
- T. T. Pekkanen, M. Döntgen, G. Lendvay, R. S. Timonen and A. J. Eskola, Proc. Combust. Inst., 2022 Search PubMed , submitted manuscript..
- V. D. Knyazev and I. R. Slagle, J. Phys. Chem. A, 1998, 102, 8932–8940 CrossRef CAS.
- I. R. Slagle, E. Ratajczak, M. C. Heaven, D. Gutman and A. F. Wagner, J. Am. Chem. Soc., 1985, 107, 1838–1845 CrossRef CAS.
- C. A. Morgan, M. J. Pilling, J. M. Tulloch, R. P. Ruiz and K. D. Bayes, J. Chem. Soc., Faraday Trans. 2, 1982, 78, 1323–1330 RSC.
- D. Schleier, P. Constantinidis, N. Faßzheber, I. Fischer, G. Friedrichs, P. Hemberger, E. Reusch, B. Sztáray and K. Voronova, Phys. Chem. Chem. Phys., 2018, 20, 10721–10731 RSC.
- D. Schleier, E. Reusch, M. Gerlach, T. Preitschopf, D. P. Mukhopadhyay, N. Faßzheber, G. Friedrichs, P. Hemberger and I. Fischer, Phys. Chem. Chem. Phys., 2021, 23, 1539–1549 RSC.
- M. E. Jenkin, T. P. Murrells, S. J. Shalliker and G. D. Hayman, J. Chem. Soc., Faraday Trans., 1993, 89, 433–446 RSC.
- S. J. Klippenstein, Proc. Combust. Inst., 2017, 36, 77–111 CrossRef CAS.
- C. F. Goldsmith, L. B. Harding, Y. Georgievskii, J. A. Miller and S. J. Klippenstein, J. Phys. Chem. A, 2015, 119, 7766–7779 CrossRef CAS PubMed.
- Z. H. Lodhi and R. W. Walker, J. Chem. Soc., Faraday Trans., 1991, 87, 2361–2365 RSC.
- R. R. Baldwin, J. P. Bennett and R. W. Walker, J. Chem. Soc., Faraday Trans. 1, 1980, 76, 2396–2412 RSC.
- I. R. Slagle and D. Gutman, Symp. (Int.) Combust., [Proc.], 1988, 21, 875–883 CrossRef.
- D. K. Hahn, S. J. Klippenstein and J. A. Miller, Faraday Discuss., 2002, 119, 79–100 RSC.
- T. T. Pekkanen, S. P. Joshi, G. Lendvay, R. S. Timonen and A. J. Eskola, Proc. Combust. Inst., 2021, 38, 843–852 CrossRef CAS.
- T. T. Pekkanen, R. S. Timonen, G. Lendvay, M. P. Rissanen and A. J. Eskola, Proc. Combust. Inst., 2018, 299–306 Search PubMed.
- I. R. Slagle, Á. Bencsura, S.-B. Xing and D. Gutman, Symp. (Int.) Combust., [Proc.], 1992, 24, 653–660 CrossRef.
- K. B. Moore, J. M. Turney and H. F. Schaefer, J. Chem. Phys., 2017, 146, 194304 CrossRef PubMed.
- J. T. Bartis and B. Widom, J. Chem. Phys., 1974, 60, 3474–3482 CrossRef CAS.
- A. J. Eskola and R. S. Timonen, Phys. Chem. Chem. Phys., 2003, 5, 2557–2561 RSC.
- S. Désert, P. Metzner and M. Ramdani, Tetrahedron, 1992, 48, 10315–10326 CrossRef.
- V. D. Knyazev and I. R. Slagle, J. Phys. Chem. A, 1998, 102, 1770–1778 CrossRef CAS.
- D. J. Medeiros, S. H. Robertson, M. A. Blitz and P. W. Seakins, J. Phys. Chem. A, 2020, 124, 4015–4024 CrossRef CAS PubMed.
- H. Yu, X. He, S. Louis Li and D. G. Truhlar, Chem. Sci., 2016, 7, 5032–5051 RSC.
- F. Weigend and R. Ahlrichs, Phys. Chem. Chem. Phys., 2005, 7, 3297–3305 RSC.
- J. L. Bao, J. Zheng, I. M. Alecu, B. J. Lynch, Y. Zhao and D. G. Truhlar, 2017, accessed: 25.1.2022, https://comp.chem.umn.edu/freqscale/version3b2.htm.
- C. Riplinger, P. Pinski, U. Becker, E. F. Valeev and F. Neese, J. Chem. Phys., 2016, 144, 024109 CrossRef PubMed.
- M. Saitow, U. Becker, C. Riplinger, E. F. Valeev and F. Neese, J. Chem. Phys., 2017, 146, 164105 CrossRef PubMed.
- Y. Guo, C. Riplinger, U. Becker, D. G. Liakos, Y. Minenkov, L. Cavallo and F. Neese, J. Chem. Phys., 2018, 148, 011101 CrossRef PubMed.
- T. J. Lee and P. R. Taylor, Int. J. Quantum Chem., 1989, 36, 199–207 CrossRef.
- A. Halkier, T. Helgaker, P. Jørgensen, W. Klopper and J. Olsen, Chem. Phys. Lett., 1999, 302, 437–446 CrossRef CAS.
- T. Helgaker, W. Klopper, H. Koch and J. Noga, J. Chem. Phys., 1997, 106, 9639–9646 CrossRef CAS.
- A. Halkier, T. Helgaker, P. Jørgensen, W. Klopper, H. Koch, J. Olsen and A. K. Wilson, Chem. Phys. Lett., 1998, 286, 243–252 CrossRef CAS.
- F. Neese, Wiley Interdiscip. Rev.: Comput. Mol. Sci., 2012, 2, 73–78 CAS.
- M. J. Frisch, et al., Gaussian 16, Revision B.01, Gaussian Inc, Wallingford CT, 2016 Search PubMed.
- D. R. Glowacki, C.-H. Liang, C. Morley, M. J. Pilling and S. H. Robertson, J. Phys. Chem. A, 2012, 116, 9545–9560 CrossRef CAS PubMed.
- B. E. Poling, J. M. Prausnitz and J. P. O’Connell, The Properties of Gases and Liquids, McGraw-Hill, 5th edn, 2001 Search PubMed.
- C. W. Gao, J. W. Allen, W. H. Green and R. H. West, Comput. Phys. Commun., 2016, 203, 212–225 CrossRef CAS.
- J. Gang, M. J. Pilling and S. H. Robertson, Chem. Phys., 1998, 231, 183–192 CrossRef CAS.
- R. R. Baker, R. R. Baldwin, A. R. Fuller and R. W. Walker, J. Chem. Soc., Faraday Trans. 1, 1975, 71, 736–755 RSC.
- J. A. Miller and S. J. Klippenstein, Int. J. Chem. Kinet., 2001, 33, 654–668 CrossRef CAS.
Footnote |
| † Electronic supplementary information (ESI) available. See DOI: 10.1039/d2fd00031h |
| This journal is © The Royal Society of Chemistry 2022 |


