 Open Access Article
Creative Commons Attribution 3.0 Unported Licence
Disentangling sequential and concerted fragmentations of molecular polycations with covariant native frame analysis†
Joseph W.
McManus‡
 a,
Tiffany
Walmsley‡
 a,
Kiyonobu
Nagaya
b,
James R.
Harries
c,
Yoshiaki
Kumagai
d,
Hiroshi
Iwayama
e,
Michael N.R.
Ashfold
 f,
Mathew
Britton
g,
Philip H.
Bucksbaum
g,
Briony
Downes-Ward
h,
Taran
Driver
 g,
David
Heathcote
 a,
Paul
Hockett
 i,
Andrew J.
Howard
g,
Edwin
Kukk
j,
Jason W. L.
Lee
 k,
Yusong
Liu
 g,
Dennis
Milesevic
 a,
Russell S.
Minns
 h,
Akinobu
Niozu
 l,
Johannes
Niskanen
 j,
Andrew J.
Orr-Ewing
 f,
Shigeki
Owada
mn,
Daniel
Rolles
 o,
Patrick A.
Robertson
 a,
Artem
Rudenko
o,
Kiyoshi
Ueda
p,
James
Unwin
 a,
Claire
Vallance
 a,
Michael
Burt
 a,
Mark
Brouard
 a,
Ruaridh
Forbes
 *q and
Felix
Allum
 *agq
*agq
aChemistry Research Laboratory, Department of Chemistry, University of Oxford, Oxford OX1 3TA, UK
bDepartment of Physics, Kyoto University, Kyoto, 606-8502, Japan
cQST, SPring-8, Kouto 1-1-1, Sayo, Hyogo 679-5148, Japan
dDepartment of Applied Physics, Tokyo University of Agriculture and Technology, Koganei-shi, Tokyo 184-8588, Japan
eUVSOR Synchrotron Facility, Institute for Molecular Science, Okazaki 444-8585, Japan
fSchool of Chemistry, University of Bristol, Cantock's Close, Bristol BS8 1TS, UK
gStanford PULSE Institute, SLAC National Accelerator Laboratory, 2575 Sand Hill Road, Menlo Park, CA 94025, USA
hChemistry, University of Southampton, Highfield, Southampton SO17 1BJ, UK
iNational Research Council of Canada, 100 Sussex Dr., Ottawa, ON K1A 0R6, Canada
jDepartment of Physics and Astronomy, University of Turku, Turku, FI-20014, Finland
kDeutsches Elektronen-Synchrotron (DESY), Notkestraße 85, 22607 Hamburg, Germany
lGraduate School of Advanced Science and Engineering, Hiroshima University, Higashi-Hiroshima 739-8526, Japan
mRIKEN SPring-8 Center, Sayo, Hyogo 679-5148, Japan
nJapan Synchrotron Radiation Research Institute, Hyogo, Japan
oJ. R. Macdonald Laboratory, Department of Physics, Kansas State University, Manhattan, KS 66506, USA
pInstitute of Multidisciplinary Research for Advanced Materials, Tohoku University, Sendai, 980-8577, Japan
qLinac Coherent Light Source, SLAC National Accelerator Laboratory, Menlo Park, California 94025, USA. E-mail: ruforbes@slac.stanford.edu; fallum@stanford.edu
First published on 15th September 2022
Abstract
We present results from an experimental ion imaging study into the fragmentation dynamics of 1-iodopropane and 2-iodopropane following interaction with extreme ultraviolet intense femtosecond laser pulses with a photon energy of 95 eV. Using covariance imaging analysis, a range of observed fragmentation pathways of the resulting polycations can be isolated and interrogated in detail at relatively high ion count rates (∼12 ions shot−1). By incorporating the recently developed native frames analysis approach into the three-dimensional covariance imaging procedure, contributions from three-body concerted and sequential fragmentation mechanisms can be isolated. The angular distribution of the fragment ions is much more complex than in previously reported studies for triatomic polycations, and differs substantially between the two isomeric species. With support of simple simulations of the dissociation channels of interest, detailed physical insights into the fragmentation dynamics are obtained, including how the initial dissociation step in a sequential mechanism influences rovibrational dynamics in the metastable intermediate ion and how signatures of this nuclear motion manifest in the measured signals.
1 Introduction
Experimental studies of the dissociation dynamics of isolated gas-phase (poly)cations can yield wide-ranging insights,1–6 for instance in providing stringent tests for theoretical methods7–10 and aiding in understanding the chemistry and composition of planetary atmospheres.11–15 In recent years, the fragmentation behaviour of polycations has attracted further interest due to the development of time-resolved Coulomb explosion imaging (CEI) as a method to probe ultrafast photochemistry.16–21 In such experiments, the correlated velocities of fragment ions following rapid laser-induced multiple ionisations are used to probe the nuclear structure prior to the fragmentation. Multiple ionisation is typically initiated by a very intense near infrared (NIR) laser field (∼1015 W cm−2), or using a short wavelength laser source in the extreme ultraviolet (XUV) or X-ray region,22–24 as provided by modern free-electron laser (FEL) sources. In either case, a detailed understanding of many-body fragmentation dynamics of polycations is required to fully exploit CEI as a structural probe.Many-body molecular fragmentation processes are considered to occur in two regimes, sequential and concerted.1 If the bonds are broken within the approximate timescale of a single vibration, the fragmentation is said to be concerted. For demonstration, we consider the three-body dissociation of a triatomic trication ABC3+:
| ABC3+ → A+ + B+ + C+. | (1) |
 | (2) |
Because the concerted and sequential fragmentation mechanisms are two alternative pathways which can yield the same product ions, being able to distinguish between these processes is an important goal in the field of reaction dynamics. This is especially true concerning the technique of CEI, which relies on concerted breakup of the molecular ion in order to extract geometric information from the relative momenta of the fragment ions. Rajput and coworkers recently demonstrated a method for disentangling sequential three-body fragmentation events based on analysing each of the fragmentation steps in their own ‘native’ frame of reference.27 The first step is analysed in the centre-of-mass (COM) frame of the parent ion, and the second in the COM frame of the intermediate ion. The momentum imparted to the intermediate by the primary fragmentation is equal and opposite to the momentum of the primary product. The contribution this makes to the momenta of the products of the delayed fragmentation can be calculated and removed in order to isolate the momentum imparted in this secondary step. Hence, ions arising from concerted and sequential fragmentation pathways can be distinguished based on their momenta in this frame. This approach can also be used to study sequential three-body breakups in greater detail, such as extracting the lifetime of the intermediate ion.28
To determine the correlated momentum distributions of ionic fragments, which is required to fully probe many-body dissociation dynamics, coincidence analysis1,29 may be used. To meet the primary criterion for coincidence analysis that ≤1 parent ion is created per laser shot, low count rates per experimental acquisition cycle are required. For experiments with limited repetition rates (as is the case at several current FEL facilities, for instance), this requirement of low count rate can lead to impractically long data acquisitions times. An alternative, which is applicable at far higher count rates, and can achieve greater statistical certainty in shorter acquisition times, is to calculate the covariance between the quantities of interest, which is a statistical measure of their linear correlation, defined as:
 | (3) |
2 Experimental methods
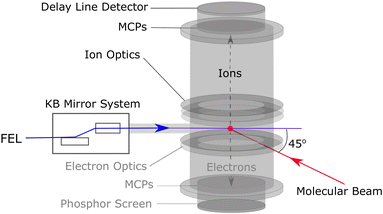
The experiments were carried out using the soft X-ray beamline (BL1) at SPring-8 Angstrom Compact free electron LAser (SACLA), Japan, which can produce XUV pulses with photon energies ranging from 40–150 eV at a repetition rate of 60 Hz, a bandwidth of 2%, and a pulse duration of approximately 30 fs.35 For the present work, XUV pulses with an average photon energy of 95 eV (wavelength = 13.1 nm) were utilised. The FEL was horizontally polarised (i.e. parallel to the detector plane). A gas intensity monitor was used to measure the XUV pulse energy on a shot-to-shot basis and an average reading of 33 μJ was extracted. Attenuation of the XUV pulse, based on experimental conditions, was achieved using a 0.6 μm Zr filter. Accounting for the expected beamline (∼90%35,36) and filter (13%) transmission, a mean pulse energy of 3.9 μJ at the molecular sample is deduced. The on-target FEL pulse energy distributions are shown in Fig. S8 of the ESI.† The XUV pulses were focused using a Kirkpatrick–Baez (KB) mirror system to a spot size of approximately 10 μm (1/e2), which corresponded to a Gaussian intensity of ≈3.3 × 10¹⁴ W cm−2.A schematic of the XUV beamline and spectrometer used in this work is shown in Fig. 1. Electron data were not recorded in this experiment. The focused XUV pulses intersected a pulsed supersonic molecular beam at the centre of a velocity map imaging37 (VMI) ion spectrometer.38 Unseeded, gaseous samples of 1-IP and 2-IP were expanded into the spectrometer chamber via a skimmer using a pulsed gas jet (General Valve), and site-selectively ionised by the XUV at the I 4d edge. The absorption cross-section of a free iodine atom at 95 eV is approximately equal to that of Xe+ (27.7 Mb), which has the same electronic configuration and is expected to become ionised in a similar manner.39,40 Based on the calculated absorption cross sections41 we expect approximately 70% of the absorbed XUV photons to be absorbed at the iodine site.22 We also note that, at this photon energy, absorption of a single XUV photon by atomic Xe produces Xe2+ and Xe3+ in an approximately 2![[thin space (1/6-em)]](https://www.rsc.org/images/entities/char_2009.gif) :
:![[thin space (1/6-em)]](https://www.rsc.org/images/entities/char_2009.gif) 1 ratio.40 Resultant ionic products were extracted using a set of ion optics and imaged using a dual Micro Channel Plate (MCP) detector equipped with a hexanode delay line detector.38 In addition to recording the x and y positions of multiple ion hits on the detector for each FEL shot (mean count rate ∼12 ions shot−1), corresponding to the momenta of the ions in the plane of the detector, accurate measurement of the arrival time of each ion (relative to an electronic trigger at the 60 Hz repetition rate of the FEL) allowed reconstruction of the ion momentum also along the TOF axis, permitting determination of the complete (three-dimensional) momentum information for each fragment.
1 ratio.40 Resultant ionic products were extracted using a set of ion optics and imaged using a dual Micro Channel Plate (MCP) detector equipped with a hexanode delay line detector.38 In addition to recording the x and y positions of multiple ion hits on the detector for each FEL shot (mean count rate ∼12 ions shot−1), corresponding to the momenta of the ions in the plane of the detector, accurate measurement of the arrival time of each ion (relative to an electronic trigger at the 60 Hz repetition rate of the FEL) allowed reconstruction of the ion momentum also along the TOF axis, permitting determination of the complete (three-dimensional) momentum information for each fragment.
3 Data processing and analysis
3.1 Three-dimensional contingent covariance analysis
In order to determine the relative momenta of different ions produced in the same fragmentation event, we use the recently developed three-dimensional covariance imaging method, as described in ref. 33. One main feature of the current work is the use of a self-amplified spontaneous emission (SASE) FEL, which produces laser pulses with properties that fluctuate considerably on a shot-by-shot basis, which in our case, most significantly, includes the total pulse energy. In such cases, false contributions to the calculated covariance can arise due to correlations with the fluctuating parameter. Two methods have been developed to correct for these effects: partial42 and contingent43 covariance analysis. Partial covariance analysis correlates the signal of interest with the fluctuating parameter, and this contribution is subtracted to produce covariance maps where the observed signatures are independent of these fluctuations.42,44,45 A contingent covariance analysis groups the raw data into small subsets over which the fluctuating parameter is approximately constant, the covariance is calculated separately for each subset, and finally the covariance maps from each subset are averaged. In addition to being easier to implement, contingent covariance analysis has the advantage that it does not assume the ion yield is linearly dependent on the fluctuating parameter, so can be more effective in mitigating nonlinear effects.43,46,47 Hence, in the present work we chose to apply a contingent covariance analysis. Based on the FEL pulse energy distribution, the data were grouped into 10 subsets (ranging from 3.04 μJ to 4.80 μJ of on-target pulse energy), each containing an equal number of acquisition cycles. The FEL pulse energy distribution for the data recorded on each molecule is shown in the ESI† in Fig. S8. The number of subsets was chosen to minimise false covariance whilst maintaining good signal-to-noise ratios. Fig. S2 in the ESI† shows the effect of varying the number of subsets for an example covariance image.3.2 Covariant native frames
A popular representation for identifying sequential three-body breakup is the Newton diagram.6 To demonstrate, a simulated Newton diagram for the fragmentation mechanism outlined in eqn (2) is shown in the left panel of Fig. 2. The simulation models the fragments as point charges located at their COM which interact exclusively under Coulomb's law (see Section S4 of the ESI† for full details on the simulation method). The intermediate ion can be both rotationally and vibrationally excited by the initial dissociation and, if its lifetime exceeds its rotational period, it will cause the momenta of secondary products to be distributed over a uniform angular range relative to the momentum of the primary product.27,28,48 The simulation assumes the lifetime of the intermediate greatly exceeds its rotational period, such that the relative angle can take any value. The result is the semicircular distributions seen in the Newton diagram which is a characteristic signature of a sequential three-body breakup.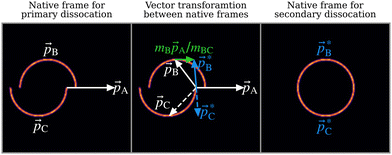 | ||
Fig. 2 Left panel: Simulated Newton diagram for the three-body sequential dissociation scheme described in eqn (2). ![[p with combining right harpoon above (vector)]](https://www.rsc.org/images/entities/i_char_0070_20d1.gif) A and A and ![[p with combining right harpoon above (vector)]](https://www.rsc.org/images/entities/i_char_0070_20d1.gif) B are measured while B are measured while ![[p with combining right harpoon above (vector)]](https://www.rsc.org/images/entities/i_char_0070_20d1.gif) C is deduced from momentum conservation. Centre panel: Diagram of the native frame transformation. The Newton diagram is broken down into its constituent vector sets and each C is deduced from momentum conservation. Centre panel: Diagram of the native frame transformation. The Newton diagram is broken down into its constituent vector sets and each ![[p with combining right harpoon above (vector)]](https://www.rsc.org/images/entities/i_char_0070_20d1.gif) B is transformed into the intermediate ion COM frame by addition of mB B is transformed into the intermediate ion COM frame by addition of mB![[p with combining right harpoon above (vector)]](https://www.rsc.org/images/entities/i_char_0070_20d1.gif) A/mBC. The transformation is illustrated for one such set of vectors. Solid arrows denote measured momentum vectors whilst dashed lines are used to indicate vectors deduced from momentum conservation. Right panel: The result of summing the full set of transformed vectors A/mBC. The transformation is illustrated for one such set of vectors. Solid arrows denote measured momentum vectors whilst dashed lines are used to indicate vectors deduced from momentum conservation. Right panel: The result of summing the full set of transformed vectors  to produce the Newton diagram in the native frame of the secondary dissociation. to produce the Newton diagram in the native frame of the secondary dissociation. | ||
Constructing a Newton diagram requires the correlated momentum information of all three fragments, typically found by performing experiments under coincidence conditions. To expedite data acquisition under the limited repetition rate of the FEL, experiments were performed under high count rate conditions, where on average several molecules are ionised per laser shot. This precludes coincidence analysis (see Fig. S1 in the ESI†), hence in this paper we extract equivalent information using a two-fold covariance analysis33 in order to produce a Newton diagram in the native frame of the secondary dissociation. The vector diagram for this process, applied to the simulated data discussed above, is shown in the centre panel of Fig. 2. By applying covariance analysis to obtain the momenta of the primary fragment ion and one of the secondary fragment ions (white arrows), the momentum imparted to the secondary fragment by the first dissociation step (green arrow) can be calculated from only the momentum of the primary fragment and knowledge of the mass of the fragment as a fraction of the mass of the intermediate (mB/mBC). Once this contribution is removed, allowing transformation into the COM frame of the intermediate ion (blue arrows), the momenta of the two secondary products are necessarily equal and opposite.
4 Experimental results
4.1 Time-of-flight data
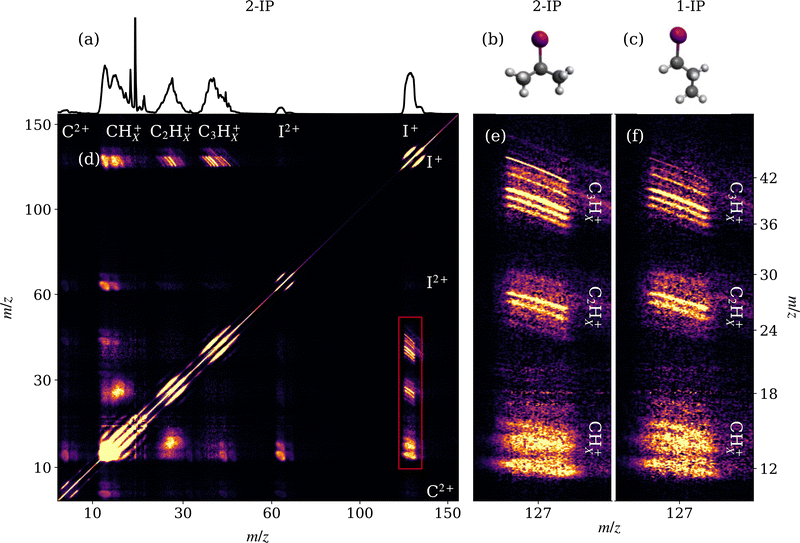
Mass spectra acquired from the XUV ionisation of 1- and 2-IP are overlaid in Fig. 3. Site-selective ionisation predominantly at the I 4d edge and subsequent Coulomb explosion of the sample yields a range of iodine and alkyl cations. Subtle differences between 1-IP and 2-IP are observed in the relative yields of the CnHx+ fragments (n = 1, 2, 3; 0 ≤ x ≤ 2n + 1) which implies that the fragmentation channels are isomer-dependent. The mass spectrum for 2-IP is reproduced in Fig. 4(a). The contingent TOF covariance map, shown in Fig. 4(d) for 2-IP, allows us to isolate pairs of ions formed via the same fragmentation channel. Along the positive diagonal is an intense line of autocovariance, with correlated ions appearing as off-diagonal elements, typically with a negative gradient. This negative gradient arises from the fact that, for pairs of ions produced in the same dissociation, if one fragment is projected away from the detector, increasing its TOF, the other is projected towards the detector.30,49 Anticorrelation of fragment momenta along the TOF axis is necessarily the case in two-body fragmentations. In Fig. 4(d), clear correlations between the I+ ion and various CnHx+ ions of different mass are highlighted by the red box, and expanded in Fig. 4(e).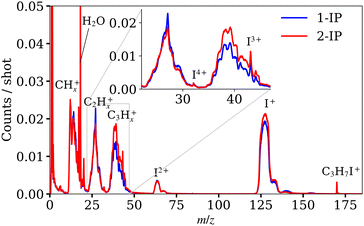 | ||
| Fig. 3 Mass spectra obtained from XUV ionisation of 1-iodopropane and 2-iodopropane. Each spectrum was calculated using the full XUV pulse energy range. The distribution of XUV pulse energies is shown in Fig. S8 of the ESI.† The spectra for C2Hx+ and C3Hx+ have been enlarged in the inset to show more clearly the different fragment yields for both isomers. | ||
The high TOF resolution of the delay line detector is sufficient to distinguish correlations between CnHx+ ions differing by a single hydrogen mass in the contingent TOF covariance map. Adjacent to this, panel (f) shows the same expanded section of the contingent covariance map for 1-IP. The full contingent covariance map for 1-IP is provided in the ESI† (Fig. S7). The two are broadly similar, however with notably different intensities for the various (I+, C3Hx+) correlations, corresponding to the differences seen in Fig. 3. The sharp structure and −1 gradient of the (I+, C3H7+) covariance is characteristic of a back-to-back Coulomb explosion between two cations, whilst other (I+, C3Hx+) signals become blurrier as hydrogen atoms are removed due to the impulse imparted when they separate. By contrast the (I+, CHx+) covariance features are significantly more diffuse, as these pairs of ions arise from a many-body dissociation process in which significant momentum is carried by the additional heavy fragments.
4.2 Three-dimensional covariance
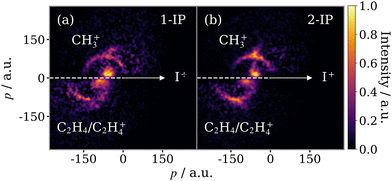
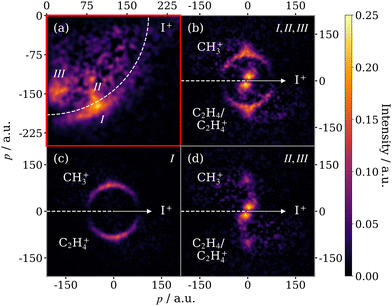
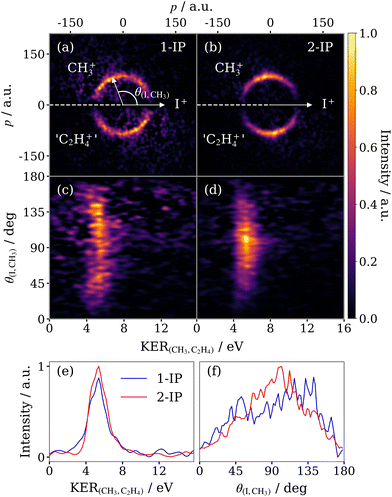
The focus of the current work is the isomer-specific three-body fragmentation pathways of the 1- and 2-IP trications into I+ + C2H4+ + CH3+. The correlated momenta for the (I+, CH3+) ion pair, determined via a two-fold contingent covariance analysis, are presented in a Newton diagram in Fig. 5. Here, the I+ momentum is constrained to the positive x-axis, the CH3+ momentum is plotted in the upper half, and the momentum of the third fragment, deduced through momentum conservation, is plotted in the lower half. An arc, characteristic of a sequential three-body dissociation process, can be seen in the data for both isomers. This process is the fragmentation of IP3+ by, first, the loss of I+, followed by the subsequent dissociation of C3H72+. In addition to the sequential breakup signal, there are two other distinct features. The first is perpendicular to the I+ momentum vector, rising from the arcing sequential fragmentation feature, and is assigned to a concerted three-body dissociation mechanism of the trication, wherein the time between the first and second steps of the breakup is short such that rotation is limited, and I+ remains in close enough proximity to influence the total kinetic energy release (KER) of the second dissociation. The second, low momentum, feature arises from the three-body breakup of IP2+ into I+, CH3+ and a neutral cofragment, assumed to be C2H4. From their relative intensities we find that the yield of this dication breakup channel is approximately half that of the trication breakup.In order to further disentangle the overlapping concerted and sequential fragmentation channels, we make use of the I+ momentum information. Fig. 6(a) displays the momentum distribution of the I+ ion produced in covariance with the CH3+ ion from 2-IP, plotted in a frame with the x-axis bisecting the I+ and CH3+ momentum vectors. Three features can be observed, which correspond directly with the channels already described: (I) the sequential three-body breakup channel produces a high momentum, constant magnitude feature; (II) descending in momentum from the sequential feature is the signal produced by the three-body concerted breakup channel; and (III) the sharp low momentum signal corresponds to three-body breakup to produce I+, CH3+ and a neutral cofragment (assumed to be C2H4). The 2-IP (I+, CH3+) covariance in Fig. 5(b) is shown in the native frame of the charged propyl intermediate in Fig. 6(b).
The sequential feature can be completely isolated by filtering the ion imaging data on the absolute magnitude of the I+ momentum prior to calculating the two-fold covariance. The result is Fig. 6(c), which is produced by constraining the I+ momentum to be above 190 a.u. Because we make use of a two-fold covariance calculation and deduce momentum of the third fragment through momentum conservation, we are inherently blind to its identity. However, we confirm the sequential fragmentation channel yields C2H4+ by calculating the two-fold covariance between C2H4+ and I+ and obtaining approximately the same momentum distribution (see Fig. S3 of the ESI†). Additionally, the momentum matching of the CH3+ and C2H4+ fragments in this frame confirms the mechanism for this sequential process, involving, first, the loss of I+ followed by dissociation of a propyl dication. Channels (II) and (III) yield I+ with similar momenta and hence cannot be completely separated using this method. However, as the momenta of CH3+ produced by the two channels are drastically different, the channels are well resolved in the Newton diagram in the native frame of the C3H7+/C3H72+ intermediate (Fig. 6(d)).
4.3 Three-body sequential fragmentation
Fig. 7 compares the correlated ion momentum distributions associated with the sequential fragmentation channel for 1-IP (panels (a) and (c)) and 2-IP (panels (b) and (d)). In panels (a) and (b), these covariances are represented as a native frame Newton plot, as shown previously in Fig. 6(c) for the 2-IP case. In panels (c) and (d), the covariance is shown as a function of the KER of the secondary fragmentation (C3H72+ → CH3+ + C2H4+) and the recoil angle between the I+ and CH3+ ions. There are several important features to note in these covariance maps. Firstly, in both molecules, the KER of the secondary fragmentation is essentially independent of the angle between the emitted I+ and CH3+ fragments. This implies that the fragmentation is truly sequential, i.e. at the point of secondary fragmentation, the I+ ion is greatly separated from the C3H72+ intermediate and thus the KER of the secondary fragmentation does not depend on the orientation with respect to the departing iodine fragment. In both isomers, the constant KER of the secondary fragmentation takes a value of 5.3 ± 0.9 eV (Fig. 7(e)), with an error determined by the standard deviation of a Gaussian fit.Significant differences are observed in the angular distribution of the secondary fragmentation relative to the I+ emission direction in the two isomers, as compared in Fig. 7(f). For 1-IP, a very broad angular distribution is observed, with some degree of asymmetry (more signal is observed close to 180 degrees than close to 0 degrees). In 2-IP, a significantly narrower angular distribution is observed, with a relatively sharp peak at ∼95°. We note that these angular distributions are more complex than observed in previous studies that used the native frames approach,27,28 which investigated triatomic molecules. In such cases, under the assumption that rotation occurs within the plane of the diatomic intermediate, the angular distribution takes the form of an exponential decay, with a decay constant determined by the ratio of the lifetime and the rotational period of the intermediate.28 In the limit of a very long lifetime relative to the rotational timescale, an isotropic angular distribution is observed.27
In the case of a polyatomic metastable intermediate, however, the situation is more complex, with additional factors that can affect the angular distribution of ion emission within the native frame of the secondary dissociation. These factors include: rotation of the intermediate ion about different axes relative to the initial fragmentation; the relationship between the 3D structure of the intermediate and the emission direction of ions following its fragmentation; and any other nuclear dynamics occurring (for instance, bending) in the intermediate prior to its dissociation. In order to assess the effects of these dynamics on the measured ion momentum correlations, we conducted a series of classical simulations of the sequential Coulomb explosion process for both isomers which we compare to the experimental data in the following section.
5 Classical Coulomb explosion simulations
As our starting basis, we take the simple model introduced in Section 3.2, which considers the fragments as point charges. The simulation is initiated from the molecules neutral ground state geometry (in its lowest energy, fully staggered conformation) and, in this first iteration, the structure of the propyl dication is static. The first modification made accounts for the variation of the lifetime of the intermediate ion. Rather than having a single, fixed lifetime, the propyl dication was modelled with a distribution of lifetimes by assuming its population (number density (n) of C3H72+) decays exponentially as a function of time (t), with a characteristic lifetime τ.| n(C3H72+) ∝ e−t/τ | (4) |
The input parameters for the simulations presented in this section were empirically chosen to reproduce the experimental results. The simulations provide qualitative insights into the possible nuclear dynamics that may occur in the propyl dication, but preclude quantitative comparisons. A demonstration of how the simulated results vary as a function of τ and rotational period is given in the ESI† (Fig. S4 and S5).
5.1 Three-body concerted fragmentation
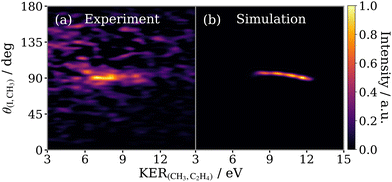
Initially we verify that if τ is made very short (for instance, on the order of vibrational motion), the simulation is able to reproduce the experimentally observed (I+, CH3+) covariance feature for the concerted three-body breakup of 2-IP3+. The success of this approximation can be seen in Fig. 8 which compares (a) the isolated signal from the concerted three-body fragmentation of 2-IP3+ (shown in Fig. 6(d)) plotted as a function KERCH3,C2H4vs. θI,CH3, with (b) the results of the simulation for the same process with τ = 25 fs. The predicted recoil angle, narrowly distributed around 90°, agrees well with the experimentally observed angular distribution of the high KER feature. The broad KER range arises due to the range of delays between the first and second dissociation steps, implying that the concerted fragmentation is somewhat asynchronous. The KER decreases to a lower limit when the secondary dissociation process occurs more than 200 fs after the first. At this point, the separation between the I+ and propyl dication is great enough that the effect of the I+ fragment on the secondary dissociation energetics is negligible. Despite the simplicity of this simulation, the qualitative likeness of Fig. 8(a and b) provides valuable insight into characterising the fragmentation process. An analogous comparison for the concerted fragmentation of the 1-IP isomer is shown in the ESI† in Fig. S6.5.2 Three-body sequential fragmentation of the 1-iodopropane trication
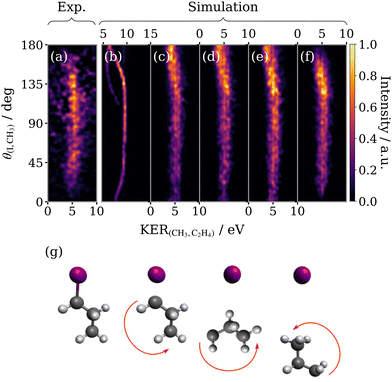
By increasing the lifetime of the propyl dication τ in the model, the three-body sequential breakup of 1-IP3+ may be simulated. Fig. 9 compares the experimental native frame covariance signal for 1-IP to that extracted from classical simulations accounting for a range of physical processes. The impulse from the primary dissociation of the C–I bond is expected to impart a large torque50 rotating the intermediate as depicted schematically in Fig. 9(g). The rotational states populated by this process will be much higher than the thermal population in the skimmed molecular beam. We therefore predict that the relative recoil angle between the primary fragment I+ and the secondary fragment CH3+ will decrease as the propyl ion rotates to orientate the methyl group towards the recoiling I+. As can be seen in the experimental KERCH3,C2H4vs. θI,CH3 plot (Fig. 9(a)), this produces an angular distribution which peaks at an obtuse angle and decays slightly towards lower values. Performing a simulation with a lifetime τ which is half its rotational period, successfully reproduces the qualitative form of this angular decay (panel (b)). However, many discrepancies still exist between (a) and (b) which are primarily due to nuclear dynamics occurring in the intermediate ion prior to dissociation which have been neglected in the simulation shown in Fig. 9(b). Accounting for apparent geometry changes in the propyl ion provides insight into these dynamics.Firstly, we turn to the KER of the secondary dissociation step, which in Fig. 9(b) is significantly overestimated and varies dramatically close to 0 and 180°. A Gaussian fitting to the experimental data (Fig. 7) was used to extract a KER of 5.3 ± 0.9 eV for the sequential breakup channel and combined with Coulombs law to calculate an effective CH3–C2H4 separation at the instance of the secondary fragmentation of 2.96 Å, approximately double the C–C bond length in the neutral ground state parent molecule. We stress that this apparent stretch of the bond length used in the model is not solely indicative of changes to the nuclear geometry in the propyl dication intermediate, but also the deviation of the Coulomb explosion dynamics from the limit of two Coulombically repelling point charges, which may be significant in this case. Incorporating this effective separation into the model produces a KER-corrected simulation (panel (c)). The blurring results in a much broader KER distribution which varies less dramatically with θ(I,CH3) and which appears to capture the subtle shift to slightly lower KER seen for angles close to 180 degrees in the experimental data (panel (a)). Because the intermediate ion in this system is polyatomic, the primary dissociation step may not just rotationally excite the propyl ion, but also vibrationally excite it. We expect the predominant vibrational modes are low frequency bending modes, and to simulate this motion, a Gaussian variation of the C–C–C bond angle with a width of 30° was included. The result (panel (d)), unsurprisingly, is a blurring of the overall angular distribution, which appears to somewhat decrease the angle of maximum intensity, but it remains noticeably larger than observed in the experimental data. The next modification we make is to simulate a relaxation of the C–C–C bond angle in the propyl ion by 20° relative to the optimised neutral ground state 1-IP geometry (panel (e)), which could be the result of changes in the bonding in the propyl dication. This change decreases the angle of maximum intensity, as observed in the experimental data. The final effect we must account for is rotation of the intermediate about different axes relative to the initial fragmentation. The excitation is deemed to be small, therefore we apply a normal distribution of rotation about a perpendicular axis to the simulated data, with a narrow width of 10°. This reduces the vertical span and consequently shifts the position of the angular maximum to lower theta (panel (f)), which markedly increase the resemblance to the experiment.
The modifications to the simulation outlined here have been used to account for the additional behaviours associated with the polyatomic nature of the intermediate radical and, together, they represent a series of improvements to the model. Comparing the first and last panels of Fig. 9, the end result is an excellent qualitative agreement between the experimental and simulated sequential fragmentation channel feature, given the inherent simplicity of the model employed. The concepts originally developed to describe sequential three-body dissociation of a triatomic trication expand well to describing fragmentation in a larger polyatomic trication, through simple modelling of the additional degrees of freedom. The simplicity of the model precludes a quantitative comparison, however, it can be used infer how the initial dissociation influences the nuclear dynamics occurring in the propyl ion during its lifetime.
5.3 Three-body sequential fragmentation of the 2-iodopropane trication
The simulated sequential three-body fragmentation feature for 2-IP3+ is compared with experiment in Fig. 10. The intensity in panel (a) peaks around 100°, close to the angle separating the iodine and methyl groups in the parent molecule. The angular distribution is slightly asymmetric about this point, being weighted towards smaller θ(I,CH3). It should be noted that the motion of the 2-propyl radical following the initial C–I dissociation is expected to be rather different in 2-IP than that of the 1-propyl radical from 1-IP, as suggested by the different forms of the recoil angle distribution in the native frame (compared previously in Fig. 7(f)). The impulse of this dissociation now acts symmetrically on the 2-propyl dication, with much less torque applied50 (i.e. the dissociation momentum vector is directed closer to the centre-of-mass of the propyl radical). Because the iodine atom in 2-IP is out-of-plane of the C atom chain, the initial dissociation step in 2-IP3+ that ejects I+ initiates rotation in the propyl dication such that the two terminal methyl components of the carbon chain pivot first towards a minimum methyl-iodine recoil angle after approximately a quarter rotation, followed by a maximum recoil angle after another half rotation, as depicted in Fig. 10(g). Assuming that rotation occurs purely in this manner restricts the range of possible recoil angles between the I+ and CH3+ ions. Performing a simulation with a lifetime which is half the rotational period, reproduces the ejection of the methyl fragment predominantly at a relative angle to the I+ momentum vector which is lower than produced by concerted fragmentation. The KER predicted by the simulation was once again corrected (panel (c)) using Coulomb's law to infer an effective CH3–C2H4 separation at the instance of secondary fragmentation from the experimental KER distribution, which is identical in both isomers.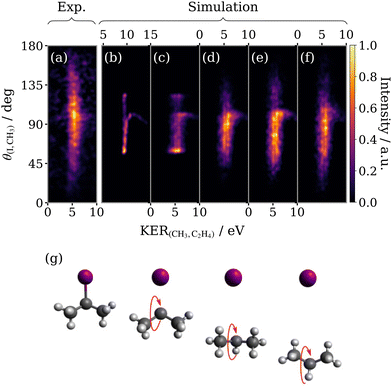 | ||
| Fig. 10 Experimental (a) and simulated (b–f) covariance maps for sequential three-body breakup of 2-IP3+ as a function of KER of the secondary products (KER(CH3,C2H4)) and the relative recoil angle between the iodine and methyl ions (θ(I,CH3)). The simulated (b–f) covariance maps are the analogue of those in Fig. 9 – (b) the basic model; (c) uses an effective CH3–C2H4 separation; (d) addition of bending in the propyl intermediate C–C–C bond angle; (e) average propyl bond angle is compressed by 20° below its value in the equilibrium geometry of 2-IP; (f) includes some rotation of the intermediate about a perpendicular axis. (g) Schematic diagram of the rotation of the 2-propyl ion with respect to the emission direction of I+. | ||
At this stage, the simulation outputs a θ(I,CH3) range, limited by the fixed C–C–C bond angle, which is much narrower than observed in experiment. It correctly predicts a local maximum at around 100°, but incorrectly predicts sharp intense features at the limit of the angular range, corresponding to the rotational turn-around points of the propyl dication. To resolve these discrepancies, we implement the same sequence of modifications outlined in the previous section, beginning with excitation of the bending mode in the propyl fragment, shown in panel (d). The bending mode has a much greater impact on the form of the simulated feature for 2-IP than was seen for 1-IP. The blurring has the joint effect of removing the maxima at the turn-around points and expanding the angular range, both of which improve the resemblance to the experimental sequential fragmentation feature. Panel (e) shows the result of distorting the bond angle of the propyl dication, this time decreasing it by 20° relative to the optimised neutral ground state 2-IP geometry in order to increase the angular range of the feature, which now better resembles that seen in (a). Again, the final modification made was to model an additional small rotation about an axis perpendicular to the rotation caused by the initial fragmentation (panel (f)). This further increases the vertical span but suppresses the intensity maximum.
The model is somewhat less successful at capturing the full structure of the angular distribution of the sequential breakup of 2-IP3+. However, the results are encouraging for a simple classical point-charge model. The model does not account for the ensemble of starting geometries of the molecular ion (for instance due to different conformers of the neutral molecule) nor internal motions other than the bending motion of the propyl dication. The model also neglects variations in the charge distribution of the trication and any deviations from Coulombic behaviour in the fragmentation (e.g., due to residual bonding interaction in the trication). Despite these limitations it is able to demonstrate the important role of the nuclear dynamics in the intermediate fragment. In particular, the differences observed between 1-IP and 2-IP indicate the important role of rotation in the propyl dication intermediate, which may occur about multiple axes, in contrast to the simpler case of triatomic fragmentations in which rotation may be assumed to occur in the fragmentation plane.27,28 Furthermore, evidence suggests that other nuclear motion – namely C–C stretching and bending – has a significant impact on the sequential photofragmentation dynamics. To further investigate these effects in future works, full theoretical trajectory calculations on ab initio potential energy surfaces would be desirable, albeit a significant theoretical challenge given the possible contributions from many electronic states of the polycation.51–53 Given this inherent theoretical complexity, we believe that comparison of predictions from simple models of the dissociation process, as presented here, are valuable in extracting physical insights from the correlated fragment momentum distributions measured in coincidence or covariance imaging experiments.
6 Conclusions
We have presented first results for a new data analysis approach, which combines three-dimensional covariance imaging with the native frames analysis approach. This technique has been applied to separate the concerted and sequential three-body Coulomb explosion pathways of 1- and 2-IP trications into I+ + CH3+ + C2H4+ formed following photoionization in the XUV above the I 4d edge, and study the isomer-specific dynamics of the three-body dissociation processes in detail. Our results demonstrate the worth of this technique as a tool for studying the fragmentation channels which involve a long-lived polyatomic intermediate. To interpret the angular distribution of ion ejection within the native frame of the secondary dissociation, we used a classical Coulomb explosion model of the sequential process which incorporates possible nuclear motions of the propyl dication intermediate following the primary dissociation. Despite the apparent simplicity of the model, it offers valuable insight into how the torsional and electrostatic forces of the primary dissociation influence the nuclear dynamics in the propyl fragment occurring during its lifetime, and result in observable effects in the angular and kinetic distributions of the secondary fragments which differ for the two isomeric species studied.Author contributions
F. A. and R. F. conceived the experiment, the plan for which benefited from further input from J. H., R. M. and K. N. The sample delivery and spectrometer were prepared by J. H. and K. N., Y. K. arranged the data acquisition software and S. O. prepared the beamline. The experiment was conducted onsite by J. H., H. I., Y. K. and K. N., with online participation in the experiment by all coauthors. The experiment data was analyzed by F. A., Y. K., J. M. and T. W. Finally, F. A., M. Br., M. Bu., R. F., J. M. and T. W. interpreted the results and wrote the manuscript with input from all the authors.Conflicts of interest
There are no conflicts to declare.Acknowledgements
The experiment was performed at SACLA with the approval of JASRI and the program review committee (Proposal No. 2021A8038 Forbes). We thank the technical and scientific staff of SACLA for their hospitality and support before and during the beamtime. R. F. and F. A. gratefully acknowledge support from the Linac Coherent Light Source, SLAC National Accelerator Laboratory, which is supported by the US Department of Energy, Office of Science, Office of Basic Energy Sciences, under contract no. DE-AC02-76SF00515. D. R. and A. R. were supported by contract no. DE-FG02-86ER13491 from the same funding agency. J. W. L. L. acknowledges financial support via the Helmholtz-ERC Recognition Award (ERC-RA-0043) of the Helmholtz Association (HGF). B. D. W. thanks the CLF and the University of Southampton for a studentship. R. S. M. thanks the EPSRC for financial support (EP/R010609/1). J. M., M. Br., D. H., C. V. and A. J. O.-E. gratefully acknowledge the support of EPSRC Programme grant EP/V026690/1. P. A. R., C. V. and M. Br. also gratefully acknowledge the support of EPSRC Programme grant EP/T021675. M. Bu. and T. W. are grateful to EPSRC for support from EP/S028617/1. T. W. is additionally thankful to EPSRC for studentship funding and Jesus College, Oxford for a partial fee scholarship. P. H. B., A. J. H. and M. B. were supported by the National Science Foundation. A. J. H. was supported under a Stanford Graduate Fellowship as the 2019 Albion Walter Hewlett Fellow. Y. K. acknowledges support by JSPS KAKENHI Grant No. 20K14427. For the purpose of Open Access, the author has applied a CC BY public copyright licence to any Author Accepted Manuscript version arising from this submission.Notes and references
- J. H. D. Eland, Mol. Phys., 1987, 61, 725–745 CrossRef CAS
.
- P. J. Richardson, J. H. D. Eland and P. Lablanquie, Org. Mass Spectrom., 1986, 21, 289–294 CrossRef CAS
.
- S. D. Price, J. H. D. Eland, P. G. Fournier, J. Fournier and P. Millié, J. Chem. Phys., 1988, 88, 1511–1515 CrossRef CAS
.
- R. Thissen, J. Delwiche, J. M. Robbe, D. Duflot, J. P. Flament and J. H. D. Eland, J. Chem. Phys., 1993, 99, 6590–6599 CrossRef CAS
.
- S. Hsieh and J. H. D. Eland, J. Mass Spectrom., 1996, 31, 1054–1060 CrossRef CAS
.
- S. Hsieh and J. H. D. Eland, J. Phys. B: Atom., Mol. Opt. Phys., 1997, 30, 4515 CrossRef CAS
.
- M. Hochlaf and J. H. D. Eland, J. Chem. Phys., 2004, 120, 6449–6460 CrossRef CAS
.
- A. M. Mebel, T. S. Zyubina, Y. A. Dyakov, A. D. Bandrauk and S. H. Lin, Int. J. Quantum Chem., 2005, 102, 506–519 CrossRef CAS
.
- G. Reitsma, H. Zettergren, S. Martin, R. Brédy, L. Chen, J. Bernard, R. Hoekstra and T. Schlathölter, J. Phys. B: Atom., Mol. Opt. Phys., 2012, 45, 215201 CrossRef
.
- G. L. Gutsev, S. L. McPherson, H. A. López Peña, D. A. Boateng, L. G. Gutsev, B. R. Ramachandran and K. M. Tibbetts, J. Phys. Chem. A, 2020, 124, 7427–7438 CrossRef CAS PubMed
.
- G. Gronoff, J. Lilensten, C. Simon, O. Witasse, R. Thissen, O. Dutuit and C. Alcaraz, Astron. Astrophys., 2007, 465, 641–645 CrossRef CAS
.
- R. Thissen, O. Witasse, O. Dutuit, C. S. Wedlund, G. Gronoff and J. Lilensten, Phys. Chem. Chem. Phys., 2011, 13, 18264–18287 RSC
.
- M. Alagia, N. Balucani, P. Candori, S. Falcinelli, F. Pirani, R. Richter, M. Rosi, S. Stranges and F. Vecchiocattivi, Rendiconti Lincei, 2013, 24, 53–65 CrossRef
.
- O. Dutuit, N. Carrasco, R. Thissen, V. Vuitton, C. Alcaraz, P. Pernot, N. Balucani, P. Casavecchia, A. Canosa and S. Le Picard,
et al.
, Astrophys. J. Suppl. Ser., 2013, 204, 20 CrossRef
.
- S. Falcinelli, M. Rosi, P. Candori, F. Vecchiocattivi, J. M. Farrar, F. Pirani, N. Balucani, M. Alagia, R. Richter and S. Stranges, Planetary Space Sci., 2014, 99, 149–157 CrossRef CAS
.
- H. Stapelfeldt, E. Constant and P. B. Corkum, Phys. Rev. Lett., 1995, 74, 3780–3783 CrossRef CAS
.
- F. Légaré, K. F. Lee, A. D. Bandrauk, D. M. Villeneuve and P. B. Corkum, J. Phys. B: Atom., Mol. Opt. Phys., 2006, 39, S503–S513 CrossRef
.
- A. Matsuda, M. Fushitani, E. J. Takahashi and A. Hishikawa, Phys. Chem. Chem. Phys., 2011, 13, 8697–8704 RSC
.
- X. Ding, R. Forbes, M. Kübel, K. F. Lee, M. Spanner, A. Y. Naumov, D. M. Villeneuve, A. Stolow, P. B. Corkum and A. Staudte, J. Chem. Phys., 2019, 151, 174301 CrossRef PubMed
.
- T. Endo, S. P. Neville, V. Wanie, S. Beaulieu, C. Qu, J. Deschamps, P. Lassonde, B. E. Schmidt, H. Fujise and M. Fushitani,
et al.
, Science, 2020, 370, 1072–1077 CrossRef CAS PubMed
.
- S. Bhattacharyya, K. Borne, F. Ziaee, S. Pathak, E. Wang, A. S. Venkatachalam, X. Li, N. Marshall, K. D. Carnes and C. W. Fehrenbach,
et al.
, J. Phys. Chem. Lett., 2022, 13, 5845–5853 CrossRef CAS PubMed
.
- K. Amini, E. Savelyev, F. Brauße, N. Berrah, C. Bomme, M. Brouard, M. Burt, L. Christensen, S. Düsterer and B. Erk,
et al.
, Struct. Dyn., 2018, 5, 014301 CrossRef
.
- F. Allum, N. Anders, M. Brouard, P. Bucksbaum, M. Burt, B. Downes-Ward, S. Grundmann, J. Harries, Y. Ishimura and H. Iwayama,
et al.
, Faraday Disc., 2021, 228, 571–596 RSC
.
- R. Boll, J. M. Schäfer, B. Richard, K. Fehre, G. Kastirke, Z. Jurek, M. S. Schöffler, M. M. Abdullah, N. Anders and T. M. Baumann,
et al.
, Nat. Phys., 2022, 18, 423–428 Search PubMed
.
- S. Pathak, R. Obaid, S. Bhattacharyya, J. Bürger, X. Li, J. Tross, T. Severt, B. Davis, R. C. Bilodeau and C. A. Trallero-Herrero,
et al.
, J. Phys. Chem. Lett., 2020, 11, 10205–10211 Search PubMed
.
- U. Ablikim, C. Bomme, E. Savelyev, H. Xiong, R. Kushawaha, R. Boll, K. Amini, T. Osipov, D. Kilcoyne and A. Rudenko,
et al.
, Phys. Chem. Chem. Phys., 2017, 19, 13419–13431 RSC
.
- J. Rajput, T. Severt, B. Berry, B. Jochim, P. Feizollah, B. Kaderiya, M. Zohrabi, U. Ablikim, F. Ziaee and K. Raju Pandiri,
et al.
, Phys. Rev. Lett., 2018, 120, 103001 CrossRef CAS PubMed
.
- J. Rajput, H. Kumar, P. Bhatt and C. P. Safvan, Sci. Rep., 2020, 10, 1–8 CrossRef PubMed
.
- J. H. D. Eland, F. S. Wort and R. N. Royds, J. Electron Spectrosc. Relat. Phenom., 1986, 41, 297–309 CrossRef CAS
.
- L. J. Frasinski, K. Codling and P. A. Hatherly, Science, 1989, 246, 1029–1031 CrossRef CAS PubMed
.
- C. S. Slater, S. Blake, M. Brouard, A. Lauer, C. Vallance, J. J. John, R. Turchetta, A. Nomerotski, L. Christensen and J. H. Nielsen,
et al.
, Phys. Rev. A: At., Mol., Opt. Phys., 2014, 89, 011401 CrossRef
.
- C. S. Slater, S. Blake, M. Brouard, A. Lauer, C. Vallance, C. S. Bohun, L. Christensen, J. H. Nielsen, M. P. Johansson and H. Stapelfeldt, Phys. Rev. A: At., Mol., Opt. Phys., 2015, 91, 053424 CrossRef
.
- F. Allum, C. Cheng, A. J. Howard, P. H. Bucksbaum, M. Brouard, T. Weinacht and R. Forbes, J. Phys. Chem. Lett., 2021, 12, 8302–8308 CrossRef CAS PubMed
.
- J. W. L. Lee, H. Köckert, D. Heathcote, D. Popat, R. T. Chapman, G. Karras, P. Majchrzak, E. Springate and C. Vallance, Commun. Chem., 2020, 3, 1–6 CrossRef
.
- S. Owada, M. Fushitani, A. Matsuda, H. Fujise, Y. Sasaki, Y. Hikosaka, A. Hishikawa and M. Yabashi, J. Synchrotron Radiat., 2020, 27, 1362–1365 CrossRef CAS PubMed
.
- S. Owada, K. Togawa, T. Inagaki, T. Hara, T. Tanaka, Y. Joti, T. Koyama, K. Nakajima, H. Ohashi and Y. Senba,
et al.
, J. Synchrotron Radiat., 2018, 25, 282–288 CrossRef CAS PubMed
.
- A. T. J. B. Eppink and D. H. Parker, Rev. Sci. Instrum., 1997, 68, 3477–3484 CrossRef CAS
.
- H. Fukuzawa, K. Nagaya and K. Ueda, Nucl. Instrum. Methods Phys. Res., Sect. A, 2018, 907, 116–131 CrossRef CAS
.
- T. N. Olney, G. Cooper and C. E. Brion, Chem. Phys., 1998, 232, 211–237 CrossRef CAS
.
- N. Saito and I. H. Suzuki, Int. J. Mass Spectrom. Ion Process., 1992, 115, 157–172 CrossRef CAS
.
-
J. J. Yeh, Atomic Calculation of Photoionization Cross-sections and Asymmetry Parameters, Gordon & Breach Science Publishers, 1993 Search PubMed
.
- L. J. Frasinski, V. Zhaunerchyk, M. Mucke, R. J. Squibb, M. Siano, J. H. D. Eland, P. Linusson, P. V. d Meulen, P. Salén and R. D. Thomas,
et al.
, Phys. Rev. Lett., 2013, 111, 073002 CrossRef CAS PubMed
.
- V. Zhaunerchyk, L. J. Frasinski, J. H. D. Eland and R. Feifel, Phys. Rev. A: At., Mol., Opt. Phys., 2014, 89, 053418 CrossRef
.
- V. Zhaunerchyk, M. Mucke, P. Salén, P. V. D. Meulen, M. Kaminska, R. J. Squibb, L. J. Frasinski, M. Siano, J. H. D. Eland and P. Linusson,
et al.
, J. Phys. B: Atom., Mol. Opt. Phys., 2013, 46, 164034 CrossRef
.
- M. Mucke, V. Zhaunerchyk, L. J. Frasinski, R. J. Squibb, M. Siano, J. H. D. Eland, P. Linusson, P. Salén, P. Vd Meulen and R. D. Thomas,
et al.
, New J. Phys., 2015, 17, 073002 CrossRef
.
- D. Heathcote and C. Vallance, J. Phys. Chem. A, 2021, 125, 7092–7098 CrossRef CAS PubMed
.
- L. J. Frasinski, J. Phys. B: Atom., Mol. Opt. Phys., 2016, 49, 152004 CrossRef
.
- H. Kumar, P. Bhatt, C. P. Safvan and J. Rajput, J. Chem. Phys., 2018, 148, 064302 CrossRef PubMed
.
- J. H. D. Eland, Acc. Chem. Res., 1989, 22, 381–387 CrossRef CAS
.
- M. E. Corrales, V. Loriot, G. Balerdi, J. González-Vázquez, R. de Nalda, L. Banares and A. H. Zewail, Phys. Chem. Chem. Phys., 2014, 16, 8812–8818 RSC
.
- Z. Li, L. Inhester, C. Liekhus-Schmaltz, B. F. Curchod, J. W. Snyder, N. Medvedev, J. Cryan, T. Osipov, S. Pabst and O. Vendrell,
et al.
, Nat. Commun., 2017, 8, 1–7 CrossRef
.
- Z. L. Streeter, F. L. Yip, R. R. Lucchese, B. Gervais, T. N. Rescigno and C. W. McCurdy, Phys. Rev. A, 2018, 98, 053429 CrossRef CAS
.
- W. Zhou, L. F. Ge, G. A. Cooper, S. W. Crane, M. H. Evans, M. N. R. Ashfold and C. Vallance, J. Chem. Phys., 2020, 153, 184201 CrossRef CAS PubMed
.
Footnotes |
| † Electronic supplementary information (ESI) available. See DOI: https://doi.org/10.1039/d2cp03029b |
| ‡ These authors contributed equally to this work. |
| This journal is © the Owner Societies 2022 |

