
Auger electron spectroscopy of fulminic acid, HCNO: an experimental and theoretical study†
Marius
Gerlach
 a,
Tobias
Preitschopf
a,
Emil
Karaev
a,
Heidy M.
Quitián-Lara‡
a,
Dennis
Mayer
b,
John
Bozek
c,
Ingo
Fischer
*a and
Reinhold F.
Fink
*d
a,
Tobias
Preitschopf
a,
Emil
Karaev
a,
Heidy M.
Quitián-Lara‡
a,
Dennis
Mayer
b,
John
Bozek
c,
Ingo
Fischer
*a and
Reinhold F.
Fink
*d
aInstitute of Physical and Theoretical Chemistry, University of Würzburg, 97074 Würzburg, Germany. E-mail: ingo.fischer@uni-wuerzburg.de; Tel: +49 931 31 86360
bInstitut für Physik und Astronomie, Universität Potsdam, Karl-Liebknecht-Straße 24/25, 14476 Potsdam-Golm, Germany
cSynchrotron SOLEIL, L'Orme des Merisiers, 91192 Gif-sur-Yvette, France
dInstitut für Physikalische und Theoretische Chemie, Universität Tübingen, Auf der Morgenstelle 18, 72076 Tübingen, Germany. E-mail: reinhold.fink@uni-tuebingen.de
First published on 8th June 2022
Abstract
HCNO is a molecule of considerable astrochemical interest as a precursor to prebiotic molecules. It is synthesized by preparative pyrolysis and is unstable at room temperature. Here, we investigate its spectroscopy in the soft X-ray regime at the C 1s, N 1s and O 1s edges. All 1s ionization energies are reported and X-ray absorption spectra reveal the transitions from the 1s to the π* state. Resonant and normal Auger electron spectra for the decay of the core hole states are recorded in a hemispherical analyzer. An assignment of the experimental spectra is provided with the aid of theoretical counterparts. The latter are using a valence configuration interaction representation of the intermediate and final state energies and wavefunctions, the one-center approximation for transition rates and band shapes according to the moment theory. The computed spectra are in very good agreement with the experimental data and most of the relevant bands are assigned. Additionally, we present a simple approach to estimate relative Auger transition rates on the basis of a minimal basis representation of the molecular orbitals. We demonstrate that this provides a qualitatively good and reliable estimate for several signals in the normal and resonant Auger electron spectra which have significantly different intensities in the decay of the three core holes.
1 Introduction
Fulminic acid, HCNO, has an illustrious history.1,2 It was first prepared by Edward Howard in 1800 by combining ethanol, nitric oxide and mercury oxide. A white crystalline substance formed, which upon addition of sulfuric acid detonated. Howard called the compound “a new fulminating mercury” and described the compound to have a “saline taste”.3 Today we know that the substance Howard discovered was the highly explosive mercury fulminate Hg(CNO)2. In 1899, Ley and Kissel first proposed the structures CNO− and HCNO for the fulminate salt and fulminic acid.4 This was supported by the observations of the 1,3-dipolar addition of fulminic acid to unsaturated systems by Huisgen in 1961.5 The first spectroscopic evidence was presented in the form of a gas phase IR spectrum of isolated fulminic acid.6 Fulminic acid has now been investigated with numerous spectroscopic methods, such as IR-spectroscopy,6–10 rotational spectroscopy10,11 and photoelectron spectroscopy.12,13 Additionally, Feng et al. studied the reaction kinetics with OH14 and the photodissociation of HCNO at 248 nm and 193 nm.15,16 In contrast, no studies in the X-ray regime have been reported yet. Because HCNO consists of only 4 atoms and 22 electrons it has also been attractive for theoretical chemists early on. This is best evidenced by Paulings calculation of the free energy of the [H, N, C, O] system already in 1926.17 He concluded that the correct structure should be HCNO and not HONC as previously thought.18 Since then numerous high level theoretical studies have been published.19–22Fulminic acid also has significant astrochemical relevance as a precursor to prebiotic molecules. The first astrophysical identification of HCNO was made through observations using the 3 mm band of the IRAM 30 m radio telescope. It was observed towards the dark molecular clouds B1, L1544, and L183, and in the low-mass pre-stellar object L1527.23 Isocyanic acid, HNCO, was also detected and the abundance ratio HNCO/HCNO was determined to be between 40 and 70.23 Currently, HCNO has been identified in numerous sources that illustrate the different chemical stages of a solar-type star, such as L1157-mm, L1157-B1, NGC 1333 IRAS4A, as well as the dense core L483.24–26 In cold clouds and low-mass star formation objects, the most accepted gas-phase formation pathway for HCNO is the neutral–neutral reaction involving methylene (CH2) and nitric oxide (NO).23 However, given the different temperature gradients and regimes present in these objects, other HCNO formation processes should also be considered, including chemical reactions on the surface of grains.27 HCNO and its isomers isocyanic acid (HNCO), cyanic acid (HOCN), and isofulminic acid (HONC) form a tetrad of species collectively known as CHON.28 In planetary atmospheres, these molecules are expected to be formed by UV interaction with molecules such as CH4, CO, and N2. Indeed, CHON isomers are of great prebiotic importance as they participate in reaction chains that lead to complex organic molecules of astrochemical and astrobiological interests.29
Our group already investigated the Auger electron spectroscopy (based on the Auger–Meitner effect30) of the isomer isocyanic acid, HNCO, and compared the spectra with computations to rationalise the observed transitions.31 Furthermore, the photofragmentation of HNCO upon soft X-ray excitation was studied.32,33 By investigating the Auger electron spectroscopy of its isomer fulminic acid, we intend to better understand the effects of atom connectivity on the Auger–Meitner effect in molecules. Note that only a few reactive molecules have been investigated in the soft X-ray regime. For example, Auger spectra have been reported for HS34, while X-ray absorption spectra (XAS) were recorded for allyl, C3H535 and methyl, CH3.36
2 Methods
2.1 Experimental
The experiments were conducted at the soft X-ray beamline PLEIADES37 of Synchrotron SOLEIL. Fulminic acid was prepared according to the procedure by Wentrup et al.38 The precursor 3-phenyl-4-oximino-isoxazol-5(4H)-one was heated to around 100 °C and sublimated under high vacuum, provided by a turbopump. The gaseous precursor entered a 40 cm long quartz glass tube with an inner diameter of 3 cm. This tube was heated to 460 °C by a Carbolite EVA12/300B tube furnace. The resulting products HCNO, CO2 and benzonitrile were collected in a liquid nitrogen cooled trap. Impurities like CO2 and minor isocyanic acid contributions were removed by the forepump vacuum at −50 °C (ethanol/dry ice bath) due to their higher vapour pressure. During the experiments the fulminic acid sample was kept at −40 °C and entered the experimental chamber through an effusive inlet. Benzonitrile contamination was unproblematic as its vapor pressure is insignificant at −40 °C. In the experimental chamber the sample crossed the linearly polarized soft X-ray radiation produced by an Apple II HU80 permanent magnet undulator, which was monochromatized using a 600 lines mm−1 grating. The light was oriented at the magic angle of 54.7° with respect to the electron analyzer to eliminate angular dependence effects of the electron emission. Auger electrons were measured by a VG Sciencta R4000 hemispherical analyzer using an entrance slit size of 0.3 mm at a pass energy of 50 eV, leading to a spectral resolution of 37.5 meV. X-ray absorption spectra (XAS/NEXAFS) were recorded by scanning the photon energy and recording the total ion yield. It was measured with a channeltron biased with −2 kV on the front of its 25 mm diameter cone. The sample is introduced from an effusive needle and intersects the photon beam about 5 mm in front of the channeltron. The 2 kV field of the channeltron is assumed to collect all ions produced regardless of their kinetic energy. Photon energy and electron kinetic energy were calibrated using the literature spectra of CO2, N239 and HNCO.312.2 Theoretical details
Theoretical Auger electron spectra were obtained with the wavels program package.40–45 The approach implemented there has been applied successfully to molecular K-LL,46–48 L2,3-M1,2,3M1,2,3,49–51 and M4,5-N1,2,3N1,2,352 Auger electron spectra and we refer to these articles for further details. Briefly, the molecular structure and vibrational frequencies of the molecule were calculated at the B3LYP53/def2-TZVPP54 level with Turbomole55 providing C–H, C–N, and N–O distances of 106.05 pm, 115.59 pm, and 119.88 pm, respectively, for the linear HCNO molecule. The molecular orbitals (MOs) used to represent the core-hole and final states were Hartree–Fock orbitals as determined with a cc-pVTZ basis set56 and virtual valence-type orbitals obtained with the procedure described in ref. 45. The latter generates orbitals complementing the occupied MOs to the orbital space of the atomic valence orbitals (1s for hydrogen and 1s, 2s, and 2p for C, N, and O). These virtual valence MOs allow to represent static correlation and charge fluctuations within the molecule with the configuration interaction (CI) approach employed in this work. The orbitals are shown in Fig. 1 and the MO-coefficients providing their optimal representation in terms of the atomic valence orbitals are given in Table 1. The table shows also the overlap of the molecular orbitals as evaluated in the quantum chemical calculation with those in the minimal basis representation, 〈ψp|ψMBp〉, as well as the squared sums of the MO coefficients,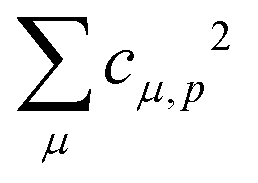 [here and in the following p/q count MOs, while μ and ν represent atomic orbitals (AOs)]. As the atomic orbitals are overlapping, an orbital can be characterized as bonding, non-bonding, and antibonding, respectively, if this number is clearly smaller, about equal, or much larger than one. Accordingly, the 4–6σ and 1π orbitals are bonding, the 7σ and 2π orbitals are non-bonding and the others are antibonding.
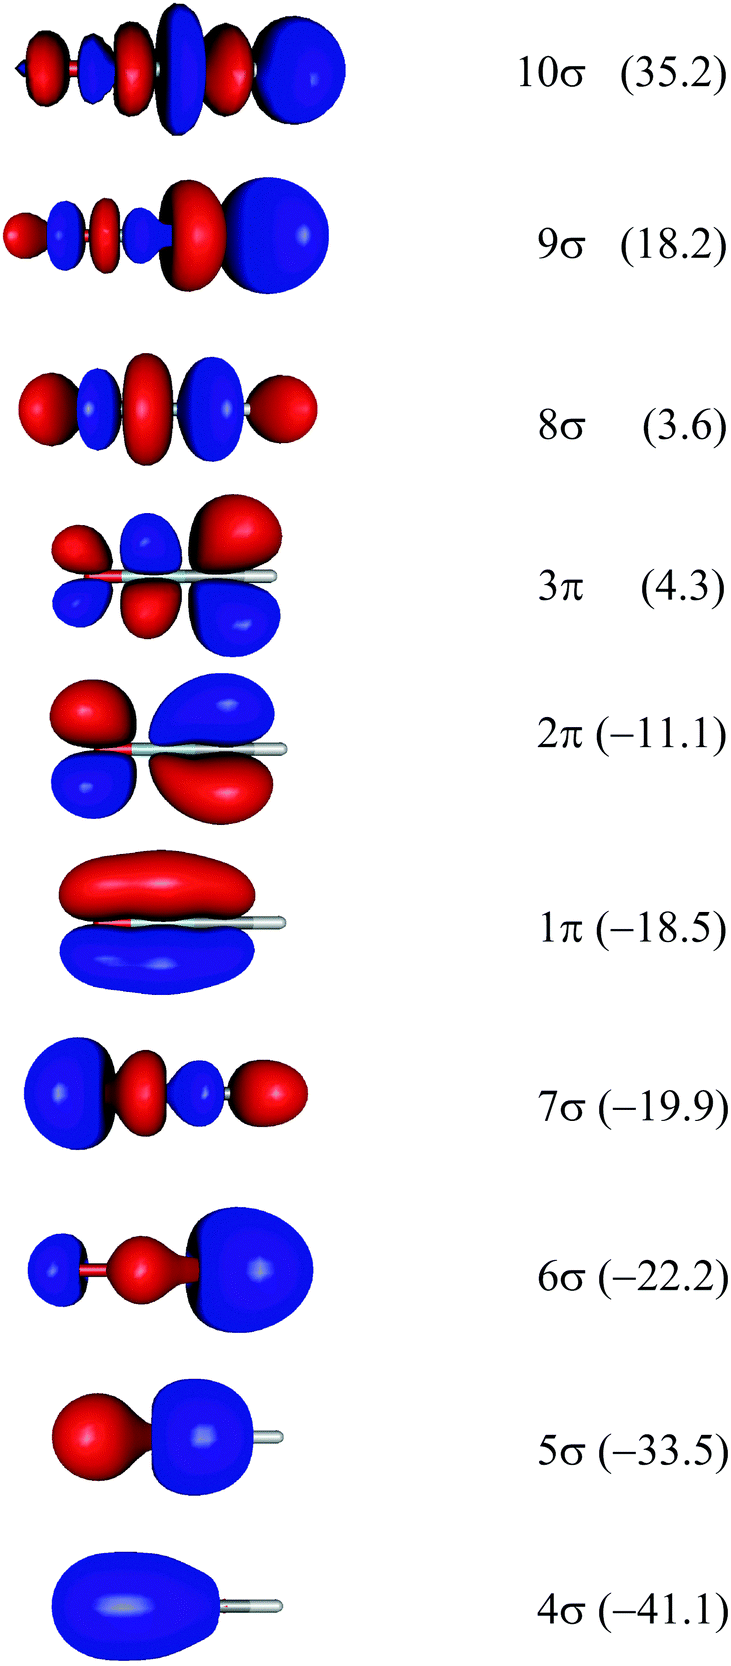 | ||
| Fig. 1 Orbitals of the HCNO molecule which were used for calculating the Auger electron spectra. Note that the H-atom points to the right. See text for details for the determination of the orbitals. Orbital energies in eV are given in brackets. | ||
| MO (p) | 4σ | 5σ | 6σ | 7σ | 1π | 2π | 3π | 8σ | 9σ | 10σ |
|---|---|---|---|---|---|---|---|---|---|---|
| ε (eV) | −41.14 | −33.45 | −22.24 | −19.88 | −18.49 | −11.06 | 4.31 | 3.63 | 18.19 | 35.16 |
| 〈ψp|ψMBp〉 | 0.985 | 0.986 | 0.976 | 0.985 | 0.993 | 0.989 | 0.990 | 0.980 | 0.980 | 0.980 |

|
0.60 | 0.65 | 0.69 | 1.12 | 0.70 | 1.04 | 1.73 | 3.79 | 4.54 | 7.18 |
| AO (μ) | c μ,p | |||||||||
| H 1s | 0.01 | 0.08 | 0.32 | −0.10 | 0.00 | 0.00 | 0.00 | −0.43 | 1.23 | 0.97 |
| C 2s | 0.09 | 0.25 | 0.48 | −0.07 | 0.00 | 0.00 | 0.00 | 0.82 | −1.29 | 0.67 |
| C 2pπ | 0.00 | 0.00 | 0.00 | 0.00 | 0.26 | −0.58 | 0.86 | 0.00 | 0.00 | 0.00 |
| C 2pσ | −0.06 | −0.20 | 0.47 | −0.29 | 0.00 | 0.00 | 0.00 | −0.29 | −0.42 | −1.67 |
| N 2s | 0.46 | 0.40 | −0.18 | −0.24 | 0.00 | 0.00 | 0.00 | −1.30 | −0.18 | −1.06 |
| N 2pπ | 0.00 | 0.00 | 0.00 | 0.00 | 0.62 | −0.27 | −0.88 | 0.00 | 0.00 | 0.00 |
| N 2pσ | −0.12 | 0.49 | −0.00 | 0.45 | 0.00 | 0.00 | 0.00 | 0.29 | 0.79 | −1.24 |
| O 2s | 0.58 | −0.37 | 0.27 | 0.65 | 0.00 | 0.00 | 0.00 | 0.58 | 0.47 | −0.44 |
| O 2pπ | 0.00 | 0.00 | 0.00 | 0.00 | 0.50 | 0.79 | 0.45 | 0.00 | 0.00 | 0.00 |
| O 2pσ | 0.19 | −0.02 | −0.17 | −0.58 | 0.00 | 0.00 | 0.00 | 0.84 | 0.51 | −0.29 |
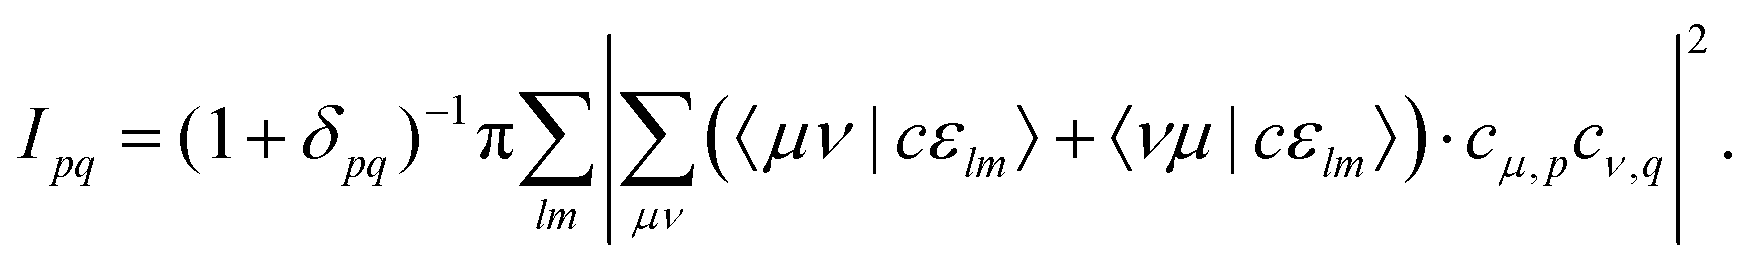
Auger transition rates were evaluated with the one-center approximation44,57–59 which approximates the continuum wavefunctions of the Auger electrons by their atomic counterparts. Furthermore, Auger decay rates are determined by only considering electrons in the minimal basis expansion (here Table 1) of the atomic valence orbitals of the core-hole atom. This means the required Auger transition integrals are only needed for atomic Auger transitions which are readily available.60–63 In the present work the values from the compilation of Chelkowska and Larkins63 were employed. As described there, the Auger transition rate (in atomic units, a.u.) for the transition from the initial state i to the final state f is obtained from the Fermi-Wentzel “golden rule”64 expression
| If = 2π|〈Ψi|Ĥ|Ψf〉|2, | (1) |
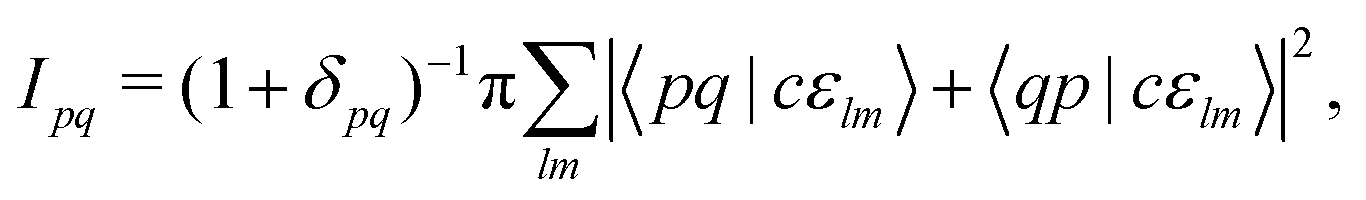
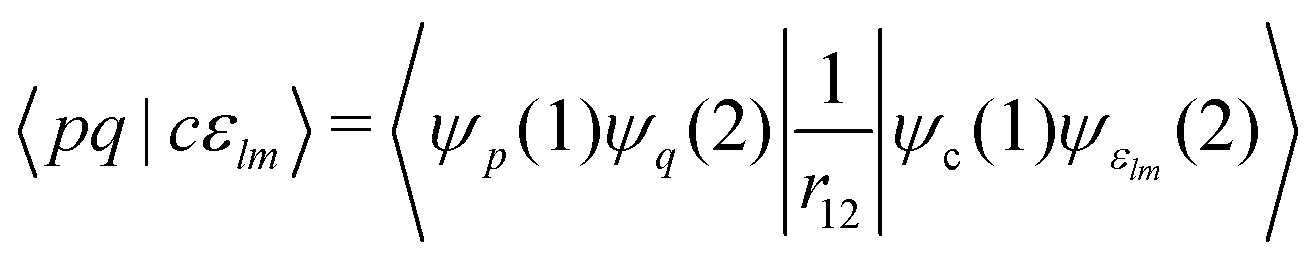
Note that the final states in our calculations are always linear combinations of several configurations. Nevertheless, it is common to designate these states with their leading configuration (i.e. the configuration with the largest weight). For important features in Auger electron spectra such an assignment is generally reasonable as there is only a single leading configuration. This allows to relate intensities to the MO expansion coefficients of the involved valence orbitals at the core hole atom. Thus, we approximate the core hole wavefunctions with the Hartree–Fock Slater determinant, Φ, with a hole in the core-orbital ψc and designate it as Φc.57,65,66 The present K-LL-type normal Auger electron spectra are known to be dominated by decay to singlet final states.65,67 These final state wavefunctions are represented with configurations having two holes in the valence orbitals ψp and ψq as well as an electron in the outgoing continuum channel εlm. l and m are the angular momentum and magnetic quantum numbers of the channel. We designate the final state configuration as  where the holes shall be coupled to a singlet. Further details and the treatment of other final state configurations and of resonant Auger decay has been described in ref. 44, 57, 65 and 66. For the case discussed above, the Auger transition rate becomes
 | (2) |
 | (3) |
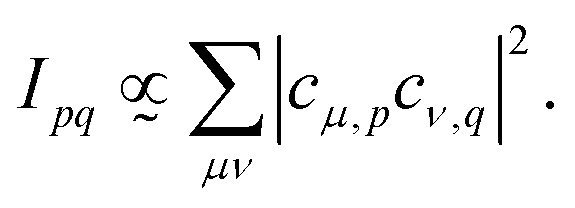
Plugging in the molecular orbitals as linear combination of atomic orbitals (MO-LCAO) representation of the molecular orbitals (MOs) in terms of the minimal basis, 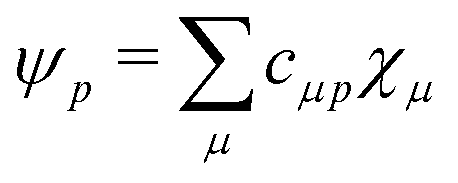 with the MO expansion coefficients, cμ,p, provides
 | (4) |
 | (5) |
Electronic wavefunctions of the states contributing to the Auger processes were determined with the CI approach. For the core-hole (final) states a CI space consisting of all configurations with up to 3 (2) electrons in the virtual orbitals (3π and 8–10σ) and the corresponding number of electrons in the core- and valence orbitals was used. As demonstrated in previous applications,47,48,52 such CI wavefunctions generally provide an appropriate representation of the essential electronic states out of the very large (actually infinite) number of possible final states that can be reached in the Auger decay. Similarly, the energetic order of the states is generally reasonable, but absolute energies may deviate from the experimental ones by several eV. We therefore modified the energy scale of the theoretical spectra, as proposed in ref. 48. A better estimate for the energy differences between the ground state and the lowest final states was obtained with the multi-configuration coupled electron pair approach43 (MCCEPA) and the cc-pwCVQZ70 basis using complete active space self-consistent field (CASSCF) reference wavefunctions with all π-orbitals in the active space. For the resonant Auger electron spectra, the obtained vertical single ionization potential of 10.64 eV was set as the lowest (vertical) final state energy. For normal Auger decay we obtained 30.56 eV for the vertical ionization energy of the lowest doubly ionized state, 1Σ−(2π−2), however, as the decay to this final state is symmetry forbidden, we used the vertical binding energy of the first excited state (1Δ) at 31.54 eV to calibrate the theoretical normal Auger electron spectra. Furthermore, the range of final states was squeezed by a factor of 0.85 which corrects the tendency of the CI approach to overestimate energies of higher excited states.48 Note that this computational energy scale is independent from experiment.
The multi-dimensional moment theory45,71,72 was used to estimate the band shapes related to the final electronic states reached in the Auger electron spectra. In this approximation the signals that are due to the Auger decay into the vibrational levels of a single final electronic state are represented by a Gaussian distribution. The area under the Gaussian is set to the Auger transition rate. In order to approximate the band shape which is due to the first-order vibrational dynamics of the decay process, the width and the center of the Gaussian is adapted as described in ref. 71 and 72. Note that only totally symmetric vibrations are considered at this level of theory, i.e. within these simulations the C∞v-symmetric HCNO molecule retains a linear structure.
3 Results
3.1 Normal Auger spectroscopy
Fig. 2 shows the normal Auger electron spectra (AES) at the (a) carbon, (b) nitrogen and (c) oxygen edge recorded at photon energies of 400, 440 and 560 eV. To allow for a comparison of spectra of different core-holes, the Auger electron yield is shown as a function of the binding energy EB which is defined as the difference between the 1s ionization energy E(1s) and the kinetic energy of the Auger electrons Ekin| EB = E(1s) − Ekin | (6) |
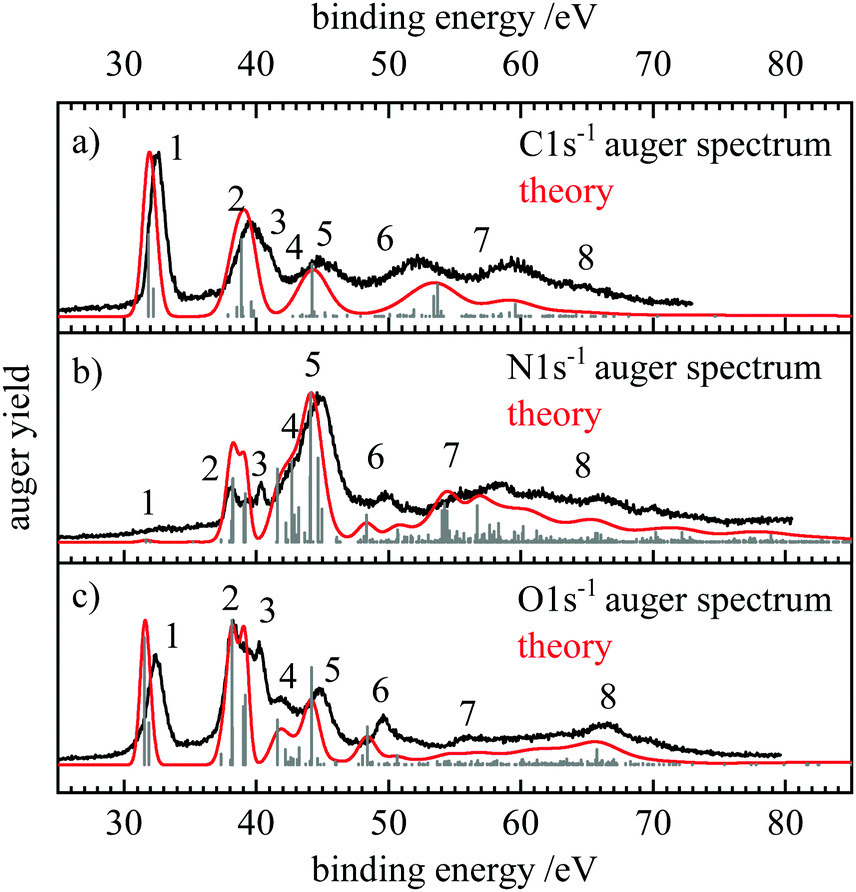 | ||
| Fig. 2 Normal Auger electron spectra at the (a) carbon, (b) nitrogen and (c) oxygen edge, shown in black. The kinetic energy of the Auger electrons was converted to binding energy by subtracting it from the 1s ionization energies determined through XPS measurements (see ESI†). The grey stick spectrum shows the energies and intensities of the individual transitions. The energy positions include shifts due to the moment theory which provides the theoretical spectrum given with the red lines. | ||
The binding energy can be thought of as the energy of the doubly ionized final state with respect to the neutral ground state after the Auger electron is ejected. The 1s ionization energies were determined by recording the X-ray photoelectron spectra (XPS), which are shown in the ESI,† Fig. S1–S3. The 1s ionization energies at the three edges are 292.9 eV for C 1s and 410.5 and 539.6 eV for N 1s and O 1s, respectively. Fig. 2 also shows the stick spectra in gray which were obtained by theory and in red the fully simulated spectra.
Following the formalism that Moddeman et al. applied to the CO2 Auger spectra,39 we can divide the Auger electron spectra into two regions. At low binding energies (<50 eV) only weakly bound outer-valence orbitals are involved (K-WW), while transitions up to 70 eV have vacancies in one weakly bound outer valence orbital and in one strongly bound inner valence orbital (K-SW). Transitions at higher binding energies would be called K-SS, but were not measured in the present work. These transitions are often broad and difficult to characterize due to the mixing of a multitude of electronic configurations. According to the orbital energies in Table 1 the HCNO molecule is a bit unusual. The 2π orbital (Eb = 11 eV) is well separated from the next group 1π, 7σ and 6σ (Eb ≈ 20 eV). The two lowest orbitals have much higher binding energies of about 40 eV. Additionally, only two molecular orbitals have significant contributions of the carbon AOs. These are the nonbonding 2π MO and the 6σ orbital which represents essentially the C–H bond. Thus, the electronic structure of HCNO is a bit special and at least for the case of the C 1s spectra the general arguments of Moddemann et al.39 may only apply to a limited extent here.
The assignment of the experimental features, the calculated partial intensities, the vertical ionization potentials as well as the signal widths and positions according to the moment method are collected in Table 2. The signals in the AES can be assigned as follows. The Auger decay from the 2Σ+ core hole states to the 3Σ− ground state of the dication is symmetry forbidden, as coupling of any single electron Auger channel to the Σ− final state cannot provide the Σ+ symmetry representation of the core-hole states. Thus, the signal with the lowest binding energy is due to the 1Δ and 1Σ+ states with (2π−2) occupation appearing at about 32 eV binding energy. In all spectra the energy difference of these final states amounts to 0.3–0.4 eV, which is within the observed bandwidth. Thus, this feature (as also the other ones in the AES), contains several final states which are not resolved. Note that the assignments presented in the following provide only the dominant character of the electronic states that give rise to the observed signals. The features at lowest binding energy are labelled with 1 in Fig. 2 and give rise to the prominent signals for C and O1s decay spectra. The intensity of these transitions can be explained with the large absolute value of the MO coefficients of the 2pπ-AOs at these atoms. For the nitrogen atom this value (cN2pπ,2π = −0.27) is more than a factor of two smaller than for C (−0.58) and O (0.79). As this decay generates both holes in 2pπ AOs, according to eqn (5) the relative decay rate is proportional to the fourth power of these coefficients which means that the decay ratios to feature 1 starting from the C 1s![[thin space (1/6-em)]](https://www.rsc.org/images/entities/char_2009.gif) :N 1s:O1s core-hole states should be about 20:1:73. This corresponds well to the experimental spectra where feature 1 is dominant in the C 1s and O1s spectra, while it is hardly visible in the N 1s AES.
:N 1s:O1s core-hole states should be about 20:1:73. This corresponds well to the experimental spectra where feature 1 is dominant in the C 1s and O1s spectra, while it is hardly visible in the N 1s AES.
| Term | Occupation | C 1s−1 decay | N 1s−1 decay | O1s−1 decay | ||||||||||
|---|---|---|---|---|---|---|---|---|---|---|---|---|---|---|
| E vert | I | W | E | Lab. | I | W | E | Lab. | I | W | E | Lab. | ||
| 3Σ− | (2π−2) | 30.84 | 0.0 | 1.04 | 31.13 | 0.0 | 0.84 | 30.93 | 0.0 | 0.74 | 30.83 | |||
| 1Δ | (2π−2) | 31.54 | 14.3 | 1.13 | 31.85 | 1 | 0.1 | 0.93 | 31.64 | 1 | 22.3 | 0.82 | 31.54 | 1 |
| 1Σ+ | (2π−2) | 31.89 | 4.8 | 1.17 | 32.22 | 1 | 0.0 | 0.95 | 31.99 | 1 | 7.4 | 0.84 | 31.88 | 1 |
| 3Π | (7σ−12π−1) | 37.43 | 0.3 | 1.33 | 37.85 | 0.1 | 0.74 | 37.34 | 2.0 | 0.74 | 37.34 | 2 | ||
| 3Π | (6σ−12π−1) | 38.19 | 1.6 | 1.87 | 38.54 | 2 | 0.1 | 1.55 | 37.99 | 0.9 | 1.56 | 38.03 | 2 | |
| 1Δ | (1π−12π−1) | 38.21 | 3.2 | 1.89 | 38.93 | 2 | 8.2 | 0.96 | 38.20 | 2 | 25.4 | 0.88 | 38.16 | 2 |
| 1Π | (7σ−12π−1) | 38.36 | 13.5 | 2.03 | 38.86 | 2 | 1.4 | 1.56 | 38.12 | 2 | 6.6 | 1.58 | 38.18 | 2 |
| 1Σ+ | (1π−12π−1) | 39.07 | 1.0 | 1.91 | 39.80 | 2 | 2.5 | 0.94 | 39.05 | 2 | 10.3 | 0.87 | 39.02 | 2 |
| 1Π | (6σ−12π−1) | 39.24 | 2.5 | 1.24 | 39.61 | 3 | 3.1 | 0.75 | 39.17 | 3 | 12.3 | 0.75 | 39.17 | 3 |
| 1Δ | (2π−33π1) | 41.69 | 0.1 | 2.79 | 42.75 | 4.8 | 1.43 | 41.59 | 4 | 7.9 | 1.39 | 41.59 | 4 | |
| 1Σ+ | (2π−33π1) | 42.28 | 0.1 | 2.74 | 43.33 | 1.3 | 1.45 | 42.23 | 4 | 2.7 | 1.40 | 42.20 | 4 | |
| 1Δ | (1π−12π−23π1) | 42.66 | 0.1 | 2.91 | 43.75 | 5.3 | 1.74 | 42.68 | 4 | 1.4 | 1.66 | 42.59 | 4 | |
| 1Σ+ | (1π−12π−23π1) | 42.87 | 0.0 | 2.94 | 43.98 | 1.8 | 1.72 | 42.87 | 4 | 1.1 | 1.64 | 42.80 | ||
| 1Π | (6σ−11π−1) | 43.46 | 9.2 | 2.57 | 44.23 | 5 | 2.3 | 1.89 | 43.20 | 4 | 3.0 | 1.88 | 43.23 | 5 |
| 1Δ | (1π−2) | 44.12 | 0.2 | 2.86 | 45.20 | 9.7 | 1.68 | 44.12 | 5 | 0.7 | 1.59 | 44.05 | ||
| 1Π | (7σ−11π−1) | 44.30 | 0.6 | 2.55 | 45.18 | 4.2 | 1.35 | 44.06 | 5 | 17.1 | 1.36 | 44.18 | 5 | |
| 1Σ+ | (1π−2) | 44.71 | 0.2 | 2.87 | 45.81 | 5.5 | 1.57 | 44.66 | 5 | 1.1 | 1.51 | 44.62 | 5 | |
| 1Δ | (1π−12π−23π1) | 44.91 | 0.1 | 2.98 | 46.01 | 2.1 | 1.92 | 44.97 | 5 | 0.1 | 1.82 | 44.85 | ||
| 1Σ+ | (1π−12π−23π1) | 48.11 | 0.0 | 3.00 | 49.24 | 0.4 | 1.81 | 48.13 | 1.7 | 1.73 | 48.04 | 6 | ||
| 1Σ+ | (7σ−2) | 48.51 | 0.0 | 2.78 | 49.50 | 1.8 | 1.44 | 48.31 | 6 | 6.7 | 1.43 | 48.39 | 6 | |
| 1Π | (5σ−12π−1) | 50.81 | 1.2 | 2.99 | 51.93 | 6 | 0.2 | 1.69 | 50.62 | 1.6 | 1.67 | 50.63 | 6 | |
| 1Σ+ | (6σ−2) | 52.29 | 3.5 | 3.91 | 53.41 | 6 | 0.3 | 3.14 | 51.82 | 0.0 | 3.13 | 51.91 | ||
| 1Σ+ | (6σ−2) | 52.63 | 5.6 | 3.72 | 53.72 | 6 | 0.0 | 2.93 | 52.18 | 0.0 | 2.92 | 52.27 | ||
| 1Π | (7σ−11π−12π−13π1) | 54.43 | 0.0 | 3.38 | 55.69 | 2.5 | 2.05 | 54.21 | 7 | 0.6 | 2.03 | 54.22 | 7 | |
| 1Π | (6σ−17σ−12π−18σ1) | 54.54 | 0.0 | 3.85 | 55.77 | 2.0 | 2.82 | 54.04 | 7 | 0.4 | 2.82 | 54.18 | 7 | |
| 1Π | (6σ−11π−12π−13π1) | 54.67 | 0.1 | 3.57 | 55.98 | 2.0 | 2.23 | 54.41 | 7 | 0.7 | 2.21 | 54.43 | 7 | |
| 1Σ+ | (5σ−17σ−1) | 56.91 | 0.3 | 2.73 | 57.91 | 2.4 | 1.62 | 56.71 | 7 | 0.9 | 1.61 | 56.72 | 7 | |
| 1Σ+ | (6σ−17σ−11π−13π1) | 57.89 | 0.7 | 3.38 | 59.12 | 1.1 | 2.10 | 57.63 | 0.2 | 2.09 | 57.65 | 7 | ||
| 1Π | (2π−43π19σ1) | 58.40 | 0.1 | 4.35 | 60.01 | 1.2 | 2.87 | 58.32 | 0.8 | 2.81 | 58.20 | 7 | ||
| 1Σ+ | (5σ−16σ−1) | 58.48 | 2.1 | 3.34 | 59.58 | 7 | 0.2 | 2.35 | 58.13 | 0.0 | 2.35 | 58.19 | ||
| 1Π | (1π−12π−33π19σ1) | 60.43 | 0.1 | 4.72 | 62.20 | 1.0 | 3.01 | 60.16 | 7 | 1.0 | 2.99 | 60.14 | ||
| 1Σ+ | (4σ−17σ−1) | 66.04 | 0.0 | 4.85 | 67.87 | 0.5 | 2.84 | 65.64 | 8 | 2.7 | 2.83 | 65.74 | 8 | |
| total intensity | 80.6 | 119.2 | 206.3 | |||||||||||
At binding energies between 38 and 40 eV (feature 2) several 1Π states with the occupations (7σ−12π−1) and (6σ−12π−1) as well as 1Δ and 1Σ+ (1π−12π−1) states are reached. While as usual for K-LL Auger spectra57,69 most intensity is due to these singlet final states, in the C and O 1s spectra decay to two 3Π final states has notable intensity in these region. This can be explained with the relatively large 2s and 2p MO coefficients in the 6σ and 7σ orbitals at these atoms. In the minimal-basis one-center approach used here, normal K-LL Auger decay leading to a triplet final state requires that the projection of the double hole state in the molecular orbital representation gives rise to a significant fraction of 2p–2s hole pairs. A decay to a triplet state with two holes in 2p orbitals is symmetry forbidden and as the 2s orbital is non-degenerate, it is not possible to generate a triplet state with two holes in this orbital. However, the triplet states never contribute more than about 10% to the intensity of any feature in the AES of the core holes.
We assign feature 3 to the 1Π(6σ−12π−1) state, noting that the energy of this final state seems to be underestimated by about 1 eV with our theoretical approach. The feature may be also assigned to the 1Σ+(1π−12π−1) state, but the energetic order and the intensities of these states in our calculations as well as the similarity of this 1Σ+ state with the 1Δ state with the same occupation support the former assignment. There is clear agreement between the experimental and theoretical spectra for N and O1s decay. Both show feature 3 as a distinct peak in the spectrum at about 40 eV binding energy. In the C 1s spectrum this feature is weaker and only notable as a shoulder in the experimental spectrum.
At higher binding energies the N and O1s hole states decay mostly into similar final states. The C 1s hole state leads to different final states as large absolute values of the MO coefficients of the carbon atom are only found at the 2π and 6σ orbitals. Accordingly, final states with at least one hole in these orbitals give rise to strong signals. The clearly notable features 5, 6, and 7 in the C 1s−1 decay correspond mostly to 1Π(6σ−11π−1), 1Σ+(6σ−2), and 1Σ+(5σ−16σ−1) final states. In the N and O1s decay these final states do not play a significant role. For example, feature 4 which is absent in the C 1s Auger spectrum but visible as a shoulder on the N 1s decay and as a small but distinct peak in the O1s spectrum is preferentially due to the decay into 1Δ final states at about 41–43 eV binding energy. For O1s decay feature 5 is due to the 1Π(7σ−11π−1) final state while for N 1s decay this additional intensity is mostly decay to (1π−2) states. Feature 6 corresponds to the 1Σ+ (7σ−2) state and feature 7 to several 1Π states as well as the 1Σ+(5σ−16σ−1) state. Finally, the nitrogen and oxygen Auger electron spectra show both a broad signal at 65 eV (feature 8) which can be assigned to the 1Σ+(4σ−17σ−1) state.
A comparison of the intense features in the spectra shows that final state configurations with large absolute values of the MO coefficients at the respective core hole atom correspond to intense features in the Auger spectrum. This is particularly notable for the (2π−2), (1π−12π−1), and (1π−2) configurations giving rise to features 1, 2, and 5. Their intensity decreases in that order for C 1s decay as the carbon AO coefficient of the 2π orbital (−0.58) is larger than that one of the 1π orbital (0.26). The ratio of the 2π/1π MO coefficients at the oxygen is 1.6 which is smaller than the corresponding value for the carbon atom (2.3). This explains the relatively small intensity of feature 5 in the O1s AES where feature 2 is about equally intense as 1. The latter is due to admixture of other states in feature 2 and due to configuration mixing. For the nitrogen atom the absolute value of the 2π/1π ratio is 0.4. Correspondingly, in the N 1s Auger spectra the intensity of features 1, 2, and 5 increases in that order.
3.2 NEXAFS
NEXAFS (near-edge X-ray absorption fine structure) spectra were recorded by scanning the photon energy and monitoring the total ion yield. The spectrum contains electronic transitions from the 1s orbitals to unoccupied orbitals. Fig. 3(a–c) show the NEXAFS at the carbon, nitrogen and oxygen edge, respectively. The carbon NEXAFS [Fig. 3(a)] exhibits one intense band at 286.6 eV. It corresponds to the π* ← 1s transition into the 3π LUMO (lowest unoccupied molecular orbital). Furthermore, a progression is visible with three members at 290.26, 290.46 and 290.62 eV. The average spacing corresponds to 0.18 eV or about 1400 cm−1, which is on the order of a vibrational transition. Additional weak bands appear at 288.8 and 291.6 eV. These weaker transitions correspond most likely to transitions into Rydberg states. At the N-edge [Fig. 3(b)] the intense 3π ← 1s transition is observed at 403.6 eV. A band with a clearly discernible vibrational progression appears around 400.83 eV and is assigned to a small N2 contamination (grey star).73 Several weak bands are also observed at 399.8, 407.1 and 408.6 eV. A similar picture is encountered at the O1s edge, with an intense band observed at 534.0, and two weaker ones at 535.62 and 537.06 eV. Another small feature at 530.8 eV originates from O2 (grey star).74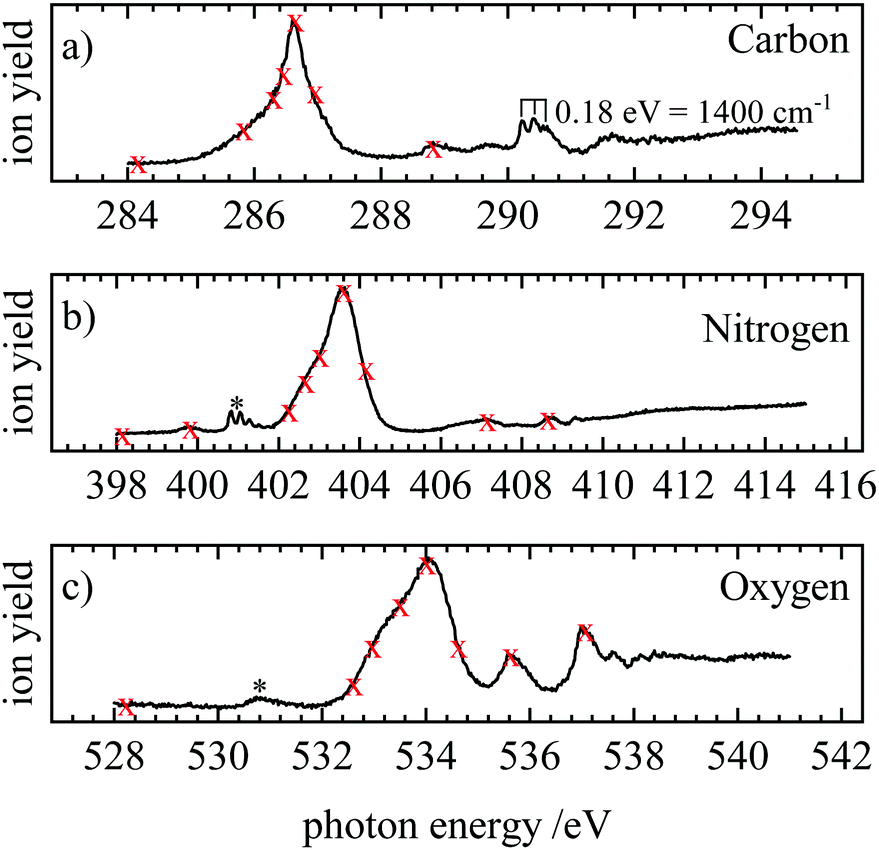 | ||
| Fig. 3 NEXAFS spectra at the (a) carbon, (b) nitrogen and (c) oxygen edge. The red crosses indicate at which photon energies resonant Auger electron spectra were recorded. At 290.26 eV, 290.46 eV and 290.62 eV three crosses were omitted for clarity. The grey asterisks indicate contaminations of N2 and O2, respectively. | ||
The transitions visible in the NEXAFS spectrum were employed to record resonant Auger spectra (RAES). The energies at which resonant Auger spectra were recorded are marked with red crosses in Fig. 3. At the carbon edge, the crosses at 290.26 eV, 290.46 eV and 290.62 eV were omitted to avoid congestion in the figure. Off-resonance spectra were recorded at energies below the first resonance. They correspond to direct photoelectron spectra.
3.3 Resonant Auger
After exciting a 1s electron into an unoccupied orbital, the molecule can electronically relax via a resonant Auger–Meitner process. Like in the non-resonant case, a valence electron fills the hole in the 1s orbital and the excess energy is removed by ejecting another valence electron. Here, two processes can be distinguished. When the initially excited electron participates in the decay, a participator Auger decay results and the final states are similar to those obtained by valence photoelectron spectroscopy. In contrast, when the initially excited electron is not involved, the decay is referred to as a spectator process. The final states of these processes resemble those in the normal Auger spectra, see below.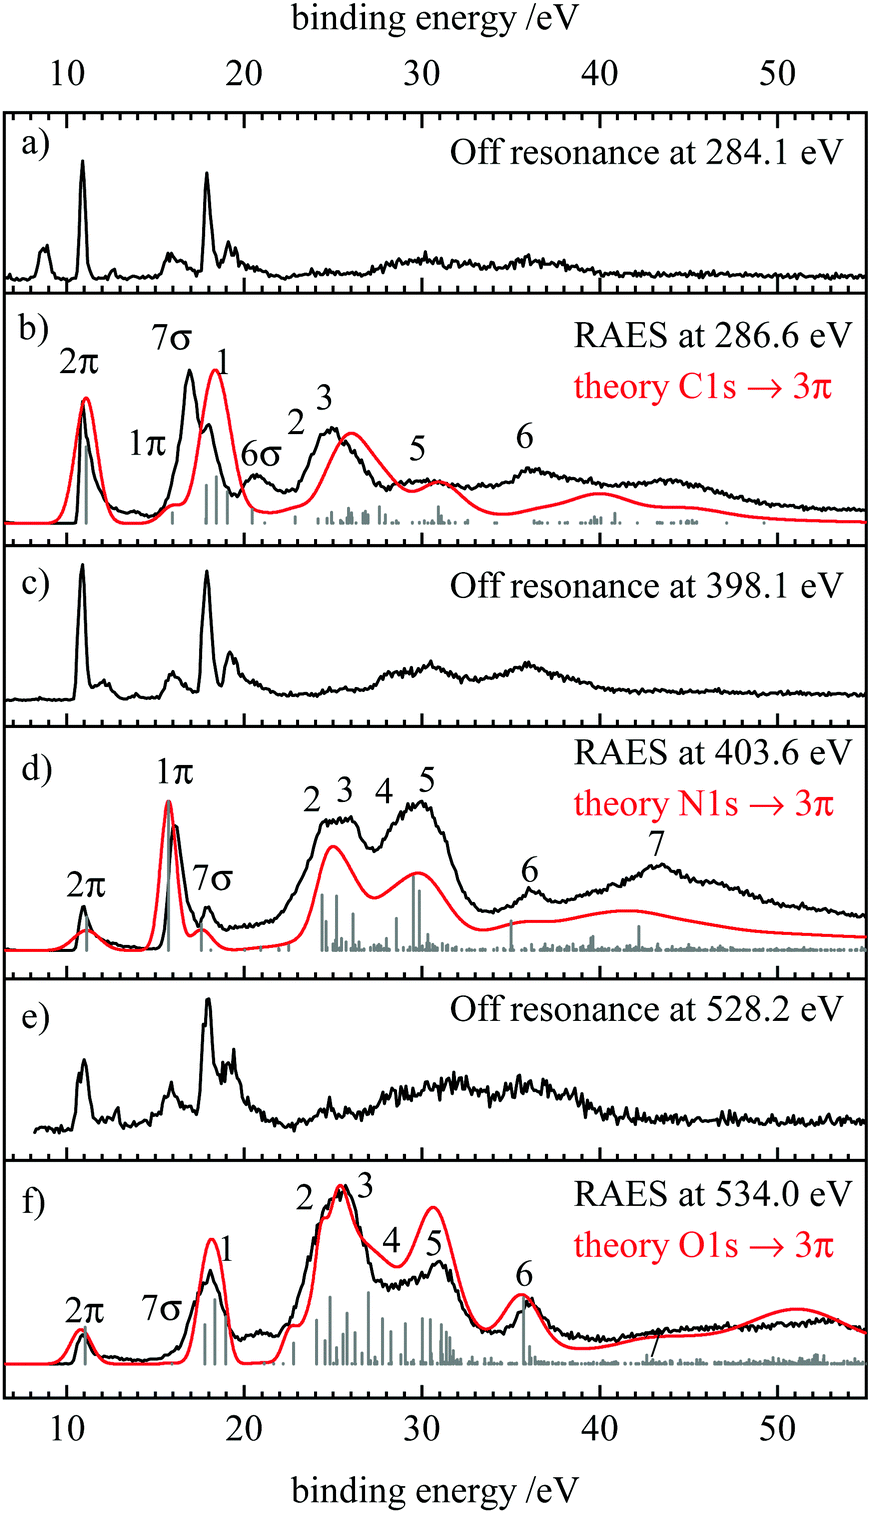 | ||
| Fig. 4 Resonant Auger electron spectra at the (b) carbon (d) nitrogen and (f) oxygen edge, as well as the corresponding off resonant measurements at each edge (a), (c) and (e). The computed spectra are shown in red and the contributions of individual final states are represented as grey sticks. | ||
In the spectrum recorded at the carbon edge (Fig. 4(b)) three intense bands at 10.85, 16.85 and 17.85 eV are observed as well as two broader ones at 20.7 and 24.9 eV. Comparison to the off resonant spectrum Fig. 4(a) shows resonance enhancement in particular for the transitions at 16.9, 20.7 and 24.9 eV. The red line depicts the simulation which is in good agreement with the experimental spectrum.
The RAES recorded on the most intense peak in the N-NEXAFS is shown in Fig. 4(d). In addition, the off-resonant measurement at 398.1 eV is included in trace (c). By resonantly exciting HCNO, the peak at 16.1 eV and the two broad bands at 25 and 29.1 eV are enhanced, similar to what was observed at the C-edge. By scanning the excitation energy along the absorption band, the 7σ band (see below for assignment) decreases in relative intensity, see ESI.† On the Fig. 4 traces (e) and (f) finally show the off-resonance spectrum and the RAES when scanning over the most intense band in the O-NEXAFS. Comparison shows that the peaks at binding energies at 17, 24 and 30 eV are enhanced. RAES recorded at the other positions indicated in Fig. 3 are given in the ESI,† S7–S9.
3.4 Assignment
In order to assign the observed spectral features, we compare the experimental and theoretical RAES in Fig. 4(b, d and f) with the off-resonance photoelectron spectra show in Fig. 4(a, c and e) and the most intense features in the theoretical spectra collected in Table 3. As expected the RAES show spectator transitions at ≈15 eV lower binding energy than corresponding signals in the AES (Fig. 2). Participator transitions are seen as additional features at the energies of the signals in the photoelectron spectra, however, with different intensities. We note that the differentiation between participator and spectator states is not strict as the final states are actually mixtures of participator and spectator configurations.75 However, for qualitative considerations it is generally a good approximation to assume that states are dominated by a single configuration which can then also be used to designate the respective state (see above).| Term | Occupation | C 1s−1 decay | N 1s−1 decay | O1s−1 decay | ||||||||||
|---|---|---|---|---|---|---|---|---|---|---|---|---|---|---|
| E vert | I | W | E | Lab. | I | W | E | Lab. | I | W | E | Lab. | ||
| 2Π | (2π−1) | 10.64 | 15.1 | 1.04 | 11.10 | 2π | 3.3 | 1.43 | 11.13 | 2π | 4.3 | 1.33 | 11.05 | 2π |
| 2Π | (1π−1) | 15.82 | 2.1 | 1.04 | 15.97 | 1π | 14.6 | 0.29 | 15.74 | 1π | 0.1 | 0.55 | 15.92 | 1π |
| 2Σ+ | (7σ−1) | 17.31 | 0.9 | 1.34 | 17.84 | 7σ | 2.6 | 0.92 | 17.60 | 7σ | 0.9 | 1.48 | 17.79 | 7σ |
| 2Π | (2π−23π1) | 17.91 | 7.5 | 1.08 | 17.86 | 1 | 0.0 | 1.28 | 18.11 | 3.7 | 0.85 | 17.79 | 1 | |
| 2 Φ | (2π−23π1) | 18.48 | 9.1 | 1.10 | 18.42 | 1 | 0.0 | 1.30 | 18.68 | 1 | 7.5 | 0.88 | 18.35 | 1 |
| 2Π | (2π−23π1) | 19.12 | 6.3 | 1.09 | 19.04 | 1 | 0.0 | 1.22 | 19.27 | 1 | 5.5 | 0.84 | 18.97 | 1 |
| 2Σ+ | (6σ−1) | 19.23 | 2.8 | 3.01 | 20.46 | 6σ | 0.0 | 2.63 | 20.02 | 6σ | 0.0 | 2.50 | 19.88 | 6σ |
| 2Π | (2π−23π1) | 22.89 | 1.3 | 1.39 | 22.85 | 2 | 0.5 | 1.16 | 22.51 | 2 | 2.4 | 0.90 | 22.79 | 2 |
| 2Π | (1π−12π−13π1) | 24.60 | 0.9 | 1.68 | 24.15 | 2 | 5.4 | 1.62 | 24.38 | 2 | 5.1 | 1.69 | 24.08 | 2 |
| 2Σ+ | (7σ−12π−13π1) | 24.69 | 1.0 | 1.15 | 24.67 | 2 | 2.8 | 0.78 | 24.61 | 2 | 2.7 | 0.58 | 24.56 | 2 |
| 2Φ | (1π−12π−13π1) | 25.37 | 2.2 | 1.76 | 24.90 | 2 | 5.3 | 1.70 | 25.18 | 7.7 | 1.80 | 24.83 | 2 | |
| 2Δ | (7σ−12π−13π1) | 25.58 | 3.0 | 1.74 | 25.87 | 3 | 1.2 | 0.98 | 25.48 | 3.4 | 0.94 | 25.57 | 3 | |
| 2Σ− | (7σ−12π−13π1) | 25.80 | 2.1 | 1.60 | 26.04 | 3 | 0.8 | 0.89 | 25.74 | 1.9 | 0.82 | 25.78 | 3 | |
| 2Σ+ | (6σ−12π−13π1) | 25.91 | 2.0 | 3.10 | 26.67 | 3 | 0.3 | 2.00 | 25.73 | 0.1 | 2.05 | 26.05 | ||
| 2Π | (1π−12π−13π1) | 26.35 | 1.6 | 1.81 | 25.87 | 3 | 3.5 | 1.74 | 26.13 | 3 | 5.9 | 1.86 | 25.79 | 3 |
| 2Δ | (6σ−12π−13π1) | 26.49 | 1.7 | 1.99 | 26.96 | 3 | 0.8 | 1.04 | 26.45 | 1.3 | 1.15 | 26.62 | 3 | |
| 2Σ+ | (1π−12π−18σ 1) | 26.49 | 2.4 | 2.87 | 26.83 | 3 | 0.2 | 2.34 | 26.00 | 0.1 | 2.13 | 26.27 | ||
| 2Π | (2π−33π2) | 26.86 | 0.0 | 1.92 | 26.29 | 0.2 | 2.05 | 26.29 | 3.7 | 2.03 | 26.23 | 3 | ||
| 2Δ |
|
26.99 | 3.3 | 2.40 | 27.60 | 3 | 0.3 | 1.46 | 27.09 | 0.4 | 1.47 | 27.10 | ||
| 2Σ− | (6σ−12π−13π1) | 27.37 | 1.8 | 2.37 | 27.94 | 3 | 0.3 | 1.38 | 27.32 | 0.3 | 1.44 | 27.48 | ||
| 2Φ | (2π−33π2) | 27.63 | 0.0 | 1.92 | 27.05 | 0.1 | 2.03 | 27.09 | 8.3 | 2.04 | 26.99 | 3 | ||
| 2Π | (2π−33π2) | 28.42 | 0.1 | 1.95 | 27.86 | 0.2 | 2.08 | 27.85 | 5.3 | 2.05 | 27.78 | 4 | ||
| 2Π | (1π−12π−13π1) | 28.59 | 0.1 | 2.30 | 28.36 | 0.4 | 2.77 | 27.68 | 3.7 | 2.07 | 28.25 | 4 | ||
| 2Π | (1π−23π1) | 29.61 | 0.0 | 2.38 | 29.08 | 3.1 | 3.14 | 28.55 | 4 | 4.7 | 2.40 | 29.06 | 4 | |
| 2Φ | (1π−23π1) | 30.34 | 0.1 | 2.73 | 30.39 | 7.2 | 2.84 | 29.51 | 4 | 5.3 | 2.28 | 30.02 | 4 | |
| 2Δ | (6σ−11π−13π1) | 30.70 | 3.3 | 2.36 | 30.92 | 5 | 0.5 | 1.89 | 30.26 | 1.4 | 1.68 | 30.51 | 4 | |
| 2Σ− | (6σ−11π−13π1) | 30.75 | 1.5 | 2.76 | 31.10 | 5 | 0.2 | 2.22 | 30.26 | 0.3 | 1.99 | 30.59 | ||
| 2Π | (1π−23π1) | 31.05 | 0.1 | 2.64 | 30.52 | 5.8 | 3.55 | 29.85 | 5 | 5.1 | 2.69 | 30.47 | 4 | |
| 2Σ+ | (6σ−11π−13π1) | 31.18 | 0.5 | 2.45 | 31.51 | 0.4 | 1.95 | 30.71 | 1.2 | 1.70 | 31.14 | |||
| 2Δ | (7σ−11π−13π1) | 31.47 | 0.2 | 2.62 | 31.24 | 0.7 | 3.25 | 30.41 | 4.6 | 2.42 | 31.10 | 5 | ||
| 2Σ+ | (7σ−12π−23π2) | 31.56 | 0.3 | 2.06 | 31.18 | 0.2 | 2.37 | 30.79 | 2.7 | 1.98 | 31.05 | 5 | ||
| 2Σ− | (7σ−11π−13π1) | 31.74 | 0.1 | 2.87 | 31.56 | 0.6 | 3.56 | 30.60 | 3.7 | 2.65 | 31.36 | 5 | ||
| 2Δ | (6σ−11π−13π1) | 31.94 | 0.2 | 2.42 | 31.86 | 0.7 | 2.60 | 31.15 | 3.0 | 2.07 | 31.58 | 5 | ||
| 2Π | (7σ−23π1) | 36.03 | 0.1 | 2.46 | 35.79 | 2.9 | 3.05 | 35.03 | 6 | 7.7 | 2.24 | 35.71 | 6 | |
| 2Δ | (5σ−12π−13π1) | 36.64 | 0.5 | 2.33 | 36.30 | 0.2 | 2.63 | 35.83 | 1.7 | 2.28 | 36.06 | 6 | ||
| 2Π | (6σ−17σ−12π−13π2) | 40.20 | 2.0 | 3.61 | 40.86 | 6 | 0.1 | 2.67 | 39.91 | 0.1 | 2.64 | 40.03 | ||
| 2Π | (5σ−17σ−13π1) | 43.23 | 0.0 | 2.83 | 42.99 | 2.4 | 3.31 | 42.20 | 7 | 1.1 | 2.72 | 42.65 | ||
| Total intensity | 106.3 | 138.4 | 212.3 | |||||||||||
The assignment of the participator states is easily possible with the off-resonant spectra presented in traces (a), (c) and (e) of Fig. 4, and the orbitals shown in Fig. 1 and Table 1. In the following these states will be designated as 2π, 1π, 7σ, and 6σ for the ![[X with combining tilde]](https://www.rsc.org/images/entities/char_0058_0303.gif) 2Π(2π−1), Ã2Π(1π−1),
2Π(2π−1), Ã2Π(1π−1), ![[B with combining tilde]](https://www.rsc.org/images/entities/char_0042_0303.gif) 2Σ+(7σ−1), and
2Σ+(7σ−1), and ![[C with combining tilde]](https://www.rsc.org/images/entities/char_0043_0303.gif) 2Σ+(6σ−1) states, respectively. In the off-resonant spectra sharp signals are observed for the participator states which differ from the ground state configuration by the essentially nonbonding 2π and 7σ orbitals. On the other hand, the 1π and 6σ signals are broadened due to the vibrational excitations associated with the emission of an electron of these bonding orbitals. Note that the Renner–Teller splitting in the degenerate 2Π states76,77 was neglected in the computations.
2Σ+(6σ−1) states, respectively. In the off-resonant spectra sharp signals are observed for the participator states which differ from the ground state configuration by the essentially nonbonding 2π and 7σ orbitals. On the other hand, the 1π and 6σ signals are broadened due to the vibrational excitations associated with the emission of an electron of these bonding orbitals. Note that the Renner–Teller splitting in the degenerate 2Π states76,77 was neglected in the computations.
In the photoelectron spectra, the relative intensity of the σ participator states as compared to the π counterparts increases with photon energy. This is readily explained by the different photoelectron cross sections of the 2s and 2p atomic orbitals on the atoms in the molecule and their contributions to the respective orbitals.78,79 Without going into details, we mention that the minimal basis expansion of the molecular orbitals (Table 1) provide a simple access to the populations of the atomic orbitals. The same coefficients provide also a straightforward explanation of the intensity patterns observed for the participator states. While the participator states are not well resolved from the intense spectator structures in the C 1s-3π resonant Auger electron spectra, we can state that for both spectra, the 2π signal is stronger than the 1π one and an opposite intensity ratio is found for the N 1s-3π decay. According to the considerations given above, these intensities should be proportional to the square of the 2pπ coefficients of the respective molecular orbital at the core hole atom. For the C and N atom this ratio (c2pπ,2π/c2pπ,1π)2 amounts to 5.0 and 0.19, respectively, which is a good estimate for the intensity ratio of the 2π and 1π signals in the carbon and nitrogen resonant Auger electron spectra. For the nitrogen spectra the 7σ feature is well observed, while the 6σ one cannot be detected in the experimental spectra and its intensity is predicted to be negligible (0.006 meV) as compared to the other transitions.
As expected, the resonant Auger electron spectra show spectator features strongly resembling the signals observed in the normal Auger decay for the same core hole. However, details are less pronounced in the resonant spectra than in the nonresonant ones. For example the RAES-features at about 22–28 eV labelled 2 and 3 are hardly resolved in the experimental spectra, while distinct features can be observed in the corresponding AES-spectra at 37 and 40 eV. A similar behaviour is found for features 4 and 5. We note that broadening of spectator features was already recognized by Carol and Thomas in O1s Auger spectra of CO, CO2, and OCS.80
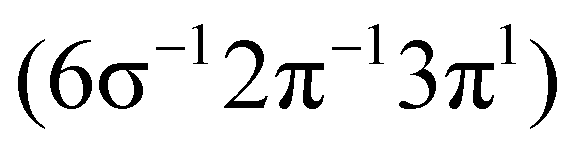
The broader shape of the RAES is due to an additional splitting of several final states by the spectator electron in the 3π orbital. In the following, we discuss and explain this point for feature 1: in the AES it is due to transitions into the 1Δ and 1Σ+ states with (2π−2) occupation and vertical binding energies of 31.54 and 31.89 eV. Additionally, the 3Σ− ground state of the dication has the same occupation. Coupling the spectator electron in the 3π orbital to these states leads to the configurations that represent the final states of the RAES. In particular, the 1Δ(2π−2) AES-state gives rise to a 2Φ and a 2Π configuration in the RAES, the 3Σ− state splits into a 4Π and a 2Π, while coupling an electron in the 3π orbital to the 1Σ+ AES-state generates only a single 2Π configuration. Thus, the (2π−23π) occupation gives rise to one 4Π, one 2Φ and three 2Π configurations. While the Auger transition to the quartet state out of the singlet core-excited state is spin forbidden, the 2Π states couple via the Hamiltonian and give rise to three final states in the RAES with calculated vertical binding energies of 17.91, 19.12, and 22.89 eV. The 2Φ state is obtained at 18.48 eV. In the AES the (2π−2) states give rise to two final states at a vertical binding energy of 31.54 and 31.89 eV. Thus, coupling of the “spectating” electron to the AES final states divides intensity found in a very narrow energy range in the AES to features spread over a much larger range in the corresponding RAES spectra.
Otherwise the spectator parts of the RAES are rather similar to the AES, albeit with a ≈15 eV shift to lower binding energies due to the additional electron in the 3π orbital. For that reason we do not discuss a detailed assignment of these features but refer to the corresponding consideration in the AES part of this publication.
4 Discussion
One of the most interesting features in the present work is the very good agreement between theory and experiment for both, normal and resonant Auger spectra. Band positions and intensities are well represented by the computations. The bands at low binding energies can be unambiguously assigned to specific final states and their intensities are rationalized by the orbital coefficients of the relevant orbitals at the ionization site. All AES are dominated by bands with at least one hole in a weakly bound valence orbital.Fig. 5 depicts a comparison between the normal and resonant Auger spectra of HCNO. When the RAES are shifted by 15 eV, AES and RAES have a similar appearance in the spectator region. This resemblance has been observed before, for example in CO.81 While spectator Auger decay produces 2h1p (two hole, one particle) final states, normal Auger decay leads to 2h states. In a simplified picture, the spectator electron has only a small impact on the electronic structure, which leads to a similar appearance of AES and RAES. However, the presence of a spectator electron leads to a screening effect on the emitted Auger electron and thus to a shift of the RAES bands to higher kinetic energies compared with normal Auger decay, which is 15 eV in the case HCNO. As discussed above, the spectator electron couples to the valence holes leading to additional splitting in the RAES and subsequent bluring of some of the finer features seen in the AES (see e.g. the signals at 37–41 eV binding energy in the N 1s and O1s spectra).
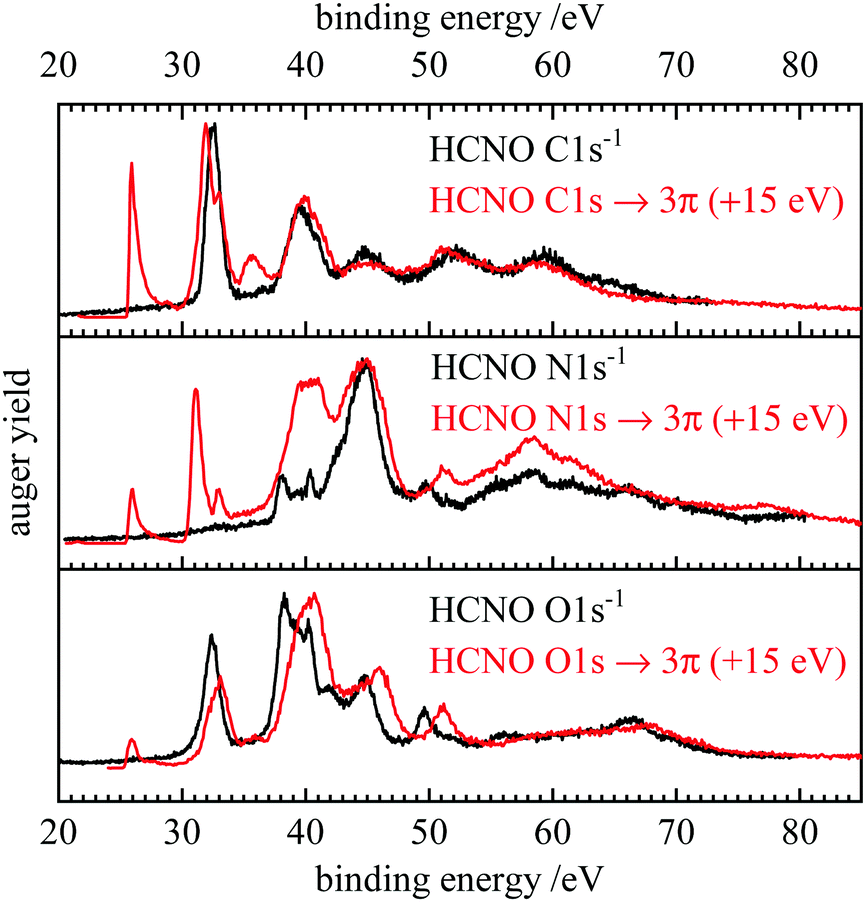 | ||
| Fig. 5 Comparison of the normal (black) and resonant (red) Auger spectra of fulminic acid. The resonant spectra were each shifted by 15 eV to higher binding energy. | ||
It is illustrative to compare the spectra of HCNO with the previously recorded ones of HNCO.31 This can give information on the influence of nuclear charge versus nuclear site/bonding situation in the two related molecules. Differences in binding energies measured by XPS have often been rationalized (at least qualitatively) using the “equivalent core” or “Z + 1” model.82,83 Here, the shift in the binding energy for an atom in different molecules is estimated by a thermochemical cycle. This cycle is based on the assumption that for a valence electron a core hole in an atom with nuclear charge Z is equivalent to an atom with a nuclear charge Z + 1. This allows to estimate ΔEB, the difference in the C 1s binding energies in HNCO and HCNO from tabulated thermochemical data. HCNO and HNCO with a C 1s core hole would both resemble HNNO+ from the point of view of a valence electron. In the “equivalent core” model, ΔEB is then equivalent to the heat of reaction ΔrH for the hypothetical process given by
| HNNO+ + HNCO → HCNO + HNNO+, | (7) |
Fig. 6 and 7 show a comparison of the normal and resonant Auger spectra of fulminic acid and isocyanic acid. HNCO spectra were taken from ref. 31. Both molecules have the same number of electrons, so a comparison should give insight into the influence of atom connectivity on the Auger spectra. Note that the N 1s spectra of HNCO are compared to the C 1s spectra of HCNO and vice versa. Thus, we compare sites in the two molecules rather than atoms. This is based on the assumption that the site should influence the appearance of the Auger spectra, i.e. the band structure, more strongly than the nuclear charge. In fact, Fig. 6(a) shows that the AES of the atoms next to the hydrogen atom (C 1s in HCNO and N 1s in HNCO) are quite similar, apart from a slightly different binding energy. However, symmetry is different in both molecules, while HCNO is linear, HNCO is bent. In HCNO the H–X–Y-angle is 180°, whereas in HNCO this angle is around 128°.85 Therefore the degeneracy of the π orbitals is lifted in HNCO. As a consequence, several final states of similar energy overlap in HNCO, resulting in broader bands and additional features. However, both spectra are dominated by the band at lowest binding energies (band 1 in Fig. 2), assigned to the (2π−2) hole state in HCNO. In HNCO it corresponds to two final states, (2a′′−2) and (2a′′−1)(9a′−1).31 In trace (b) the N 1s edge of HCNO is compared with the C 1s edge of HNCO. While band 1 is absent in the N 1s AES of HCNO, it is observable in the C 1s AES of HNCO, but only with low intensity. This low intensity was also explained by the small orbital coefficients at the carbon atom, leading to a nodal plane in the molecular orbital. Interestingly, a similarly low intensity of the first band was also observed in the AES of the central N atom in N2O.86 Finally for the O-atoms, the AES also show a similar shape, but different intensities. In both molecules, band 1 appears with reasonable intensity, but is weaker than band 2.
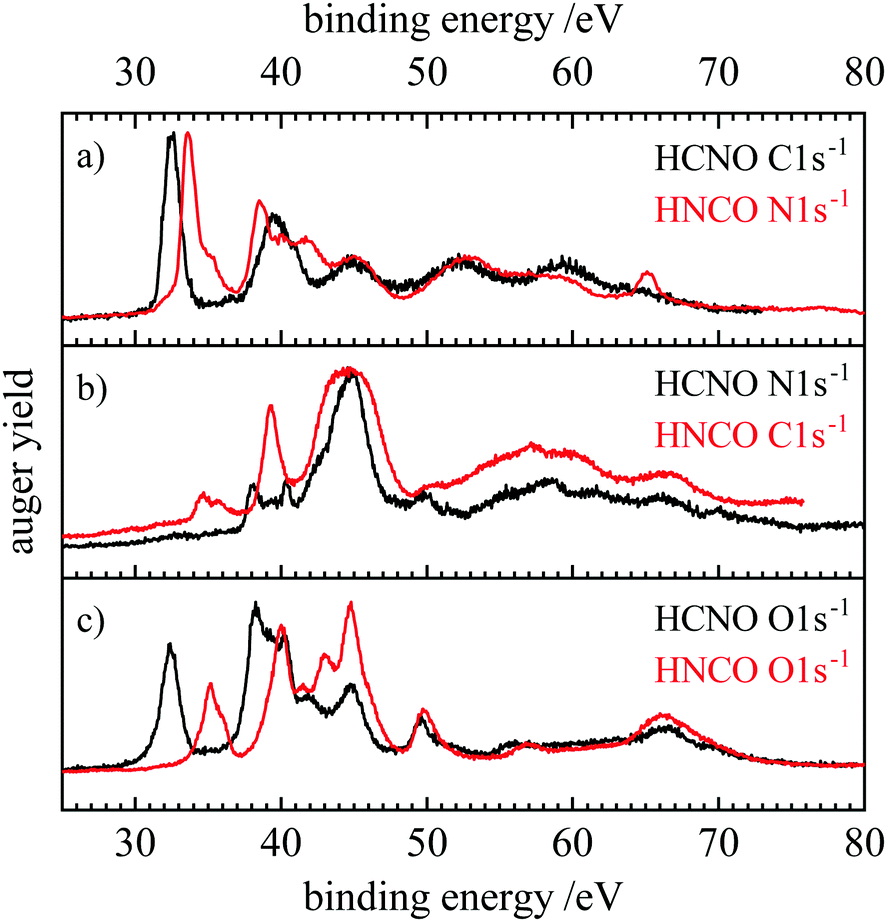 | ||
| Fig. 6 Comparison of the normal Auger spectra of fulminic acid (black) and isocyanic acid (red). The spectra of isocyanic acid are taken from ref. 31. Spectra are compared according to their position in the molecule, i.e. carbon to nitrogen and oxygen to oxygen. | ||
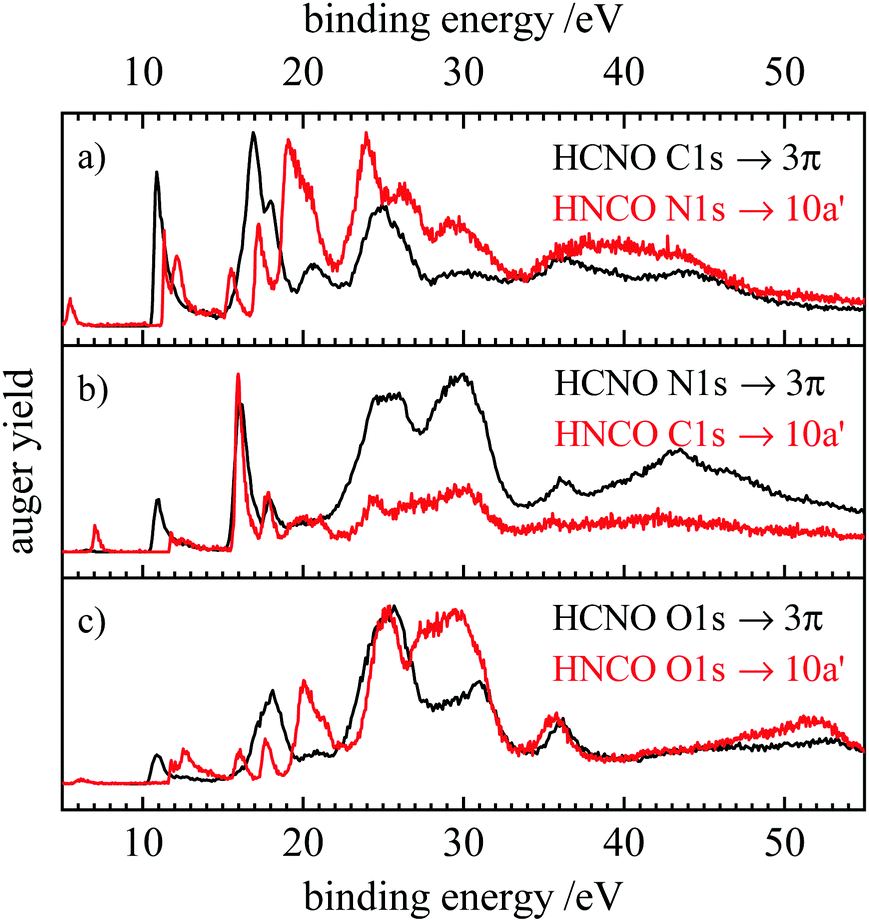 | ||
| Fig. 7 Comparison of the resonant Auger spectra of fulminic acid (black) and isocyanic acid (red). The spectra of isocyanic acid are taken from ref. 31. Spectra are compared according to their position in the molecule, i.e. carbon to nitrogen and oxygen to oxygen. | ||
In Fig. 7 the RAES obtained upon the 1s → LUMO transition of the two molecules are compared. The latter corresponds to a transition into the 3π orbital of fulminic acid and the 10a′ orbital of isocyanic acid. Again, the RAES spectra at the three sites are compared. Note that the peaks at very low binding energy (<6 eV) in the HNCO spectra originate from core ionization by second-harmonic light. It is evident that the RAES of HCNO and HNCO differ more strongly than the AES, in particular below 20 eV binding energy. Here, the lifting of degeneracy in HNCO leads to a larger number of final states and additional transitions in HNCO. At higher binding energies, the spectra become more similar, in particular at the O 1s edge. However, the participators states become particularly intense upon N 1s excitation in both molecules, thus, it seems that nuclear charge is more important in RAES than in AES.
5 Conclusions
We conducted an extensive spectroscopic study of the inner-shell levels of fulminic acid, HCNO in the soft X-ray regime, employing synchrotron radiation provided by the PLEIADES beamline at Synchrotron SOLEIL. HCNO is a reactive molecule that was synthesized by preparative pyrolysis. For 1s ionisation, IEs of 292.9 eV (C 1s), 410.5 eV (N 1s) and 539.6 eV (O 1s) were determined by XPS. X-ray absorption spectra at all three edges are dominated by an intense band assigned to the π* ← 1s transition into the 3π LUMO. In addition, several smaller bands are visible, assigned to transitions into Rydberg states. Normal and resonant Auger spectra are reported, with assignments based on computations.The one-center approximation provides a simple and reliable representation of the Auger spectra of HCNO. We have shown that the underlying data – the expansion of the molecular orbitals in terms of a minimal basis – provides a simple interpretation for the observed intensity patterns in the spectra. The normal Auger spectra (AES) at the C 1s and O 1s show a well separated intense band at 32.5 eV binding energy, which is assigned to the 1Δ state with a double hole in the (2π−2) HOMO and corresponds to the double ionization energy of HCNO to its first excited state. Computations indicate additional smaller contributions from the 1Σ+ state. This band is almost absent in the N 1s AES, which can be explained by the small orbital coefficients at the nitrogen atom. The resonant Auger spectra (RAES) obtained upon excitation of the π* ← 1s transition show well-resolved bands originating from participator states at low binding energies. Above 20 eV, the RAES are dominated by spectator states. In the N 1s and O 1s RAES their intensity is higher than the one of the participator states. Only minor changes were observed in the RAES, when the excitation energy was scanned over the π* ← 1s transition. A comparison between the normal Auger spectra of HCNO and the previously investigated HNCO shows that the spectra recorded at the central heavy atom (N 1s in HCNO and C 1s in HNCO) and at the atom connected to hydrogen show a similar appearance. This indicates that the molecular site is more important than the nuclear charge.
This work indicates that intensities for the Auger decay follow common rules that can be used to obtain insight into the related electronic structure properties. While similar approaches have been proposed previously,65,67,69,87 it seems that a consistent formulation of such approximations is not yet available. For that reason, we plan to elaborate the models proposed here in subsequent work and to identify the area in which they are valid.
Author contributions
Marius Gerlach: investigation (experiment), resources, writing; Tobias Preitschopf, Emil Karaev; John Bozek: investigation (experiment), resources; Heidy Quitian-Lara, Dennis Meyer: investigation (experiment); Ingo Fischer: investigation (experiment), conceptualisation, project administration, supervision, writing; Reinhold Fink: investigation (theory), formal analysis, software, writing.Conflicts of interest
There are no conflicts to declare.Note added after first publication
This article replaces the version published on 15 June 2022, which contained an erroneous value in Table 3, for the 2Δ state at Evert = 26.99.Acknowledgements
The experiments were performed at the PLEIADES beamline at Synchrotron SOLEIL, France. We thank E. Robert for technical assistance and the SOLEIL staff for operation of the equipment and storage ring during the experiments.The work was funded by the Deutsche Forschungsgemeinschaft, contract FI575/13-2. We thank Anke Krüger and her group for useful discussions and the loan of equipment for the synthesis of fulminic acid and Markus Gühr for his support of the experiment.References
- F. Kurzer, J. Chem. Educ., 2000, 77, 851 CrossRef CAS.
- C. Wentrup, Angew. Chem., Int. Ed., 2019, 58, 14800–14808 CrossRef CAS PubMed.
- E. Howard, Philos. Trans. R. Soc. London, 1800, 90, 204–238 CrossRef.
- H. Ley and H. Kissel, Ber. Dtsch. Chem. Ges., 1899, 32, 1357–1368 CrossRef.
- R. Huisgen, Proc. Chem. Soc., 1961, 357–396 Search PubMed.
- W. Beck and K. Feldl, Angew. Chem., Int. Ed. Engl., 1966, 78, 746 CrossRef CAS.
- B. P. Winnewisser and M. Winnewisser, J. Mol. Spectrosc., 1969, 29, 505–507 CrossRef CAS.
- W. Beck, P. Swoboda, K. Feldl and R. S. Tobias, Chem. Ber., 1971, 104, 533–543 CrossRef CAS.
- B. P. Winnewisser and P. Jensen, J. Mol. Spectrosc., 1983, 101, 408–421 CrossRef CAS.
- B. P. Winnewisser, M. Winnewisser, G. Wagner and J. Preusser, J. Mol. Spectrosc., 1990, 142, 29–56 CrossRef CAS.
- M. Winnewisser and H. K. Bodenseh, Z. Naturforsch. A, 1967, 22, 1724 CAS.
- J. Bastide and J. P. Maier, Chem. Phys., 1976, 12, 177–190 CrossRef CAS.
- T. Pasinszki, N. Kishimoto and K. Ohno, J. Phys. Chem. A, 1999, 103, 6746–6756 CrossRef CAS.
- W. Feng, J. P. Meyer and J. F. Hershberger, J. Phys. Chem. A, 2006, 110, 4458–4464 CrossRef CAS PubMed.
- W. Feng and J. F. Hershberger, J. Phys. Chem. A, 2014, 118, 829–837 CrossRef CAS PubMed.
- W. Feng and J. F. Hershberger, Chem. Phys., 2016, 472, 18–23 CrossRef CAS.
- L. Pauling and S. B. Hendricks, J. Am. Chem. Soc., 1926, 48, 641–651 CrossRef CAS.
- J. U. Nef, Justus Liebigs Ann. Chem., 1894, 280, 291–342 CrossRef.
- J. Koput, B. P. Winnewisser and M. Winnewisser, Chem. Phys. Lett., 1996, 255, 357–362 CrossRef CAS.
- A. Luna, A. M. Mebel and K. Morokuma, J. Chem. Phys., 1996, 105, 3187–3205 CrossRef CAS.
- M. S. Schuurman, S. R. Muir, W. D. Allen and H. F. Schaefer III, J. Chem. Phys., 2004, 120, 11586–11599 CrossRef CAS PubMed.
- M. Mladenović and M. Lewerenz, Chem. Phys., 2008, 343, 129–140 CrossRef.
- N. Marcelino, J. Cernicharo, B. Tercero and E. Roueff, Astrophys. J., 2009, 690, L27–L30 CrossRef CAS.
- E. Mendoza, B. Lefloch, A. Lopez-Sepulcre, C. Ceccarelli, C. Codella, H. M. Boechat-Roberty and R. Bachiller, Mon. Not. R. Astron. Soc., 2014, 445, 151–161 CrossRef CAS.
- B. Lefloch, R. Bachiller, C. Ceccarelli, J. Cernicharo, C. Codella, A. Fuente, C. Kahane, A. López-Sepulcre, M. Tafalla, C. Vastel, E. Caux, M. González-García, E. Bianchi, A. Gómez-Ruiz, J. Holdship, E. Mendoza, J. Ospina-Zamudio, L. Podio, D. Quénard, E. Roueff, N. Sakai, S. Viti, S. Yamamoto, K. Yoshida, C. Favre, T. Monfredini, H. M. Quitián-Lara, N. Marcelino, H. M. Boechat-Roberty and S. Cabrit, Mon. Not. R. Astron. Soc., 2018, 477, 4792–4809 CrossRef CAS PubMed.
- N. Marcelino, M. Agúndez, J. Cernicharo, E. Roueff and M. Tafalla, Astron. Astrophys., 2018, 612, L10 CrossRef PubMed.
- D. H. Quan, E. Herbst, Y. Osamura and E. Roueff, Astrophys. J., 2010, 725, 2101–2109 CrossRef CAS.
- M. Lattelais, F. Pauzat, Y. Ellinger and C. Ceccarelli, Astrophys. J., 2009, 696, L133–L136 CrossRef CAS.
- J. A. Sebree, M. C. Roach, E. R. Shipley, C. He and S. M. Hörst, Astrophys. J., 2018, 865, 133 CrossRef.
- D. Matsakis, A. Coster, B. Laster and R. Sime, Phys. Today, 2019, 72, 10–11 CrossRef CAS.
- F. Holzmeier, T. J. A. Wolf, C. Gienger, I. Wagner, J. Bozek, S. Nandi, C. Nicolas, I. Fischer, M. Gühr and R. F. Fink, J. Chem. Phys., 2018, 149, 034308 CrossRef CAS PubMed.
- M. Gerlach, F. Fantuzzi, L. Wohlfart, K. Kopp, B. Engels, J. Bozek, C. Nicolas, D. Mayer, M. Gühr, F. Holzmeier and I. Fischer, J. Chem. Phys., 2021, 154, 114302 CrossRef CAS PubMed.
- J. H. D. Eland, R. J. Squibb, A. J. Sterling, M. Wallner, A. H. Roos, J. Andersson, V. Axelsson, E. Johansson, A. Teichter, S. Stranges, B. Brunetti, J. M. Dyke, F. Duarte and R. Feifel, Sci. Rep., 2020, 10, 2288 CrossRef CAS PubMed.
- A. deBrito, S. Svensson, S. Osborne, A. Ausmees, A. Kivimaki, O. Sairanen, E. Nommiste, H. Aksela and L. Saethre, J. Chem. Phys., 1997, 106, 18–23 CrossRef.
- M. Alagia, E. Bodo, P. Decleva, S. Falcinelli, A. Ponzi, R. Richter and S. Stranges, Phys. Chem. Chem. Phys., 2013, 15, 1310–1318 RSC.
- U. Ekström, V. Carravetta, M. Alagia, M. Lavollée, R. Richter, C. Bolcato and S. Stranges, J. Chem. Phys., 2008, 128, 044302 CrossRef PubMed.
- https://www.synchrotron-soleil.fr/fr/lignes-de-lumiere/pleiades, 2019.
- C. Wentrup, B. Gerecht and H. Briehl, Angew. Chem., Int. Ed. Engl., 1979, 18, 467–468 CrossRef.
- W. E. Moddeman, T. A. Carlson, M. O. Krause, B. P. Pullen, W. E. Bull and G. K. Schweitzer, J. Chem. Phys., 1971, 55, 2317–2336 CrossRef CAS.
- V. Staemmler and R. Jaquet, Theor. Chim. Acta, 1981, 59, 487–500 CrossRef CAS.
- J. Wasilewski, Int. J. Quantum Chem., 1989, 36, 503–524 CrossRef CAS.
- U. Meier and V. Staemmler, Theor. Chim. Acta, 1989, 76, 95–111 CrossRef CAS.
- R. Fink and V. Staemmler, Theor. Chim. Acta, 1993, 87, 129–145 CrossRef CAS.
- R. Fink, J. Electron Spectrosc. Relat. Phenom., 1995, 76, 295–300 CrossRef CAS.
- R. F. Fink, S. L. Sorensen, A. Naves de Brito, A. Ausmees and S. Svensson, J. Chem. Phys., 2000, 112, 6666–6677 CrossRef CAS.
- R. Fink, J. Chem. Phys., 1997, 106, 4038–4052 CrossRef CAS.
- A. Rüdel, U. Hergenhahn, K. Maier, E. E. Rennie, O. Kugeler, J. Viefhaus, P. Lin, R. R. Lucchese and A. M. Bradshaw, New J. Phys., 2005, 7, 189 CrossRef.
- F. Holzmeier, T. J. A. Wolf, C. Gienger, I. Wagner, J. Bozek, S. Nandi, C. Nicolas, I. Fischer, M. Gühr and R. F. Fink, J. Chem. Phys., 2018, 149, 034308 CrossRef CAS PubMed.
- R. F. Fink, M. Kivilompolo, H. Aksela and S. Aksela, Phys. Rev. A, 1998, 58, 1988 CrossRef CAS.
- A. Machado Bueno, A. Naves de Brito, R. F. Fink, M. Bassler, O. Bjorneholm, F. Burmeister, R. Feifel, C. Miron, S. L. Sorensen, H. Wang and S. Svensson, Phys. Rev. A, 2003, 67, 022714 CrossRef.
- J. H. D. Eland, R. F. Fink, P. Linusson, L. Hedin, S. Plogmaker and R. Feifel, Phys. Chem. Chem. Phys., 2011, 13, 18428–18435 RSC.
- J. Palaudoux, T. Kaneyasu, L. Andric, S. Carniato, G. Gamblin, F. Penent, Y. Hikosaka, E. Shigemasa, K. Ito, S. Fritzsche, E. Kukk, S. Sheinerman, R. F. Fink, P. Lablanquie and R. Püttner, Phys. Rev. A, 2018, 98, 043406 CrossRef CAS.
- A. D. Becke, J. Chem. Phys., 1993, 98, 5648–5652 CrossRef CAS.
- F. Weigend and R. Ahlrichs, Phys. Chem. Chem. Phys., 2005, 7, 3297–3305 RSC.
- F. Furche, R. Ahlrichs, C. Hättig, W. Klopper, M. Sierka and F. Weigend, Wiley Interdiscip. Rev.: Comput. Mol. Sci., 2014, 4, 91–100 CAS.
- T. H. Dunning, Jr., J. Chem. Phys., 1989, 90, 1007–1023 CrossRef.
- H. Siegbahn, L. Asplund and P. Kelfve, Chem. Phys. Lett., 1975, 35, 330–335 CrossRef CAS.
- H. Ågren, S. Svensson and U. Wahlgren, Chem. Phys. Lett., 1975, 35, 336–344 CrossRef.
- C.-M. Liegener, Chem. Phys. Lett., 1982, 90, 188–192 CrossRef CAS.
- E. J. McGuire, Phys. Rev., 1969, 185, 1 CrossRef CAS.
- D. Walters and C. Bhalla, At. Data Nucl. Data Tables, 1971, 3, 301–315 CrossRef.
- M. H. Chen, F. P. Larkins and B. Crasemann, At. Data Nucl. Data Tables, 1990, 45, 1–205 CrossRef CAS.
- E. Z. Chelkowska and F. P. Larkins, At. Data Nucl. Data Tables, 1991, 49, 121–206 CrossRef CAS.
- G. Wentzel, Z. Phys., 1927, 43, 524 CrossRef CAS.
- H. Ågren, J. Chem. Phys., 1981, 75, 1267–1283 CrossRef.
- H.-J. Freund and C.-M. Liegener, Chem. Phys. Lett., 1987, 134, 70–75 CrossRef CAS.
- T. X. Carroll and T. D. Thomas, J. Chem. Phys., 1992, 97, 894–899 CrossRef CAS.
- R. W. Shaw, Jr. and T. D. Thomas, Phys. Rev. A, 1975, 11, 1491–1497 CrossRef.
- F. Tarantelli, A. Sgamellotti and L. S. Cederbaum, J. Chem. Phys., 1991, 94, 523–532 CrossRef CAS.
- K. A. Peterson and T. H. Dunning, J. Chem. Phys., 2002, 117, 10548–10560 CrossRef CAS.
- L. S. Cederbaum, P. Campos, F. Tarantelli and A. Sgamellotti, J. Chem. Phys., 1991, 95, 6634–6644 CrossRef CAS.
- L. S. Cederbaum and F. Tarantelli, J. Chem. Phys., 1993, 99, 5871 CrossRef CAS.
- C. T. Chen, Y. Ma and F. Sette, Physical Review A, 1989, 40, 6737–6740 CrossRef CAS PubMed.
- J. Stöhr, NEXAFS Spectroscopy, Springer-Verlag Berlin Heidelberg, 1992, 4, p. 105 Search PubMed.
- M. N. Piancastelli, R. F. Fink, R. Feifel, M. Bässler, S. L. Sorensen, C. Miron, H. Wang, I. Hjelte, O. Björneholm, A. Ausmees, S. Svensson, P. Salek, F. K. Gelmukhanov and H. Ågren, J. Phys. B, 2000, 33, 1819–1826 CrossRef CAS.
- E. Kukk, J. D. Bozek and N. Berrah, Phys. Rev. A, 2000, 62, 032708 CrossRef.
- E. Antonsson, M. Patanen, C. Nicolas, S. Benkoula, J. J. Neville, V. L. Sukhorukov, J. D. Bozek, P. V. Demekhin and C. Miron, Phys. Rev. A, 2015, 92, 042506 CrossRef.
- U. Gelius, Phys. Scr., 1974, 9, 133–147 CrossRef CAS.
- D. P. Chong, Can. J. Chem., 1985, 63, 2007–2011 CrossRef CAS.
- T. X. Carroll and T. D. Thomas, J. Chem. Phys., 1989, 90, 3479–3483 CrossRef CAS.
- L. Ungier and T. D. Thomas, J. Chem. Phys., 1985, 82, 3146–3151 CrossRef CAS.
- W. L. Jolly and D. N. Hendrickson, J. Am. Chem. Soc., 1970, 92, 1863–18716 CrossRef CAS.
- P. S. Bagus, C. Sousa and F. Illas, Phys. Chem. Chem. Phys., 2020, 22, 22617–22626 RSC.
- B. Ruscic, R. E. Pinzon, G. von Laszewski, D. Kodeboyina, A. Burcat, D. Leahy, D. Montoy and A. F. Wagner, J. Phys: Conf. Ser., 2005, 16, 561–570 CrossRef CAS.
- K. Yamada, J. Mol. Spectrosc., 1980, 79, 323–344 CrossRef.
- P. Bolognesi, M. Coreno, L. Avaldi, L. Storchi and F. Tarantelli, J. Chem. Phys., 2006, 125, 054306 CrossRef PubMed.
- R. H. Temperton, W. Quevedo, R. Seidel, J. Uhlig, J. Schnadt and P. Persson, Phys. Rev. Res., 2021, 3, 033030 CrossRef CAS.
Footnotes |
| † Electronic supplementary information (ESI) available. DOI: https://doi.org/10.1039/d2cp02104h |
| ‡ Present address: School of Physical Sciences, Ingram Building, University of Kent, Park Wood Rd, Canterbury CT2 7NH, UK. |
| This journal is © the Owner Societies 2022 |