
 Open Access Article
 This Open Access Article is licensed under a Creative Commons Attribution-Non Commercial 3.0 Unported Licence
Design of well-defined shell–core covalent organic frameworks/metal sulfide as an efficient Z-scheme heterojunction for photocatalytic water splitting†
Yan
Wang
 a,
Zhao
Hu
c,
Wei
Wang
a,
Haichuan
He
a,
Liu
Deng
*ab,
Yi
Zhang
a,
Jianhan
Huang
a,
Ning
Zhao
b,
Guipeng
Yu
*a and
You-Nian
Liu
*ab
a,
Zhao
Hu
c,
Wei
Wang
a,
Haichuan
He
a,
Liu
Deng
*ab,
Yi
Zhang
a,
Jianhan
Huang
a,
Ning
Zhao
b,
Guipeng
Yu
*a and
You-Nian
Liu
*ab
aHunan Provincial Key Laboratory of Micro & Nano Materials Interface Science, College of Chemistry and Chemical Engineering, Central South University, Changsha, Hunan 410083, PR China. E-mail: dengliu@csu.edu.cn; gilbertyu@csu.edu.cn; liuyounian@csu.edu.cn
bState Key Laboratory of Coal Conversion, Institute of Coal Chemistry, CAS, Taiyuan, Shanxi 030001, PR China
cState Key Laboratory of Breeding Base of Green Pesticide & Agricultural Bioengineering, Key Laboratory of Green Pesticide & Agricultural Bioengineering, Ministry of Education, State-Local Joint Laboratory for Comprehensive Utilization of Biomass, Center for R&D of Fine Chemicals, Guizhou University, Guiyang, Guizhou 550025, China
First published on 1st December 2021
Abstract
Development of a covalent–organic framework (COF)-based Z-scheme heterostructure is a promising strategy for solar energy driven water splitting, but the construction of a COF-based Z-scheme heterostructure with well-defined architecture, large contact area and intimate contact interfaces is scarce. Herein, we fabricated a direct Z-scheme heterostructure COF–metal sulfide hybrid (T-COF@CdS) with shell–core architecture by self-polymerization of 1,3,5-benzenetricarboxaldehyde and 2,4,6-tris(4-aminophenyl)-1,3,5-triazine in situ on CdS. The formed C–S chemical bonding between T-COF and CdS could provide a very tight and stable interface. Owing to the properly staggered band alignment, strong interfacial interaction and large interfacial contact area between T-COF and CdS, a Z-scheme route for charge separation and transfer is realized, resulting in electron accumulation in CdS for H2O reduction. The obtained Z-scheme heterostructure T-COF@CdS-3 exhibits a high apparent quantum efficiency of 37.8% under 365 nm monochromatic light irradiation, and long-term stability arising from shell–core structures in which the T-COF shell protects the catalytic centers of CdS against deactivation, as well as acts as oxidation sites to avoid the photocorrosion of CdS. This work provides a strategy for the construction of a shell–core direct Z-scheme heterostructure photocatalyst for water splitting with high performance.
Introduction
Harvesting energy from the sun through photocatalytic hydrogen (H2) evolution from water splitting has been considered as a promising and sustainable technology to obtain an alternative energy source to solve the global environmental pollution and energy crisis.1,2 It is highly required to construct photocatalysts with a visible light absorption range, strong redox ability, high charge-separation efficiency, and long-term stability.3 Recently, various Z-scheme heterostructure photocatalysts, such as Bi-based,4 TiO2-based,5 and metal sulfide-based6 ones, have attracted tremendous interest in H2 production from water splitting.7,8 However, the traditional inorganic Z-scheme heterojunctions consisting of two inorganic semiconductors are limited in many vital aspects, such as aligned band structures, interfacial contact area and transmission of substrates in the process of photocatalytic reactions, resulting in poor photocatalytic efficiency.9,10Recently, a combination of inorganic semiconductors and organic components has been proposed as a feasible strategy to improve the photocatalytic efficiency of photocatalysts.11–13 Among them, covalent–organic frameworks (COFs), porous and crystalline organic semiconductors, are attractive building blocks for the construction of photocatalysts, owing to their high visible light absorption capacity and fast charge-carrier mobility.14–16 In particular, their structure, band position and band gap can be precisely designed, which provides an ideal scaffold to accurately integrate photocatalytic units into Z-scheme heterojunctions with periodic skeletons and predictable manner.17–19 Many COF-based Z-scheme heterojunctions have been proposed as photocatalysts for water splitting,20 CO2 reduction21 and pollutant degradation.22 Though these kinds of catalysts showed improved photocatalytic efficiency, they still suffer from sluggish separation and migration of photogenerated charges, limited interfacial contact area and low long-term stability, mainly due to the random overlay of inorganic semiconductors on the COFs. In general, the stacking pattern, the interfacial area, and connectivity between COFs and semiconductors are closely related to the spatial redox site separation and the electron transfer pathway. Unfortunately, there are few reports on the precise fabrication of the well-defined heterostructures of COFs and inorganic semiconductors with specific connections and large contact area.
Besides, impressive COF-based Z-scheme studies have been carried out centering on metal oxide semiconductors, such as TiO2, Bi2WO6, α-Fe2O3, etc.20,21,23 Compared to metal oxides, metal sulfides (e.g., CdS, ZnS, and CuS) possess less positive VB occupation by the S 3p orbital and smaller effective mass of charge carriers, which contributes to an appropriate band position and band gap, robust quantum size effect and fast charge carrier dynamics for high photocatalytic performance.24,25 However, the metal sulfide-based photocatalysts face a critical challenge of photocorrosion, owing to S2− oxidation by photogenerated holes.26 Much effort has been devoted to suppressing the photocorrosion of metal sulfide semiconductors, such as the fabrication of photocatalytic heterogeneous structures or the introduction of co-catalysts.27–30 Therefore, a combination of functional COFs and metal sulfide semiconductors in Z-scheme heterostructures would be an effective strategy to suppress the photocorrosion via accurately regulating the oxidation sites and enhancing the migration of photogenerated charges.
Herein, we present a strategy for the construction of a stable Z-scheme system with well-defined shell–core architecture comprising COFs and CdS semiconductors for photocatalytic water splitting. By fine-tuning the building blocks, we first synthesized T-COF possessing properly aligned band structures with CdS via polycondensation of 1,3,5-benzenetri-carboxaldehyde (M1) and 2,4,6-tris(4-aminophenyl)-1,3,5-triazine (M2). Then a series of Z-scheme heterostructure T-COF@CdS hybrid photocatalysts was prepared by directed self-polymerization of M1 and M2 on CdS at room temperature. The heterointerface between T-COF and CdS can be built through C–S chemical bonding, which could provide a very tight and stable interface as well as act as an electron medium to promote the recombination of carriers with an inferior redox capacity, resulting in a direct Z-scheme charge transfer. The Z-scheme heterostructure photocatalyst T-COF@CdS-3 displays a H2 production rate of 12.25 mmol g−1 h−1, about 7.2 times higher than that of pure CdS (1.70 mmol g−1 h−1) and 5.8 times better than that of T-COF (2.12 mmol g−1 h−1). Meanwhile, DFT calculations and contact angle measurements also prove that CdS has a stronger interaction with H2O than that of T-COF, facilitating H2O reduction from electron accumulation in CdS sites, while avoiding CdS photocorrosion through holes located on the COF component. Therefore, this work may offer a way to precisely design the appropriate band structure and the interfacial surface towards COF-based Z-scheme structure regulation to improve the photocatalytic efficiency.
Results and discussion
The preparation of shell–core T-COF@CdS is shown in Fig. 1a. To facilitate the immobilization of the T-COF shell on the CdS core, the negatively charged CdS sphere was first synthesized by a solvothermal method, and exhibits a negative zeta potential of −19.9 mV at pH 7 (Fig. S1, ESI†). Then, a monomer with amino groups (2,4,6-tris(4-aminophenyl)-1,3,5-triazine, M2) was tethered to the CdS surface via electrostatic forces. Meanwhile, 1,3,5-benzenetricarboxaldehyde (M1) was further periodically linked to the amino groups of M2 by the Schiff base reaction to form a shell–core structural T-COF@CdS. By optimizing the mass ratios of T-COF/CdS, a series of T-COF@CdS-X with different composition ratios of the shell and core were obtained (X = 1, 2, 3 and 4. For details see the Experimental section). The morphologies of the as-prepared photocatalysts were characterized by scanning electron microscopy (SEM) and transmission electron microscopy (TEM). SEM and TEM images clearly reveal that the pure CdS and T-COF possess the regular spherical morphology (Fig. 1b, c, e and f). After growing COFs in situ on CdS, the as-obtained T-COF@CdS-3 maintains the spherical morphology of CdS and T-COF (Fig. 1d). It can be clearly seen that CdS is completely covered by T-COF with a shell thickness of ∼75 nm (Fig. 1g). The high-angle annular dark field transmission electron microscopy (HAADF-TEM) image and energy-dispersive X-ray spectroscopy (EDX) elemental mapping of T-COF@CdS-3 are shown in Fig. 1h–l, which reveal that Cd and S are evenly distributed within T-COF, and that C and N are uniformly covered on the CdS core. The morphology of the other T-COF@CdS-X was also investigated and is shown in Fig. S2 (ESI†); they all display a spherical shell–core morphology.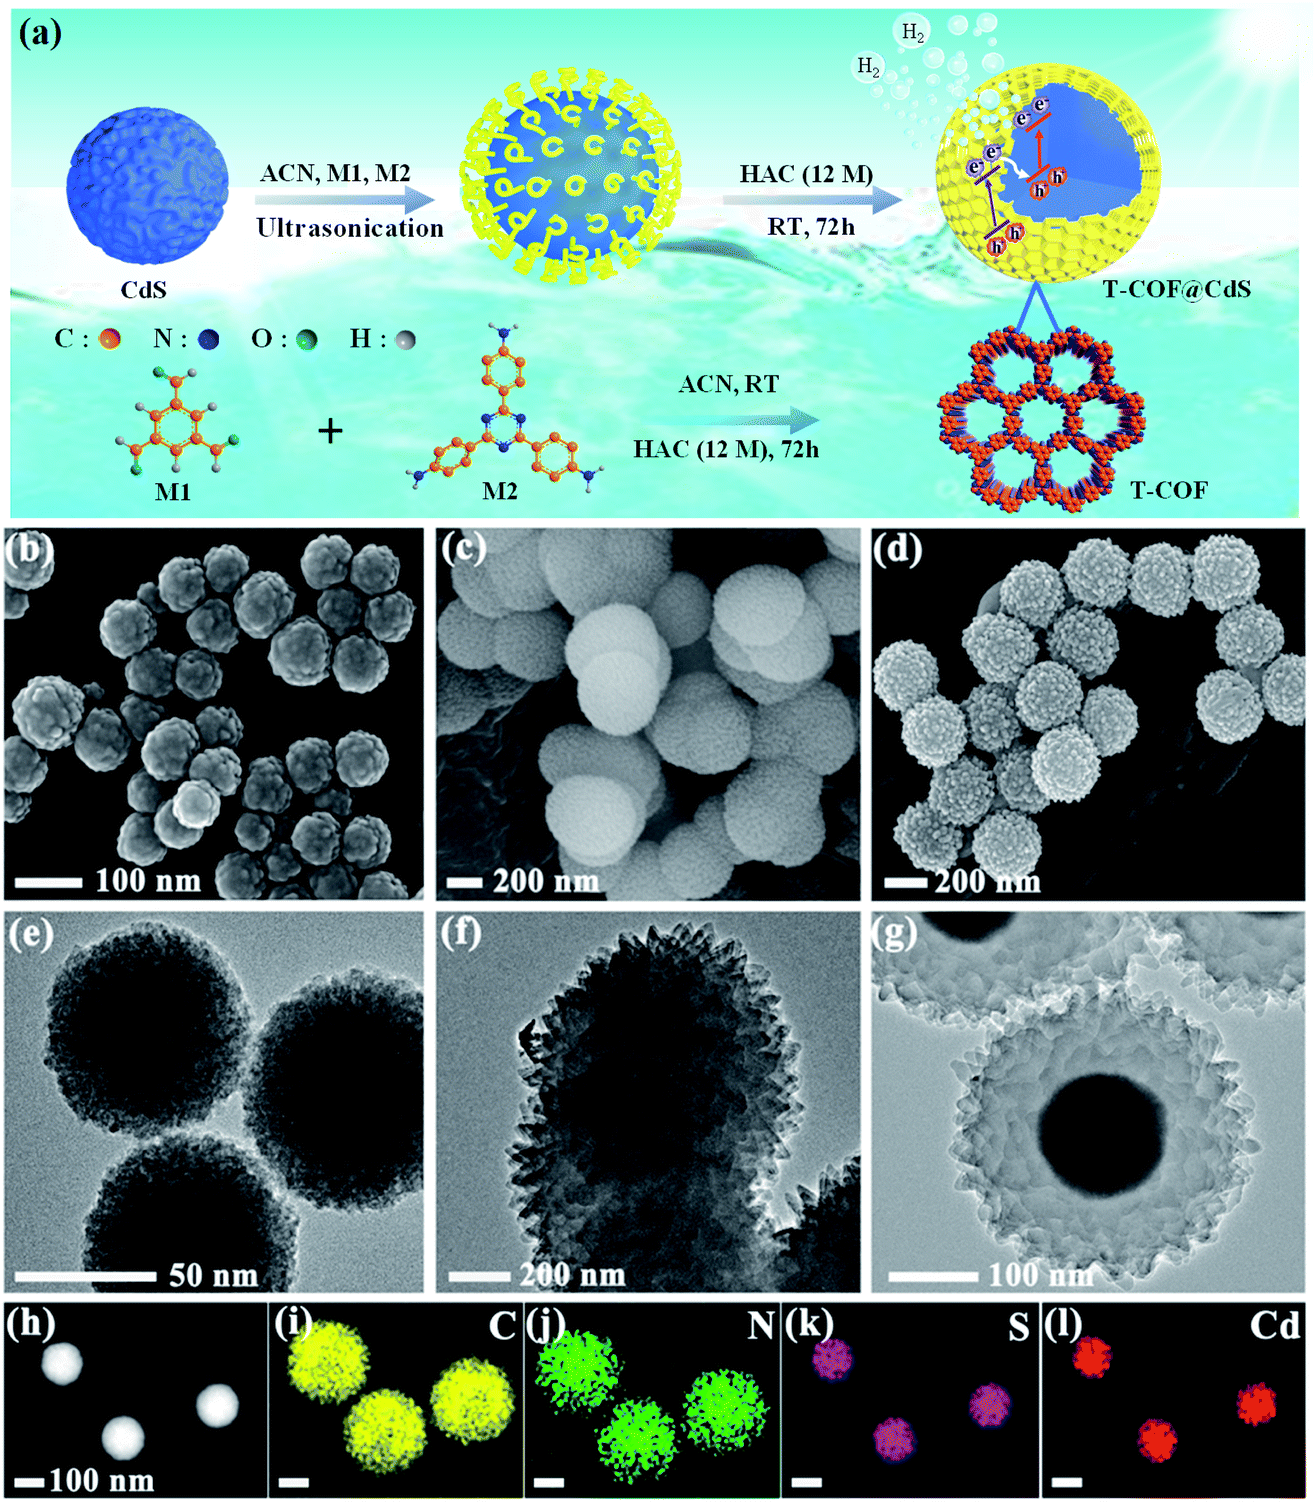 | ||
| Fig. 1 (a) Schematic illustration of the preparation of T-COF@CdS. SEM images of (b) CdS, (c) T-COF, and (d) T-COF@CdS-3. TEM images of (e) CdS, (f) T-COF, and (g) T-COF@CdS-3. (h) The HAADF-TEM image of T-COF@CdS-3. (i–l) EDX elemental mapping of T-COF@CdS-3. | ||
The crystallinity of the samples was confirmed by powder X-ray diffraction (PXRD). As illustrated in Fig. S3 (ESI†), the diffraction peaks at 24.8, 26.5, 28.2, 43.7, 47.8 and 51.8° correspond to the (100), (002), (101), (110), (103) and (112) facets of CdS, which agree with the simulated PXRD patterns of the typical hexagonal phase of CdS (JCPDS 41-1049). As shown in Fig. S4 (ESI†), the intensive diffraction peak at 5.65° is attributed to the characteristic diffraction peak of the (100) facet, which is assigned to the high crystallinity of T-COF, and all peaks are well matched to those of the simulated AA stacking mode.31 For T-COF@CdS hybrid materials, the typical diffraction peaks of both CdS and T-COF are all observed without impurity phases. The PXRD patterns show that all hybrid materials display an intense peaks at 5.65°, corresponding to the (100) reflection of the T-COF component, and the characteristic peaks of the CdS component also appear clearly (Fig. 2a and S5, ESI†). However, the intensity of the characteristic peaks of the T-COF component was weakened with increasing CdS contents, and the failure of forming a shell–core structure with high crystallinity could be ascribed to the destroyed growth environment of T-COF by excessive CdS. The successful preparation of T-COF@CdS was further proved using Fourier transform infrared (FT-IR) spectra. In the FT-IR spectra of M1 and M2 (Fig. S6, ESI†), the peaks at 1686 cm−1 and at 3203–3458 cm−1 can be assigned to the C![[double bond, length as m-dash]](https://www.rsc.org/images/entities/char_e001.gif) O stretching and the –NH2 stretching vibrations, respectively. In the FT-IR spectra of T-COF and T-COF@CdS, both types of stretching vibration bands disappear after polycondensation, indicating a high degree of polymerization. In addition, all the T-COF@CdS hybrids display a characteristic peak at 658 cm−1 (Fig. 2b and S7, ESI†), corresponding to the newly formed C–S stretching between T-COF and CdS, indicating a strong interfacial interaction between them in the hetero-phase junction.32 The porosity features of the as-prepared samples were evaluated using N2 adsorption and desorption isotherms at 77 K up to 1 bar (Fig. S8a, ESI†). The pure CdS and T-COF possess Brunauer–Emmett–Teller (BET) surface areas with values of 34 m2 g−1 and 684 m2 g−1, respectively. Meanwhile, the BET surface area of T-COF@CdS-3 was calculated to be 632 m2 g−1, similar to that of pure T-COF (684 m2 g−1), which demonstrates that the T-COF shell with high crystallinity can be well formed on the surface of CdS under these conditions. The pore size distribution of the materials was further fitted by nonlocal density functional theory (NLDFT). The pore sizes of both T-COF and T-COF@CdS-3 mainly distribute at around 1.13 nm, which is very close to the calculated value of 1.6 nm (Fig. S8b, ESI†).33 The large BET surface area and uniform 1D open channels offer great opportunities for the rapid transmission of H2O, which then reaches the surface of CdS for reduction reactions. These results indicate that the CdS semiconductors are uniformly encapsulated by T-COFs, confirming the feasibility of this strategy.
O stretching and the –NH2 stretching vibrations, respectively. In the FT-IR spectra of T-COF and T-COF@CdS, both types of stretching vibration bands disappear after polycondensation, indicating a high degree of polymerization. In addition, all the T-COF@CdS hybrids display a characteristic peak at 658 cm−1 (Fig. 2b and S7, ESI†), corresponding to the newly formed C–S stretching between T-COF and CdS, indicating a strong interfacial interaction between them in the hetero-phase junction.32 The porosity features of the as-prepared samples were evaluated using N2 adsorption and desorption isotherms at 77 K up to 1 bar (Fig. S8a, ESI†). The pure CdS and T-COF possess Brunauer–Emmett–Teller (BET) surface areas with values of 34 m2 g−1 and 684 m2 g−1, respectively. Meanwhile, the BET surface area of T-COF@CdS-3 was calculated to be 632 m2 g−1, similar to that of pure T-COF (684 m2 g−1), which demonstrates that the T-COF shell with high crystallinity can be well formed on the surface of CdS under these conditions. The pore size distribution of the materials was further fitted by nonlocal density functional theory (NLDFT). The pore sizes of both T-COF and T-COF@CdS-3 mainly distribute at around 1.13 nm, which is very close to the calculated value of 1.6 nm (Fig. S8b, ESI†).33 The large BET surface area and uniform 1D open channels offer great opportunities for the rapid transmission of H2O, which then reaches the surface of CdS for reduction reactions. These results indicate that the CdS semiconductors are uniformly encapsulated by T-COFs, confirming the feasibility of this strategy.
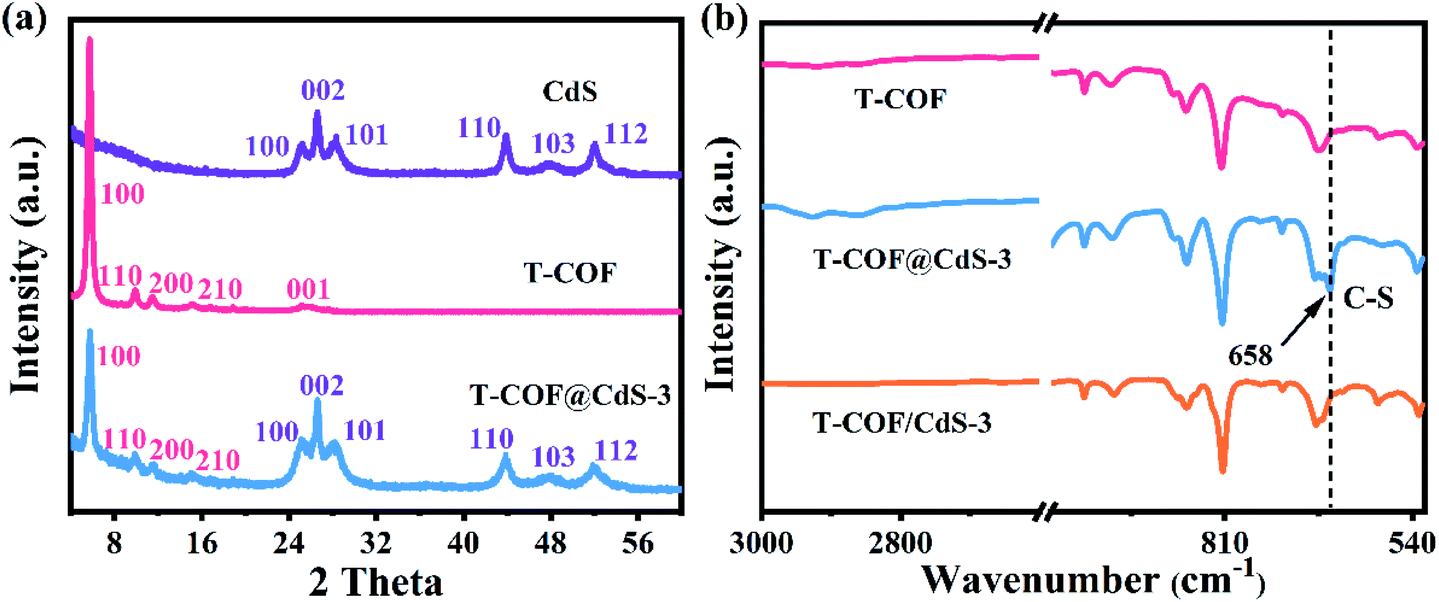 | ||
| Fig. 2 (a) PXRD patterns of CdS, T-COF and T-COF@CdS-3. (b) FT-IR spectra of T-COF, T-COF@CdS-3 and T-COF/CdS-3. | ||
The optical properties and electronic band structure of the hybrid materials were evaluated by UV-vis diffuse reflectance spectroscopy (DRS), X-ray photoelectron spectroscopy (XPS) and UV photoelectron spectroscopy (UPS). As shown in Fig. 3a, the bare CdS and T-COF exhibit absorption edges at 520 and 470 nm, respectively. Benefiting from the incorporation of the CdS component, the absorption edges of T-COF@CdS exhibit an obvious redshift to 500 nm in the visible region (Fig. 3a and S9, ESI†), suggesting that the formation of hetero-phase junctions is effective for the visible-light response.34 Using the Tauc plot, the band gap energy (Eg) of CdS and T-COF is estimated to be about 2.4 and 2.65 eV, respectively (Fig. S10, ESI†). The valence band X-ray photoelectron spectroscopy (VB XPS) measurements were conducted to determine the valence band position of the prepared materials, and the VB positions of CdS and T-COF are located at 1.42 and 1.59 eV, respectively (Fig. 3b and c). To eliminate the measurement error by the work function (WF) and vacuum level (Fig. S11, ESI†),35 the UPS spectra of CdS and T-COF were recorded. As illustrated in Fig. 3d and e, the VB positions (vs. the reversible hydrogen electrode, RHE) of CdS and T-COF are calculated to be 1.66 and 2.04 eV (vs. RHE), respectively. Correspondingly, the CB positions of CdS and T-COF are −0.74 and −0.61 V (vs. RHE) using the formula ECB = EVB − Eg. The band positions of CdS and T-COF can then be outlined in Fig. 3f.
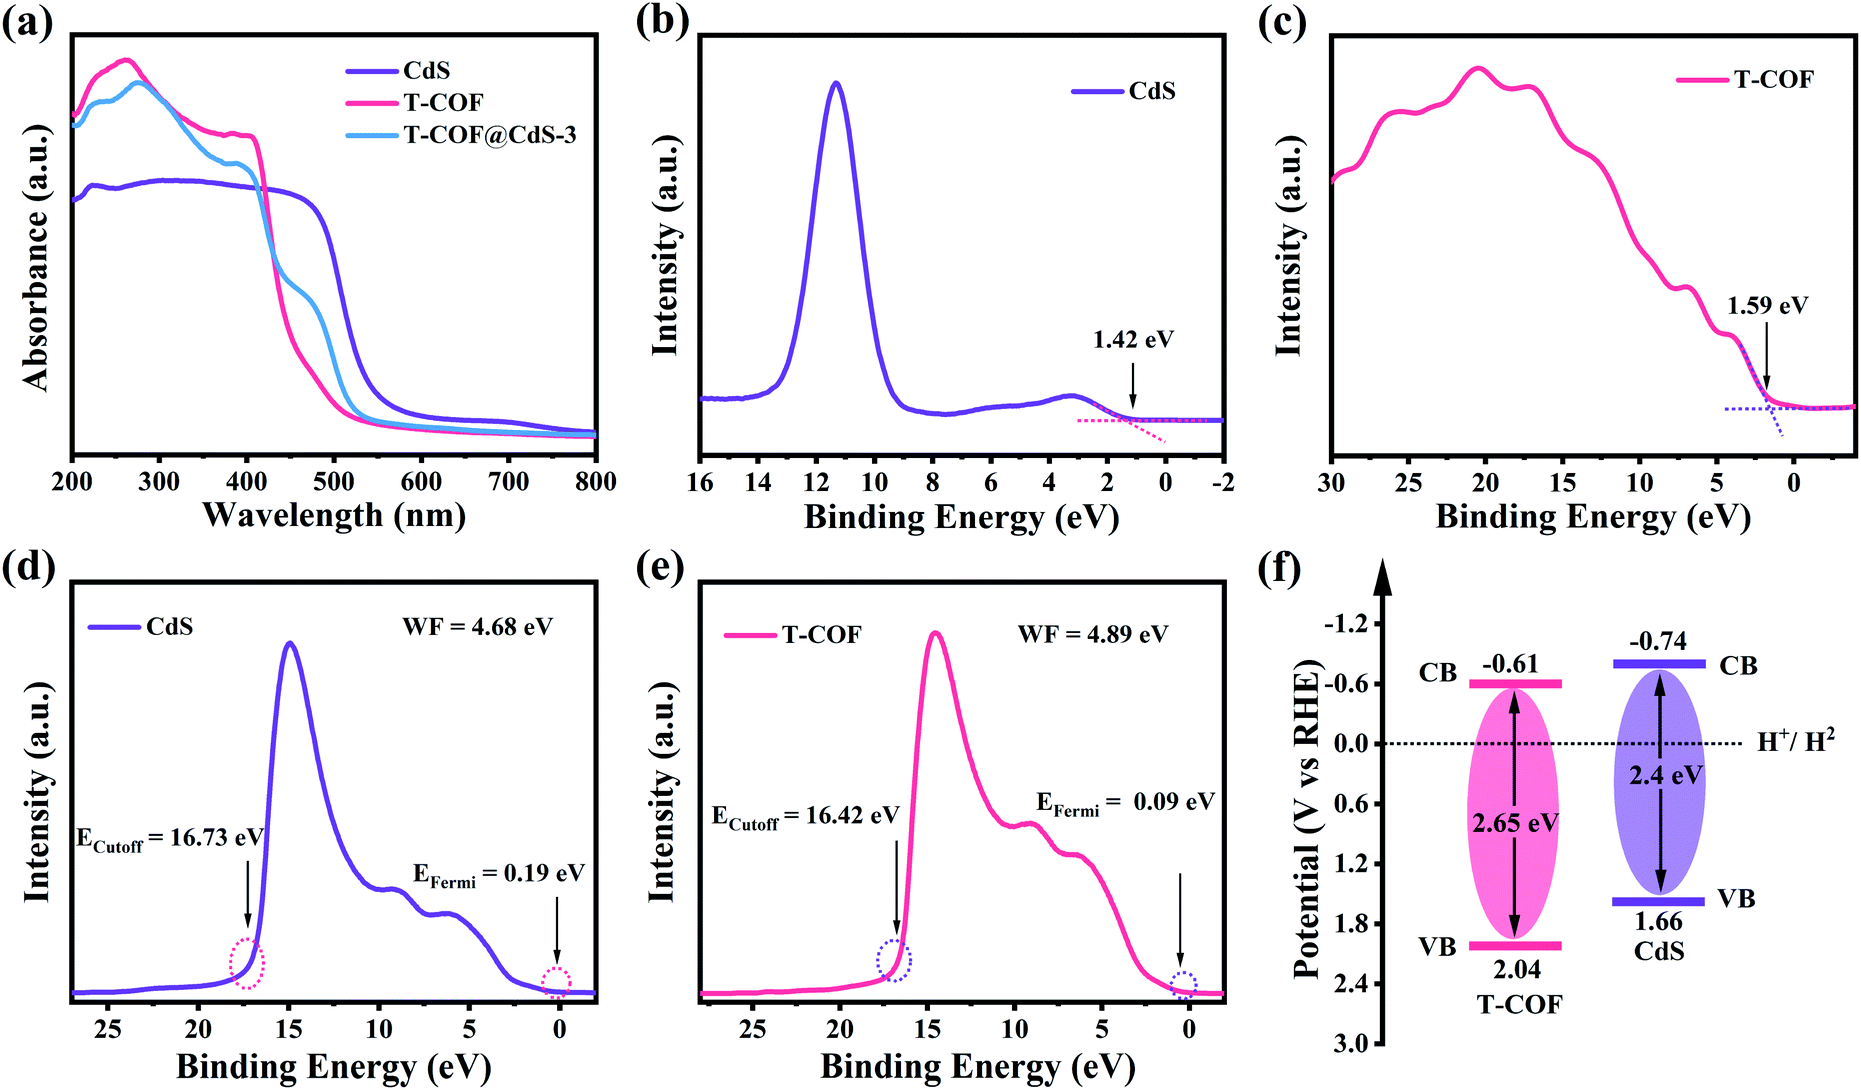 | ||
| Fig. 3 (a) UV-visible DRS spectra of CdS, T-COF and T-COF@CdS-3. VB-XPS spectra of (b) CdS and (c) T-COF. UPS spectra of (d) CdS and (e) T-COF. (f) The estimated band structure of CdS and T-COF. | ||
Clearly, the staggered band alignment is formed between CdS and T-COF (Fig. 4a). When CdS and T-COF combine to form a heterojunction, the charge transfer pathway at the interface of the heterostructure depends on their work functions. The work function difference between CdS and T-COF is essential for inducing charge redistribution and forming a built-in electric field at the interface, which then prominently affects the photogenerated charge transfer process. The work functions of CdS and T-COF are determined to be about 4.68 and 4.89 eV, respectively (Fig. 3d and e), indicating that the Fermi level (FL) of T-COF is lower than that of CdS. Therefore, when they connect with each other, the electrons in CdS flow to T-COF through the intimate interface until the Fermi levels reach an equilibrium state.34 Consequently, the electrons and holes accumulate at the T-COF and CdS side, respectively, and then a built-in electric field directed from CdS to T-COF at the interface is formed (Fig. 4b). Since the electrons in T-COF are repelled by the internal electric field, the potential energy increases, and the bands bend upward. In contrast, the potential energy of the electrons in CdS decreases, and the bands bend downwards. Under light irradiation, driven by the built-in electric field and interfacial band bending, the photoexcited electrons in the CB of T-COF recombine with the holes located in the VB of CdS at the heterojunction interface, suggesting a Z-scheme charge-transfer process in the shell–core T-COF@CdS heterostructure (Fig. 4c).36
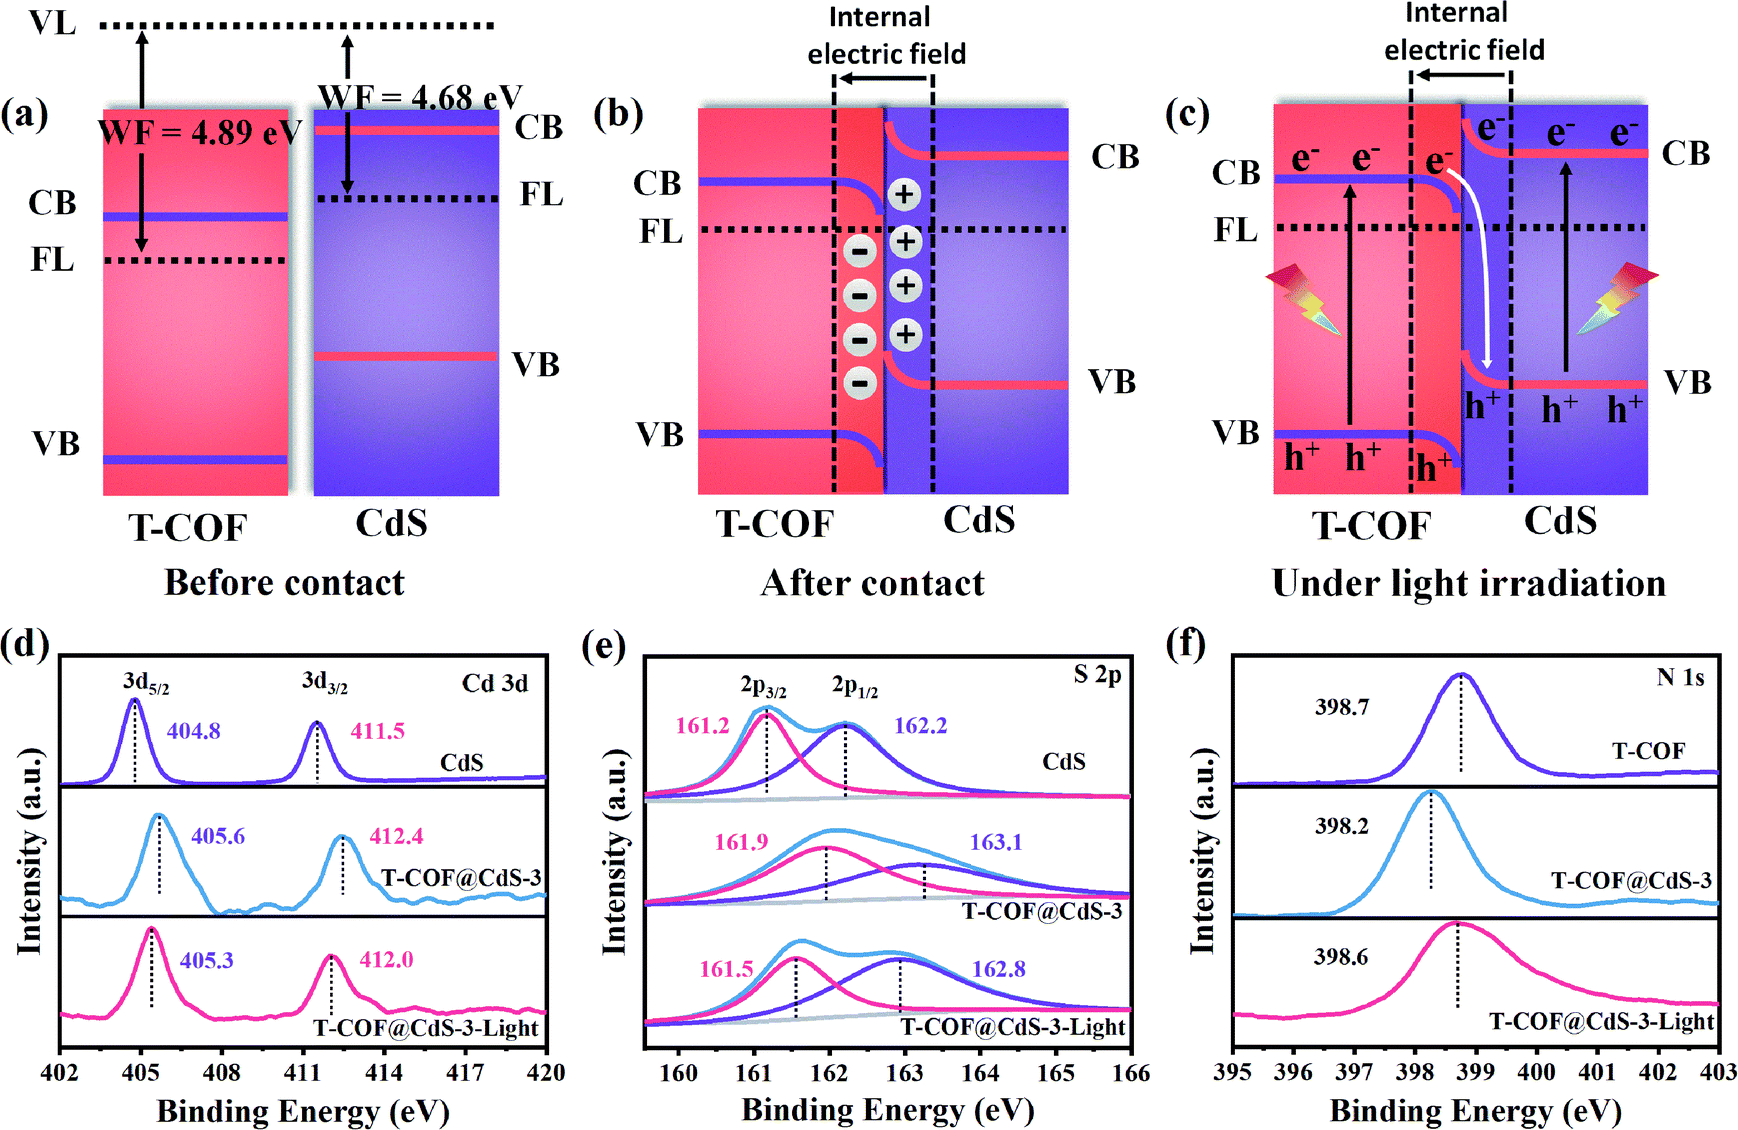 | ||
| Fig. 4 Schematic illustration of the relative band positions and charge transfer process of T-COF and CdS (a) before contact, (b) after contact and (c) under light irradiation. In situ and ex situ X-ray photoelectron spectroscopy (XPS) spectra of (d) Cd 3d, (e) S 2p and (f) N 1s. | ||
To elucidate the Z-scheme carrier transfer pathway between CdS and T-COF, high resolution ex situ and in situ X-ray photoelectron spectroscopy (XPS) spectra under light illumination were recorded for the Cd 3d, S 2p and N 1s states of the samples. For pure CdS, the Cd 3d XPS spectrum shows two narrow peaks located at 404.8 and 411.5 eV, assigned to elemental Cd 3d5/2 and Cd 3d3/2 (Fig. 4d), and the S 2p XPS spectrum of CdS is fitted to two peaks at 161.2 and 162.2 eV, corresponding to S 2p3/2 and S 2p1/2 (Fig. 4e). After forming a heterojunction with CdS and T-COF, both binding energies of Cd 3d and S 2p in T-COF@CdS-3 exhibit a positive shift. Conversely, the binding energy of N 1s in T-COF@CdS-3 displays a negative shift in comparison with that of pure T-COF (Fig. 4f), indicating that electrons transfer from CdS to T-COF due to the difference of their work functions. When applying light illumination to T-COF@CdS-3 during XPS measurements, the binding energies of Cd 3d and S 2p for T-COF@CdS-3 shift negatively compared to those in the dark. The negative shift in the Cd 3d and S 2p binding energies under light irradiation is due to the electron-density increase at the Cd and S sites. Conversely, the binding energy of N 1s shifts positively by 0.4 eV, manifesting the electron-density decrease at the N sites. We can conclude that the migration direction of the photogenerated electrons is from the CB of T-COF to the VB of CdS. The proposed transfer path of the photogenerated electrons is shown in Fig. 4c. In detail, electrons and holes can be generated in both T-COF and CdS in T-COF@CdS under illumination. The excited electrons transfer from the VB of T-COF to the CB, and then to the VB of CdS via a tight bonding link and large interface. Meanwhile the remaining positive holes accumulate in the VB of T-COF, forming an electron-transfer path of the Z-scheme. As a result, the electrons transferred from the T-COF to CdS can participate in the water reduction for H2 evolution, while the accumulated holes on the surface of T-COF can be captured by sacrificial agents to avoid the photocorrosion of CdS.37
Photocatalytic H2 evolution of the samples was evaluated in an ascorbic acid aqueous solution with Pt as the co-catalyst at room temperature under full-spectrum light irradiation (300 W Xe lamp, Perfectlight, Beijing). As shown in Fig. 5a, the pure CdS and T-COF show a moderate H2 evolution performance. After forming a shell–core Z-scheme system, all T-COF@CdS composites exhibit an improved photocatalytic activity for H2 evolution. With the decrease of the T-COF/CdS ratio, the heterostructure interfacial contact area gradually increases, which is conducive to the fast charge transfer at the interfaces of the Z-scheme heterostructure. However, the excessive amounts of CdS would destroy the growth environment of T-COF, resulting in a failure to form a complete shell–core structure with high crystallinity (Fig. S2 and S5, ESI†). The poor crystallinity of the T-COF shell would increase the amount of defects. The defects can act as trapping and recombination centers between photoexcited electrons and holes, leading to a decrease in the photocatalytic performance.38,39 And the damaged shell would cause the interfacial contact area of the heterostructure to reduce, which is also an obstacle in the charge transfer between CdS and T-COF. By optimizing the mass ratio of T-COF and CdS, the resultant T-COF@CdS-3 at 5![[thin space (1/6-em)]](https://www.rsc.org/images/entities/char_2009.gif) :3 delivers the highest hydrogen evolution performance. Comparatively, reference T-COF/CdS-3 without the shell–core structure was fabricated via physically mixing T-COF and CdS. As shown in Fig. 5a, the photocatalytic performance of T-COF/CdS-3 is much lower than that of T-COF@CdS-3, further elucidating that the chemical bonding and large interfacial contact area between T-COF and CdS semiconductors are critical for charge separation. To provide a reference for different comparisons,40 the rates of H2 evolution per gram and per unit surface area of the photocatalyst are listed as Fig. S12 and S13 (ESI†).
:3 delivers the highest hydrogen evolution performance. Comparatively, reference T-COF/CdS-3 without the shell–core structure was fabricated via physically mixing T-COF and CdS. As shown in Fig. 5a, the photocatalytic performance of T-COF/CdS-3 is much lower than that of T-COF@CdS-3, further elucidating that the chemical bonding and large interfacial contact area between T-COF and CdS semiconductors are critical for charge separation. To provide a reference for different comparisons,40 the rates of H2 evolution per gram and per unit surface area of the photocatalyst are listed as Fig. S12 and S13 (ESI†).
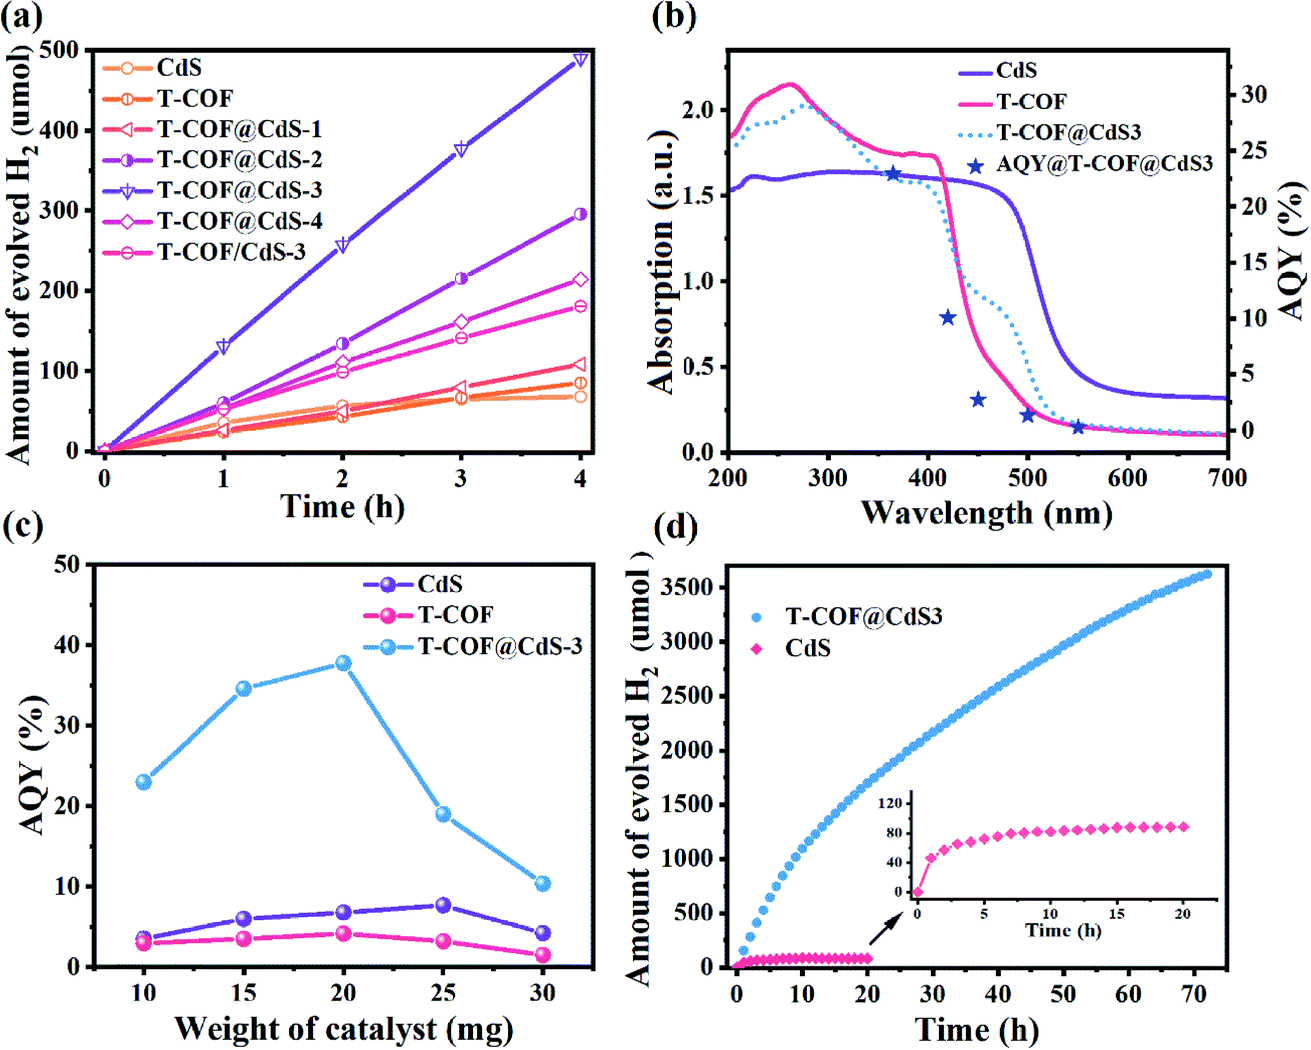 | ||
| Fig. 5 (a) Time course of H2 evolution over various catalysts (10 mg). (b) AQY values of T-COF@CdS-3 (10 mg) under different monochromatic light irradiation and UV-visible DRS spectra. (c) AQY values of CdS, T-COF and T-COF@CdS-3 at different photocatalyst weights under 365 nm monochromatic light irradiation. (d) Photocatalytic durability test results of T-COF@CdS-3 and CdS. | ||
The apparent quantum yield (AQY) is significant in the field of photocatalytic H2 production and better adapted to evaluate the performance of heterojunctions consisting of multiple components.40,41 The AQY for photocatalytic H2 evolution of CdS, T-COF and T-COF@CdS-3 was measured under the same photocatalytic reaction conditions but with different monochromatic light. Different from the single component, the photocatalytic process of Z-scheme systems is regarded as a two-step excitation process (see the Methods section in ESI†). The wavelength dependent AQY values of CdS, T-COF and T-COF@CdS-3 are given in Fig. 5b, S14 and S15 (ESI†). The consistency between the AQY and their optical absorption at different wavelengths further demonstrates that this reaction is indeed driven by the light absorption of the photocatalyst. The AQY of T-COF@CdS-3 at 365 nm is calculated to be 22.97%, which is superior to the AQY values of CdS (3.82%) and T-COF (2.95%). It is worth noting that the AQY curve of T-COF@CdS-3 is consistent with the optical absorption of T-COF, rather than CdS or the composite T-COF@CdS, strongly suggesting that the photocatalytic activity of the Z-scheme photocatalyst mainly depends on the component with inferior light absorption. In addition, the AQY value largely depends on the photocatalyst weight and only the value at the stationary point is useful in meaningful comparisons between different systems.42 By optimization of the photocatalyst weight, the AQY value of T-COF@CdS-3 reaches 37.8% at 365 nm, about 5 and 9 times better than that of pure CdS and T-COF (Fig. 5c), as well as higher than those of most CdS-based photocatalysts reported previously (listed in Table S1, ESI†).
The photocatalytic durability was also investigated using the optimized T-COF@CdS-3 heterostructure. As shown in Fig. 5d, the amount of hydrogen evolution still increases after the reaction for 72 h, while the hydrogen amount of CdS remains unchanged after 12 h, indicating the much-prolonged stability of T-COF@CdS-3. The structural integrity of T-COF@CdS-3 during the photocatalytic reaction was confirmed by PXRD and FT-IR measurements. The identical PXRD and FT-IR spectra of the pristine T-COF@CdS-3 and the sample after the reaction for 72 h prove that the Z-scheme heterostructure can retain its structural integrity in the photocatalytic reaction (Fig. S16 and S17, ESI†). In addition, we further investigated the durability of T-COF@CdS-3 under harsh conditions by adding organic pollutant methylene blue (MB) which can compete with the H2O molecules for photogenerated electrons. As shown in Fig. S18 (ESI†), after adding a small amount of MB to the reaction solution, the H2 production activity of T-COF/CdS-3 without the shell–core structure significantly decreased, while the activity of T-COF@CdS-3 basically remained unchanged, suggesting that the T-COF shell can exclude the pollutant and protect CdS. The T-COF shell with a regular pore structure (∼1.13 nm) could prevent the MB molecules with dimensions of 1.7 nm × 0.76 nm × 0.325 nm from accessing the core,43 thus ensuring that the photogenerated electrons of the CB in CdS are used to produce H2. These results indicate that the COF shell can effectively protect the CdS core against deactivation and photocorrosion, and further guarantee the long-term stability of the Z-scheme heterostructure photocatalyst.
To further clarify the interfacial charge transfer behavior of T-COF@CdS, the charge-carrier dynamics in the Z-scheme system was further investigated. Fig. S19a (ESI†) shows the photoluminescence spectra (PL) of CdS, T-COF, and the composites T-COF@CdS-3 and T-COF/CdS-3. Obviously, the emissions from T-COF@CdS-3 heterojunctions were the weakest of all, even much lower than those of the physical mixture T-COF/CdS-3. These results indicated that the intrinsic radiative recombination of the photoexcited electron–hole pairs in CdS and T-COF has been substantially suppressed by the formation of the Z-scheme heterostructure, owing to rapid carrier separation between the interfaces.44 As expected, time-resolved PL (Fig. S19b, ESI†) shows that T-COF@CdS-3 exhibits the longest average carrier lifetime with respect to all samples, suggesting the improved separation and transfer of photogenerated charge carriers in the T-COF@CdS-3 heterostructure.45 Moreover, transient photocurrent responses would provide convincing evidence for the separation of photogenerated carriers. As shown in Fig. S19c (ESI†), the photocurrent intensity of T-COF@CdS-3 displays an increased enhancement compared with that of pure CdS, T-COF and T-COF/CdS-3, implying the higher separation efficiency of carriers in the shell–core Z-scheme system under photoirradiation.46 Besides, electrochemical impedance spectroscopy (EIS) shows the smallest radius of the high-frequency semicircle of T-COF@CdS-3 than that of pure CdS, T-COF and T-COF/CdS-3 (Fig. S19d, ESI†), indicating the higher electronic conductivity of T-COF@CdS-3 than that of the semiconductors. All these results demonstrate that the shell/core structure in T-COF@CdS-3 heterojunctions can effectively induce the superior photo-induced electron–hole separation, charge transfer and inferior electron–hole recombination, compared to conventional heterojunctions.
As mentioned above, the Z-scheme heterostructure T-COF@CdS can promote interfacial charge transfer. To be a good Z-scheme photocatalyst for the redox reaction of H2O, the T-COF@CdS heterostructure should also be able to effectively capture H2O. Density functional theory (DFT) calculations and contact angle measurements were conducted to study the hydrophilic properties of the photocatalyst. As presented in Fig. 6a and b, the electronic local function (ELF) value of CdS (0.89) after adsorption of H2O is smaller than that of T-COF (0.95), demonstrating that CdS possesses a stronger interaction with H2O. And the adsorption energy (Eads) for water and the Bader charges (Δq) around a H2O molecule for CdS and T-COF were also obtained (Fig. 6c and d). The Δq values of CdS and T-COF are 0.10 and 0.04 e, respectively, which clearly reveals that the H2O molecules on CdS exhibit stronger charge transfer than those on T-COF. The Eads of CdS toward H2O (−2.93 eV) is larger than that of T-COF (−1.38 eV), indicating the large interaction along with better hydrophilicity. Furthermore, it is found that the contact angle (CA) over CdS is 20.5°, smaller than that of T-COF (42.5°), which is in accordance with the aforementioned analysis and our design notion (Fig. S20, ESI†). Based on the above analysis, an increased photocatalytic performance for H2 evolution is realized with a direct Z-scheme charge transfer route, which significantly improves the charge separation efficiency and provides a larger driving force for the photocatalytic H2 evolution, thereby enhancing the photocatalytic H2 evolution performance. Moreover, the T-COF shell with abundant pores, provides great opportunities for H2O molecules entering the pores and accessing CdS, protects the catalytic centers from damaging environments such as macromolecular pollutants in water, and acts as oxidation sites to avoid the photocorrosion of CdS. In addition, the robust bond and interface between these two species further guarantees the excellent stability of the Z-scheme multi-component photocatalytic system.
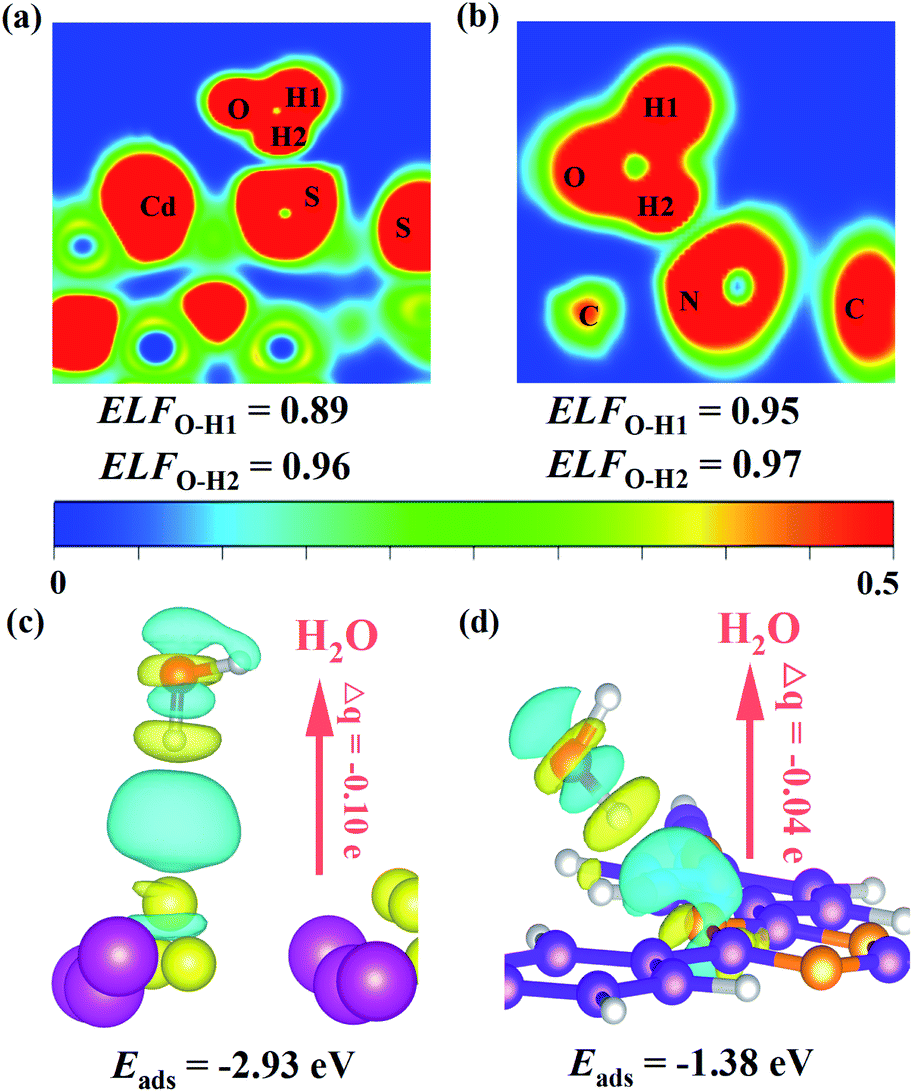 | ||
| Fig. 6 Electronic local functions (ELFs) of (a) CdS and (b) T-COF after adsorption of H2O. The charge density difference of water adsorption on (c) CdS and (d) T-COF. Eads is the adsorption energy and Δq is the Bader charge. | ||
Conclusions
In summary, we have successfully constructed a well-defined shell–core Z-scheme heterostructure through growing directly COFs on CdS as an effective photocatalyst for water splitting. By fine-tuning the building blocks, the as-synthesized T-COF has the properly staggered band alignment with CdS. And the newly formed C–S covalent bonds between T-COF and CdS, as linking bridges between them, provide a well-combined interface as well as act as an electron medium to promote the recombination of carriers with an inferior redox capacity, resulting in a Z-scheme charge pathway in the contact interface. Meanwhile, DFT calculations and contact angle measurements confirm that the catalytic center of CdS has strong interaction with H2O. Benefiting from the generation and separation of effective photoinduced carriers and adsorption of H2O molecules at the catalytic center, the obtained T-COF@CdS-3 heterostructure achieves a high apparent quantum efficiency of 37.8%. To construct a good Z-scheme heterostructure photocatalyst, the well-defined shell–core structure is also of crucial importance for guaranteeing the excellent stability of the Z-scheme system. The T-COF shell not only protects the catalytic centers of CdS against deactivation, but also acts as oxidation sites to avoid the photocorrosion of CdS, so the as-resultant T-COF@CdS-3 shows a prominent photostability for at least 72 h continuous reaction without a significant decline in its photocatalytic performance. It is expected that this work could provide useful guidance to precisely design well-modulated band structures, large interfacial contact area and strong interlayer interaction toward Z-scheme systems as a potential photocatalysts for water splitting.Data availability
We have no extra experimental or computational data associated with this article to deposite.Author contributions
The author contributions are defined below according to the CRediT contributor roles taxonomy. Conceptualization: Y. Wang, L. Deng, Y.-N. Liu and N. Zhao. Investigation and methodology: Y. Wang, W. Wang and H. He. Software: Y. Wang, Z. Hu. Visualization: Y. Wang, Z. Hu, W. Wang and H. He. Supervision: Y. -N. Liu, Y. Zhang, J. Huang and G. Yu. Writing-original draft: Y. Wang and L. Deng. Writing-review & editing: L. Deng, G. Yu and Y. -N. Liu. Funding acquisition: Y.-N. Liu, L. Deng and N. Zhao.Conflicts of interest
The authors declare no conflict of interest.Acknowledgements
This work was supported by the National Natural Science Foundation of China (No. 21636010 and 21878342), the Foundation of State Key Laboratory of Coal Conversion, Shanxi, China (Grant No. J21-22-609), and the Hunan Provincial Science and Technology Plan Project, China (No. 2019TP1001 and 2020JJ3044).Notes and references
- Z. Wang, C. Li and K. Domen, Chem. Soc. Rev., 2019, 48, 2109–2125 RSC.
- S. Chen, J. J. M. Vequizo, T. Hisatomi, M. Nakabayashi, L. Lin, Z. Wang, A. Yamakata, N. Shibata, T. Takata, T. Yamada and K. Domen, Chem. Sci., 2020, 11, 6436–6441 RSC.
- P. Zhou, J. Yu and M. Jaroniec, Adv. Mater., 2014, 26, 4920–4935 CrossRef CAS PubMed.
- S. Sun, T. Hisatomi, Q. Wang, S. Chen, G. Ma, J. Liu, S. Nandy, T. Minegishi, M. Katayama and K. Domen, ACS Catal., 2018, 8, 1690–1696 CrossRef CAS.
- G. Zuo, Y. Wang, W. L. Teo, Q. Xian and Y. Zhao, Appl. Catal., B, 2021, 291, 120126 CrossRef CAS.
- Z. Wang, Z. Wang, X. Zhu, C. Ai, Y. Zeng, W. Shi, X. Zhang, H. Zhang, H. Si, J. Li, C. Z. Wang and S. Lin, Small, 2021, 17, 2102699 CrossRef CAS PubMed.
- X. Wang, X. Wang, J. Huang, S. Li, A. Meng and Z. Li, Nat. Commun., 2021, 12, 4112 CrossRef CAS PubMed.
- J. Abdul Nasir, A. Munir, N. Ahmad, T. U. Haq, Z. Khan and Z. Rehman, Adv. Mater., 2021, 2105195, DOI:10.1002/adma.202105195.
- X. Li, C. Garlisi, Q. Guan, S. Anwer, K. Al-Ali, G. Palmisano and L. Zheng, Mater. Today, 2021, 47, 75–107 CrossRef CAS.
- Q. Xu, L. Zhang, J. Yu, S. Wageh, A. A. Al-Ghamdi and M. Jaroniec, Mater. Today, 2018, 21, 1042–1063 CrossRef CAS.
- L. Wang, Y. Zhang, L. Chen, H. Xu and Y. Xiong, Adv. Mater., 2018, 30, 1801955 CrossRef PubMed.
- W. Li, Z. Guo, L. Jiang, L. Zhong, G. Li, J. Zhang, K. Fan, S. Gonzalez-Cortes, K. Jin, C. Xu, T. Xiao and P. P. Edwards, Chem. Sci., 2020, 11, 2716–2728 RSC.
- H. Xu, S. Yang, X. Ma, J. Huang and H. Jiang, ACS Catal., 2018, 8, 11615–11621 CrossRef CAS.
- R. Chen, Y. Wang, Y. Ma, A. Mal, X. Y. Gao, L. Gao, L. Qiao, X. B. Li, L. Z. Wu and C. Wang, Nat. Commun., 2021, 12, 1354 CrossRef CAS PubMed.
- W. Li, X. Huang, T. Zeng, Y. A. Liu, W. Hu, H. Yang, Y. B. Zhang and K. Wen, Angew. Chem., Int. Ed., 2021, 60, 1869–1874 CrossRef CAS PubMed.
- H. L. Nguyen, Chem. Sci., 2021, 12, 8632–8647 RSC.
- Y. Liu, W. Zhou, W. L. Teo, K. Wang, L. Zhang, Y. Zeng and Y. Zhao, Chem, 2020, 6, 3172–3202 CAS.
- R. Ghosh and F. Paesani, Chem. Sci., 2021, 12, 8373–8384 RSC.
- R. L. Li, N. C. Flanders, A. M. Evans, W. Ji, I. Castano, L. X. Chen, N. C. Gianneschi and W. R. Dichtel, Chem. Sci., 2019, 10, 3796–3801 RSC.
- Y. Zhang, H. Tang, H. Dong, M. Gao, C. Li, X. Sun, J. Wei, Y. Qu, Z. Li and F. Zhang, J. Mater. Chem. A, 2020, 8, 4334–4340 RSC.
- M. Zhang, M. Lu, Z. L. Lang, J. Liu, M. Liu, J. N. Chang, L. Y. Li, L. J. Shang, M. Wang, S. L. Li and Y. Q. Lan, Angew. Chem., Int. Ed., 2020, 59, 6500–6506 CrossRef CAS PubMed.
- S. He, Q. Rong, H. Niu and Y. Cai, Appl. Catal., B, 2019, 247, 49–56 CrossRef CAS.
- L. Wang, G. Huang, L. Zhang, R. Lian, J. Huang, H. She, C. Liu and Q. Wang, J. Energy Chem., 2022, 64, 85–92 CrossRef.
- Y. Shiga, N. Umezawa, N. Srinivasan, S. Koyasu, E. Sakai and M. Miyauchi, Chem. Commun., 2016, 52, 7470–7473 RSC.
- X. Zhang, H. Liang, H. Li, Y. Xia, X. Zhu, L. Peng, W. Zhang, L. Liu, T. Zhao, C. Wang, Z. Zhao, C. T. Hung, M. M. Zagho, A. A. Elzatahry, W. Li and D. Zhao, Angew. Chem., Int. Ed., 2020, 59, 3287–3293 CrossRef CAS PubMed.
- M. Xing, B. Qiu, M. Du, Q. Zhu, L. Wang and J. Zhang, Adv. Funct. Mater., 2017, 27, 1702624 CrossRef.
- X. Wu, H. Zhang, J. Dong, M. Qiu, J. Kong, Y. Zhang, Y. Li, G. Xu, J. Zhang and J. Ye, Nano Energy, 2018, 45, 109–117 CrossRef CAS.
- J. Thote, H. B. Aiyappa, A. Deshpande, D. Diaz Diaz, S. Kurungot and R. Banerjee, Chem.–Eur. J., 2014, 20, 15961–15965 CrossRef CAS PubMed.
- D. Wang, H. Zeng, X. Xiong, M.-F. Wu, M. Xia, M. Xie, J. Zou and S. Luo, Sci. Bull., 2020, 65, 113–122 CrossRef CAS.
- S. Guan, X. Fu, Y. Zhang and Z. Peng, Chem. Sci., 2018, 9, 1574–1585 RSC.
- C. Kang, Z. Zhang, V. Wee, A. K. Usadi, D. C. Calabro, L. S. Baugh, S. Wang, Y. Wang and D. Zhao, J. Am. Chem. Soc., 2020, 142, 12995–13002 CrossRef CAS PubMed.
- C. Wang, L. Wang, J. Jin, J. Liu, Y. Li, M. Wu, L. Chen, B. Wang, X. Yang and B.-L. Su, Appl. Catal., B, 2016, 188, 351–359 CrossRef CAS.
- L. Bai, Q. Gao and Y. Zhao, J. Mater. Chem. A, 2016, 4, 14106–14110 RSC.
- F. Liu, R. Shi, Z. Wang, Y. Weng, C. M. Che and Y. Chen, Angew. Chem., Int. Ed., 2019, 58, 11791–11795 CrossRef CAS PubMed.
- C. Feng, L. Tang, Y. Deng, J. Wang, J. Luo, Y. Liu, X. Ouyang, H. Yang, J. Yu and J. Wang, Adv. Funct. Mater., 2020, 30, 2001922 CrossRef CAS.
- D. Zhao, Y. Wang, C. Dong, Y. Huang, J. Chen, F. Xue, S. Shen and L. Guo, Nat. Energy, 2021, 6, 388–397 CrossRef CAS.
- F. Xu, K. Meng, B. Cheng, S. Wang, J. Xu and J. Yu, Nat. Commun., 2020, 11, 4613 CrossRef CAS PubMed.
- M. Luo, Q. Yang, W. Yang, J. Wang, F. He, K. Liu, H. Cao and H. Yan, Small, 2020, 16, 2001100 CrossRef CAS PubMed.
- A. Kudo and Y. Miseki, Chem. Soc. Rev., 2009, 38, 253–278 RSC.
- M. Melchionna and P. Fornasiero, ACS Catal., 2020, 10, 5493–5501 CrossRef CAS.
- M. Qureshi and K. Takanabe, Chem. Mater., 2016, 29, 158–167 CrossRef.
- S. Cao and L. Piao, Angew. Chem., Int. Ed., 2020, 59, 18312–18320 CrossRef CAS PubMed.
- Y. Yukselen and A. Kaya, Eng. Geol., 2008, 102, 38–45 CrossRef.
- M. M. Furchi, A. Pospischil, F. Libisch, J. Burgdorfer and T. Mueller, Nano Lett., 2014, 14, 4785–4791 CrossRef CAS PubMed.
- M. Hao, Y. Bai, S. Zeiske, L. Ren, J. Liu, Y. Yuan, N. Zarrabi, N. Cheng, M. Ghasemi, P. Chen, M. Lyu, D. He, J. Yun, Y. Du, Y. Wang, S. Ding, A. Armin, P. Meredith, G. Liu, H. Cheng and L. Wang, Nat. Energy, 2020, 5, 79–88 CrossRef CAS.
- L. Wang, X. Zheng, L. Chen, Y. Xiong and H. Xu, Angew. Chem., Int. Ed., 2018, 57, 3454–3458 CrossRef CAS PubMed.
Footnote |
| † Electronic supplementary information (ESI) available. See DOI: 10.1039/d1sc05893b |
| This journal is © The Royal Society of Chemistry 2021 |