Optimizing the rate capability of nickel cobalt phosphide nanowires on graphene oxide by the outer/inter-component synergistic effects†
Chuan
Jing
a,
Xianyu
Song
 b,
Kailin
Li
a,
Yumeng
Zhang
c,
Xiaoying
Liu
 d,
Biqin
Dong
 e,
Fan
Dong
 f,
Shuangliang
Zhao
 b,
Hongchang
Yao
g and
Yuxin
Zhang
 *a
*a
aState Key Laboratory of Mechanical Transmissions, College of Materials Science and Engineering, Chongqing University, Chongqing 400044, P.R. China. E-mail: zhangyuxin@cqu.edu.cn
bShanghai Key Laboratory of Multiphase Materials Chemical Engineering, School of Chemical Engineering, East China University of Science and Technology, Shanghai 200237, P.R. China
cCollege of Art, Chongqing University, Chongqing 400044, P.R. China
dEngineering Research Center for Waste Oil Recovery Technology and Equipment of Ministry of Education, Chongqing Key Laboratory of Catalysis and New Environmental Materials, College of Environment and Resources, Chongqing Technology and Business University, Chongqing 400067, P.R. China
eGuangdong Provincial Key Laboratory of Durability for Marine Civil Engineering, Shenzhen University, Shenzhen 518060, P.R. China
fResearch Center for Environmental Science & Technology, Institute of Fundamental and Frontier Sciences, University of Electronic Science and Technology of China, Chengdu 611731, P.R. China
gCollege of Chemistry and Molecular Engineering, Zhengzhou University, Zhengzhou City, Henan Province, P.R. China
First published on 2nd December 2019
Abstract
Bimetallic phosphides have been identified as promising alternative electrode materials owing to their admirable conductivity and electrochemical activity. Nevertheless, the severe agglomeration of single-component bimetallic phosphides hinders their extensive applications. Moreover, current research lacks in-depth studies on the effect of outer/inter-component synergy on the rate capability. In this study, novel nickel cobalt phosphide nanowires on two-dimensional graphene oxide nanosheets (GO@NiCoP) were designed and prepared by combining a hydrothermal process and phosphorization. GO served as the conductive path to improve the composite conductivity and provided abundant oxygen-containing functional groups to coordinate with the metal cations of NiCoP, thereby boosting the overall structural stability. NiCoP possesses an optimal intercomponent synergistic effect, such as an optimal –OH− adsorption energy and deprotonation energy, leading to an enhanced potential of the electrochemical reaction. Taking advantage of these materials, the GO@NiCoP electrode displayed a high specific capacitance of 1125 F g−1 (155 mA h g−1) at 2 A g−1 and a high cycling stability of 104.88% capacitance retention after 5000 cycles at 30 A g−1. Interestingly, the GO@NiCoP electrode delivered an exceptional rate capability of 84.09% capacitance retention at 20 A g−1 and 39.77% capacitance retention at 60 A g−1 owing to its stable structure and excellent conductivity. In addition, we fabricated a GO@NiCoP//AG ASC device that delivered a desirable energy density of 27.71 W h kg−1 at 788 W kg−1. To broaden its applications, a self-charging power system with a satisfactory lighting time was constructed using the ASC device. In short, the outstanding electrochemical performance of the electrode materials provides a novel perspective for enhancing the rate capacity of electrode materials by the outer/inter-component synergistic effect.
Introduction
The constantly increasing energy needs along with the rapid depletion of fossil fuels motivates current researchers to design and develop reliable energy storage devices with outstanding performance and efficiency.1–5 Many energy storage devices, including lithium batteries,6–8 solar cells9 and supercapacitors,10 are designed and widely studied. Among them, supercapacitors have gained extensive attention due to their fast charge/discharge rate and impressive power output. However, the unsatisfactory energy densities of supercapacitors limits their application in the field of energy storage.11,12 The enhancement of the energy density of supercapacitors is the focus of current research on supercapacitor electrode materials. Essentially, the energy density can be boosted by extending the discharge time and/or increasing the potential window.To date, transition metal hydroxides/oxides, such as NiO,13 Co3O4,14,15 Ni(OH)2,16 Co(OH)2,17 and NiCo LDH,18 have been developed due to their ultralong discharge time and approximate potential window. However, the sluggish conductivity of metal hydroxides/oxides always prevents them from fully exhibiting an intrinsic specific capacitance. Recently, the conductivity of metal hydroxides/oxides can be improved by simple anion exchange to substitute the O/OH with C, N, S, P and Se, which can endow them with a smaller band gap and generate more active sites and therefore lead to an enhanced electrical conductivity and electrochemical performance.19 Currently, transition metal phosphides, such as Ni2P,20 CoP,21 and NiCoP,22 have received considerable attention due to their outstanding electrical conductivity and abundant reserves in nature; therefore, they become attractive potential electrode candidates for next-generation supercapacitors. In addition, in comparison with the monometallic phosphides, the bimetallic phosphides have abundant active sites and multiple redox states, which are more suitable for the occurrence of the electrochemical reaction.23 Hence, the construction of bimetallic phosphides is an effective strategy to enhance the specific capacitance.
Despite the merit of bimetallic phosphides, the single-component bimetallic phosphides tend to form aggregates, leading to a decrease in the specific surface area and active atoms, and therefore leads to a decreased specific capacitance. Moreover, currently, researchers only focus on the influence of the design and preparation of the active materials on the electrochemical performance and do not deeply discuss the effect of the material composition differences on the material structure, morphology and electrochemical properties. For these reasons, it is urgent to find and develop a novel strategy to solve the problems mentioned above. For the former, taking advantage of the large specific surface area, high conductivity and low weight, two-dimensional GO has received attention and is used as the substrate and conductive pathway for the growth of active electrode materials.24,25 Hence, the total inherent electron transfer resistance can be reduced by adjusting the contact interface between the active materials and GO, resulting in an enhanced electrochemical performance. Moreover, the oxygen-containing functional groups such as –OH and –COOH can coordinate with the transition metal cations, resulting in a desirable binding force to stabilize the as-grown active component. In terms of the latter, studies on outer/inter-component synergy for the improvement of electrochemical performance and corresponding rate capability and cycling stability are still rare. The preparation of bimetallic phosphides on graphene oxide achieved by controlling the proportion of metallic cations can provide us with a new perspective to study the impact of different components on the structure and performance.
In this study, the “outer/inter-component synergistic effect” was first reported by the rational design, fabrication and characterization of novel nickel cobalt phosphide nanowires on two-dimensional graphene oxide nanosheets. In our design, the appropriate Ni/Co molar ratio can reduce the electron transport resistance and control the crystal size and electron state, leading to an enhanced rate capability. The presence of the high electrical conductivity of GO can further enhance the rate capability by the reduction of the electron transfer resistance. To verify this hypothesis, XRD, XPS, SEM, TEM, Raman and BET analyses were carried out to examine the structural and physical/chemical properties of these samples. Electrochemical tests were performed to evaluate the electrochemical properties. DFT calculations were carried out to evaluate the role of phosphorization and the cationic molar ratio of Ni/Co on the electrochemical properties. As expected, taking advantage of the components, a high specific capacitance of 1125 F g−1 (155 mA h g−1) at 2 A g−1 and high cycling stability of 104.88% capacitance retention after 5000 cycles at 30 A g−1 of the as-prepared GO@NiCoP electrode material is achieved. In particular, an exceptional rate capability of 84.09% capacitance retention at 20 A g−1 and 39.77% capacitance retention at 60 A g−1 of the electrode material is achieved due to the excellent conductivity and stability. Furthermore, a maximum energy density of 27.71 W h kg−1 at 788 W kg−1 of the as-constructed GO@NiCoP//AG ASC device is realized. This work provides a new perspective for optimizing the rate capability of electrode materials and will be helpful for the subsequent material design and electrochemical performance control.
Results and discussion
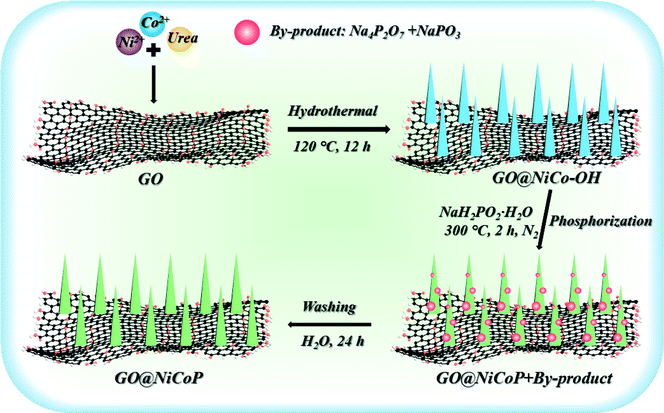
Scheme 1 exhibits the overall fabrication process of the GO@NiCoP. Typically, the arachnoid NiCo–OH nanowires are first grown on GO nanosheets uniformly by a facile hydrothermal process. Then, the phosphorization of the as-obtained GO@NiCo–OH is performed via the gas phase reaction to achieve the crystal transformation from hydroxide to phosphide. The obtained samples contain not only GO@NiCoP but also by-products (Na4P2P7 and NaPO3), which are held under a continuous flow of N2. To obtain the pure GO@NiCoP, the washing process is necessary. Hence, the as-obtained sample from the above process is added into H2O and then stirred for 24 h, following which the pure GO@NiCoP is obtained.The morphologies of the obtained GO@NiP, GO@Ni3Co1P, GO@NiCoP, GO@Ni1Co3P and GO@CoP were characterized by SEM at the microscale (Fig. 1). The GO@NiP and GO@Ni3Co1P only possessed the morphology of GO and not the NiP or Ni3Co1P nanowires. According to Fig. S1,† the Ni–OH and Ni3Co1–OH nanowires are so thin that it is hard to observe. After adjusting the Ni/Co ratio to 1, as shown in Fig. 1e, the NiCoP nanowires were found to be uniformly dispersed on the GO sheets, which is similar to the morphology before phosphorization (GO@NiCo–OH). In addition, the elements Ni, Co, P, C, and O were uniformly dispersed in the sample (Fig. 1f and g), indicating that the NiCoP nanowires uniformly grow on GO nanosheets. The mass percentages of Ni, Co, P, O and C are 3.70, 3.61, 2.82, 20.45 and 69.42 wt%, respectively. The Ni/Co mass ratio is close to 1, suggesting that the preparation process was successful. Moreover, as shown in Fig. 1c, the GO@Ni1Co3P displays a thicker nanowire on the GO nanosheets than GO@NiCoP due to the high atomic concentration of Co. When Ni is not added to the sample in the preparation process, the resulting GO@CoP sample shows a mixed morphology of nanowires and nanosheets. Hence, an appropriate amount of Co helps to form nanowires with uniform and complete morphology, whereas excessive Co results in the formation of nanowires and nanosheets. In summary, the uniformity of the nanowires of GO@NiCoP is the best when the Ni/Co molar ratio equals 1. In addition, to evaluate the effect of GO on the composite, the SEM image of NiCoP was collected, as shown in Fig. S1f.† The single component of NiCoP tends to form an aggregate of nanowires. Compared with GO@NiCoP, the exposed specific surface area and active atoms of NiCoP are decreased. Hence, GO can readily solve the agglomeration problem of the NiCoP nanowires. To characterize and analyse the morphologies and lattice of the as-prepared samples on the nanoscale, TEM images were acquired, as shown in Fig. 2. In terms of the overall morphology, phosphorization destroys the uniformity of the nanowires, and the obtained phosphides aggregate in some positions of the nanowires, forming a hyacinth-like morphology. Similarly, the TEM images exhibit the important role of the Ni/Co molar ratio for the formation of the nanowires. For example, very weak and incomplete nanowires are found on the GO nanosheets in the GO@NiP. The nanosheet-like small spheres are the aggregates of NiP nanocrystallites. After changing the Ni/Co molar ratio to 3![[thin space (1/6-em)]](https://www.rsc.org/images/entities/char_2009.gif) :
:![[thin space (1/6-em)]](https://www.rsc.org/images/entities/char_2009.gif) 1, 1
1, 1![[thin space (1/6-em)]](https://www.rsc.org/images/entities/char_2009.gif) :
:![[thin space (1/6-em)]](https://www.rsc.org/images/entities/char_2009.gif) 1 or 1
1 or 1![[thin space (1/6-em)]](https://www.rsc.org/images/entities/char_2009.gif) :
:![[thin space (1/6-em)]](https://www.rsc.org/images/entities/char_2009.gif) 3, the nanowires are found clearly. However, after changing the Ni/Co molar ratio to 0
3, the nanowires are found clearly. However, after changing the Ni/Co molar ratio to 0![[thin space (1/6-em)]](https://www.rsc.org/images/entities/char_2009.gif) :
:![[thin space (1/6-em)]](https://www.rsc.org/images/entities/char_2009.gif) 4, amorphous nanosheets and nanowires are found on the GO nanosheets in the GO@CoP sample. The results are consistent with the SEM images, which suggests that the Ni/Co molar ratio plays a crucial role in the morphology control. In general, GO@NiCoP has uniform nanowires with an approximate thinness (∼20 nm), which will provide an advantage for the subsequent electrochemical energy storage. In addition, the spacing of 0.2212 nm agrees with the (100) lattice fringes of the hexagonal NiCoP (JCPDS card no. 71-2336) (Fig. 2e). The typical elements of Ni, Co, P, O and C are homogeneously dispersed in the composite, suggesting that the preparation process is feasible.
4, amorphous nanosheets and nanowires are found on the GO nanosheets in the GO@CoP sample. The results are consistent with the SEM images, which suggests that the Ni/Co molar ratio plays a crucial role in the morphology control. In general, GO@NiCoP has uniform nanowires with an approximate thinness (∼20 nm), which will provide an advantage for the subsequent electrochemical energy storage. In addition, the spacing of 0.2212 nm agrees with the (100) lattice fringes of the hexagonal NiCoP (JCPDS card no. 71-2336) (Fig. 2e). The typical elements of Ni, Co, P, O and C are homogeneously dispersed in the composite, suggesting that the preparation process is feasible.
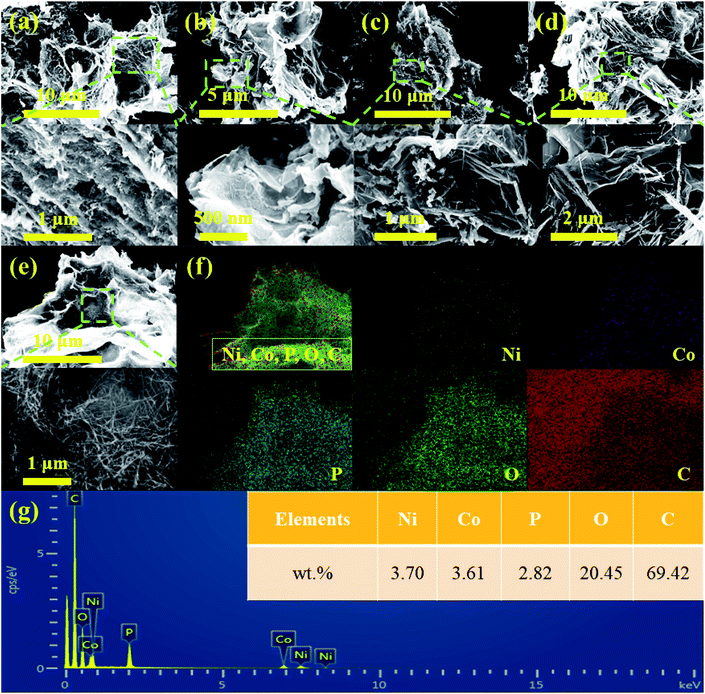 | ||
| Fig. 1 The SEM images of (a) GO@NiP, (b) GO@Ni3Co1P, (c) GO@Ni1Co3P, (d) GO@CoP, (e) GO@NiCoP, (f) the elemental distribution sum spectra and (g) the corresponding EDS mapping of GO@NiCoP. | ||
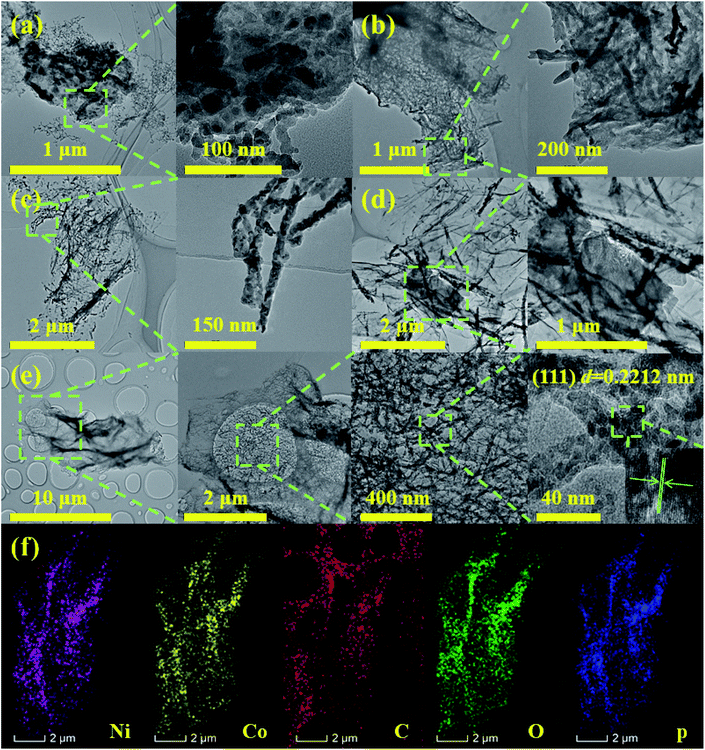 | ||
| Fig. 2 The TEM images of (a) GO@NiP, (b) GO@Ni3Co1P, (c) GO@Ni1Co3P, (d) GO@CoP, (e) GO@NiCoP, (f) the elemental distribution sum spectra. | ||
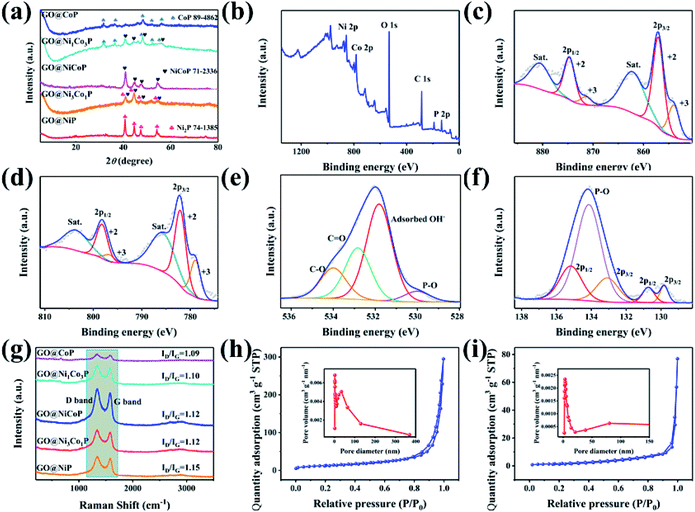
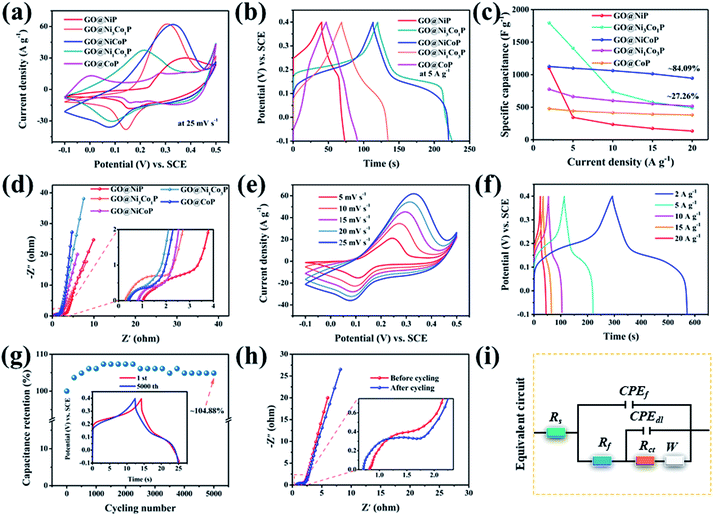
The XRD pattern of GO@NiP (Fig. 3a) exhibits four characteristic peaks at 40.72°, 44.68°, 47.40° and 54.19°, which are assigned to the (111), (201), (210) and (300) planes of hexagonal Ni2P (JCPDS card no. 74-1385), respectively. Similarly, the XRD pattern of GO@NiCoP displays four characteristic peaks at 40.96°, 44.78°, 47.40° and 54.16°, which are assigned to hexagonal NiCoP (JCPDS card no. 71-2336), respectively. The XRD pattern of NiCoP (Fig. S2†) exhibits similar peaks to the GO@NiCoP. This result suggests that the crystal phase of NiCoP may have no change after it combines with GO. In addition, the XRD pattern of GO@CoP exhibits five characteristic peaks at 31.66°, 36.40°, 48.29°, 52.07° and 56.37°, which are assigned to the (011), (102), (211), (103) and (212) planes (JCPDS card no. 89-4862), respectively. The characteristic peaks of the XRD pattern of GO@Ni3Co1P are consistent with the overlapping peaks of the crystalline phases of NiCoP and Ni2P. Similarly, the characteristic peaks of the XRD pattern of GO@Ni1Co3P are consistent with the overlapping peaks of the crystalline phases of NiCoP and CoP. The XPS survey of the GO@NiCoP (Fig. 3b) displays six peaks at around 856.90, 782.00, 532.12, 400.03, 285.20 and 134.00 eV, which are attributed to the Ni 2p, Co 2p, O 1s, N 1s, C 1s and P 2p, respectively, and the corresponding atomic concentrations of Ni, Co, O, C and P are 4.74, 4.72, 35.07, 45.93 and 9.55 at%, respectively. The atomic concentration ratio of Ni/Co is close to 1 and the atomic concentration of Ni and Co is close to P, indicating that the sample of NiCoP was synthesized on the GO nanosheets successfully. The Ni 2p spectrum possesses an obvious spin–orbital splitting of Ni 2p3/2 and 2p1/2 lines and a pair of satellite peaks (Sat.). The peaks at 853.96 and 871.40 eV can be attributed to the Ni3+, whereas the peaks at 857.05 and 874.67 eV can be attributed to the Ni2+.26 The peaks at 862.07 and 880.48 eV can be attributed to the Sat. peak. Similarly, the Co 2p spectrum possesses an obvious spin–orbital splitting of Co 2p3/2 and 2p1/2 lines and a pair of Satellite peak (Sat.). The peaks at 779.00 and 797 eV can be attributed to the Co3+, whereas the peaks at 782.20 and 798.30 eV can be attributed to the Co2+. The peaks at 786.00 and 803.9 eV can be assigned to the Sat. peak. The O 1s spectrum has four fitting peaks. The main peaks at 531.81, 532.83 and 533.99 eV can be indexed to the adsorbed OH− from water, C![[double bond, length as m-dash]](https://www.rsc.org/images/entities/char_e001.gif) O and C–O from GO nanosheets, respectively. The weak peak at 529.95 eV can be assigned to the P–O bond from the by-product. The P 2p spectrum contains three types of peaks, such as P 2p2/3, P 2p2/1 and P–O peaks. The peaks at 129.82 and 133.08 eV can be attributed to the P 2p3/2, whereas the peaks at 130.73 and 135.18 eV can be indexed to the 2p1/2, and the peak at 134.14 eV can be attributed to the P–O bond from the by-product. The peak at 129.82 eV can be attributed to metal–P (Ni–P/Co–P) bonds in the NiCoP component. The fit peak at 133.08 eV can be ascribed to the reduced P species (Pδ−).27 Raman spectra of the as-prepared samples are shown in Fig. 3i, where the G band at around 1342 cm−1 is attributed to the structural defects, and the G band at around 1576 cm−1 is attributed to the graphitic structures of the carbon atoms.28 The relative intensity ratios of the D band and G band (ID/IG) of GO@NiP, GO@Ni3Co1P, GO@NiCoP, GO@Ni1Co3P and GO@CoP are 1.15, 1.12, 1.12, 1.10 and 1.09. With an appropriate degree of graphitization and appropriate defects, the GO@NiCoP possesses the proper conductivity to promote the occurrence of an electrochemical reaction and proper oxygen-containing content to increase the structural stability, leading to the optimal electrochemical application potential. In addition, the BET specific surface areas of GO@NiCoP and NiCoP (Fig. 3h and i) are 45.87 and 5.69 m2 g−1, respectively. The pore volumes of GO@NiCoP and NiCoP are 0.4559 and 0.1190 cm3 g−1, respectively. The GO@NiCoP possesses an optimal BET specific surface area and pore volume, indicating that the GO plays an important role in the growth of NiCoP nanowires. The GO provides a large specific surface area and abundant binding sites for the NiCoP, which not only prevents agglomeration of the single component NiCoP, but also promotes the occurrence of electrochemical reactions. Namely, the possibility of occurrence of the electrochemical reaction is increased by GO@NiCoP. Fig. 4a and b shows the CV and CC curves of the as-obtained composites. The CV curves of the GO@NiP, GO@Ni3Co1P, GO@NiCoP and GO@Ni1Co3P present the obvious redox peaks, respectively. Similarly, the CC curves of the GO@NiP, GO@Ni3Co1P, GO@NiCoP and GO@Ni1Co3P present a subtriangular shape with an obvious charging/discharging plateau. This phenomenon indicates that the four electrode materials display a battery-type charge storage mechanism. However, the shape of the CV curve of GO@CoP display a quasi-rectangle morphology without a redox peak and the CC curves of GO@CoP display a quasi-triangle shape without a platform. The phenomenon should be ascribed to the agglomeration problem of Co–OH, which leads to the change of charge storage mechanism from battery-type to pseudocapacitance-type. From Fig. 4c, GO@NiCoP has a satisfactory specific capacitance and excellent rate capability, which is very suitable for the selection of electrode materials. In addition, GO@NiP (12.16%) and GO@Ni3Co1P (27.26%) present an unsatisfactory rate capability. From Fig. S3a,† the GO@NiP presents a discharging platform at around −0.05 V at 1 A g−1. However, the platform disappears when the current density reaches 5 A g−1. The phenomenon should be ascribed to the IR drop, which leads to the platform appearing out of the test range. Accordingly, the presence of NiP in GO@Ni3Co1P leads to the sharp decrease of the specific capacitance, which limits the application of GO@Ni3Co1P in devices that require high current density. The GO@NiCoP (Fig. S1c†) have a high rate capability of 84.09% capacitance retention at 20 A g−1 and even 39.77% capacitance retention at 60 A g−1. The rate capability of NiCoP at 20 A g−1 (Fig. S4†) is about 48.00%, which is lower than that of GO@NiCoP, indicating the important role of GO. The equivalent circuit diagram of (R(Q(R(Q(RW))))) is used to fit the obtained Nyquist plots (Fig. 4d).29,30 The Rct values of GO@NiP, GO@Ni3Co1P, GO@NiCoP, GO@Ni1Co3P and GO@CoP are 2.763, 1.747, 1.350, 1.355, 1.369 Ω. The GO@NiCoP possesses the lowest Rct value in these samples, which means that the GO@NiCoP has the best potential for electrochemical reactions. In particular, the Rct value of NiCoP is 1.399 Ω, which is lower than that of GO@NiCoP, indicating that GO play an important role in improving the electrical conductivity in the electrochemical process. Hence, GO@NiCoP was selected as the electrode material for the subsequent tests. Fig. 4e presents the CV curves of the GO@NiCoP electrode. The peak current density increases with the increase of the scan rate without changes in shape, indicating that the material exhibits superior electrochemical stability.31 The energy storage is ascribed to the single component NiCoP. According to a previous report, the distinct redox peaks should be ascribed to the MP/MPOH and MPOH/MPO (M means metal). The corresponding equations are shown as follows:19
O and C–O from GO nanosheets, respectively. The weak peak at 529.95 eV can be assigned to the P–O bond from the by-product. The P 2p spectrum contains three types of peaks, such as P 2p2/3, P 2p2/1 and P–O peaks. The peaks at 129.82 and 133.08 eV can be attributed to the P 2p3/2, whereas the peaks at 130.73 and 135.18 eV can be indexed to the 2p1/2, and the peak at 134.14 eV can be attributed to the P–O bond from the by-product. The peak at 129.82 eV can be attributed to metal–P (Ni–P/Co–P) bonds in the NiCoP component. The fit peak at 133.08 eV can be ascribed to the reduced P species (Pδ−).27 Raman spectra of the as-prepared samples are shown in Fig. 3i, where the G band at around 1342 cm−1 is attributed to the structural defects, and the G band at around 1576 cm−1 is attributed to the graphitic structures of the carbon atoms.28 The relative intensity ratios of the D band and G band (ID/IG) of GO@NiP, GO@Ni3Co1P, GO@NiCoP, GO@Ni1Co3P and GO@CoP are 1.15, 1.12, 1.12, 1.10 and 1.09. With an appropriate degree of graphitization and appropriate defects, the GO@NiCoP possesses the proper conductivity to promote the occurrence of an electrochemical reaction and proper oxygen-containing content to increase the structural stability, leading to the optimal electrochemical application potential. In addition, the BET specific surface areas of GO@NiCoP and NiCoP (Fig. 3h and i) are 45.87 and 5.69 m2 g−1, respectively. The pore volumes of GO@NiCoP and NiCoP are 0.4559 and 0.1190 cm3 g−1, respectively. The GO@NiCoP possesses an optimal BET specific surface area and pore volume, indicating that the GO plays an important role in the growth of NiCoP nanowires. The GO provides a large specific surface area and abundant binding sites for the NiCoP, which not only prevents agglomeration of the single component NiCoP, but also promotes the occurrence of electrochemical reactions. Namely, the possibility of occurrence of the electrochemical reaction is increased by GO@NiCoP. Fig. 4a and b shows the CV and CC curves of the as-obtained composites. The CV curves of the GO@NiP, GO@Ni3Co1P, GO@NiCoP and GO@Ni1Co3P present the obvious redox peaks, respectively. Similarly, the CC curves of the GO@NiP, GO@Ni3Co1P, GO@NiCoP and GO@Ni1Co3P present a subtriangular shape with an obvious charging/discharging plateau. This phenomenon indicates that the four electrode materials display a battery-type charge storage mechanism. However, the shape of the CV curve of GO@CoP display a quasi-rectangle morphology without a redox peak and the CC curves of GO@CoP display a quasi-triangle shape without a platform. The phenomenon should be ascribed to the agglomeration problem of Co–OH, which leads to the change of charge storage mechanism from battery-type to pseudocapacitance-type. From Fig. 4c, GO@NiCoP has a satisfactory specific capacitance and excellent rate capability, which is very suitable for the selection of electrode materials. In addition, GO@NiP (12.16%) and GO@Ni3Co1P (27.26%) present an unsatisfactory rate capability. From Fig. S3a,† the GO@NiP presents a discharging platform at around −0.05 V at 1 A g−1. However, the platform disappears when the current density reaches 5 A g−1. The phenomenon should be ascribed to the IR drop, which leads to the platform appearing out of the test range. Accordingly, the presence of NiP in GO@Ni3Co1P leads to the sharp decrease of the specific capacitance, which limits the application of GO@Ni3Co1P in devices that require high current density. The GO@NiCoP (Fig. S1c†) have a high rate capability of 84.09% capacitance retention at 20 A g−1 and even 39.77% capacitance retention at 60 A g−1. The rate capability of NiCoP at 20 A g−1 (Fig. S4†) is about 48.00%, which is lower than that of GO@NiCoP, indicating the important role of GO. The equivalent circuit diagram of (R(Q(R(Q(RW))))) is used to fit the obtained Nyquist plots (Fig. 4d).29,30 The Rct values of GO@NiP, GO@Ni3Co1P, GO@NiCoP, GO@Ni1Co3P and GO@CoP are 2.763, 1.747, 1.350, 1.355, 1.369 Ω. The GO@NiCoP possesses the lowest Rct value in these samples, which means that the GO@NiCoP has the best potential for electrochemical reactions. In particular, the Rct value of NiCoP is 1.399 Ω, which is lower than that of GO@NiCoP, indicating that GO play an important role in improving the electrical conductivity in the electrochemical process. Hence, GO@NiCoP was selected as the electrode material for the subsequent tests. Fig. 4e presents the CV curves of the GO@NiCoP electrode. The peak current density increases with the increase of the scan rate without changes in shape, indicating that the material exhibits superior electrochemical stability.31 The energy storage is ascribed to the single component NiCoP. According to a previous report, the distinct redox peaks should be ascribed to the MP/MPOH and MPOH/MPO (M means metal). The corresponding equations are shown as follows:19
| NiCoP + OH− ↔ NiCoPOH + e− | (1) |
| NiCoPOH + OH− ↔ NiCoPO + H2O + e− | (2) |
From the CC curves of the GO@NiCoP electrode (Fig. 4f), the calculated specific capacitances at 2, 5, 10, 15 and 20 A g−1 are about 1125, 1099, 1061, 1013 and 946 F g−1, and the calculated specific capacities at 2, 5, 10, 15 and 20 A g−1 are about 155, 148, 139, 129, 117 mA h g−1, respectively. Even when the current density is increased to 60 A g−1, the electrode still exhibits a desirable performance of 448 F g−1 (44 mA h g−1). Fig. 4g presents the plots of capacitance retention versus cycling number. After 5000 cycles at a high current density of 30 A g−1, the GO@NiCoP electrode achieves a 104.88% capacitance retention. Besides, the morphology of the CC curves exhibits almost no change and the Rct value slightly decreases from 1.350 to 1.248 Ω, which is consistent with the increased specific capacitance after 5000 cycles, indicating that the material possesses excellent application potential.
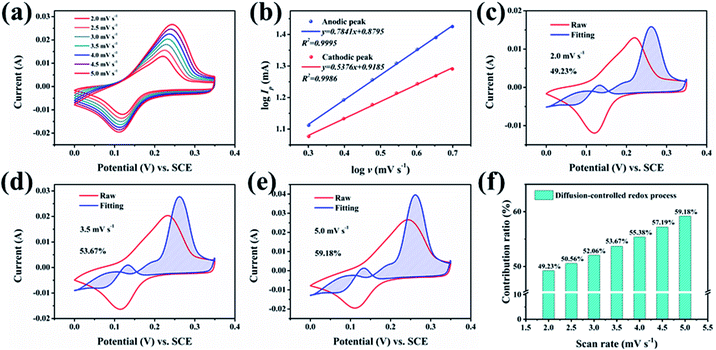
To explore and analyse the electrochemical behaviour of the GO@NiCoP electrode, the CV curves at low scan rates were acquired, as shown in Fig. 5a. To avoid the influence of polarization on the analysis of the CV curves, the potential window was set to 0.35 V. The peak current (Ip, A) and scan rate (ν, mV s−1) obey the formula as follows:32
log![[thin space (1/6-em)]](https://www.rsc.org/images/entities/char_2009.gif) Ip = b Ip = b![[thin space (1/6-em)]](https://www.rsc.org/images/entities/char_2009.gif) log log![[thin space (1/6-em)]](https://www.rsc.org/images/entities/char_2009.gif) ν + log ν + log![[thin space (1/6-em)]](https://www.rsc.org/images/entities/char_2009.gif) a a | (3) |
| I/ν0.5 = k1v0.5 + k2 | (4) |
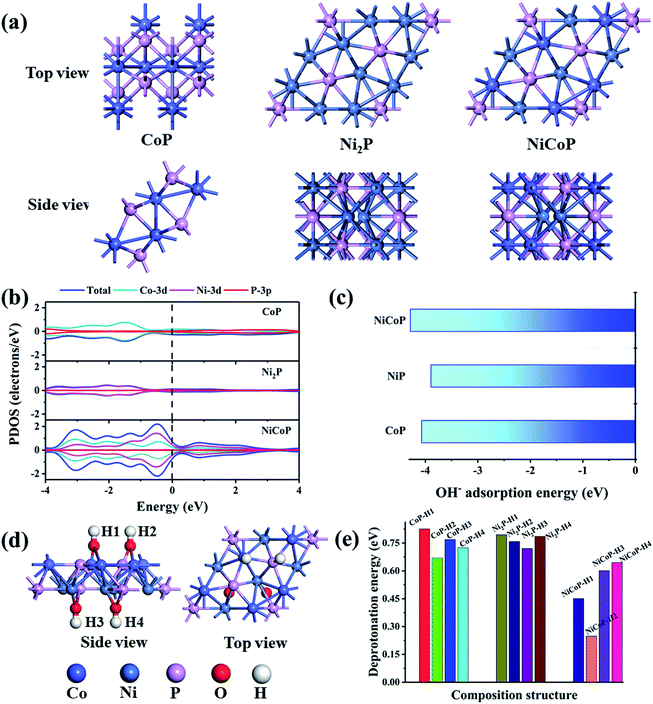
To further explore the electrochemical mechanism of nickel and/or cobalt phosphide in the charge/discharge process, density functional theory computations were carried out. Three models were constructed and optimized, as shown in Fig. 6a. The calculated results of the PDOS of Ni2P, NiCoP and CoP are shown in Fig. 6b. The charge density of NiCoP around the Fermi energy is significantly higher than single component Ni2P and CoP. The phenomenon should be ascribed to the intercomponent synergistic effect of the Ni and Co species. The synergistic effect of the outer-orbit of Ni and Co species increases the electron cloud density around the Fermi level, thereby increasing the redox reaction possibility of the active components. The high electron cloud density leads to an enhanced electronic conductivity, which also promotes the occurrence of electrochemical reaction. According to the previous reports, the electrochemical reaction of transition metal phosphides in the KOH system is related to the OH– adsorption on the transition metal phosphide and the deprotonation of adsorbed OH−.34 The adsorption mechanism of NiCoP is referred to in eqn (1) and (2) and the adsorption mechanism of NiP and CoP are shown as follows:
| Ni2P + OH− ↔ Ni2POH + e− | (5) |
| Ni2POH + OH ↔ Ni2PO + e− | (6) |
| Co2P + OH− ↔ Co2POH + e− | (7) |
| Co2POH + OH ↔ Co2PO + e− | (8) |
The computation results (Fig. 6c) suggest that the OH- adsorption energies of NiCoP, Ni2P and CoP are −4.28, −3.89 and −4.07 eV, respectively, indicating that the NiCoP possesses the most favoured OH− adsorption. The rate-controlling step of the redox reaction of an electrode material in a supercapacitor is the OH− deprotonation process.35 According to the computation, there are four OH groups on the transition metal phosphide after OH− adsorbs. The typical model of NiCoPOH is shown in Fig. 6d. Hence, four H protons can be desorbed. The deprotonation energies of NiCoP–H1, NiCoP–H2, NiCoP–H3 and NiCoP–H4 are 0.4510, 0.2485, 0.6010 and 0.6448 eV, respectively, which is much lower than that of Ni2POH and CoPOH. Hence, it is thermodynamically advantageous for NiCoP to undergo electrochemical reactions based on the simulated results of OH− adsorption energy and deprotonation energy. To summarize, the electrochemical properties of bimetallic phosphides are better than that of mono-metallic phosphides under this system. Taking into account the presence of Ni2P and CoP in GO@Ni3Co1P and GO@Ni1Co3P, the simulation results can also explain that the corresponding rate capability of the above two samples is lower than GO@NiCoP.
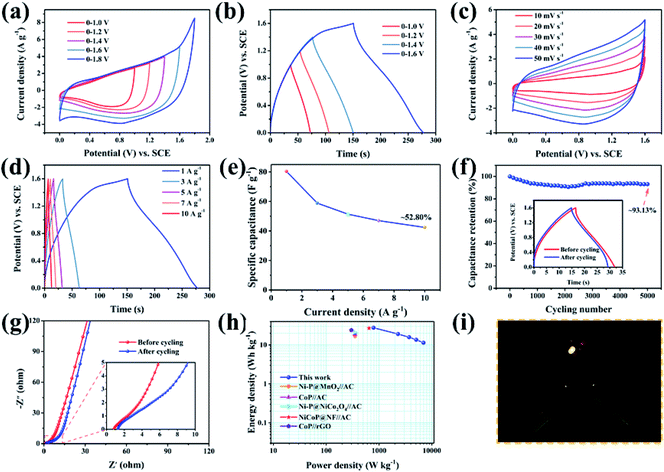
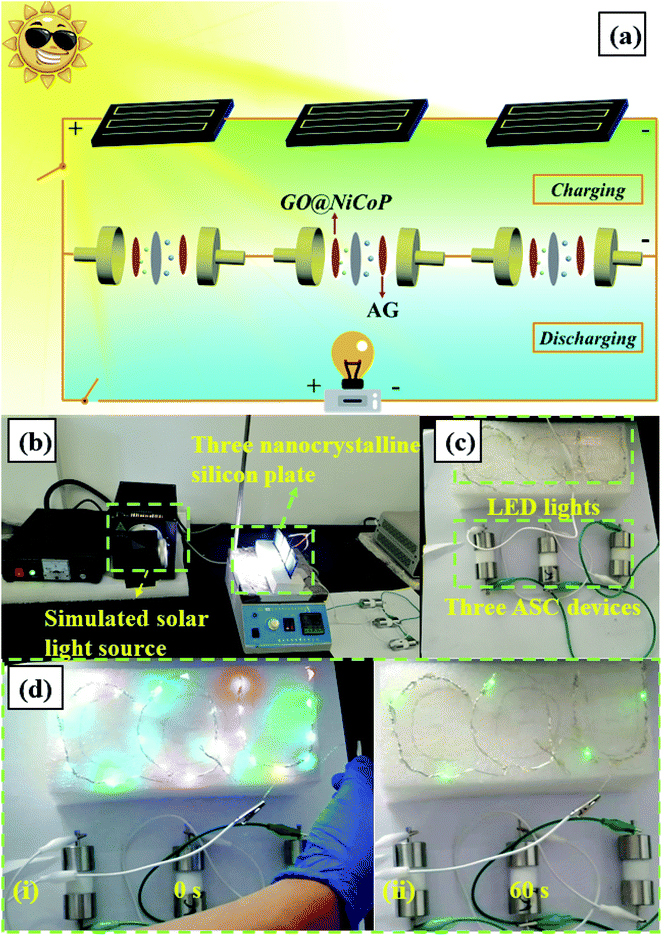
Fig. 7a and b present the CV and CC curves of an ASC device (GO@NiCoP//AG) at different potential window, respectively. The CV curves display a quasi-rectangle shape and the CC curves display a quasi-triangle shape. When the potential window increases to 1.6 V, an obvious charge platform in the CC curves can be found, indicating that the charging voltage reached its upper limit. When the voltage continued to rise to 1.8 V, an obvious polarization appeared in the CV curve. Hence, 1.6 V was selected as the potential window. With the increase of scan rates, the CV curves of the ASC device (Fig. 7c) at 1.6 V maintain the quasi-rectangle shape without any change, indicating that the device has outstanding stability. The calculated specific capacitances from the CC curves (Fig. 7d) at 1, 3, 5, 7 and 10 A g−1 are about 80.33, 58.86, 51.38, 46.99 and 42.42 F g−1, respectively. The remaining capacitance at 10 A g−1 is 52.80%. According to the analysis of the three-electrodes, the rate capability of the two-electrodes is mainly affected by the negative electrode material (AG). Finding a novel negative material with a preferable rate capability is an effective strategy to optimize the rate capability of this ASC device. The ASC device displays about 93.13% capacitance retention after 5000 cycles and the Rct value slightly increases from 3.889 to 8.049 Ω, indicating that the device possesses outstanding cycling stability, as shown in Fig. 7f. Compared with the three-electrode system, the cycling stability slightly decreases due to the influence of the negative electrode material of the AG. The ASC device (Fig. 7h) delivered a desirable energy density of 27.71 W h kg−1 at 800 W kg−1 and 11.40 W h kg−1 at 6955 W kg−1, respectively, which is higher than that of the previous reported nickel/cobalt phosphides, such as Ni–P@MnO2//activated carbon (AC) (17 W h kg−1 at 350 W kg−1),36 CoP//AC (19 W h kg−1 at 350 W kg−1),37 Ni–P@NiCo2O4//AC (21 W h kg−1 at 350 W kg−1),38 NiCoP@NF//AC (27 W h kg−1 at 647 W kg−1),39 and CoP//rGO (24 W h kg−1 at 300 W kg−1).40 In addition, an LED indicator was lit by two ASC devices in series (Fig. 6i), suggesting that it has superior viability and potentiality in practical applications. Furthermore, to extend the application range of the fabricated ASC device, a solar-charging power system was assembled and characterized. As shown in Fig. 8, the system contains a simulated solar source, three nanocrystalline silicon plates, three GO@NiCoP//AG ASC devices and 25 colorized LED lights spelling “CQU”. After charging for 20 s by the solar light source, the LED lights can be lit and maintained for 60 s. The fabricated system provides a case reference for the technology breakthrough of supercapacitors in industrial or civil applications.
Note that the outstanding rate capability with satisfactory specific capacitance and cycling stability of the as-prepared GO@NiCoP can be ascribed to the following: (1) the advantage of GO. First, the GO provides a large specific surface area for the growth of NiCoP nanowires to limit agglomeration. Second, the O atoms in the oxygen-containing functional groups have a pair of lone pair electrons which can coordinate with the atoms of Ni and Co to increase the bonding force, increasing the structural stability of the electrode material, thereby leading to an enhanced cycling stability. Third, the graphene oxide is an excellent conductive substrate, which can boost the conductivity of the NiCoP nanowires and accelerate the occurrence of electrochemical reactions. (2) The intercomponent synergistic effect. The appropriate Ni/Co molar ratio can reduce the electron transport resistance and control the crystal growth and size. Hence, more active atoms can participate in the electrochemical reaction at a high current density, enhancing the rate capability. (3) The advantage of design strategy. Growing one-dimensional nanoscale thickness NiCoP nanowires (∼20 nm) on the two-dimensional ultrathin GO with good electrical conductivity can greatly shorten the ion/electron diffusion paths, which favours fast redox reactions. (4) The advantage of the phosphorization. Compared with transition-metal oxides/hydroxides, transition metal phosphides have outstanding conductivity, which makes them exhibit an appealing electrochemical potential.41 Finally, the enhanced rate capability is due to the outer/inter-component synergistic effect of the GO@NiCoP.
Conclusions
In summary, nickel cobalt phosphide nanowires on graphene oxide were synthesized via a hydrothermal process and subsequent phosphorization. The NiCoP nanowires were homogeneously dispersed on the graphene oxide without any agglomeration. Owing to the outer/inter-component synergistic effect, the as-prepared GO@NiCoP electrode materials exhibited a high specific capacitance of 1125 F g−1 (155 mA h g−1) at 2 A g−1, high rate capability of 39.77% capacitance retention at 60 A g−1 and a high cycling stability of 104.88% capacitance retention after 5000 cycles at 30 A g−1. In addition, the constructed GO@NiCoP//AG ASC device achieved an optimal energy density of 27.71 W h kg−1 at 788 W kg−1 and 11.40 W h kg−1 at 6955 W kg−1, and a desirable cycling stability of 93.13% capacitance retention after 5000 cycles. The outstanding electrochemical performance confirms that the matched component (Ni/Co = 1![[thin space (1/6-em)]](https://www.rsc.org/images/entities/char_2009.gif) :
:![[thin space (1/6-em)]](https://www.rsc.org/images/entities/char_2009.gif) 1) is favorable for the growth of nanocrystalline structures and promotes the electron migration rate, leading to the enhanced rate capability and cycling stability. This study provides a new perspective for the study of improving the rate capability of electrode materials by the outer/inter-component effect and will help for the subsequent design, preparation and modification of electrode materials.
1) is favorable for the growth of nanocrystalline structures and promotes the electron migration rate, leading to the enhanced rate capability and cycling stability. This study provides a new perspective for the study of improving the rate capability of electrode materials by the outer/inter-component effect and will help for the subsequent design, preparation and modification of electrode materials.
Conflicts of interest
There are no conflicts to declare.Acknowledgements
The authors gratefully acknowledge the financial support provided by the Graduate Research and innovation of Chongqing, China (Grant No. CYB18002), the National Natural Science Foundation of China (Grant No. 21576034 and 51908092), the State Education Ministry and Fundamental Research Funds for the Central Universities (2019CDQYCL042, 2019CDXYCL0031, 106112017CDJXSYY0001, 2018CDYJSY0055, 106112017CDJQJ138802, 106112017CDJSK04XK11, and 2018CDQYCL0027), the Joint Funds of the National Natural Science Foundation of China-Guangdong (Grant No. U1801254). The authors thank the Electron Microscopy Center, Analytical and Testing Center of Chongqing University for materials characterizations. The authors thank the Hitech water purification system for instrument support.References
- H. Tan, Z. Liu, D. Chao, P. Hao, D. Jia, Y. Sang, H. Liu and H. J. Fan, Adv. Energy Mater., 2018, 8, 1800685 CrossRef.
- W. Lu, J. Shen, P. Zhang, Y. Zhong, Y. Hu and X. W. Lou, Angew. Chem., Int. Ed., 2019, 58, 15441–15447 CrossRef CAS PubMed.
- J. Nai and X. W. D. Lou, Adv. Mater., 2019, 31, 1706825 CrossRef PubMed.
- W. Zhou, J. Dong, X. F. Lu and X. D. Lou, Energy Environ. Sci., 2019, 12, 3348–3355 RSC.
- C. Zeng, W. Weng, T. Lv and W. Xiao, ACS Appl. Mater. Interfaces, 2018, 10, 30470–30478 CrossRef CAS PubMed.
- B. Liu, J.-G. Zhang and W. Xu, Joule, 2018, 2, 833–845 CrossRef CAS.
- X. Chen, Y. Li, L. Wang, Y. Xu, A. Nie, Q. Li, F. Wu, W. Sun, X. Zhang and R. Vajtai, Adv. Mater., 2019, 1901640 CrossRef PubMed.
- X. Chen, Y. Xu, F. H. Du and Y. Wang, Small Methods, 2019, 3, 1900338 CrossRef CAS.
- J. Hou, O. Inganäs, R. H. Friend and F. Gao, Nat. Mater., 2018, 17, 119 CrossRef CAS PubMed.
- Q. Jiang, N. Kurra, M. Alhabeb, Y. Gogotsi and H. N. Alshareef, Adv. Energy Mater., 2018, 8, 1703043 CrossRef.
- D. P. Dubal, N. R. Chodankar, D.-H. Kim and P. Gomez-Romero, Chem. Soc. Rev., 2018, 47, 2065–2129 RSC.
- S. Zheng, H. Xue and H. Pang, Coord. Chem. Rev., 2018, 373, 2–21 CrossRef CAS.
- P. Giannakou, M. G. Masteghin, R. C. Slade, S. Hinder and M. Shkunov, J. Mater. Chem. A, 2019, 7, 21496 RSC.
- T. Liu, L. Zhang, W. You and J. Yu, Small, 2018, 14, 1702407 CrossRef PubMed.
- X. J. Yin, C. W. Zhi, W. W. Sun, L. P. Lv and Y. Wang, J. Mater. Chem. A, 2019, 7, 7800–7814 RSC.
- M. Liang, M. Zhao, H. Wang, J. Shen and X. Song, J. Mater. Chem. A, 2018, 6, 2482–2493 RSC.
- T. Deng, Y. Lu, W. Zhang, M. Sui, X. Shi, D. Wang and W. Zheng, Adv. Energy Mater., 2018, 8, 1702294 CrossRef.
- H. Liang, J. Lin, H. Jia, S. Chen, J. Qi, J. Cao, T. Lin, W. Fei and J. Feng, J. Power Sources, 2018, 378, 248–254 CrossRef CAS.
- W. Song, J. Wu, G. Wang, S. Tang, G. Chen, M. Cui and X. Meng, Adv. Funct. Mater., 2018, 28, 1804620 CrossRef.
- H. Jia, Q. Li, C. Li, Y. Song, H. Zheng, J. Zhao, W. Zhang, X. Liu, Z. Liu and Y. Liu, Chem. Eng. J., 2018, 354, 254–260 CrossRef CAS.
- J. Zhu, X. P. Shen, L. Kong, G. Zhu, Z. Y. Ji, K. Q. Xu, B.-L. Li, H. Zhou and X. Yue, Dalton Trans., 2019, 48, 10661–10668 RSC.
- X. Zhang, A. Wu, X. Wang, C. Tian, R. An and H. Fu, J. Mater. Chem. A, 2018, 6, 17905–17914 RSC.
- Y. X. Chen, C. Jing, X. Zhang, D. B. Jiang, X. Y. Liu, B. Q. Dong, L. Feng, S. C. Li and Y. X. Zhang, J. Colloid Interface Sci., 2019, 548, 100–109 CrossRef CAS PubMed.
- A. T. Smith, A. M. LaChance, S. Zeng, B. Liu and L. Sun, Nano Materials Science, 2019, 1, 31–47 CrossRef.
- S. E. Lowe, G. Shi, Y. Zhang, J. Qin, L. Jiang, S. Jiang, M. Al-Mamun, P. Liu, Y. L. Zhong and H. Zhao, Nano Materials Science, 2019, 1, 215–223 CrossRef.
- X. X. Liang, W. Weng, D. Gu and W. Xiao, J. Mater. Chem. A, 2019, 7, 10514–10522 RSC.
- X. Wang, R. Tong, Y. Wang, H. Tao, Z. Zhang and H. Wang, ACS Appl. Mater. Interfaces, 2016, 8, 34270–34279 CrossRef CAS PubMed.
- R. Wang, Q. Zhao, W. Zheng, Z. Ren, X. Hu, J. Li, L. Lu, N. Hu, J. Molenda and X. Liu, J. Mater. Chem. A, 2019, 7, 19909–19921 RSC.
- C. Jing, X. Liu, X. Liu, D. Jiang, B. Dong, F. Dong, J. Wang, N. Li, T. Lan and Y. Zhang, CrystEngComm, 2018, 20, 7428–7434 RSC.
- C. Jing, Y. Huang, L. Xia, Y. Chen, X. Wang, X. Liu, B. Dong, F. Dong, S. Li and Y. Zhang, Appl. Surf. Sci., 2019, 496, 143700 CrossRef CAS.
- Z. Chen, B. Deng, K. Du, X. Mao, H. Zhu, W. Xiao and D. Wang, Adv. Sustainable Syst., 2017, 1, 1700047 CrossRef.
- W. Lu, Z. Yuan, C. Xu, J. Ning, Y. Zhong, Z. Zhang and Y. Hu, J. Mater. Chem. A, 2019, 7, 5333–5343 RSC.
- H.-S. Kim, J. B. Cook, H. Lin, J. S. Ko, S. H. Tolbert, V. Ozolins and B. Dunn, Nat. Mater., 2017, 16, 454 CrossRef CAS PubMed.
- S. Liu, K. V. Sankar, A. Kundu, M. Ma, J.-Y. Kwon and S. C. Jun, ACS Appl. Mater. Interfaces, 2017, 9, 21829–21838 CrossRef CAS PubMed.
- B. G. Choi, M. Yang, S. C. Jung, K. G. Lee, J.-G. Kim, H. Park, T. J. Park, S. B. Lee, Y.-K. Han and Y. S. Huh, ACS Nano, 2013, 7, 2453–2460 CrossRef CAS PubMed.
- L. B. Gao, K. Cao, H. T. Zhang, P. F. Li, J. Song, J. U. Surjadi, Y. F. Li, D. Sun and Y. Lu, J. Mater. Chem. A, 2017, 5, 16944–16952 RSC.
- Y. Hu, M. Liu, Q. Yang, L. Kong and L. Kang, J. Energy Chem., 2017, 26, 49–55 CrossRef.
- X. D. Li, R. Ding, L. H. Yi, W. Shi, Q. L. Xu and E. H. Liu, Electrochim. Acta, 2016, 222, 1169–1175 CrossRef CAS.
- Y. Lan, H. Zhao, Y. Zong, X. Li, Y. Sun, J. Feng, Y. Wang, X. Zheng and Y. Du, Nanoscale, 2018, 10, 11775–11781 RSC.
- X. Chen, M. Cheng, D. Chen and R. Wang, ACS Appl. Mater. Interfaces, 2016, 8, 3892–3900 CrossRef CAS PubMed.
- K. N. Dinh, Q. Liang, C.-F. Du, J. Zhao, A. I. Y. Tok, H. Mao and Q. Yan, Nano Today, 2019, 25, 99–121 CrossRef CAS.
Footnote |
| † Electronic supplementary information (ESI) available: Details of materials preparation and characterization methods and partial characterization results. See DOI: 10.1039/c9ta12192g |
| This journal is © The Royal Society of Chemistry 2020 |

