
 Open Access Article
 This Open Access Article is licensed under a Creative Commons Attribution-Non Commercial 3.0 Unported Licence
Biogenic fluorescent protein–silk fibroin phosphors for high performing light-emitting diodes†
Verónica
Fernández-Luna
 ab,
Juan P.
Fernández-Blázquez
a,
Miguel A.
Monclús
a,
Francisco Javier
Rojo
c,
Rafael
Daza
c,
Daniel
Sanchez-deAlcazar
d,
Aitziber L.
Cortajarena
de and
Rubén D.
Costa
*af
ab,
Juan P.
Fernández-Blázquez
a,
Miguel A.
Monclús
a,
Francisco Javier
Rojo
c,
Rafael
Daza
c,
Daniel
Sanchez-deAlcazar
d,
Aitziber L.
Cortajarena
de and
Rubén D.
Costa
*af
aIMDEA Materials Institute, Calle Eric Kandel 2, 28906 Getafe, Spain. E-mail: ruben.costa@imdea.org
bDepartamento de Física de Materiales, Universidad Autónoma de Madrid, 28049 Madrid, Spain
cUniversidad Politécnica de Madrid, Centro de Tecnología Biomédica, Campus Montegancedo, 28223 Pozuelo de Alarcón, Spain
dCenter for Cooperative Research in Biomaterials (CIC biomaGUNE), Basque Research and Technology Alliance (BRTA), Paseo de Miramon 182, 20014, Donostia San Sebastián, Spain
eIkerbasque, Basque Foundation for Science, Ma Díaz de Haro 3, 48013 Bilbao, Spain
fTechnical University of Munich, Chair of Biogenic Functional Materials, Schulgasse 22, D-94315 Straubing, Germany. E-mail: ruben.costa@tum.de
First published on 22nd May 2020
Abstract
This work presents a new family of bio-hybrid light-emitting diodes (Bio-HLEDs) using all-bio color down-converting coatings that combine silk fibroin (SF) as a packaging matrix and fluorescent proteins (FPs) as emitters. The thermal, mechanical, optical, and luminescent features of the FP–SF bio-phosphors were optimized with respect to the blend composition and the FP stability under thermal and irradiation stress. Bio-HLEDs with FP–SF filters feature stabilities of 1.2 h and 500 h (200 mA) at efficiencies of ∼40 lm W−1 for on-chip and remote configurations, respectively. This is significantly superior to devices with FP–polymer bio-phosphors – i.e., 1.8 min (on-chip) and 300 h (remote) at <35 lm W−1. The excellence of the biogenic phosphors is attributed to (i) the ideal optical features of the SF films, (ii) the highly efficient emission of the FPs, and (iii) the high thermal- and photo-stabilities of FPs in the SF matrix. Finally, we revealed that the emission deactivation process of FP–SF phosphors is related to a very slow protonation of the ionic form of the FP chromophore along with large morphological changes due to thermal- and photo-induced FP motions. Overall, this work shows the promising prospects of fully biogenic phosphors en route to designing highly stable bio-based lighting devices.
New conceptsThis is a seminal work presenting fully biogenic phosphors as color down-converting filters for a new class of bio-hybrid light-emitting diodes (Bio-HLEDs). This emerging lighting technology promises to replace toxic, unhealthy, and unsustainable inorganic phosphors for biological ones that promises to reduce costs and enhance the color quality if high stabilities are met. To date, the most stable devices – i.e., 1.8 min (on-chip) and <300 h (remote) at 200 mA – consist of hybrid bio-phosphors based on fluorescent proteins (FPs) stabilized in polymers and metal organic frameworks. Herein, we describe the preparation, implementation, and limitations of the first biogenic phosphors combining the ideal optical/mechanical/thermal features of silk fibroin (SF) as a packaging matrix to significantly stabilize highly emissive FPs against thermal/photo stress. This led to new biological lighting devices outperforming the prior-art with stabilities of 1.2 h (on-chip) and >500 h (remote) at 200 mA and enhanced device efficiencies (20% increase). |
1. Introduction
The excellent mechanical and thermal features of silk fibroin (SF) are fueling its wide use in tissue engineering, drug delivery, diagnostics, and sensing.1,2 For instance, SF from the Bombyx mori cocoon features high tensile strength values around 300–740 MPa3,4 along with a breaking elongation of 15% and breaking toughness of 6 × 10⁴ J kg−1.5 These properties are highly dependent on the spinning rate of the silk fiber, being able to reach similar mechanical properties to those obtained with Nephila spider dragline silk with a breaking strength of 1.3 GPa.3Recently, the optical features of SF including a refractive index of 1.546,7 and a high light-guiding efficiency,8,9 in concert with outstanding environmental and thermal stabilities,10 are attracting increasing attention in the green photonics field.1,11–18 In this context, the first SF-lasers were provided by Omenetto and co-workers, who reported cocoon silk 1D distributed feedback lasers with a stilbene as a laser dye, showing an optical pump threshold intensity of 180 μJ cm−2 (427 nm).19 Bêche and co-workers described the integration of pristine spider silk fibers in a photonic chip made of polymer microstructures.20 They also demonstrated efficient optical fibers with different arrangements, showing optical losses of 10.5 dB cm−1. In this line, Sun et al. studied the linear and nonlinear optical properties of natural silk fibers,21 indicating that unprocessed silk featured an average waveguide loss of 2.8 dB mm−1. In a follow up study, Wang and colleagues proposed the application of recombinant spider silk protein and silkworm silk for optical waveguides.22 This work demonstrated that spider silk presents a smoother surface, a higher refractive index (n = 1.70) and a lower optical loss in air (0.8 dB cm−1) compared to the silkworm protein (n = 1.52 and 1.7 dB cm−1).
Despite all the above interesting findings in lasers and light-guiding applications using different types of SF derivatives, SF-based light-emitting diodes (LEDs) have barely been investigated. In 2015, Zhang and co-workers transformed SF films into electrodes for an array of LEDs embedding silver nanowires into the SF network.23 Recently, SF hydrogels have been used to control the light distribution and light-extraction efficiency in LEDs. These lenses featured high thermal stability (70 °C) and a low refractive index (n = 1.35). However, the stability of the bare SF-lenses was <150 h under illumination.24
Herein, we describe a new use of SF as a matrix to stabilize fluorescent proteins (FPs) to design fully biogenic phosphors for a new family of bio-hybrid light-emitting diodes (Bio-HLEDs).25,26 Bio-HLEDs promise to replace inorganic phosphors (IPs) – i.e., color down-converting materials based on rare-earth elements and Cd-based emitters – for environmentally friendly bio-phosphors. IPs are, indeed, considered one of the most critical roadblocks towards the sustainable development of LED technology. This is related to (i) their negative ecological impact, i.e., mining, lack of recycling, and use of toxic elements,27,28 and (ii) the visual and non-visual health effects under long exposure to blue light – i.e., irreversible damage of photoreceptors in young children and elderly people along with the alteration of the natural biorhythm of the body (circadian rhythm).29–32
To date, there are two types of bio-phosphors, namely (i) biogenic emitters like FPs stabilized in polymer matrices (FP–polymer)33–40 and metal organic frameworks (FP–MOF)41,42 and (ii) artificial emitters stabilized in biogenic matrices like DNA,43 proteins,24,44–49 polysaccharides,50–52 and cellulose.50,51,53 Table S1 (ESI†) summarizes the most important figures of merit of these contributions.
As described above, SF has been widely used as a scaffold to embed different artificial emitters, such as QDs, AuNCs, dyes, etc.8,17 There are, however, a few studies combining SF with FPs via genetic engineering54,55 and in the solid-state.56 None of them has, surprisingly, been applied to solid-state lighting.57 Having in mind the excellent optical features of SF films and the efficient color down-conversion of FPs, this combination could be of utmost interest to develop a third family of fully biogenic phosphors (packaging and emitters) towards highly efficient bio-based lighting systems. This constitutes the major thrust of the work at hand.
In this context, we provide straightforward preparation and optimization of FP–SF color down-converting coatings and their application in high performing Bio-HLEDs. Compared to Bio-HLEDs based on FP–polymer,39 the FP–SF bio-phosphors provide devices featuring enhanced stabilities – i.e., 1.2 h vs. 1.8 min and >500 h vs. <300 h at 200 mA for on-chip and remote configurations, respectively – and slightly better efficiencies – i.e., 40 lm W−1vs. 35 lm W−1.39 These results also stand out among the prior-art Bio-HLEDs as summarized in Table S1 (ESI†).
The excellence of the new class of fully biogenic phosphors is attributed to (i) the ideal optical features of the SF films, (ii) the highly efficient emission of the FPs, and (iii) the very slow deactivation mechanism related to protonation of the ionic form of the FP chromophore in concert with large morphological changes due to thermal- and photo-induced FP motion. Overall, this work shows the promising prospects of fully biogenic phosphors en route to designing a third family of Bio-HLEDs towards highly stable bio-based lighting devices.
2. Results and discussion
2.1. Preparation and characterization of SF-based coatings
Flexible and self-standing FP-free SF-films were prepared by drop-casting water solutions with 3, 6, and 9 wt% of SF derived from B. mori onto a Teflon surface and dried under room conditions – Fig. 1. The solutions were prepared with lyophilized degummed SF using a procedure reported elsewhere – see the Experimental section for details.58 The SF-films presented a similar thickness (ca. 30 μm), while optical microscope pictures and atomic force microscopy (AFM) measurements showed a homogenous morphology (Fig. S1, ESI†) with root mean square (RMS) roughness values of 7.5 ± 1.7 nm, 2.2 ± 0.7, nm, and 1.7 ± 0.1 nm for 3, 6, and 9 wt% SF films, respectively.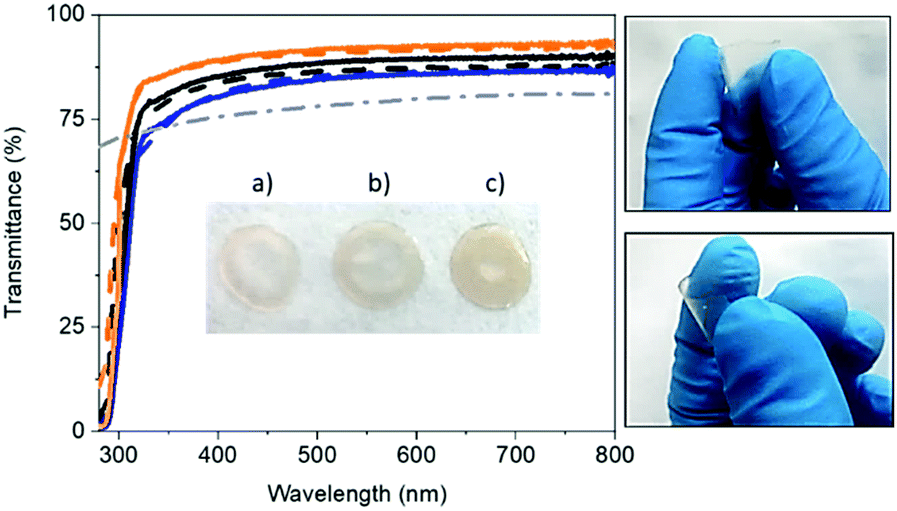 | ||
| Fig. 1 Transmittance spectra of fresh (solid line) and 1 month-old (dashed line) SF-films with 3 (orange), 6 (black) and 9 (blue) wt% SF compared to a fresh polymer (branch/linear PEO) film (dashed-dotted line). Pictures of 3 (a), 6 (b) and 9 (c) wt% SF-films (inset) and those highlighting the flexibility of 3 wt% SF-films (right) are also shown. | ||
The thickness, weight, and morphology of the SF-films did not change after 1 month under ambient storage conditions, indicating that the water content holds constant. Likewise, the transmittance and color features of fresh and 1 month-old films were similar regardless of the SF amount – Fig. 1 and Fig. S2 (ESI†). In general, the SF-films featured transmittances >80% in the visible range and a refractive index of 1.5, indicating good optical properties for color down-converting packaging purposes. In particular, the transmittance of the 3 wt% SF-films was 10% higher than those with 9 wt%. This small loss may be related to the increase of scattering events related to the number of crystalline domains.59,60 Finally, all the SF-films featured a similar whitish color with x/y CIE color coordinates of 0.33/0.34 – Fig. S2 (ESI†).
The thermal properties of the SF-films were studied using thermogravimetric analysis (TGA) under an inert atmosphere and modulated differential scanning calorimetry (MDSC). TGA showed three well-defined regions for all samples – Fig. S3 (ESI†) and Table 1: (i) a loss of free water accounting for <10% (35–150 °C), (ii) <5% loss of trapped water (150–250 °C), and (iii) fibroin degradation (>250 °C).61 MDSC, in heat flow profiles, Fig. S3 (ESI†), presented a broad endothermic peak starting at 50 °C that corresponds to water evaporation. This endothermic peak was followed by an endo–exo transition peaking at 170 °C and 210 °C, respectively. The endothermic process is associated with the glass transition of the silk as it is observed in reversible heat flow. This provides a high molecular motion of the α-helix fibroin region, while the exothermal band is linked to the β-sheet formation from random coils.62–67 Finally, the films presented an endothermal band peaking at 260 °C that corresponds to the decomposition of the β-sheet fibroin.63,66,68
| Sample | T g (°C) | T (%) | x/y CIE coordinates | H (GPa) | E (GPa) |
|---|---|---|---|---|---|
| a Transmittance of SF-films in the visible region fresh/1 month-old. b Heated at 50 °C for 24 h under dark conditions. c Irradiated with a 450 nm LED for 24 h under dark conditions. | |||||
| 3 wt% | 182 | 92/91 | 0.33/0.34 | 0.48 ± 0.05 | 7.76 ± 0.57 |
| 6 wt% | 181 | 87/85 | 0.32/0.33 | 0.52 ± 0.05 | 10.06 ± 0.81 |
| 9 wt% | 182 | 84/84 | 0.32/0.34 | 0.48 ± 0.07 | 10.02 ± 0.98 |
| 3 wt% heatedb | 185 | 88 | 0.32/0.33 | 0.6 ± 0.1 | 10.11 ± 0.61 |
| 3 wt% irradiatedc | 181 | 79 | 0.40/0.43 | 0.52 ± 0.05 | 8.73 ± 0.60 |
The mechanical features – i.e., hardness (H) and reduced modulus (E); Table 1 – were studied using quasi-static and cyclic nanoindentation assays at maximum applied loads of 4 and 12 mN, respectively. The H and E features reached constant values in the depth range of 400–600 nm. Within this displacement range, the tip penetration is enough to avoid surface roughness, tip rounding, and compliance effects on the measured H and E values. All the films showed similar H values (∼0.50 GPa), while the E values were close to 10 GPa for the 6 and 9 wt% SF-films and ∼7.8 GPa for the 3 wt% films – Fig. S4 (ESI†). These values are in line with previous reports, suggesting that the morphology of the SF-films consists of a well-interconnected fibroin network.69
2.2. Preparation and characterization of FP–SF coatings
In light of the high transmittance, the ease of handling of the aqueous solutions, and the degree of flexibility of the 3 wt% SF-films, they were doped with the enhanced green fluorescent protein (eGFP) as a color down-converting material. Similar to the SF-films, the FP-doped films were prepared with a homogeneous aqueous solution of SF-eGFP with a total concentration 1.5 mg mL−1 and a FP![[thin space (1/6-em)]](https://www.rsc.org/images/entities/char_2009.gif) :SF mass ratio of 1:20. This mass ratio was previously optimized to ensure a quantitative conversion efficiency of the LED excitation source in Bio-HLEDs – vide infra.
:SF mass ratio of 1:20. This mass ratio was previously optimized to ensure a quantitative conversion efficiency of the LED excitation source in Bio-HLEDs – vide infra.
To the naked eye, the FP–SF films showed the characteristic pale yellowish white color appearance and strong green emission of the eGFP – Fig. 2, Fig. S2 (ESI†), and Table 2. Close inspection of the photoluminescence features indicated an increase of the photoluminescence quantum yields (ϕ) from 50% (aqueous solution) to 65% (film) and the excited state lifetimes (τ) from 2.55 to 2.97 ns, respectively. These values account for the enhanced radiative and non-radiative rate constants, while confirming that the chromophore of the eGFP is present in its ionic form (λexc = 490 nm).70–72 Indeed, excitation at 375 nm did not reveal any emission feature of the neutral form of the chromophore in the wavelength range of 400–475 nm – Fig. 2. However, the overall emission band of the FP–SF films was slightly red-shifted with a maximum wavelength emission (λmax = 490 nm) of 520 nm compared to that in solution (510 nm). This suggests that during the drying process the SF–FP interaction is enforced, leading to a slightly distorted β-barrel that promotes small structural changes of the microenvironment surrounding the chromophore without changing its ionic form. This behavior has also been identified in FP–polymer bio-phosphors as shown in Fig. 2 and Table 2. However, this feature is a key aspect towards highly stable Bio-HLEDs, since the kinetics of the photo-induced deactivation of the chromophore from its ionic to neutral forms is significantly slowed down in this distorted conformation promoted by the interaction with the surrounding matrix.39
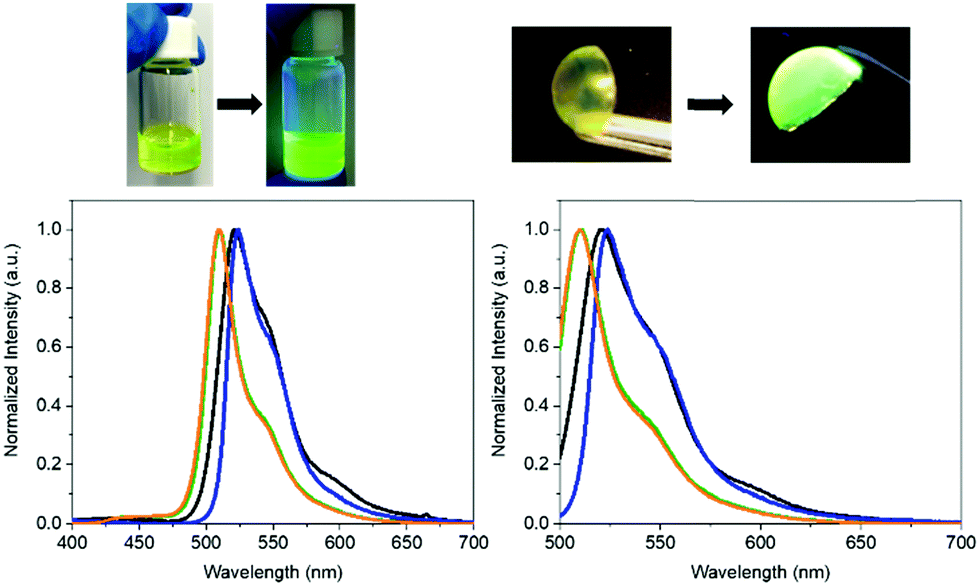 | ||
| Fig. 2 Top: Pictures of the FP–SF aqueous solutions (left) and films (right) under room and UV irradiation. Bottom: Emission spectra at excitation wavelengths of 375 nm (left) and 490 nm (right) of FP–SF aqueous solutions (green), FP aqueous solution (orange), FP–SF films (black), and FP–polymer films (blue). | ||
| Sample | H (GPa) | E (GPa) | x/y CIE coordinates | λ max (nm) | ϕ (%) | τ (ns) | k r (× 108 s−1) | k nr (× 108 s−1) |
|---|---|---|---|---|---|---|---|---|
| a Milli-Q water. b Heated at 50 °C for 24 h under dark conditions. c Irradiated with a 450 nm LED for 24 h under dark conditions. d Excitation at 375 nm. e Excitation at 485 nm. f Average excited-state lifetimes at 450 nm excitation. | ||||||||
| FP–SF solutiona | — | — | — | 510 | 50 | 2.55 | 1.96 | 1.96 |
| FP–polymer | — | — | — | 524 | 70 | 2.03 | 3.45 | 1.48 |
| FP–SF | 0.56 ± 0.02 | 9.76 ± 0.11 | 0.31/0.33 | 520 | 65 | 2.97 | 2.19 | 1.18 |
| FP–SF heatedb | 0.17 ± 0.02 | 1.35 ± 0.20 | 0.33/0.35 | 524 | 47 | 2.47 | 1.82 | 2.23 |
| FP–SF irradiatedc | 0.17 ± 0.02 | 0.13 ± 0.01 | 0.40/0.43 | 520 | 60 | 2.90 | 2.07 | 1.38 |
Further confirmation of the FP–SF interaction was acquired from the thermal and mechanical features of these films. On one hand, MDSC assays did not display the characteristic endo–exo transition between 170 and 200 °C in SF-films, as it was overlapped with the broad endothermic process related to the protein degradation – Fig. S5 (ESI†). On the other hand, the presence of the FP leads to stiffer films as both the H and E values increase compared to those of the pristine SF-films – Tables 1 and 2. TGA assays indicated that the FP–SF films contain a lower amount of water – i.e., <1 or 2% – but enough to have an influence on the mechanical properties. However, the morphology of the fresh FP–SF films showed the same homogenous morphology as that of the SF-films – Fig. S6 (ESI†). Importantly, the global molecular motion of the α-helix fibroin region is restricted due to the strong FP–SF interaction. This prenvents, in addition, that the β-sheet formation turns to a random coil. As such, the enhanced mechanical behaviour is related to the presence of the FP, which slightly reduces the water content after drying and interacts with the SF matrix leading to a significant plasticizer effect.
2.3. Preparation and characterization of Bio-HLEDs with FP–SF coatings
Bio-HLEDs were prepared using the named on-chip configuration, in which a commercial blue-emitting chip (450 nm; WINGER electronics) was directly covered with the above SF and FP–SF filters prepared with a dome form (25 μm thick and 7 mm in diameter) as shown in Fig. 2 and 3 – see the Experimental section for preparation details. For reference purposes, devices with FP–polymer bio-phosphors are also discussed.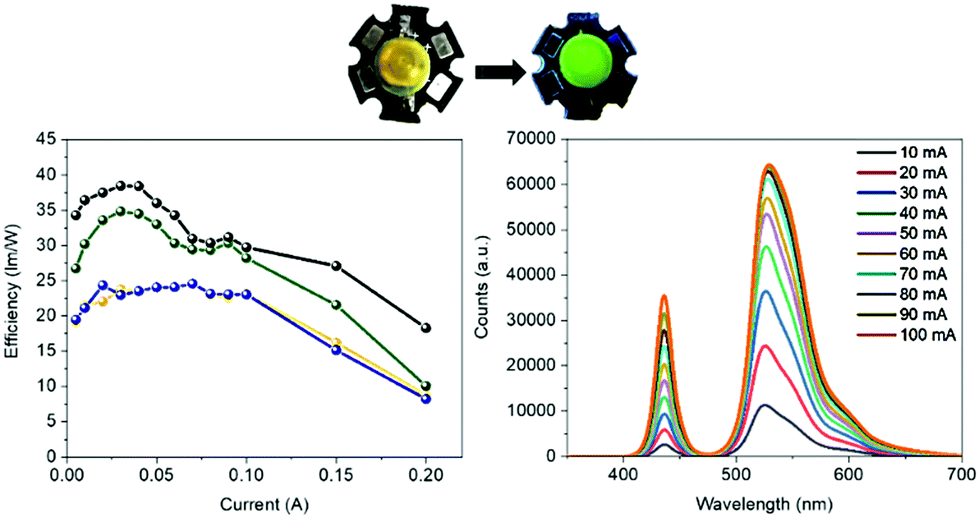 | ||
| Fig. 3 Top: Pictures of Bio-HLEDs with FP–SF filters. Bottom: Luminous efficiency vs. applied current (left) for a commercial 450 nm LED (blue), Bio-HLEDs with SF-films (orange), Bio-HLEDs with FP–SF-films (black), and Bio-HLEDs with FP–polymer (green). The electroluminescence spectra (right) of Bio-HLEDs with FP–SF-films at different driving currents are also shown. | ||
At first, the changes of the electroluminescence spectrum and luminous efficiency were monitored upon increasing the applied current from 5 to 200 mA – Fig. 3 and Fig. S8 (ESI†). Regardless of the applied current, the maximum luminous efficiencies (ca. 20 lm W−1 at 30–50 mA), which are dominated by the blue-emission electroluminescence spectrum, of both the commercial LEDs and the Bio-HLEDs with SF-filters exhibited similar values – Fig. S8 (ESI†). This corroborates the excellent optical features of the SF-films for color down-conversion purposes in hybrid LEDs – vide supra. In contrast, Bio-HLEDs with FP–SF filters featured slightly higher luminous efficiencies (ca. 40 lm W−1 at 30–50 mA) caused by their better transmittance values compared to the polymer films – i.e., mixed branch/linear PEO – as shown in Fig. 1 and see the Experimental section. The device emission is dominated by an electroluminescence spectrum centered at 520 nm that corresponds to the FP emission. Common to all the devices, the maximum luminous efficiency is followed by a significant reduction caused by the loss of the internal quantum efficiency of the electron–hole recombination at the emitting chip – Fig. 3.73
Like Bio-HLEDs with FP–polymer filters, the major limitation of using FP–SF filters is the photo-induced heat generation, reaching a maximum temperature of 43 °C at 200 mA – Fig. 4. This contrasts with the maximum temperature of <30 °C at 200 mA for commercial LEDs and Bio-HLEDs with SF filters. The heat generation in Bio-HLEDs has recently been attributed to the photo-induced vibrational and rotational FP motions.39 Upon strong photon flux fluencies, FPs act as a hot spot that transmits the heat to the polymer surroundings until the melting temperature of the polymer network is reached. This strongly weakens the FP–matrix interaction, provoking quick and irreversible FP denaturation. Thus, devices with FP–polymer coatings feature a linear increase of the temperature with the applied current up to values close to 60 °C at 200 mA – Fig. 4.39 In contrast, Bio-HLEDs with FP–SF coatings featured (i) a much lower maximum temperature and (ii) a different photo-induced temperature generation behavior that consists of two linear regimes going from 0 to 100 mA reaching 40 °C and from 100 to 200 mA in which the temperature slightly increases up to 42 °C. This behavior is also noted for devices with SF-filters and commercial LEDs. Thus, SF filters show effective heat dissipation at high applied currents, which is attributed to (i) the higher thermal conductivity of the SF films compared to those of the polymer coatings, i.e., ∼6.50 W mK−1vs. ∼0.3–0.5 W mK−1,74 and (ii) the enhanced mechanical features, which constrain FP motion.
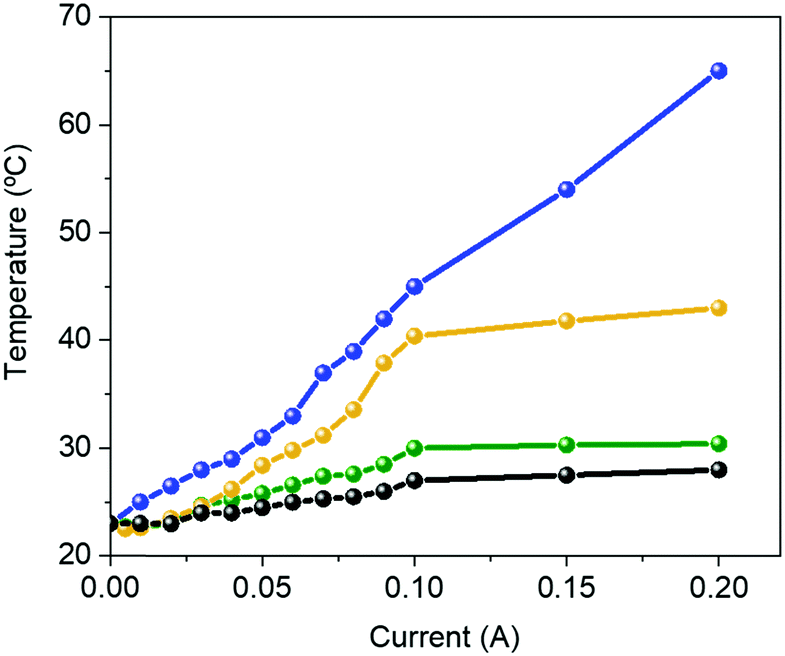 | ||
| Fig. 4 Changes in the temperature vs. applied current for a commercial 450 nm LED (black) and Bio-HLEDs with FP–polymer (blue), FP–SF (orange), and SF (green) bio-phosphors. | ||
The Bio-HLED stability – i.e., t50 or time to reach half of the initial emission intensity – was studied at high driving currents of 200 mA, monitoring the intensity decay of the color down-converting band and the temperature of the filters – Fig. 5. The emission decay obeyed a bi-exponential behavior. The first decay regime went hand-in-hand with a quick increase of the filter temperature without showing any change in the emission band – Fig. 5. The second regime was characterized by a slow decay in both the temperature and the emission intensity, which is associated with a slightly blue-shifted emission band (<5 nm). Here, the emission plateaus at ca. 30% of the initial value for more than 16 h. This behavior significantly contrasts with that of Bio-HLEDs with FP–polymer, in which the emission band is red-shifted in >15 nm and the emission intensity completely vanished – Fig. 5. Indeed, Bio-HLEDs with FP–SF filters featured a two orders of magnitude higher t50 value (1.2 h) than those with FP–polymer filters (1.8 min) – Fig. 5. All-in-all, these findings suggest that FP–SF bio-phosphors provide Bio-HLEDs with a superior performance caused by less severe heat generation and FP deactivation processes than those noted in FP–polymer filters.
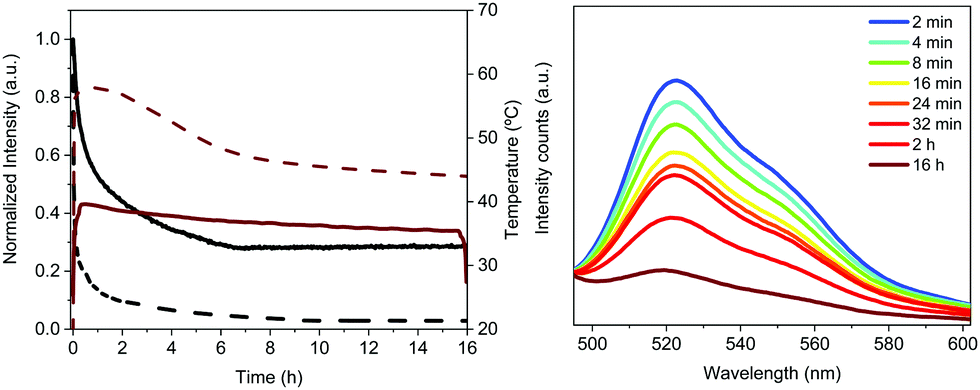 | ||
| Fig. 5 Typical performance of ‘on-chip’ Bio-HLEDs operating at high-applied currents of 200 mA. Left: Overall emission intensity decay (black) along with the temperature changes (red) over time for Bio-HLEDs with FP–SF (solid line) and FP–polymer (dashed line). Right: Electroluminescence spectra of Bio-HLEDs with FP–SF phosphors over time. | ||
2.4. Deactivation mechanisms in Bio-HLEDs with FP–SF coatings
To determine the degradation mechanism in FP–SF filters towards long-living Bio-HLEDs, we decided to decouple the thermal and irradiation stresses, monitoring the changes of the photophysical, thermal, mechanical, and morphological features of the filters.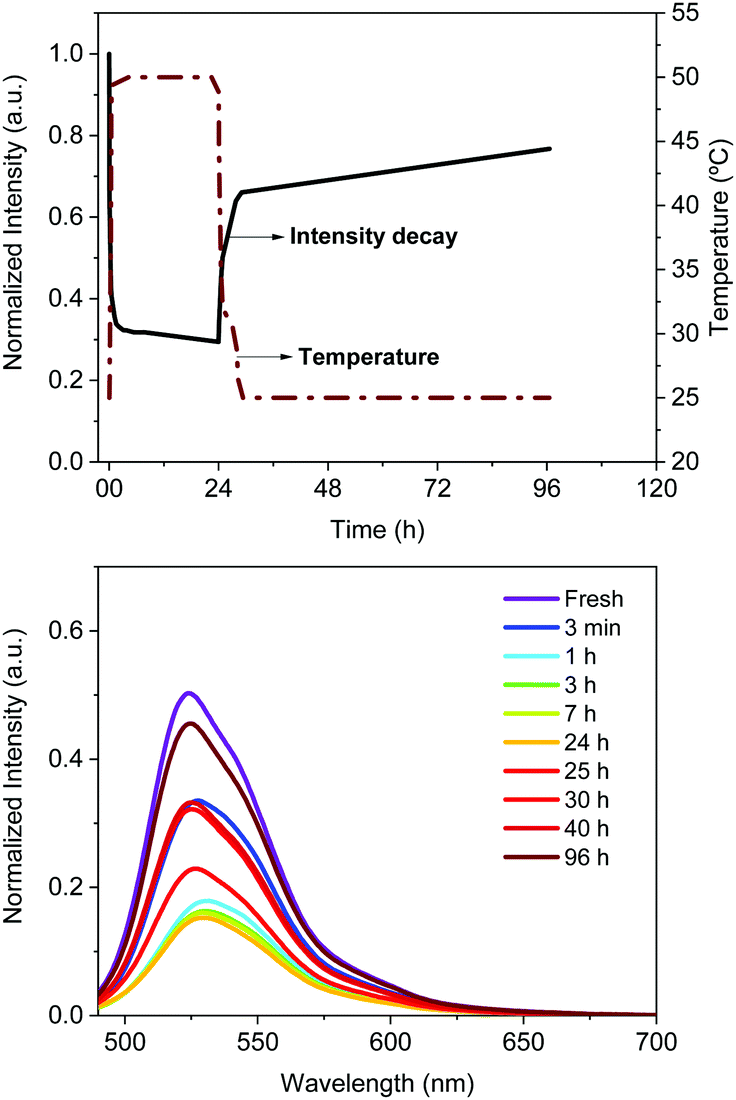 | ||
| Fig. 6 Thermal stability of FP–SF bio-phosphors at a constant temperature (50 °C) for 24 h and after cooling, monitoring the emission intensity (top), and emission band shape (bottom) upon excitation with a blue LED (450 nm) for 5 s every 10 min. | ||
In particular, heating led to a quick emission loss (Il = 65%; kq = 0.5 h−1) followed by a slight reduction of the emission intensity (<5%) after 24 h. The emission band shape held constant, showing a slightly blue-shifted maximum emission wavelength (<5 nm; Fig. 6), which suggests a partial change in the microenvironment of the protein chromophore – vide infra. Cooling provoked a quick gain in emission intensity (Ig = 40%; kre = 0.2 h−1) that accounts for a recovery up to 70% of the fresh emission intensity of a FP–SF coating. This is slightly enhanced after the heated FP–SF coatings were kept in the dark and at room temperature for ca. 200 h, reaching a final Ish value of ∼80%. Both recovery processes did not show any significant change of the emission band shape. For reference purposes, FP–polymer coatings showed more pronounced and quicker thermal emission quenching (Il = 73%; kq = 0.97 h−1), while the sum of both thermal and self-healing recoveries does not present a significantly higher Ish value than the FP–SF films – see Table 3, Fig. 6 and Fig. S10 (ESI†).
| Sample | I l (%) | k q (h−1) | I g (%) | k re (h−1) | I sh (%) |
|---|---|---|---|---|---|
| FP–polymer | 73 | 0.97 | 40 | 0.67 | >80 |
| FP–SF | 65 | 0.5 | 40 | 0.2 | >80 |
To get more insights into the degradation mechanism, the photophysical features of fresh and heated FP–SF filters were compared – Fig. S10 (ESI†) and Table 2. In short, several studies have shown that the emission deactivation of the FP could be related to (i) changes in the nature of the emitting excited state via excited state proton transfer (ESPT), i.e., neutral, anionic, and intermediate forms,75 (ii) population of dark states, i.e., dark state, triplet or cis/trans isomerization,76 (iii) photooxidative reddening,77 and (iv) reversible photochromism.78,79 The last two processes are discarded as they lead to the formation of highly emissive red-emitting species that are not noted in SF–FP filters.
Excitation at 375 nm revealed the band shape of the ionic chromophore (λmax = 522 nm; corroborated by excitation at 490 nm) and the arising presence of its neutral form (λmax = 430 nm) – Fig. S11 (ESI†). This implies that the deactivation mechanism is related to a slow transformation of the FPs featuring highly emissive ionic forms of the chromophore to those with the poorly emissive neutral form. This is driven by the partial distortion of the β-barrel caused by temperature-induced variations of the external environment, which promotes small changes in the chromophore cavity leading to a slow ESPT process. This is further confirmed by the decrease in ϕ and τ (47% and ca. 2.47 ns (λexc = 450 nm), respectively) after thermal stress compared to fresh SF–FP filters – Table 2. Please note that deactivation via the population of dark states and/or full denaturation of the protein leads to a lack of emission.76
Finally, AFM and optical images of the heated films revealed a dramatic change in the film morphology, showing a higher degree of heterogeneity and roughness that is strongly juxtaposed to that of heated FP-free SF films – Fig. S6 and S7 (ESI†). For instance, heated SF-films exhibited similar thermal and mechanical features with a slight loss in transmittance of <5% compared to the fresh SF-films – Fig. S2, S5 (ESI†) and Table 1. These findings indicate that a small degree of short range rearrangement might be present in heated SF-films. In stark contrast, the morphological changes of the heated FP–SF films translated into, for example, a significant reduction of the H and E values compared to fresh FP–SF films – i.e., H: 0.17 GPa vs. 0.56 GPa; E: 1.35 GPa vs. 9.76 GPa, respectively – Table 2.
All-in-all, the use of a SF packaging matrix enhances the thermal stability of the embedded FPs compared to those with polymers. The temperature induced deactivation mechanism seems to be similar through a small distortion of the β-barrel promoting the protonation of the ionic chromophore form. This process should also be promoted by long range morphological arrangements of the FP–SF network upon heating.
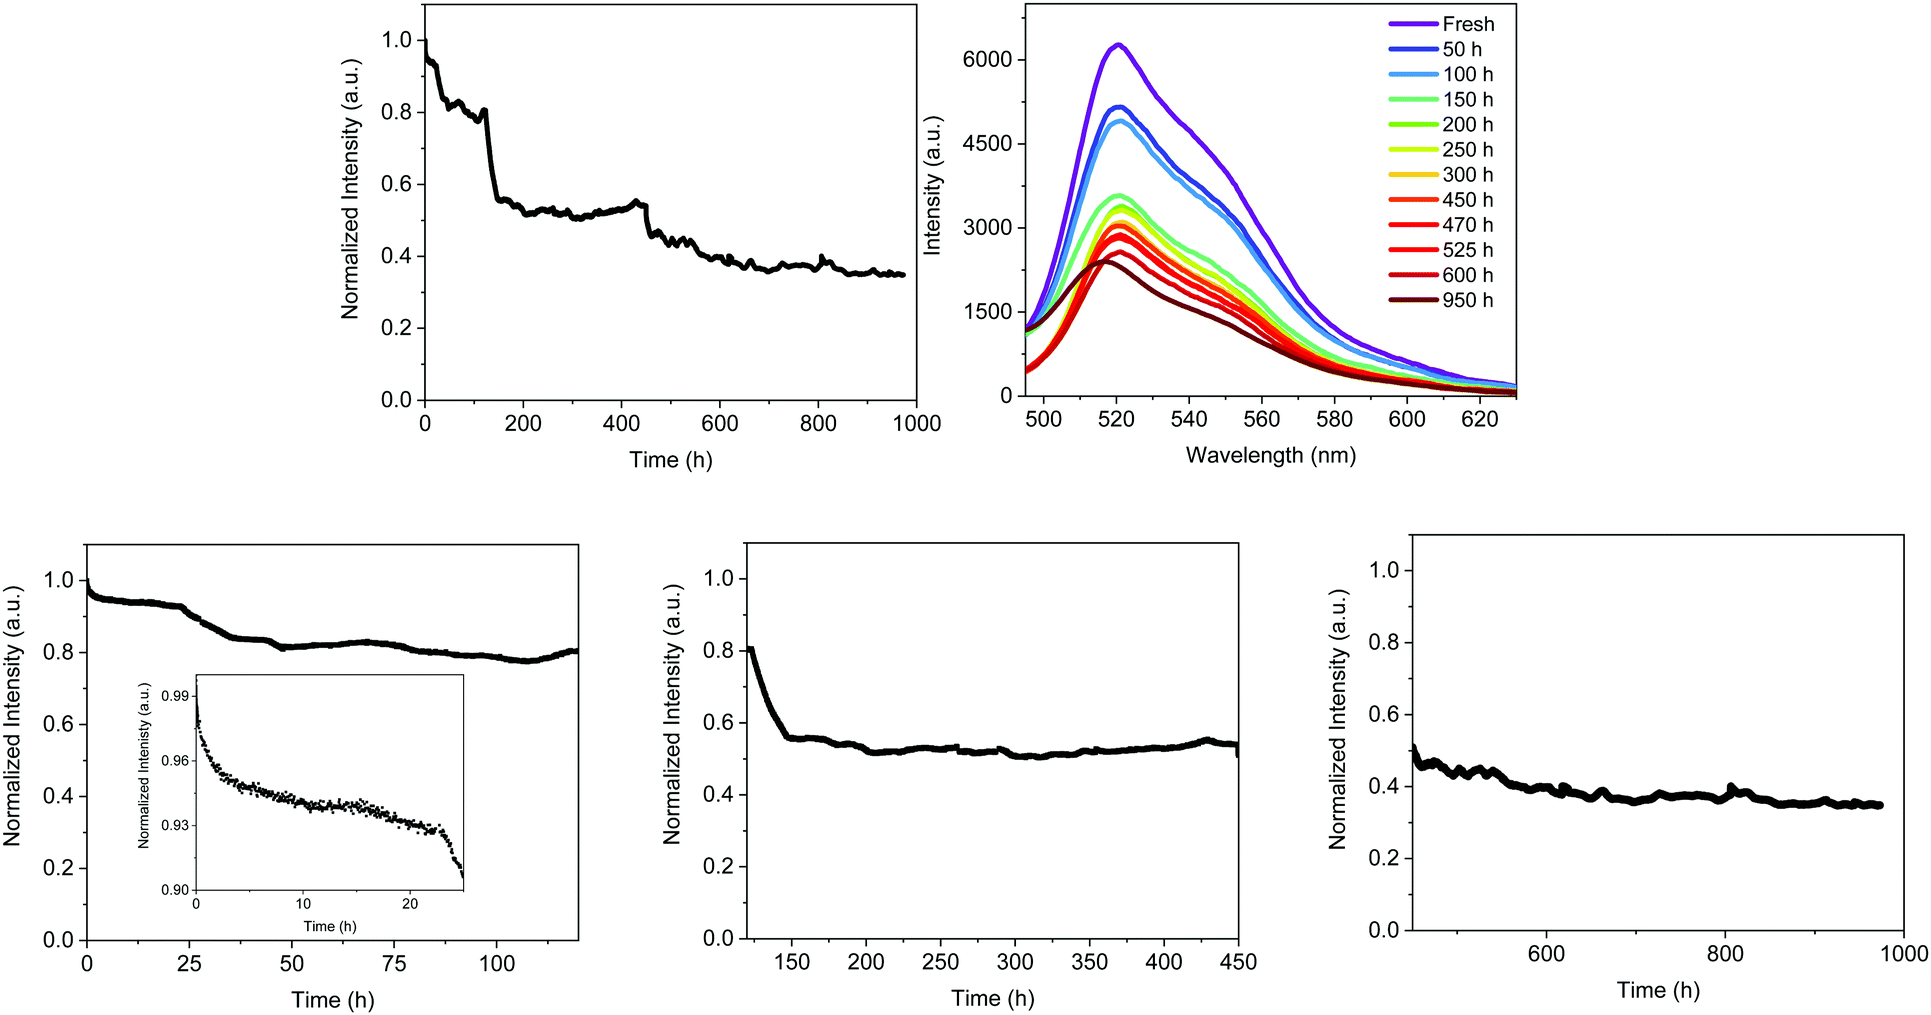 | ||
| Fig. 7 Typical performance of remote (2 cm) FP–SF based Bio-HLEDs operating at high applied currents at 200 mA. Top: Overall emission intensity decay (left) and the electroluminescence spectra changes (right) over time. Bottom: Emission intensity decay divided into four regimes, namely 0–24 h (inset graph), 24–120 h (left), 120–450 h (centre), and 450–1000 h (right). | ||
The decay of the emission intensity followed four well-defined regimes. First, a small emission decrease is related to the slight increase in temperature, which rose during the first 24 h and held fairly constant at <30 °C for the whole measurement. This is followed by a second emission decrease of <10%, reaching a plateau that holds for 120 h. In both regimes, the emission band shape remains constant. At this point, the emission intensity exhibited another 18% loss until 150 h along with slightly blue-shifted emission (521 nm). These emission features kept constant until 450 h, at which another slow decay of 11% took place. This is in concert with a blue shift of λmax to 516 nm and a new emission plateau at approximately 40% of the initial intensity for >1000 h. This resulted in a device lifetime (t50) of around 500 h, which is much higher than the previous record noted for Bio-HLEDs with FP–polymer (<300 h).39 This is in perfect agreement with the stability enhancement noted for on-chip Bio-HLEDs operating at the same high applied currents – vide supra.
The spectroscopic changes of the FP–SF coatings were also obtained at each plateau regime – Fig. S11 (ESI†) and Table 4. As stated above, the emission features slightly changed during the first 120 h – i.e., ϕ of 55% and τ of 2.55 ns, indicating that the majority of the FPs presented the ionic chromophore form; though a slight conversion to the neutral chromophore form is noted – Fig. S11 (ESI†). However, the most critical aspect is the large morphological changes that might be promoted by FP motion upon constant excitation – Fig. S6 and S7 (ESI†). Similar to the isothermal assays, the mechanical and optical features of the irradiated FP–SF films were dramatically affected by the morphological changes – Fig. S2 (ESI†) and Table 2. For reference purposes, the irradiated SF-films did not show any change – Fig. S2 and S6 (ESI†). Thus, the initial loss in the device intensity might be mainly related to (i) the slight increase in temperature and (ii) changes in the transmittance and refractive index values caused by the large morphological arrangements.
| Sample | λ max (nm) | ϕ (%) | τ (ns) | k r (× 108 s−1) | k nr (× 108 s−1) |
|---|---|---|---|---|---|
| a Excitation at 375 nm. b Excitation at 485 nm. c Average excited-state lifetimes at 450 nm excitation. | |||||
| FP–SF fresh | 520 | 65 | 2.97 | 2.19 | 1.18 |
| “On-chip” | 520 | 25 | 2.58 | 0.97 | 2.90 |
| 100 h | 521 | 55 | 2.55 | 1.86 | 1.52 |
| 375 h | 522 | 50 | 2.58 | 1.68 | 1.68 |
| 600 h | 521 | 44 | 2.21 | 1.99 | 2.53 |
| 975 h | 516 | 30 | 1.82 | 1.65 | 3.85 |
During the third regime (150–450 h), the emission band shape is significantly broadened and slightly blue-shifted – Fig. S11 (ESI†) and Fig. 7. This is in concert with a reduction of the ϕ and τ values associated with the arising of the emission band of the neutral form of the chromophore – Fig. S11 (ESI†). Both findings indicate a partial distortion of the β-barrel promoting the deactivation of the chromophore to its neutral form. Finally, this is even more pronounced during the fourth regime (500–1000 h), showing a further broadening of the ionic emission band, a reduction of ϕ, and an increase of the emission band of the neutral chromophore form – Fig. S11 (ESI†) and Table 4. Hence, Bio-HLEDs with FP–SF filters showed enhanced stabilities compared to FP–polymer coatings, since the deactivation process is related to a very slow protonation of the ionic form of the FP chromophore in concert with large morphological changes upon irradiation.
3. Conclusions
This work presents the first study dealing with fully biogenic phosphors for HLEDs. In particular, the preparation and optimization of self-standing color filters combining SF as a packaging matrix and FPs as emitters is presented. The major interest in SF–FP bio-phosphors lies in (i) the ideal optical features of the SF films, (ii) the highly efficient emission of the FPs, and (iii) the high thermal- and photo-stabilities of FPs in the SF matrix. This leads to Bio-HLEDs with enhanced stabilities of 1.2 h (on chip) and >500 h (remote) operating at high applied currents of 200 mA compared to those using FP–polymer as bio-phosphors – e.g., 1.8 min (on-chip) and <300 h (remote). It is noteworthy that the device performance of this novel class of fully biogenic phosphor-based Bio-HLEDs stands out among other Bio-HLEDs based on biogenic matrices embedding artificial emitters43,50,51,80,81 and biogenic emitters in MOFs,41,42 polymers,33–36,39,40,47,82 and dry films48,49,53 as summarized in Table S1 (ESI†).The major limitations of this family of bio-phosphors were also deciphered. On one hand, the presence of FPs in the SF matrix strongly affects the thermal and mechanical features compared to pristine SF-films. This is even more dramatic under thermal and irradiation stress, leading to large morphological changes due to FP motion. On the other hand, the SF matrix effectively enhances both the thermal and photo-stabilities of the FPs, but the deactivation mechanism via the protonation of the ionic chromophore form is still active. It is therefore highly desired to control the content and water motion in these coatings. Both limitations could be tackled by (i) using SF of different lengths, (ii) chemical cross-linking of the SF matrix, and (iii) bio-conjugating the FP–SF moieties. These actions are on-going in our laboratories.
Overall, the major thrust of the work at hand is to assert the brilliant prospects of a new family of all-bio phosphors en route to biogenic lighting applications.
4. Experimental section
4.1. Materials
All materials were purchased from Sigma-Aldrich and used without further treatment. Teflon molds were prepared and cut forming a curved coating with a width of 8.0 mm and depth of 5 mm.4.2. Protein expression and purification
eGFP was expressed in Escherichia coli DH10b cells grown in Luria–Bertani (LB) liquid medium for 24 h at 37 °C. The cells were harvested by centrifugation at 4500 rpm for 15 min and the pellets were resuspended in lysis buffer (300 mM NaCl, 50 mM Tris/HCl pH 7.4) with 1 mg mL−1 lysozyme, 5 mM β-mercaptoethanol and 5 μL of DNase stock solution. The lysate was sonicated for 5 min with 30 s intervals and 40% amplitude, and then centrifuged at 10000 rpm for 45 min. The supernatant solution was loaded into a Ni2+ HisTrap™ column, and the protein was eluted with 300 mM NaCl, 300 mM imidazole, and 50 mM Tris/HCl pH 7.4. The fractions containing the protein were pooled and dialyzed into Milli-Q water. The purity of the samples was determined by SDS/PAGE and spectrometrically. The protein was concentrated to 10 mg mL−1 and then stored in aliquots at −20 °C.
4.3. Preparation of silk fibroin powder
In accordance with previous work, B. mori cocoons, kindly provided by IMIDA (Murcia, Spain), were cut into small pieces and soaked in a bottle with 0.2% (w/v) Na2CO3 solution, at a concentration of cocoon/solution of 2% (w/v). They were degummed by boiling for 30 min in an autoclave (121 °C, 103.4 kPa), followed by 20 min drying under ambient conditions. During the degumming process, sericin is removed from the cocoons and fibroin is the only remaining protein. After the procedure, silk fibroin fibers were repeatedly rinsed in tap water, followed by rinsing in distilled water, and dried overnight at room temperature. Then, the dried fibers were dissolved in 9.3 M lithium bromide (LiBr) solution at a concentration of fiber/solution of 20% (w/v) during a period of 4 hours at 60 °C under gentle stirring. LiBr was cleaned from the solution by dialysis against 50 mM Tris base, pH 8, and 4 °C water for 72 h using BioDesignDialysis Tubing™ (MWCO 3.5 kDa). After dialyzing, the solution was centrifuged at 5000 rpm for 20 min and the supernatant was frozen at −80 °C and lyophilized. Finally, the silk fibroin (SF) obtained was ground to make a powder and it was sealed and stored at −20 °C for further use.4.4. Preparation of protein coatings
The FP–polymer coatings were prepared as follows. A mixture of a 4:1 ratio of TMPE:PEO was added to an eGFP solution (0.45 mg) and stirred (300 rpm) under ambient conditions overnight, forming a hydrogel. The FP–polymer films were obtained after a gentle vacuum process from 200 to 3 mbar for 4 h. The FP-free coatings were also prepared following the above description without eGFP for reference purposes. The FP–SF coatings were prepared as follows. First, a SF solution of 3 wt% was dissolved in a final volume of 300 μL of Milli-Q water. The mixture was stirred (400 rmp) for 3 h under ambient conditions. The eGFP solution (0.45 mg) was added to the SF preparation, and stirred under mild conditions (400 rpm); the final mixture was poured into Teflon molds with a dome-like design, and left to dry under ambient conditions overnight, forming a perfectly curved thin film. The SF coatings were prepared using the protocol above-named, dissolving different wt% of SF into 300 μL of Milli-Q water. Once the solutions were prepared, they were stored at −4 °C until further use.
4.5. Characterization techniques
The photophysical studies were carried out using an FS5 spectrofluorometer (Edinburgh Instruments) with an SC-10 module for solid samples, an SC-30 integrating sphere to determine ϕ, and a 450 nm time-correlated single photo-counting or TCSPC (64.3 ps pulse width) module to determine τ. The measurements were performed at room temperature. The FP-coatings were also measured under constant heating at 50 °C in dark conditions. Both the devices after the photo- and thermal-processes were spectroscopically analyzed using the spectrofluorometer above-mentioned. Emission spectra under excitation of 375 nm and 490 nm as well as ϕ were measured. The time decay values were monitored and then adjusted to a biexponential decay fit using Origin 8b. To calculate the average lifetime for each FP-coating, the following equation was used:83 | (1) |
The SF-films were subjected to constant heating at 50 °C for 24 h, and the changes of the emission were also monitored. Both the devices after the photo- and thermal-processes were spectroscopically analyzed using the aforementioned spectrofluorometer. Transmittance spectra were acquired with a UV-vis spectrometer UV-2600 (Shimadzu), using a wavelength range 200–800 nm, scan speed medium, threshold 0.01 and a slit width of 2.0.
Thermogravimetric curves were measured with a TGA-Q50 (TA instruments) analyzer under an N2 atmosphere with a flow rate of 90 mL min−1, and a temperature ramp of 10 °C min−1 from room temperature up to 450 °C. Modulated differential scanning calorimetry was performed with a Q200 (TA Instruments) with a modulation of 0.48 °C every 60 s and a temperature ramp of 3 °C min−1 from 20 to 300 °C.
Atomic force microscopy (AFM) was performed with a Park XE150 instrument in ambient conditions, using Si cantilevers with a nominal spring constant of 40 N m−1, and a tip radius <10 nm. Topography images (45 × 45 μm scan size) were obtained by scanning the sample surface in non-contact mode, with a resolution of 512 pixels and a scan rate of 0.5 Hz. Roughness data were calculated using the image analysis XEI Park Systems software. Further characterization of the film morphology was performed using an optical microscope Olympus BX51 with an Olympus camera adaptor U-TV0.5XC-3-8. The films were placed onto a quartz slide and analyzed at 10× magnification. An augmentation of 10× was used to take the images.
The mechanical properties of the material were measured by applying the instrumented nanoindentation technique using a Hysitron TI 950 TriboIndenter equipped with a pyramidal Berkovich diamond indenter, with a tip radius of ∼350 nm. The area function for the tip was calibrated from indentations into a fused silica reference sample of known elastic modulus. Two types of load-controlled tests were performed: (1) “load–partial-unload” tests, up to a maximum load of 12 mN, which were used to identify penetration depths for which the hardness and modulus values are not affected by roughness and tip rounding effects and (2) quasi-static indentation tests, up to a maximum load of 4 mN and performed using load–hold–unload cycle times of 10–30–3 s, which were used to study the effects of creep on the measured properties. Arrays of 2 × 7 indentations were performed on each sample, with a spacing between indents of 25 μm in both the vertical and horizontal directions. Reduced elastic modulus (E) and hardness (H) were obtained from the analysis of load–displacement curves by the Oliver and Pharr method,84 using the following equations:
 | (2) |
 | (3) |
4.6. Device preparation and characterization
The bio-phosphors were placed at different distances from a 450 nm LED (WINGER Electronics) and irradiated at 200 mA at room conditions. The Bio-HLEDs were characterized using a Keithley 2400 as a current source, while the changes in the electroluminescence spectrum were monitored using an AVS-DESKTOP-USB2 (Avantes) in conjunction with a calibrated integrated sphere Avasphere 30-Irrad, while changes in the bio-phosphor temperature were monitored using a thermographic camera T430sc (FLIR).Conflicts of interest
There are no conflicts to declare.Acknowledgements
V. F.-L. and R. D. C. acknowledge the program “Ayudas para la atracción de talento investigador—Modalidad 1 of the Consejería de Educación, Juventud y Deporte—Comunidad de Madrid with the Reference No. 2016-T1/IND-1463.” R. D. C. acknowledges Spanish MINECO for the Ramón y Cajal program (RYC-2016-20891) and the Europa Excelencia program (ERC2019-092825). R. D. C. acknowledges the 2018 Leonardo Grant for Researchers and Cultural Creators from BBVA Foundation and the European Union's Horizon 2020 research and innovation programme under grant agreement No 863170. A. L. C. acknowledges the European Research Council ERC-CoG-648071-ProNANO, and the Spanish Ministry of Economy and Competitiveness (BIO2016-77367-R). This work was performed under the Maria de Maeztu Units of Excellence Program from the Spanish State Research Agency – Grant No. MDM-2017-0720 (CIC biomaGUNE).References
- L. D. Koh, Y. Cheng, C. P. Teng, Y. W. Khin, X. J. Loh, S. Y. Tee, M. Low, E. Ye, H. D. Yu, Y. W. Zhang and M. Y. Han, Prog. Polym. Sci., 2015, 46, 86–110 CrossRef CAS.
- C. Zhou, F. Confalonieri, N. Medina, Y. Zivanovic, C. Esnault, T. Yang, M. Jacquet, J. Janin, M. Duguet, R. Perasso and Z. Li, Nucleic Acids Res., 2000, 28, 2413–2419 CrossRef CAS PubMed.
- Z. Shao and F. Vollrath, Nature, 2002, 418, 741 CrossRef CAS PubMed.
- G. H. Altman, F. Diaz, C. Jakuba, T. Calabro, R. L. Horan, J. Chen, H. Lu, J. Richmond and D. L. Kaplan, Biomaterials, 2003, 24, 401–416 CrossRef CAS PubMed.
- M. A. Wilding and J. W. S. Hearle, in Polymeric materials encyclopedia, ed. J. C. Salamone, CRC Press, Boca Raton, Florida, 1996, pp. 8307–8322 Search PubMed.
- H. Perry, A. Gopinath, D. L. Kaplan, L. D. Negro and G. Omenetto, Adv. Mater., 2008, 20, 3070–3072 CrossRef CAS.
- A. Bucciarelli, V. Mulloni, D. Maniglio, R. K. Pal, V. K. Yadavalli, A. Motta and A. Quaranta, Opt. Mater., 2018, 78, 407–414 CrossRef CAS.
- H. Tao, D. L. Kaplan and F. G. Omenetto, Adv. Mater., 2012, 24, 2824–2837 CrossRef CAS PubMed.
- B. S. T. Parker, P. Domachuk, J. Amsden, J. Bressner, A. Lewis, D. L. Kaplan and F. G. Omenetto, Adv. Mater., 2009, 21, 2411–2415 CrossRef.
- X. Huang, G. Liu and X. Wang, Adv. Mater., 2012, 24, 1482–1486 CrossRef CAS PubMed.
- F. G. Omenetto and D. L. Kaplan, Science, 2010, 329, 528–531 CrossRef CAS PubMed.
- M. Humar, S. J. J. Kwok, M. Choi, A. K. Yetisen, S. Cho and S. H. Yun, Nanophotonics, 2017, 6, 414–434 Search PubMed.
- D. D. N. Rockwood, R. R. C. Preda, T. Yücel, X. Wang, M. L. Lovett and D. L. Kaplan, Nat. Protoc., 2011, 6, 1612–1631 CrossRef CAS PubMed.
- M. Irimia-Vladu, Chem. Soc. Rev., 2014, 43, 588–610 RSC.
- F. G. Omenetto and D. L. Kaplan, Nat. Photonics, 2008, 2, 641–643 CrossRef CAS.
- G. S. Perrone, G. G. Leisk, T. J. Lo, J. E. Moreau, D. S. Haas, B. J. Papenburg, E. B. Golden, B. P. Partlow, S. E. Fox, A. M. S. Ibrahim, S. J. Lin and D. L. Kaplan, Nat. Commun., 2014, 5, 3385 CrossRef PubMed.
- N. Lin, L. Cao, Q. Huang, C. Wang, Y. Wang, J. Zhou and X. Y. Liu, Adv. Funct. Mater., 2016, 26, 8885–8902 CrossRef CAS.
- S. Shabahang, S. Kim and S. Yun, Adv. Funct. Mater., 2018, 28, 1706635 CrossRef PubMed.
- S. Toffanin, S. Kim, S. Cavallini, M. Natali, V. Benfenati, S. Toffanin, S. Kim, S. Cavallini, M. Natali, M. Muccini and F. G. Omenetto, Appl. Phys. Lett., 2012, 101, 091110 CrossRef.
- N. Huby, V. Vié, A. Renault, S. Beaufils, T. Lefèvre, F. Paquet-Mercier, M. Pézolet and B. Bêche, Appl. Phys. Lett., 2013, 102, 123702 CrossRef.
- S. Kujala, A. Mannila, L. Karvonen, K. Kieu and Z. Sun, Sci. Rep., 2016, 6, 22358 CrossRef CAS PubMed.
- X. Qiao, Z. Qian, J. Li, H. Sun, Y. Han, X. Xia, J. Zhou, C. Wang, Y. Wang and C. Wang, ACS Appl. Mater. Interfaces, 2017, 9, 14665–14676 CrossRef CAS PubMed.
- N. Qi, B. Zhao, S.-D. Wang, S. S. Al-Deyab and K.-Q. Zhang, RSC Adv., 2015, 5, 50878–50882 RSC.
- R. Melikov, D. A. Press, B. G. Kumar, I. B. Dogru, S. Sadeghi, M. Chirea, İ. Yılgör and S. Nizamoglu, Sci. Rep., 2017, 7, 7258 CrossRef PubMed.
- V. Fernández-Luna, P. B. Coto and R. D. Costa, Angew. Chem., Int. Ed., 2017, 57, 8826–8836 CrossRef PubMed.
- E. Fresta, V. F. Luna, P. B. Coto and R. D. Costa, Adv. Funct. Mater., 2018, 28, 1707011 CrossRef.
- J. Casamayor, D. Su and Z. Ren, Light. Res. Technol., 2018, 50, 801–826 CrossRef.
- M. Bergamos and R. Höltig, Recycling options for LEDs and LED products. Electronics Goes Green 2012+, IEEE, Berlin, Germany, 2012.
- I. Jaadane, P. Boulenguez, S. Carré, M. Savoldelli, C. Martinsons and A. Torriglia, Free Radicals Biol. Med., 2015, 84, 373–384 CrossRef CAS PubMed.
- J. Hye Oh, S. Ji Yang and Y. Rag Do, Light: Sci. Appl., 2014, 3, e141 CrossRef.
- D. Van Norren and T. G. M. F. Gorgels, Photochem. Photobiol., 2011, 87, 747–753 CrossRef CAS PubMed.
- European Commission, Scientific Committee, (a) https://ec.europa.eu/health/scientific_committees/scheer/docs/scheer_q_002.pdf (accessed: January 5, 2019). (b) https://ec.europa.eu/health/scientific_committees/emerging_en (accessed: January 5, 2019).
- L. Niklaus, H. Dakhil, M. Kostrzewa, P. B. Coto, U. Sonnewald, A. Wierschem and R. D. Costa, Mater. Horiz., 2016, 3, 340–347 RSC.
- M. D. Weber, L. Niklaus, M. Pröschel, P. B. Coto, U. Sonnewald and R. D. Costa, Adv. Mater., 2015, 27, 5493–5498 CrossRef CAS PubMed.
- L. Niklaus, S. Tansaz, H. Dakhil, K. T. Weber, M. Pröschel, M. Lang, M. Kostrzewa, P. B. Coto, R. Detsch, U. Sonnewald, A. Wierschem, A. R. Boccaccini and R. D. Costa, Adv. Funct. Mater., 2017, 27, 1601792 CrossRef.
- C. F. Aguiño, M. Lang, V. Fernández-Luna, M. Pröschel, U. Sonnewald, P. B. Coto and R. D. Costa, ACS Omega, 2018, 3, 15829–15836 CrossRef PubMed.
- S. Nizamoglu, SDÜ Fen Bilim. Enstitüsü Derg., 2016, 20, 490–495 CrossRef.
- D. A. Press, R. Melikov, D. Conkar, E. N. Firat-Karalar and S. Nizamoglu, Adv. Photonics, 2016, pp. NoTu2D-3 Search PubMed.
- V. Fernández-luna, D. S. Alcázar, J. P. Fernández-blázquez, A. L. Cortajarena, P. B. Coto and R. D. Costa, Adv. Funct. Mater., 2019, 29, 1904356 CrossRef.
- A. Espasa, M. Lang, C. F. Aguiño, D. Sanchez-dealcazar, J. P. Fernández-blázquez, U. Sonnewald, A. L. Cortajarena, P. B. Coto and R. D. Costa, Nat. Commun., 2020, 11, 1–10 CrossRef PubMed.
- X. Wang, Z. Li, W. Ying, D. Chen, P. Li, Z. Deng and X. Peng, J. Mater. Chem. C, 2020, 8, 240–246 RSC.
- X. Wang, Y. Guo, Z. Li, W. Ying, D. Chen, Z. Deng and X. Peng, RSC Adv., 2019, 9, 9777–9782 RSC.
- M. S. P. Reddy and C. Park, Sci. Rep., 2016, 6, 32306 CrossRef CAS PubMed.
- K. Benson, A. Ghimire, A. Pattammattel and C. V. Kumar, Adv. Funct. Mater., 2017, 27, 1702955 CrossRef.
- N. Hendler, B. Belgorodsky, E. D. Mentovich, M. Gozin and S. Richter, Adv. Mater., 2011, 23, 4261–4264 CrossRef CAS PubMed.
- I. Yuruker, S. U. Arik, M. Tamdogan, E. Melikov, R. Nizamoglu, S. Press and D. A. Durak, Advanced fabrication and manufacturing; emerging technology frontiers; energy, health and water- applications of nano-, micro- and mini-scale devices; MEMS and NEMS; technology update talks; thermal management using micro channels, jets, sprays, ASME, San Francisco, California, USA, vol. 3, 2015 Search PubMed.
- A. Aires, V. Fernández-luna, J. Fernandez-cestau, R. D. Costa and A. L. Cortajarena, Nano Lett., 2020, 20, 2710–2716 CrossRef CAS PubMed.
- S. An, H. S. Jo, Y. Il Kim, K. Y. Song, M.-W. Kim, K. B. Lee, A. L. Yarin and S. S. Yoon, Nanoscale, 2017, 9, 9139–9147 RSC.
- S. Pratap, R. Mallem, K. Im, J. Lee, C. Park and P. Chao, Opt. Mater., 2019, 95, 109270 CrossRef.
- D. Zhou, H. Zou, M. Liu, K. Zhang, Y. Sheng, J. Cui, H. Zhang and B. Yang, ACS Appl. Mater. Interfaces, 2015, 7, 15830–15839 CrossRef CAS PubMed.
- H. Tetsuka, A. Nagoya and R. Asahi, J. Mater. Chem. C, 2015, 3, 3536–3541 RSC.
- M. Sun, S. Qu, Z. Hao, W. Ji, P. Jing, H. Zhang, L. Zhang, J. Zhao and D. Shen, Nanoscale, 2014, 6, 13076–13081 RSC.
- J. Gotta, T. Ben Shalom, S. Aslanoglou, A. Cifuentes-Rius and N. H. Voelcker, Adv. Funct. Mater., 2018, 28, 1706967 CrossRef.
- T. Iizuka, H. Sezutsu, K. Tatematsu, I. Kobayashi, N. Yonemura, K. Uchino, K. Nakajima, K. Kojima, C. Takabayashi, H. Machii, N. Kuwabara, T. Nakamura, K. Yoshii and T. Tamura, Adv. Funct. Mater., 2013, 23, 5232–5239 CrossRef CAS.
- J. Chao, D. Wook, O. Joo, S. Kim, C. Seok, J. Ren, H. Yoo, S. Yoon, J. Eun, Y. Ri and H. Kweon, Biomaterials, 2015, 70, 48–56 CrossRef PubMed.
- S. Putthanarat, R. K. Eby, R. R. Naik, S. B. Juhl, M. A. Walker, E. Peterman, S. Ristich, J. Magoshi, T. Tanaka, M. O. Stone, B. L. Farmer, C. Brewer and D. Ott, Polymer, 2004, 45, 8451–8457 CrossRef CAS.
- B. Zhu, H. Wang, W. R. Leow, Y. Cai, X. J. Loh, M. Han and X. Chen, Adv. Mater., 2016, 28, 4250–4265 CrossRef CAS PubMed.
- L. Fernández-García, N. Marí-Buyé, J. A. Barios, R. Madurga, M. Elices, J. Pérez-Rigueiro, M. Ramos, G. V. Guinea and D. González-Nieto, Acta Biomater., 2016, 45, 262–275 CrossRef PubMed.
- I. Chul, H. Yong, K. Gill and Y. Hwan, Biol. Macromol., 2003, 33, 203–213 CrossRef PubMed.
- I. Chul, H. Kweon, Y. Hwan and S. Hudson, Biol. Macromol., 2001, 29, 91–97 CrossRef.
- Y. Gotoh, M. Tsukada, T. Baba and N. Minoura, Polymer, 1997, 38, 487–490 CrossRef CAS.
- H. Kweon and Y. H. Park, J. Appl. Polym. Sci., 2001, 82, 750–758 CrossRef CAS.
- H. Y. Kweon, I. C. Um and Y. H. Park, Polymer, 2000, 41, 7361–7367 CrossRef CAS.
- H. Y. Kweon and Y. H. Park, J. Appl. Polym. Sci., 1999, 73, 2887–2894 CrossRef CAS.
- G. Freddi, P. Monti, M. Nagura, Y. Gotoh and M. Tsukada, J. Polym. Sci., Part B: Polym. Phys., 1997, 35, 841–847 CrossRef CAS.
- M. Tsukada, G. Freddi, Y. Gotoh and N. J. Kasai, J. Polym. Sci., Part B: Polym. Phys., 1994, 32, 1407–1412 CrossRef CAS.
- M. Nagura, S. Yamazaki and M. Tsukada, Proceedings of the 7th International Wool Textile Conference, 1985, p. 345.
- M. Tsukada, J. Polym. Sci., Part B: Polym. Phys., 1986, 24, 457–460 CrossRef CAS.
- D. M. Ebenstein, J. Park, D. L. Kaplan and K. J. Wahl, MRS Online Proc. Libr., 2004, 841, 1–6 Search PubMed.
- N. V. Visser, J. W. Borst, M. A. Hink, A. Van Hoek and A. J. W. G. Visser, Biophys. Chem., 2005, 116, 207–212 CrossRef CAS PubMed.
- A. Ghisaidoobe and S. Chung, Int. J. Mol. Sci., 2014, 15, 22518–22538 CrossRef CAS PubMed.
- M. Cotlet, J. Hofkens, M. Maus, T. Gensch, M. Van der Auweraer, J. Michiels, G. Dirix, M. Van Guyse, J. Vanderleyden, A. J. W. G. Visser and F. C. De Schryver, J. Phys. Chem. B, 2002, 105, 4999–5006 CrossRef.
- T. Taki and M. Strassburg, ECS J. Solid State Sci. Technol., 2020, 9, 015017 CrossRef CAS.
- Y. Xue, S. Lofland and X. Hu, Polymers, 2019, 11, 456 CrossRef PubMed.
- G. Jung, S. Mais, A. Zumbusch and C. Bräuchle, J. Phys. Chem. A, 2000, 104, 873–877 CrossRef CAS.
- W. Weber, V. Helms, J. A. McCammon and P. W. Langhoff, Proc. Natl. Acad. Sci. U. S. A., 1999, 96, 6177–6182 CrossRef CAS PubMed.
- A. M. Bogdanov, E. A. Bogdanova, D. M. Chudakov, T. V. Gorodnicheva, S. Lukyanov and K. A. Lukyanov, Nat. Methods, 2009, 6, 859–860 CrossRef CAS PubMed.
- C. C. David, P. Dedecker, G. D. Cremer, N. Verstraeten, C. Kint, J. Michiels and J. Hofkens, Photochem. Photobiol. Sci., 2012, 11, 358–363 RSC.
- R. Ando, H. Mizuno and A. Miyawaki, Science, 2004, 306, 1370–1373 CrossRef CAS PubMed.
- N. Hendler, E. D. Mentovich, B. Belgorodsky, D. Rimmerman and S. Richter, ChemPhysChem, 2013, 14, 4065–4068 CrossRef CAS PubMed.
- K. Benson, A. Ghimire, A. Pattammattel and C. V. Kumar, Adv. Funct. Mater., 2017, 27, 1702955 CrossRef.
- C. Ezquerro, E. Fresta, E. Serrano, E. Lalinde, J. García-Martínez, J. R. Berenguer and R. D. Costa, Mater. Horiz., 2019, 6, 130–136 RSC.
- A. Sillen and Y. Engelborghs, Photochem. Photobiol., 1998, 67, 475–486 CAS.
- W. C. Oliver and G. M. Pharr, J. Mater. Res., 1992, 7, 1564–1583 CrossRef CAS.
Footnote |
| † Electronic supplementary information (ESI) available. See DOI: 10.1039/d0mh00503g |
| This journal is © The Royal Society of Chemistry 2020 |