Original polymorphism in a naphthalene bisimide π-conjugated organogelator: a complex interplay between hydrogen bonding and heterocycle π-stacking†
Morgane
Diebold
a,
Elliot
Christ
a,
Laure
Biniek
 a,
Lydia
Karmazin
 b,
Benoît
Heinrich
 c,
Christophe
Contal
a,
Suhrit
Ghosh
 *d,
Philippe J.
Mesini
 *ae and
Martin
Brinkmann
 *a
*a
aInstitut Charles Sadron, CNRS-Université de Strasbourg, 23 rue du Loess, Strasbourg 67034, France. E-mail: martin.brinkmann@ics-cnrs.unistra.fr; Philippe.mesini@ics-cnrs.unistra.fr
bInstitut de Chimie de Strasbourg, 1 rue Blaise Pascal, 67008 Strasbourg, France
cInstitut de Physique et Chimie des Matériaux de Strasbourg (IPCMS), UMR 7504 CNRS-Université de Strasbourg, 23 rue du Loess, BP43 67034 Strasbourg Cedex 2, France
dIndian Association for the Cultivation of Science, School of Applied and Interdisciplinary Sciences, 2A & 2B Raja S. C. Mullick Rd., Kolkata, India. E-mail: psusg2@iacs.res.in
eInternational Center for Frontier Research in Chemsitry, 8 allée Gaspard Monge, 67000 Strasbourg, France
First published on 9th October 2019
Abstract
This study focuses on the structure of different supramolecular assemblies formed in the gel phase and in the solid state by a naphthalene-bisimide organogelator: N,N′-di(2-(3,4,5-trioctyloxybenzamido))eth-1-yl naphthalene-1,4,5,8 tetracarboxylic acid bisimide (NDI2). This molecule is formed by a naphthalene bisimide core with symmetric dendrons composed of a flexible alkyl linker, an amide group and a trialkoxyphenyl group. The structure, especially the original polymorphism of this molecule, was correlated with optical and electronic properties in the solid state. Four polymorphs have been prepared in pure form: a dried gel phase, a quenched metastable liquid crystalline phase, a crystalline phase and its sister phase with molten alkyl side chains. The molecular packing of those phases was determined by X-ray diffraction, electron diffraction and high resolution TEM. UV-vis and infrared spectroscopy of the polymorphs uncover the nature of intermolecular π-stacking and H-bonding interactions. In the fibrils of the gel phase, NDI2 molecules form columnar stacks and the fiber axes correspond to the direction of H-bonds between amide groups. The crystalline phase shows an unusual packing where each NDI is π-stacked between two phenyl groups of the adjacent NDI2 molecules. In the metastable LC phase NDI2 molecules assemble into 6/1 supramolecular helices grouped in a frustrated trigonal unit cell. Temperature-dependent TEM, UV-vis and FTIR helped to unveil the molecular reorganization upon transformation between these different polymorphs. Finally, a global phase diagram has been obtained.
I. Introduction
Rylene bisimides form a unique and interesting class of organic semiconductors widely used in the community of plastic electronics.1–3 Rylene bisimides such as perylene and naphthalene bisimides are robust and versatile building blocks for the synthesis of new molecular and polymer semiconductors with interesting electronic properties e.g. n-type charge transport in OFETs4–7 or high luminescence of interest for sensor application.8–10 Their excellent thermal and oxidative stability as well as high electron affinities are readily exploited to design n-type semiconductors with high charge mobilities >0.5 cm2 V−1 s−1.11,12 The electronic and optical properties of individual rylene bisimide molecules can be tuned by molecular engineering and adequate choice of substituents.3,13–16 However, their collective properties in the solid state depend on molecular packing. For instance, they can form different polymorphs made of either J- or H-type aggregates, as observed for perylene bisimide (PBI) derivatives.17–20 In PBI-based organogelators, the competition between H-bonding and π–π stacking interactions determines the organization in the supramolecular assemblies, hence the electronic properties in the solid state.21,22 Depending on the lateral substituents, perylene and naphthalene bisimides can form a large variety of structures in the solid state e.g. crystalline and liquid crystalline phases, and can also form physical gels in organic solvents. The gelation of solvents by rylene bisimides has been described in the literature,23 but the structures formed in the gels are only marginally described. In many cases, the fibrilar aggregates formed upon gelation are made of columnar or helical supramolecular stacks driven by H-bonding interactions.24–26 However, at the same time, organogelators are also subject to polymorphism and the structures formed in organic solvents may transform to different supramolecular arrangements when the films are subjected to thermal annealing after drying of the gel for instance. As an example, a PBI-based organogelator similar in molecular structure to NDI2 (see Fig. 1) forms fibrillar J-aggregates in the dried gel that transform to H-aggregates upon thermal annealing.21 Both aggregates compose very different structures: the first columnar structures, the second 21/1 supramolecular helices packed in a hexagonal frustrated trigonal cell.22 Interestingly, the H-aggregates transform back to J-aggregates when exposed to vapors of H-bonding non solvents (acetone or ethanol). Therefore, the polymorphism of organogelators based on rylene bisimide can be used to design stimuli-responsive materials.21,22 Moreover, association of PBI-based semiconductors and electron donor polymers such as P3HT lead to nanostructured shish-kebab morphologies interesting for photovoltaic applications.27In this manuscript, we study N,N′-di(2-(3,4,5-trioctyloxybenzamido))eth-1-yl naphthalene-1,4,5,8 tetracarboxylic acid bisimide (NDI2, Fig. 1). Ghosh et al. reported the gelation of this compound and proposed a model of columnar stacking based with H-bonds between amides of successive molecules, on simulation.15 Herein we conducted structural studies on the self-assembly of NDI2. These investigations showed the existence of four polymorphs. In the first part, we identify the distinct polymorphs by their morphology (studied by OM, TEM or AFM), their X-ray diffractograms and by their transitions by DSC. In the second part, the existence and magnitude of π-stacking and H-bonds is examined by UV-vis and FTIR spectroscopy. Finally we study the structure of each polymorph by electron or X-ray diffraction.
II. Experimental section
(a) Synthesis
NDI-2 (N,N′-di(1-(3,4,5-tri(octyloxy)benzamido))eth-1yl naphthalene-1,4,5,8 tetracarboxylic acid bisimide) was synthesized according to the synthetic method described in the literature15 or with a modified procedure (ESI†). All solvents used to prepare the gels from solution were used as received except trans-decaline, filtered on a column of Al2O3.(b) Preparation of NDI2 polymorphs
Thin films of amorphous NDI2 were prepared by casting 50 μL of solution in chloroform (1 mg mL−1) on glass substrate or oriented poly(tetrafluoroethylene) (PTFE) substrate. These thin amorphous films were transformed in films of the various polymorphs by different treatments. Solvent vapor annealing (SVA) in chloroform afforded form I: the films were placed in a closed glass container filled with 5 mL of chloroform at room temperature for 1 day. Annealing at 240 °C afforded the form II and annealing at 200 °C the form IV; the cast films were annealed for 30 s in a Linkam hot stage under N2 atmosphere and cooled to 25 °C at a rate of 10 °C min−1.Oriented poly(tetrafluoroethylene) (PTFE) substrates are particularly well suited for the alignment of polymers and molecular materials. They were prepared by friction transfer on clean glass substrates following a described protocol.28
(c) Structural characterization
The polymorphs of NDI2 were identified with a Polarized Optical Microscope (POM) (Leica DMR-X, equipped with a Nikon Coolpix 995 digital camera) in phase contrast or under crossed polarizers. In situ temperature annealing experiments were carried out under the POM, in a Linkam LTS 420 heating plate, at heating or cooling rates of 50 °C min−1.Transmission electron microscopy was performed on a Philips CM 12 (120 keV) microscope equipped with a CCD MVIII digital camera. The samples were observed in bright field, high resolution and electron diffraction modes. Sample damage by the electron beam was avoided by low dose exposure. The rotation-tilt experiments were carried out using a Phillips PW6594 sample holder. The in situ temperature annealing experiments were carried out with a Gatan single tilt heating holder and a smart set 901 hot stage controller. For transmission electron microscopy (TEM) investigations, the NDI2 films were coated with a thin amorphous carbon film, removed from the glass substrate with polyacrylic acid, floated on distilled water and recovered on TEM copper grids. For studies of the fibers in the gel phase, droplets of the solution were directly cast on carbon coated TEM grids and the solvent was let evaporate. For the structural investigation on the crystalline form IV in thin films, oriented NDI2 films were prepared by casting a solution in chloroform on an oriented PTFE substrate. Thermal annealing at 220 °C yielded oriented crystals of form IV on the PTFE substrate. Image treatments were carried out with AnalySYS (Soft Imaging Systems). The structures were modeled and electron diffraction patterns calculated with the proper modules of the Cerius2 Software on a SiliconGraphics Octane workstation.
Atomic force microscopy (AFM) images were obtained with a Bruker Multimode controlled by a Nanoscope V module with a Si3N4 tip with a constant of 0.4 N m−1 and a terminal radius below 5 nm. NDI2 solutions were cast on clean silicon wafers and observed in peak force tapping oscillating at a frequency between 250 and 300 kHz. The images were treated with Nanoscope Analysis software.
The powder diffraction patterns were obtained with a transmission Guinier geometry. A linear focalized monochromatic Cu Kα1 beam (λ = 1.5405 Å) was obtained using a sealed-tube generator equipped with a bent quartz monochromator and diffraction patterns were recorded with a curved Inel CPS120 counter gas-filled detector. The samples were filled in Lindemann capillaries of 1 mm diameter. The peaks of the powder diffraction patterns were indexed and the unit cell extracted (form I) with the TREOR program.
X-Ray diffraction data collection was carried out on a Bruker APEX II DUO Kappa-CCD diffractometer equipped with an Oxford Cryosystem liquid N2 device, using Cu-Kα radiation (λ = 1.54178 Å). The crystal-detector distance was 40 mm. The cell parameters were determined (APEX2 software)29 from reflections taken from three sets of 20 frames, each at 10 s exposure. The structure was solved by direct methods with the program SHELXS-2013.30 The refinement and all further calculations were carried with the same software. The hydrogen H2N was located from Fourier difference maps and refined isotropically. The other H-atoms were included in calculated positions and treated as riding atoms using SHELXL default parameters. The non-H atoms were refined anisotropically, using weighted full-matrix least-squares on F2. A semi-empirical absorption correction was applied using SADABS in APEX2;31 transmission factors: Tmin/Tmax = 0.6385/0.7528. The atoms C23 and C24 are disordered over two positions with an occupancy ratio of 0.6/0.4.
(d) Spectroscopy (UV-vis and FTIR)
UV-visible spectroscopy was performed on an Agilent Cary 5000 spectrometer with a resolution of 0.5 nm. The in situ temperature annealing experiments were carried out at a rate of 50 °C min−1 for both heating and cooling ramps using a Linkam LTS 420 heating plate fitted inside the sample chamber of the spectrometer. The spectra were measured every 10 °C after holding the temperature during one min under N2 flow.The FTIR spectra were measured with a Bruker Vertex 70 spectrophotometer in transmission mode. The spectra were measured with a resolution of 1 cm−1 and an accumulation of 64 scans. The films of form I were obtained on a NaCl plate by drop casting from a solution in chloroform (1 mg mL−1) then by solvent vapor annealing with chloroform in a dessicator. The form II and III films were obtained by annealing films on NaCl in a Linkam heating stage under nitrogen, at 240 °C and 200 °C respectively, for 30 s and quenched at room temperature. The in situ temperature annealing experiments were carried out at a rate of 50 °C min−1 for both heating and cooling ramps using a Linkam LTS 420 heating plate fitted inside the sample chamber of the spectrometer. The spectra were measured every 5 °C after holding the temperature during 2 min.
(e) Thermal measurements
Differential scanning calorimetry (DSC) was performed with a PerkinElmer DSC 8500, with heating and cooling rates of 10 °C min−1. The thermogravimetric analyses (TGA) were performed with a Mettler TG50 microscale and a Mettler TC10A controller. For these experiments, the powders were placed in alumina crucibles under N2 and temperature was increased at 10 °C min−1.III. Results and discussion
(a) Identification of the polymorphs and their interconversions
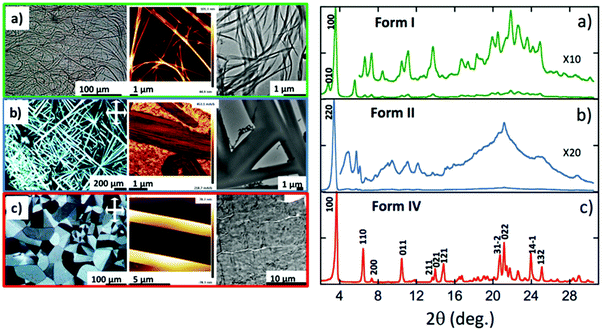
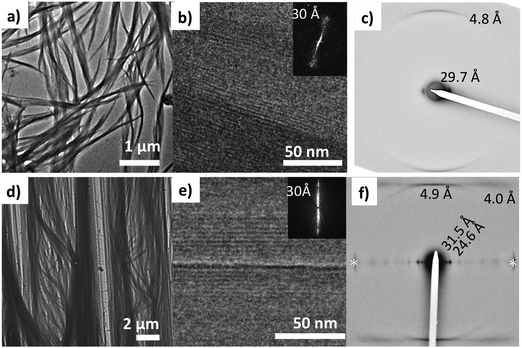
As described previously in the literature, NDI2 can form gels in various solvents.15 The solubility of NDI2 has been assayed at a concentration of 5 mg mL−1 (Table S1, ESI†). It gels in p-xylene, cyclohexane and trans-decaline (TD), precipitates in acetone or alcohols and is completely soluble in chloroform up to 15 mg mL−1. Gels of NDI2 were prepared in TD and dried. The resulting form is called form I. Its structure was analyzed by AFM and TEM (Fig. 2a). NDI2 self-assembles in very long fibers, tens of microns in length. These fibers show only limited birefringence in POM and therefore, they can be identified only in phase contrast in optical microscopy. The poor birefringence suggests limited crystallinity. Upon heating, the gels undergo a gel-to-sol transition, which corresponds to the dissociation of the compound.Incidentally, we found that amorphous films of NDI2 (prepared by casting chloroform solutions) transform into the same fibrillar structures as in the dried gel phase (form I) when subjected several hours to solvent vapor annealing (SVA) in chloroform.
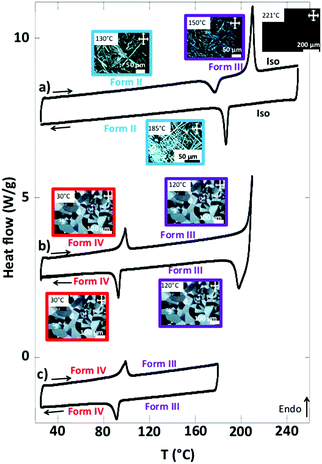
Beside the dried gel phase, DSC and POM evidence other polymorphs. Their morphologies and X-ray diffractograms in the solid state are described in Fig. 2b and c. Table S2 (ESI†) collects the transition temperatures between the different phases.
When the form I is annealed at T > 170 °C, it yields large and highly birefringent spherulites: form IV (Fig. 2c). The X-ray diffractograms of this phase show sharp and intense peaks, which indicate a more crystalline structure than the other forms. TEM also show the spherulites consist of a crystalline phase (Fig. S1, ESI†). They melt at 210 °C (Fig. 3b and Table S2, ESI†). Before they melt, at 99 °C, they undergo an endothermic transition toward another phase: form III. This transition is reversible: upon cooling, at 93 °C, the symmetrical exothermic transition occurs and yields back the form IV (Fig. 3b and c).
The thermograms are reversible as long as the species are molten below 220 °C. But when the form IV is heated at 240–250 °C and cooled afterward, it forms a different phase: form II. It consists of long and strongly birefringent needle-shaped crystals (Fig. 2b), very different from the morphology of form III and IV. The diffractograms of form II, distinct of those of forms I and IV (Fig. 2a and c), show a different and pure phase. At 177 °C, form II transforms to form III as shown by the exotherm peak (Fig. 3a); therefrom, it finally transforms back into form IV when cooled back to RT (data not shown), which ensures that form II is not produced by a degradation of NDI2. The limited set of reflections in form II (Fig. 2b) hints at a liquid crystalline phase (columnar phase), which is also confirmed by TEM (see Section e). Accordingly, form II is considered as a quenched LC phase obtained upon cooling from the isotropic melt heated at T ≥ 240 °C.
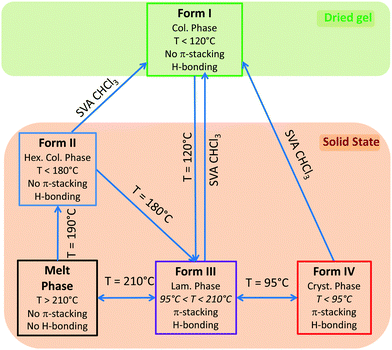
Fig. 4 illustrates the solid state phase diagram of NDI2. This diagram summarizes the different ways to interconvert the four identified polymorphs of NDI2. As such, the polymorphism of this organogelator is very complex and is seldom observed for similar compounds.
(b) Spectroscopic signatures of the polymorphs of NDI2
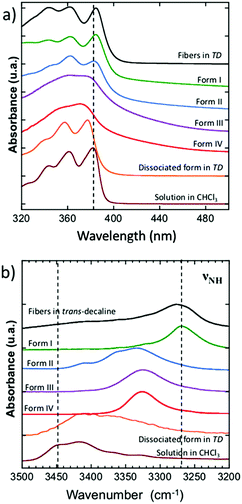
The UV-vis and FTIR spectra of the polymorphs I, II and IV were measured at RT, those of the polymorph III at 110 °C since it exists only between 95 °C and 210 °C (Fig. 5). UV-vis spectroscopy identifies π-stacking by the broadening and shifting of absorption features accompanying molecules association.32 FTIR spectroscopy helps to determine the strength of H-bonds for instance by following the νNH bands of the amides.33The dried gel (form I) and the fibers obtained in trans-decaline (TD) show the same UV-vis spectra, with a vibronic structure similar to those of the dissociated NDI2 molecules in chloroform or in TD at temperatures above the melting point of the gel (Fig. 5a). The main peaks do not broaden in the associated state. Only the main 0–0 and 0–1 peak positions are slightly blue shifted when dissociated (377 nm in TD, 382 nm in CHCl3, 385 nm for form I and gel). This suggests marginal π-overlaps between NDI units of the fibers in the gel or in the dried gel (form I). The UV-vis spectrum of form II is also a vibronic structure similar to that of dissociated NDI2, typical of marginal π-stacking. The UV-vis spectra of form III and IV are very different with two broad bands centered at 362 and 375 nm. Such broad absorption spectrum has been also observed for the analogue of NDI, N-substituted by cyclohexylmethyl,32,34 and explained by a strong orbital overlaps between NDI molecules in the unit cell. These results suggest that NDI molecules show stronger π-interactions in form III and IV than in form I and II.
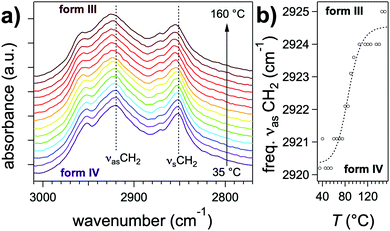
Further differences between polymorphs are observed in the FTIR spectra, in the 3200–3500 cm−1 area that features the characteristic amide band(s) νNH (NH stretching) (Fig. 5b). The position of this band reflects the intensity of H-bonds: it shifts to lower energies when the intensity of H-bonding increases.35 The gel phase (form I) has the νNH band with the lowest energy at 3269 cm−1, proving that H-bonds are the strongest in this polymorph. The form II shows a band composed of three components at 3333, 3360, 3410 cm−1. The last peaks has a position close to that observed in the melt where no H-bonds are present. It suggests that in the form II mesophase a fraction of the amides are non-bonded. The presence of different populations of amides H-bonded with different strengths is consistent with the picture of a LC phase containing structural disorder in the stacking of NDI2 molecules. In the crystalline structure (IV), νNH is located at 3325 cm−1, which indicates that H-bonds are weaker than in the gel phase (form I). Form III and IV have identical FTIR spectra except the frequencies of the CH stretching bands (νCH2) (Fig. 6). The asymmetric stretching band shifts from 2921 cm−1 in form IV to 2925 cm−1 in form III. This shift shows that the alkyl chain are crystallized in form IV, and disordered in form III. Indeed the lower frequency indicates alkyl chains in all-trans conformation, and this frequency increases with the ratio of gauche/trans conformations in the chains.36,37
(c) Structure of the gel and form I
Electron diffraction performed on a bundle of fibers (see Fig. 7a) shows two reflections at 4.8 Å and 29.7 Å. They correspond respectively to the inter-molecular distance between NDI2 molecules in the columns and the inter-columnar distance. The 4.8 Å period is characteristic of H-bonded amides. It is oriented along the long fiber axis, which indicates that the fiber long axis corresponds to the direction of H-bonding.38 The columnar arrangement of NDI2 molecules is further ascertained by low dose high resolution TEM (HRTEM) showing fringes with a 30 Å periodicity. The contrast in HRTEM images is attributed to the difference in the electronic density between the aromatic core and the adjacent layers of alkyl side chains.To gain more insight in the structure of the gel phase (form I), attempts were made to orient this phase in thin films. As discussed in section (a), the form I can be prepared by annealing an amorphous film of NDI2 (cast from chloroform solution) in chloroform vapors (several hours). With the same protocol on oriented PTFE substrates, NDI2 fibrils grow parallel to the PTFE substrate (Fig. 7b). From TEM analysis, these aligned films have the same structure as the dried gel: a columnar-phase with H-bonding directed along the fiber long axis. The electron diffractograms shows the same reflections as the dried gel and two additional reflections at 24.6 Å and 4.0 Å. The HRTEM images reveal the same columnar stacking with a 30 Å repeat period as observed in the dried gel. Accordingly, the dried gel and the oriented films prepared by SVA in chloroform correspond to the same polymorph (form I).
This structure of form I, as observed by TEM, is confirmed by the powder X-ray diffraction pattern of powder samples prepared by SVA in CHCl3 (Fig. 2a). The diffractogram has no peak in common with the other polymorphs, which indicates a pure phase. The most intense peaks at 24.3 Å and 31.6 Å are close to those observed by ED for the oriented fibers on PTFE substrates. This diffraction pattern was indexed, yielding a monoclinic unit cell: a = 24.3 Å, b = 32.3 Å, c = 9.9 Å, β = 97.0° and Z = 4. The c axis corresponds to the H-bonding direction of the NDI2 molecules, it is twice the H-bonding period of 4.8–4.9 Å measured in the fibers in the dried gel. This implies that the two molecules along the c axis are related by a symmetry element, possibly a 2/1 axis given the systematic absence of the hkl reflections in the ED pattern of oriented fibers. The unit cell parameters suggest a columnar arrangement.
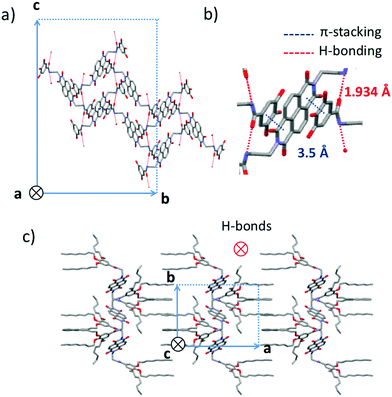
(d) Structure of forms IV and III
Crystallization of NDI2 in a mixture of methanol/chloroform afforded single crystals of form IV that were subjected to X-ray diffraction analysis. We verified that the structure of the single crystals is identical to the structure observed in the films showing large spherulites. Rotation-tilt experiments on the spherulites afford the same cell parameters than by 3D crystallography (Fig. S1, ESI†). The experimental ED pattern in thin films can be perfectly accounted by the calculated ED pattern for the [100] zone using the single crystal structure (Fig. S2, ESI†). The unit cell is monoclinic with the following parameters a = 24.3 Å, b = 16.2 Å, c = 9.9 Å and β = 97.1°. Fig. 8 shows some characteristic projections of the refined crystal structure. The obtained molecular packing of NDI2 in form IV is far from the “expected” packing for such molecules, based on long-range π-stacking of the NDI cores. In form IV, NDI cores do not π-stack together and cannot form columnar stacks. Most surprisingly, each NDI is π-stacked between the phenyl groups of two dendrons belonging to two adjacent NDI2 molecules (Fig. 8b). This π-stacking interaction between NDI and phenyl groups accounts for the shift and the broadened UV-vis absorption spectrum of form IV as compared to forms I and II. In addition, the organization of NDI2 is hinged on intermolecular H-bonds between amides. The H-bonds are along the c axis of the unit cell (Fig. 8a). Only one population of H-bonded amides is present in this structure, in agreement with the IR results showing a single amide band at 3325 cm−1. As shown by the projection along the c axis in Fig. 8c, the structure alternates layers of interdigitated alkyl side chains and layers of π-stacked phenyl/NDI/phenyl.As described above, the form III is obtained by heating form IV at a temperature above 99 °C. The FTIR spectra shows that form III has the same structure as form IV, with the same H-bonds between amides, but with disordered side chains. The IV to III transition occurs with an enthalpy of 24–28 kJ mol−1, consistent with the melting of the side chains. Temperature-dependent TEM demonstrates that the core of the structure is identical in form III and IV (Fig. S2, ESI†). The ED patterns at different temperatures have the same well-defined reflections at almost the same positions, but their relative intensities change. At 35 °C, in the starting form IV, the 040 and the 0 ± 2 ± 2 reflections are the most intense ones. At 150 °C, in the form III, the 0 ± 1 ± 1 reflections are the most intense ones. After cooling back the sample to 30 °C, the original pattern of form IV is recovered, which underlines the reversibility of the form IV → form III transition. This result indicates that form III is isostructural to form IV modulo the alkyl side chains that are crystallized in form IV and molten in form III. To verify this point, the ED pattern of form III for the [100] zone was calculated from the model of structure of form IV but without alkyl side chains (Fig. S2, ESI†). In the calculated pattern, the most intense reflections are the same as in the experimental pattern at 150 °C. This result confirms the strong analogy in the structure of form IV and III.
The structure of the form III and IV both present the NDI stacked between the phenyl groups. This structure is explained by the tendencies of the electron deficient NDI to form alternate stacks with an electron-rich aromatic compounds leading to co-crystallization of both.39 It has been encountered in various molecules containing both kind of units within the same molecules: for instance in a NDI – bithiophene copolymer40 or in the aedamer oligomers investigated by Iverson et al. where alternate 1,5-dialkoxynaphthalene and NDI units tethered via a flexible linker folds back and stack on each other.41 In that case, the stacking between NDI and the other aromatic species is intramolecular, whereas in the present study it is intermolecular, which is relatively rare.42 In the present study, the length of the spacer and its flexibility allows the backfolding. It can be anticipated that the position of the amide group and the length of the flexible alkyl spacer influences strongly the electronic properties of such NDI derivatives.34,43 In conclusion, the dendron and amide groups designed to scaffold the self-assemblies, may prevent the NDI to stack.
(e) Structural model for the quenched LC phase
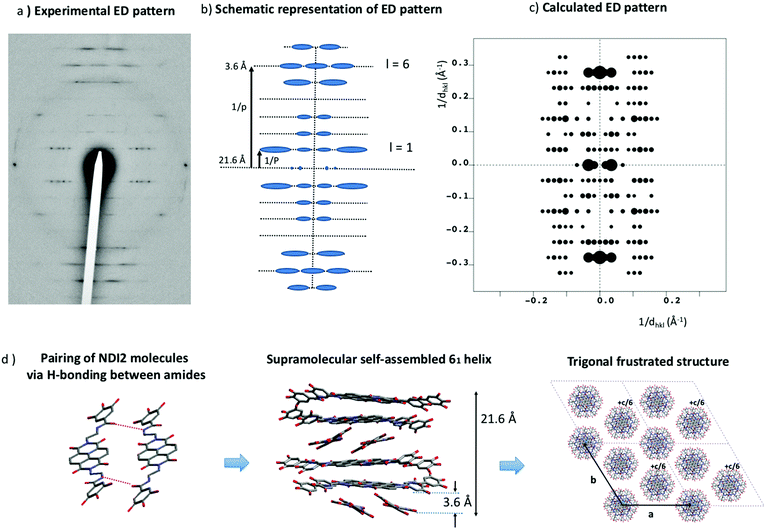
The XRD pattern obtained for form II indicates a columnar mesophase with a possible intra-columnar repeat distance of 4.2 Å from the peak around 21.2° (Fig. 2b), and no other information. Therefore, thin oriented films of form II were prepared on oriented substrates of PTFE and their structure analyzed by electron diffraction. Upon melting and recrystallization, highly oriented needles of form II are readily oriented on PTFE. Fig. 9a shows the typical ED pattern for such oriented films. First, this pattern reveals a remarkable level of organization that could not be inferred from the powder XRD pattern. The reflections are located on a set of layered lines perpendicular to the long axis of the needles. Strong reflections are observed on the 1st, 5th, 6th and 7th layer lines (see schematic illustration, Fig. 9b). The first meridional reflection is located on the 6th layer line. This indicates that NDI2 self-assembles into 6/1 helices with the helix axis parallel to the PTFE chain direction. Indeed, in the diffraction pattern of a 6/1 helical structure the reflections are located on layer lines with index l defined as l = 6m ± n where m and n are integers.44–46 The stacking period between NDI2 molecules is p = 3.6 Å and the helical long period P = 21.6 Å. This means that successive layers of NDI2 molecules in the helices are rotated by 60° around the helical axis. The fact that rylene-based molecules can form such helical assemblies has been demonstrated previously for perylene bisimide derivatives by circular dichroism measurements and electron diffraction.22,25 Recently, a PBI derivative similar to NDI2 showed the formation of 21/1 supramolecular helices.22 HRTEM gives further evidence of helical assemblies: regular fringed ED patterns are observed by HRTEM when the films are tilted at ±30° around the helical axis but not at 0° tilt (Fig. S3, ESI†). The period for the HRTEM image equals 26 Å and is identical to the inter-columnar period observed by XRD and by electron diffraction. The rotation-tilt experiment also shows that the intensity of the 26 Å peak is maximum for ±30° tilt around the column axis. Both these observations demonstrate that the helices are packed in a trigonal unit cell.Despite the disorder in form II, inherent to its liquid crystalline character, the helical columnar phase of NDI2 was modeled based on the ED pattern in Fig. 9a. As shown by Percec and coworkers, analogous PBI-based molecules show similar helical assemblies.47,48 The supramolecular assemblies are made of dimers stacked along the helical axis. The core of these helices contains the conjugated cores, whereas the dendron groups form the disordered corona of the helices. The same packing was recently uncovered in the case of a PBI analogue of NDI2 by Sarbu et al.22 In the present study, a supramolecular helical assembly has been constructed from dimers of NDI2 linked together by H-bonds as shown in Fig. 9d. In this assembly, H-bonds form only within the dimers and not between layers of dimers in the helices. This assumption is supported by the fact that the distance between NDI2 dimers along the helical axis is typical of π-stacking (3.6 Å) whereas in form I and IV, the distance between NDI2 is typical of H-bonded amides i.e. 4.8–4.9 Å. In the dimers shown in Fig. 9d, not all the amides of the NDI2 molecules are linked by H-bonds. This is consistent with the FTIR spectra of form II that has shown the coexistence of different populations of amides with different H-bonding strengths.
The barycenter of each dimer can be located either on the helical axis or ex-centered. The distance from the barycenter to the helical axis was used as a variable to calculate the ED patterns, as proposed previously by Sarbu et al.22 In a first approximation, the ED pattern was calculated for a trigonal unit cell containing a single helix (a = b = 30 Å, c = 21.6 Å and γ = 120°), to verify if it reproduces properly the intensities of the various layer lines. As a matter of fact, only ex-centered helical assemblies reproduce correctly the intensities in the 1st, 5th, 6th and 7th strata of the experimental ED pattern. A distance of 1.5 Å was found optimal. Ex-centering the dimers also reduces the π-stacking between NDI cores in the helices, which is consistent with the low broadening and shifts of the UV-vis bands in form II. A cell with a single helix does not afford a satisfactory density (form IV shows a density of 1.16 g cm−3). As proposed in our recent study on a PBI-analogue of NDI2, three helices of NDI2 molecules are associated in a triplet in a trigonal unit cell. A crystal density of 1.18 g cm−3 is obtained for a trigonal unit cell with a = b = 58 ± 2 Å, c = 21.6 Å and γ = 120°. Such a large unit cell is also supported by the repeat period between reflections in the 1st layer line of the ED pattern that yield a unit cell parameter a = 58 ± 2 Å (Fig. 9a). The final calculated ED pattern for this structural model is shown in Fig. 9c. This pattern corresponds to a unique zone axis and accounts well for the distribution of dominant reflections in the main layer lines. However, the intensities in the 6th layer line present some discrepancy, with an overestimation for the meridional reflections. Actually, the structural model does not take into account the packing disorder inherent to LC phases. As seen in Fig. 9a, the reflections in the 5th, 6th and 7th strata are streaked. It results form a disorder in the packing of NDI2 columns i.e. random offsets between columns along the c axis. Because the reflections the 6th strata are streaked, their intensities are redistributed. It explains, at least in part, why the measured intensities in the 6th layer are lower than the calculated intensities.
V. Conclusion
The original polymorphism of a H-bonded naphthalene bisimide organogelator has been uncovered by a combination of low-dose TEM, AFM, X-ray diffraction, UV-vis and FTIR spectroscopies. Four polymorphs exist: the dried gel phase, a metastable LC phase, a lamellar and a crystalline form were evidenced. A phase diagram explaining how the structures can be interconverted has been established. Both, the polymorphism and the structures formed by NDI2 illustrate the subtle interplay between heterocyclic π-stacking of NDI/phenyl and H-bonding between amides. In the metastable LC phase, NDI2 molecules form supramolecular 6/1 helices made of pairs of H-bonded NDI2 molecules. These 6/1 helices are packed in a so-called frustrated trigonal unit cell similar to that observed recently for a perylene bisimide analogue. The observation of such frustrated hexagonal-like structures for two different H-bonded π-gels indicates that helical assemblies are quite common for this class of molecules. In addition, NDI2 forms an original crystal structure (form IV) where each NDI core is π-stacked between two phenyl cycles of two adjacent NDI2 molecules. This packing impedes long range π-stacking of NDI cores. Overall, these results illustrate the diversity of stacking possibilities for NDI derivatives and the potential wealth of polymorphs accessible for a single organogelator molecule because of the interplay between H-bonding and π-stacking. The exact role of the linker between the H-bonding unit (amide) and the π-conjugated core (NDI or PBI) needs to be clarified. Preliminary results indicate that no such complex polymorphism is observed for longer (CH2)4 linkers. A systematic comparison of supramolecular structures as a function of the length of the flexible linker between the solubilizing dendron and the NDI core is therefore necessary to better understand the processing-structure–property relations for this class of original π-conjugated molecules.Conflicts of interest
The authors declare no conflicts of interest.Acknowledgements
B. Lotz is acknowledged for fruitful discussions and reading the manuscript. The Agence National de la Recherche and the Indo-French Centre for the Promotion of Advanced Research are acknowledged for their financial support (Grant IFCPAR-CEFIPRA (DST)-ANR 14-CE08-0020-01). M. D. acknowledges financial support from Région Alsace. The authors thanks C. Foussat for the chromatographic measurements of the purity of NDI2, C. Saettel for the DSC measurements and M. Legros for the ATG. The characterization facility is acknowledged for the use of FTIR, UV-vis.References
- F. J. M. Hoeben, P. Jonkheijm, E. W. Meijer and A. P. H. J. Schenning, Chem. Rev., 2005, 105, 1491–1546 CrossRef CAS PubMed.
- X. Zhan, A. Facchetti, S. Barlow, T. J. Marks, M. A. Ratner, M. R. Wasielewski and S. R. Marder, Adv. Mater., 2011, 23, 268–284 CrossRef CAS PubMed.
- F. Würthner, C. R. Saha-Möller, B. Fimmel, S. Ogi, P. Leowanawat and D. Schmidt, Chem. Rev., 2016, 116, 962–1052 CrossRef PubMed.
- D. Shukla, S. F. Nelson, D. C. Freeman, M. Rajeswaran, W. G. Ahearn, D. M. Meyer and J. T. Carey, Chem. Mater., 2008, 20, 7486–7491 CrossRef CAS.
- Z. Chen, M. G. Debije, T. Debaerdemaeker, P. Osswald and F. Würthner, ChemPhysChem, 2004, 5, 137–140 CrossRef CAS PubMed.
- B. A. Jones, A. Facchetti, M. R. Wasielewski and T. J. Marks, J. Am. Chem. Soc., 2007, 129, 15259–15278 CrossRef CAS PubMed.
- J. H. Oh, S. Liu, Z. Bao, R. Schmidt and F. Würthner, Appl. Phys. Lett., 2007, 91, 212107 CrossRef.
- S. Basak, J. Nanda and A. Banerjee, Chem. Commun., 2013, 49, 6891–6893 RSC.
- P. Mukhopadhyay, Y. Iwashita, M. Shirakawa, S. Kawano, N. Fujita and S. Shinkai, Angew. Chem., 2006, 118, 1622–1625 CrossRef.
- N. V. Ghule, R. S. Bhosale, A. L. Puyad, S. V. Bhosale and S. V. Bhosale, Sens. Actuators, B, 2016, 227, 17–23 CrossRef CAS.
- B. A. Jones, A. Facchetti, T. J. Marks and M. R. Wasielewski, Chem. Mater., 2007, 19, 2703–2705 CrossRef CAS.
- K. C. See, C. Landis, A. Sarjeant and H. E. Katz, Chem. Mater., 2008, 20, 3609–3616 CrossRef CAS.
- K. Balakrishnan, A. Datar, T. Naddo, J. Huang, R. Oitker, M. Yen, J. Zhao and L. Zang, J. Am. Chem. Soc., 2006, 128, 7390–7398 CrossRef CAS PubMed.
- M. C. R. Delgado, E.-G. Kim, D. A. da, S. Filho and J.-L. Bredas, J. Am. Chem. Soc., 2010, 132, 3375–3387 CrossRef PubMed.
- M. R. Molla and S. Ghosh, Chem. Mater., 2011, 23, 95–105 CrossRef CAS.
- R. Marty, R. Nigon, D. Leite and H. Frauenrath, J. Am. Chem. Soc., 2014, 136, 3919–3927 CrossRef CAS PubMed.
- Y. Tsukada, N. Nishimura and J. Mizuguchi, Acta Crystallogr., Sect. E: Struct. Rep. Online, 2008, 64, o5–o5 CrossRef CAS PubMed.
- J. Mizuguchi, J. Appl. Phys., 1998, 84, 4479–4486 CrossRef CAS.
- J. Mizuguchi, K. Hino and K. Tojo, Dyes Pigm., 2006, 70, 126–135 CrossRef CAS.
- G. Klebe, F. Graser, E. Hädicke and J. Berndt, Acta Crystallogr., Sect. B: Struct. Sci., 1989, 45, 69–77 CrossRef.
- A. Sarbu, L. Biniek, J.-M. Guenet, P. J. Mésini and M. Brinkmann, J. Mater. Chem. C, 2015, 3, 1235–1242 RSC.
- A. Sarbu, P. Hermet, D. Maurin, D. Djurado, L. Biniek, M. Diebold, J.-L. Bantignies, P. Mésini and M. Brinkmann, Phys. Chem. Chem. Phys., 2017, 19, 32514–32525 RSC.
- S. S. Babu, S. Prasanthkumar and A. Ajayaghosh, Angew. Chem., Int. Ed., 2012, 51, 1766–1776 CrossRef CAS PubMed.
- S. Ogi, V. Stepanenko, K. Sugiyasu, M. Takeuchi and F. Würthner, J. Am. Chem. Soc., 2015, 137, 3300–3307 CrossRef CAS PubMed.
- V. Dehm, Z. Chen, U. Baumeister, P. Prins, L. D. A. Siebbeles and F. Würthner, Org. Lett., 2007, 9, 1085–1088 CrossRef CAS PubMed.
- R. Marty, R. Szilluweit, A. Sánchez-Ferrer, S. Bolisetty, J. Adamcik, R. Mezzenga, E.-C. Spitzner, M. Feifer, S. N. Steinmann, C. Corminboeuf and H. Frauenrath, ACS Nano, 2013, 7, 8498–8508 CrossRef CAS PubMed.
- L. Bu, E. Pentzer, F. A. Bokel, T. Emrick and R. C. Hayward, ACS Nano, 2012, 6, 10924–10929 CrossRef CAS PubMed.
- M. Brinkmann, S. Graff, C. Straupé, J.-C. Wittmann, C. Chaumont, F. Nuesch, A. Aziz, M. Schaer and L. Zuppiroli, J. Phys. Chem. B, 2003, 107, 10531–10539 CrossRef CAS.
- Bruker AXS Inc., M86-E01078 APEX2 User Manual, Madison, USA, 2006.
- G. M. Sheldrick, Acta Crystallogr., Sect. A: Found. Crystallogr., 1990, 46, 467–473 CrossRef.
- G. M. Sheldrick, Acta Crystallogr., Sect. A: Found. Crystallogr., 2008, 64, 112–122 CrossRef CAS PubMed.
- M. Pope, C. E. Swenberg and M. Pope, Electronic processes in organic crystals and polymers, Oxford University Press, New York, 2nd edn, 1999 Search PubMed.
- D. Lin-Vien, N. B. Colthup, W. G. Fateley and J. G. Grasselli, The Handbook of Infrared and Raman Characteristic Frequencies of Organic Molecules, Academic Press, Boston, 1991, pp. 155–167 Search PubMed.
- A. Kalita, N. V. V. Subbarao and P. K. Iyer, J. Phys. Chem. C, 2015, 119, 12772–12779 CrossRef CAS.
- J.-L. Bantignies, L. Vellutini, J.-L. Sauvajol, D. Maurin, M. Wong Chi Man, P. Dieudonné and J. J. E. Moreau, J. Non-Cryst. Solids, 2004, 345–346, 605–609 CrossRef.
- R. G. Snyder, H. L. Strauss and C. A. Elliger, J. Phys. Chem., 1982, 86, 5145–5150 CrossRef CAS.
- R. A. MacPhail, H. L. Strauss, R. G. Snyder and C. A. Elliger, J. Phys. Chem., 1984, 88, 334–341 CrossRef CAS.
- M. I. Kohan, Nylon Plastics Handbook, Hanser/Gardner Publications, Wilmington, 1995 Search PubMed.
- J. J. Reczek, K. R. Villazor, V. Lynch, T. M. Swager and B. L. Iverson, J. Am. Chem. Soc., 2006, 128, 7995–8002 CrossRef CAS PubMed.
- M. Brinkmann, E. Gonthier, S. Bogen, K. Tremel, S. Ludwigs, M. Hufnagel and M. Sommer, ACS Nano, 2012, 6, 10319–10326 CrossRef CAS PubMed.
- A. J. Zych and B. L. Iverson, J. Am. Chem. Soc., 2000, 122, 8898–8909 CrossRef CAS.
- Q. Lin, L. Liu, F. Zheng, P.-P. Mao, J. Liu, Y.-M. Zhang, H. Yao and T.-B. Wei, RSC Adv., 2017, 7, 38458–38462 RSC.
- N. B. Kolhe, R. N. Devi, S. P. Senanayak, B. Jancy, K. S. Narayan and S. K. Asha, J. Mater. Chem., 2012, 22, 15235–15246 RSC.
- F. H. C. Crick and A. Rich, Nature, 1955, 176, 780–781 CrossRef CAS PubMed.
- W. Cochran, F. H. Crick and V. Vand, Acta Crystallogr., 1952, 5, 581–586 CrossRef CAS.
- R. E. Dickerson and I. Geis, The Structure and Action of Proteins, Harper and Row, 1969 Search PubMed.
- V. Percec, M. Peterca, T. Tadjiev, X. Zeng, G. Ungar, P. Leowanawat, E. Aqad, M. R. Imam, B. M. Rosen, U. Akbey, R. Graf, S. Sekharan, D. Sebastiani, H. W. Spiess, P. A. Heiney and S. D. Hudson, J. Am. Chem. Soc., 2011, 133, 12197–12219 CrossRef CAS PubMed.
- V. Percec, H.-J. Sun, P. Leowanawat, M. Peterca, R. Graf, H. W. Spiess, X. Zeng, G. Ungar and P. A. Heiney, J. Am. Chem. Soc., 2013, 135, 4129–4148 CrossRef CAS PubMed.
Footnote |
| † Electronic supplementary information (ESI) available: Synthesis of NDI2. Table listing the solvents inducing gelation, precipitation or solubilization of NDI2. Transition temperatures and enthalpies between the polymorphs. TEM and ED of the spherulites. Variation of ED patterns with temperature showing the transition form III → form IV. TEM rotation-tilt diffraction experiment showing the trigonal structure of form II. Cif file of the structure of NDI2 form IV. CCDC 1867282. For ESI and crystallographic data in CIF or other electronic format see DOI: 10.1039/c9tc04402g |
| This journal is © The Royal Society of Chemistry 2019 |


