
Detecting and targeting senescent cells using molecularly imprinted nanoparticles†
Akang E.
Ekpenyong-Akiba‡
a,
Francesco
Canfarotta‡
*b,
Bashar
Abd H.§¶
c,
Marta
Poblocka§
a,
Mireia
Casulleras
a,
Laura
Castilla-Vallmanya
a,
Gabriella
Kocsis-Fodor
a,
Michael E.
Kelly
d,
Justyna
Janus
d,
Mohammad
Althubiti
ae,
Elena
Piletska
c,
Sergey
Piletsky
c and
Salvador
Macip
 *a
*a
aMechanisms of Cancer and Aging Laboratory, Department of Molecular and Cell Biology, University of Leicester, University Road, Leicester, LE1 7RH, UK. E-mail: sm460@leicester.ac.uk; Tel: +44 (0)116 229 7113
bMIP Diagnostics Ltd., The Exchange, Colworth Science Park, Sharnbrook, MK44 1LQ, UK. E-mail: fc114@leicester.ac.uk
cDepartment of Chemistry, University of Leicester, Leicester, UK
dPreclinical Imaging Facility, Core Biotechnology Services, College of Life Sciences, University of Leicester, Leicester LE1 9HN, UK
eDepartment of Biochemistry, Faculty of Medicine, Umm Al-Qura University, Mecca, Saudi Arabia
First published on 14th February 2019
Abstract
The progressive accumulation of senescent cells in tissues in response to damage importantly contributes to pathophysiological conditions such as fibrosis, diabetes, cancer, Alzheimer's and ageing. Consistent with this, eliminating senescent cells prolongs the lifespan and healthspan in animals and ameliorates certain diseases. Detecting and clearing senescent cells from human tissues could therefore have a significant diagnostic and prognostic impact. However, identifying senescent cells in vivo has proven to be complex. To address this, we characterized and validated a panel of novel membrane markers of senescence. Here, we show the application of molecularly imprinted nanoparticles (nanoMIPs) against an extracellular epitope of one of these markers, B2M, to detect senescent cells in vitro and in vivo. We show that nanoMIPs do not elicit toxic responses in the cells or in mice and successfully recognize old animals, which have a higher proportion of senescent cells in their organs. Importantly, nanoMIPs loaded with drugs can specifically kill senescent cells. Our results provide a proof-of-principle assessment of specific and safe nanotechnology-based approaches for senescent cell detection and clearance with potential clinical relevance.
Conceptual insightsWe show that molecularly imprinted nanoparticles (nanoMIPs) can be designed to target surface proteins in senescent cells, using as epitopes newly described membrane proteins with extracellular domains that are specifically induced in these cells. This provides a novel tool to detect senescent cells (when the nanoMIPs are tagged with fluorescent probes) or destroy them (by loading the nanoparticles with an adequate drug, which will then be specifically released). We show in this study that this is indeed possible in cells in culture, which can be highlighted or eliminated using a nanoMIP against B2M. Moreover, we also show that the nanoMIPs can detect senescent cells in aged mice without eliciting any apparent toxicity. Since senescent cells have recently been associated with different conditions and diseases, ranging from lung fibrosis to Alzheimer's, cancer or ageing, we propose that these nanoparticles could be used for diagnostic and even therapeutic purposes. |
Introduction
Senescence, a complex cellular program in which cells enter a state of permanent cell cycle arrest while remaining metabolically active, has important roles in tumour suppression.1 It is established as a result of different events, including telomere shortening after a number of cell divisions (replicative senescence) or the response to damage (stress-induced premature senescence).2,3 Expression of oncogenes can also trigger it (oncogene-induced senescence), underscoring the role of senescence as a defence against neoplastic transformation.1 Indeed, senescent cells in vivo are often observed in pre-malignant stages of tumours, after which they disappear, which suggests that the senescent barrier needs to be overcome in order to progress into full malignancy.4–6Senescence has been associated with age-dependent organismal changes, and the progressive increase of senescent cells with time is known to contribute to the functional impairment of different organs typically seen in ageing.7 More recently, it has been shown that it also plays an important role in fibrosis8 and, paradoxically, tumour progression,9 and that it may be involved in cataracts, obesity, diabetes, Alzheimer's and Parkinson's diseases, arthritis, atherosclerosis and other conditions.10,11 This supports the hypothesis that senescence is an antagonistically pleiotropic process, with beneficial effects in the early decades of life of the organism (in development,12 tissue repair13 and as a tumour suppressor mechanism) but detrimental to fitness and survival in later stages, at least in part due to the paracrine promotion of a chronic inflammatory state.14
Since the accumulation of senescent cells is involved in many pathologies, quantifying the number of these cells present in a tissue could have diagnostic and prognostic benefits, and provide the basis for therapeutic clearance strategies. Despite a number of available options, none of the current markers of senescence are sufficiently specific.3,15,16 Although increased expression of intracellular and/or secreted proteins has often been used as a surrogate marker of senescent cells,17 their most distinctive measurable feature is a particular enzymatic activity, known as senescence-associated-β-galactosidase (SA-β-Gal).18 This is still the standard for senescence detection, despite the fact that high cell confluence and certain types of stress can also induce it, leading to potential false positives.19 Using mass spectrometry on well-studied cellular models,20 we identified a number of proteins highly expressed in the plasma membranes of senescent cells, which are part of the still poorly characterized senescent surfaceome.21 We validated several that showed increased senescence-related expression in vivo and in vitro and had extracellular epitopes,21 and we proposed to use them as tools to detect senescent cells.22
A novel technology that could be used for this purpose is the molecularly imprinted nanoparticles (nanoMIPs), nanostructured polymeric particles with one binding site for a target molecule.23 The solid-phase approach employed in the production of nanoMIPs relies on the covalent immobilisation of the template molecule on a solid support (e.g. glass beads of an average diameter of 75–90 μm). This support bearing the immobilized template is placed in contact with the monomer mixture, and polymerisation is initiated under conditions that promote the formation of polymer nanoparticles. After polymerisation, the solid support acts as an affinity medium to isolate the high-affinity nanoMIPs from the remaining monomers, oligomers and low-affinity polymers, which are removed by washing the beads under conditions in which those nanoparticles with high affinity remain attached. Because of this purification step, nanoMIPs possess high affinity and specificity toward their targets and exhibit a homogeneous distribution of binding site affinities.24 Recently, MIP-mediated cell recognition has gained prominence and has been shown to be a tool with great promise in medical and biological applications,25–27 both for cell targeting and imaging.28,29
Here, we used nanoMIPs, targeted against one of the senescence membrane markers we previously described, B2M, to identify and clear senescent cells. We show that they are not toxic and propose that nanoMIPs have the potential to be used as diagnostic, prognostic and therapeutic tools in pathologies characterized by the accumulation of senescent cells.
Results
Generation of nanoMIPs against markers of senescence.
We hypothesized that nanoMIP technology could provide a new approach to specifically detect senescent cells, since nanoMIPs have been used previously to selectively label surface proteins.30 In order to test this idea, we used a solid-phase approach based on epitope imprinting to target an epitope of β2 microglobulin (B2M), an extracellular component of the MHC class I molecules31 and a newly identified marker of senescence.21 The chosen epitope, amino acids 101–115 (Fig. 1A and Fig. S1A, ESI†), was fixed on the surface of microsized glass beads via thiol coupling, to allow oriented immobilisation of the peptides, as previously described.32 This was achieved by adding a cysteine at the C-terminus of the peptide and using succinimidyl-iodo acetate as a linker between the peptide and the surface-modified glass beads. To produce nanoMIPs, we utilized a mixture of monomers previously optimized specifically to imprint peptides and proteins in mild aqueous conditions24 (Fig. 1B). Peptide immobilisation was confirmed by colorimetric reaction based on the bicinchoninic acid assay (BCA) (Fig. S2, ESI†) The BCA test relies on the reduction of Cu2+ from copper(II) sulfate to Cu+ operated by peptide bonds. Afterwards, two molecules of bicinchoninic acid chelate with each Cu+ ion, producing a purple-coloured complex. The colour shift from green to purple confirms the presence of the peptide on the solid-phase. Beads with peptide immobilised generated a colour shift, compared with beads without any template molecule (after silanization step) and with the working solution alone. The generated B2M nanoMIPs had an average hydrodynamic diameter in deionized water of 313 nm, as measured by dynamic light scattering, and transmission electron microscopy showed an average size of 133 nm (Fig. 1C). Although solid-phase synthesis can produce smaller nanoMIPs compared to polymerisations in solution, the size of nanoparticles and their affinity are intrinsically linked. Since the affinity separation in solid-phase synthesis aimed at the selection of the high-affinity fraction of nanoparticles, the average size of the particles produced using this method, irrespective of composition, is 70–200 nm, depending on their swelling in the buffer. Also, smaller size was not a critical issue for our goal of surface epitope recognition, due to the fact that these nanoMIPs would not have to enter the cell to bind their target.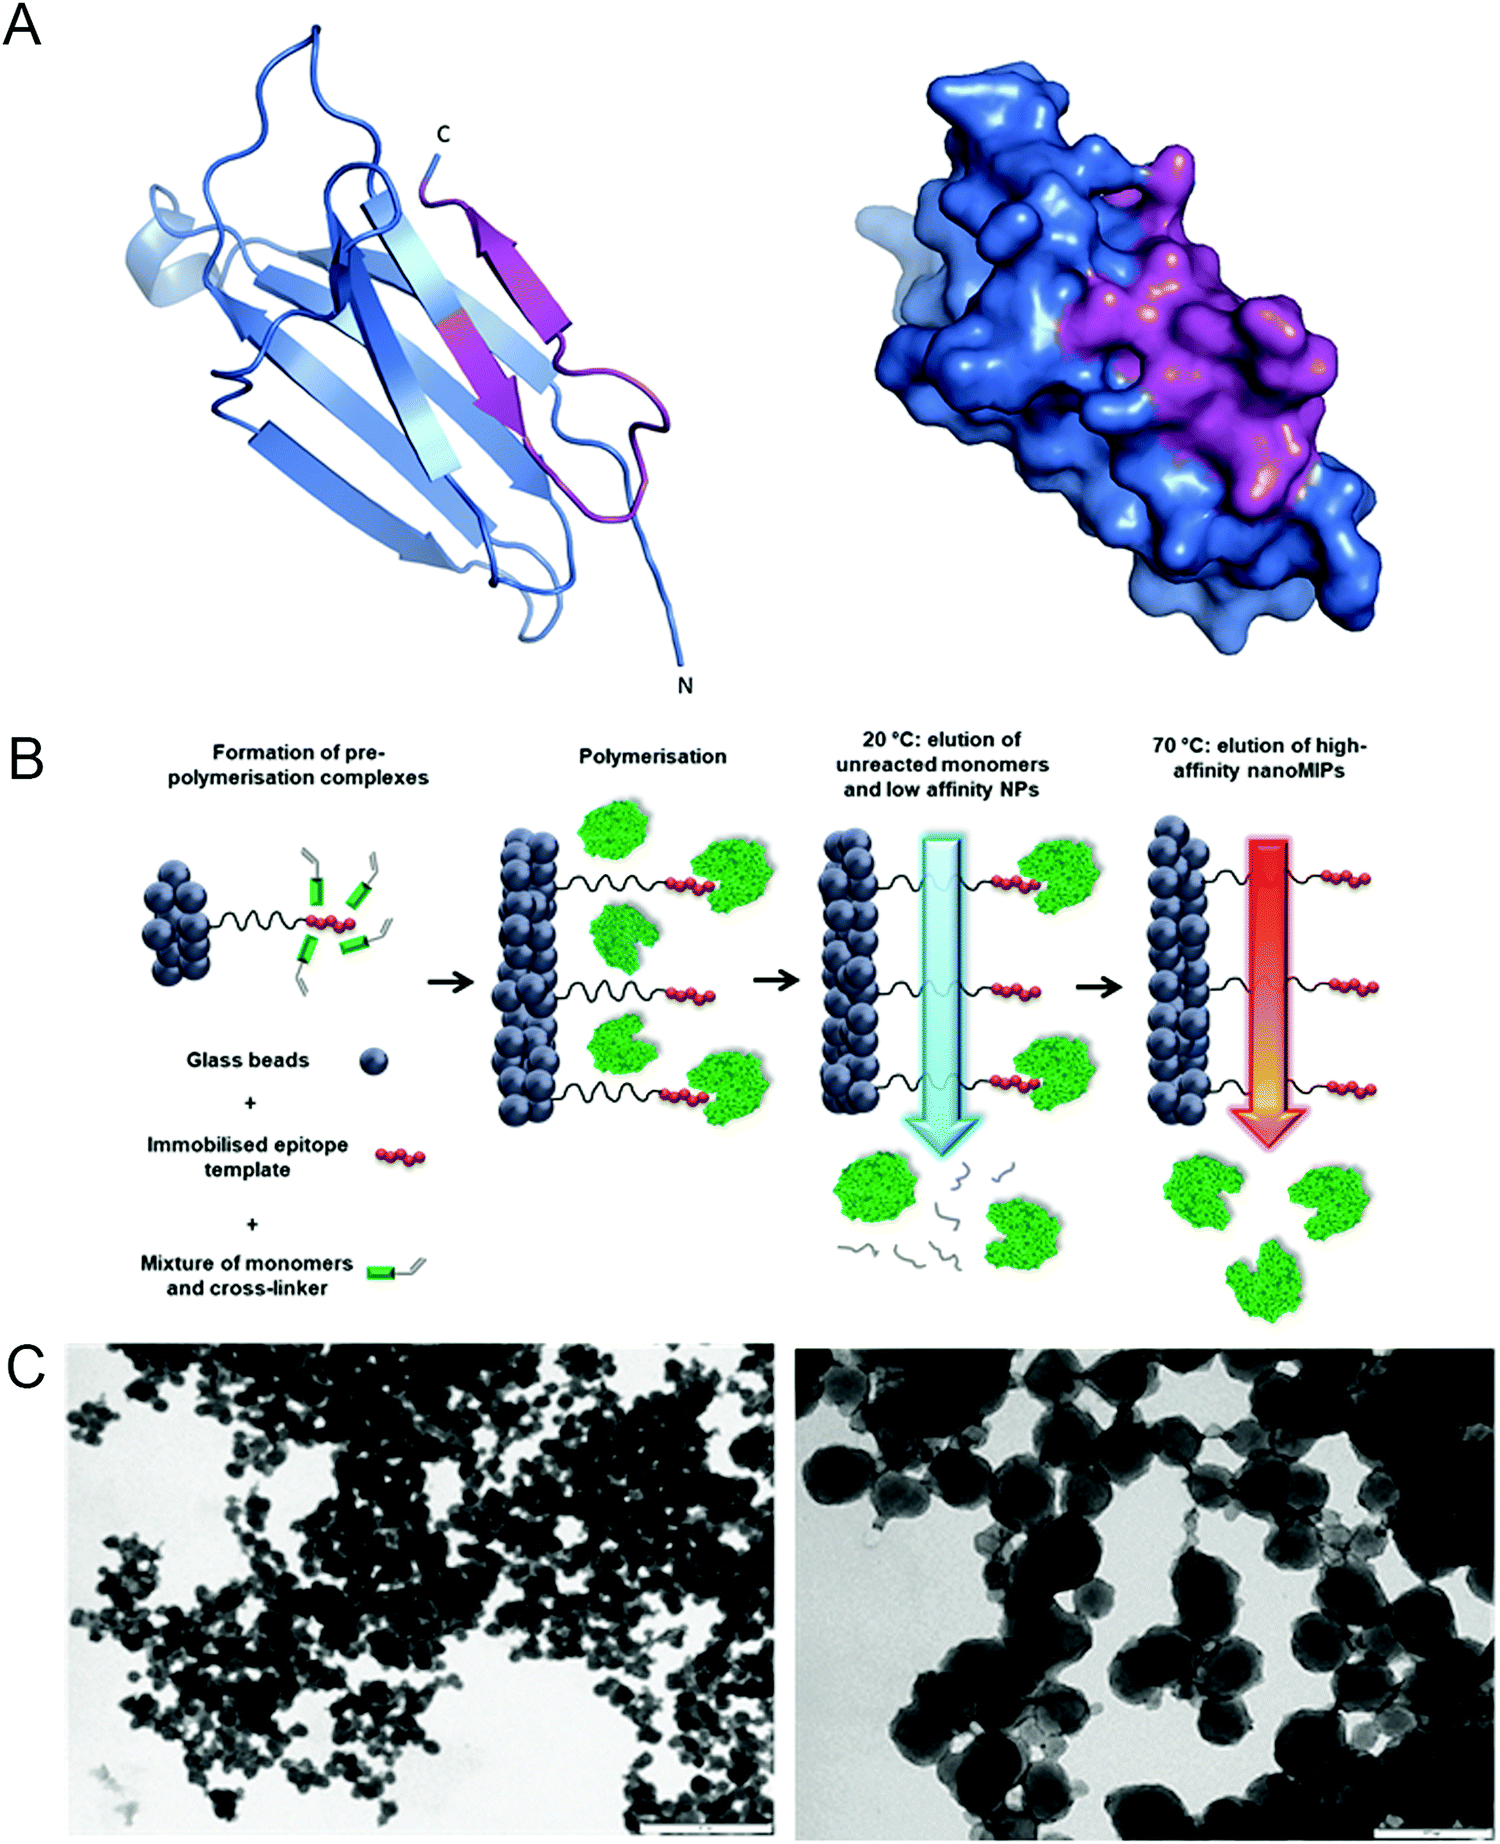 | ||
| Fig. 1 Generation of nanoMIPs. (A) Crystal structure (left) and surface presentation (right) of B2M, with the epitope used for nanoMIP design, near the C-terminal, indicated in magenta. Structure adapted using PyMOL 1.0. (B) Details of the processes involved in the solid-phase synthesis of a B2M specific nanoMIP, using a peptide epitope of the whole protein as the primary template. Adapted from ref. 32. (C) Representative dynamic light scattering images of the B2M nanoMIPs. Scale bars are, respectively, 1 μm and 200 nm. | ||
B2M-targeted nanoMIPs recognize senescent cells in culture
We next tested the B2M nanoMIPs in an inducible model of senescence, EJ bladder cancer cells with a tetracycline(tet)-regulatable p16 expression system (EJp16). These cells undergo senescence after gene induction by tet removal20 and are representative of activation of the pRb-p16 axis, one of the main pathways involved in senescence.33 Moreover, clearing p16-expressing senescent cells has been shown to ameliorate age-related pathologies,34–36 which underscores the relevance of our model. As expected, B2M was upregulated when cells became senescent (Fig. 2A). Incubation of control and senescent cells with fluorescein-tagged B2M nanoMIPs showed a selective detection of senescent cells, as measured by FACS (Fig. 2B). Fluorescent microscopy confirmed that the nanoMIPs preferentially accumulate in senescent cells (Fig. 2C) and that they specifically bind to their membrane (Fig. 2D). These results show that nanoMIPs imprinted for a membrane marker can selectively recognize senescent cells in culture.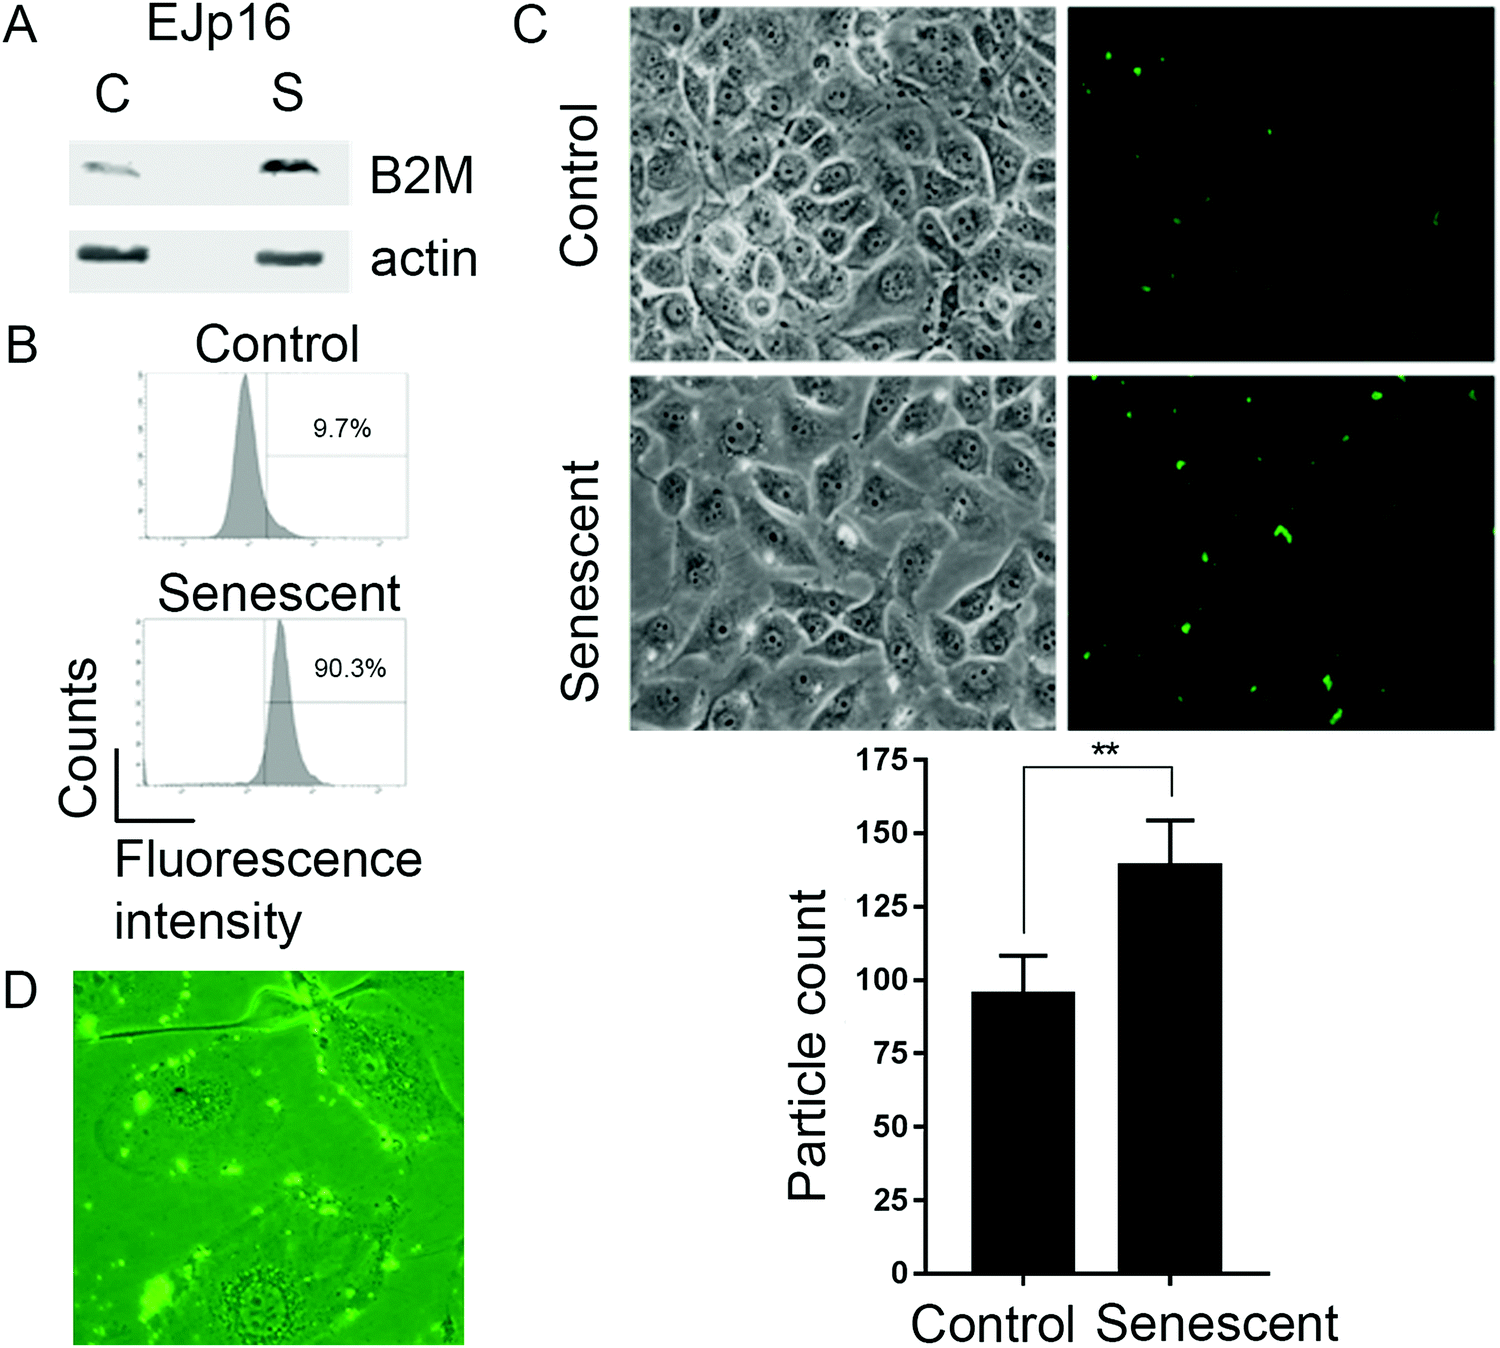 | ||
| Fig. 2 Fluorescent nanoMIPs against B2M selectively bind to senescent cells. (A) Representative Western blot showing B2M protein expression in EJp16 cells, with β-actin as a loading control. Senescence was induced by culturing cells without tetracycline for 4 days. (B) FACS analysis of EJp16 and incubated with B2M-targeted fluorescent nanoMIPs. Numbers show the percentage of cells positive for green fluorescence above background levels, which is indicative of cells to which the nanoMIPs attached. (C) Representative images of fluorescent microscopy taken 4 hours after EJp16 were incubated with the nanoMIPs. Fluorescent particles in each microscopic field were quantified using Image J software. Results show mean ± SD of triplicate independent experiments. **p < 0.005 (two-tailed unpaired t test). (D) Representative image of fluorescent microscopy from the same cells, showing that nanoMIPs bind to the membrane of senescent EJp16. | ||
Targeted clearance of senescent cells using B2M nanoMIPs
We next investigated whether the B2M nanoMIPs could also be used to specifically clear the senescent cells through targeted delivery of toxic compounds, which could be a senolytic approach with reduced off-target effects. First, we tested whether the nanoMIPs had any cytotoxic effect on their own. As shown in Fig. 3A and B, long-term exposure to the B2M targeted nanoMIPs did not affect the viability and survival of either control or senescent cells, confirming that the nanoparticles were not toxic under these conditions. This is consistent with what has previously been demonstrated for other nanoMIPs.37 We also observed that the nanoMIPs internalized after binding to B2M on the surface of senescent cells and accumulated in the cytosol, often forming perinuclear aggregates (Fig. 3C). This supported the hypothesis that nanoMIPs could be used to deliver drugs into cells. To further test this, we generated B2M nanoMIPs loaded with dasatinib, a senolytic drug.38 We observed that senescent EJp16 cells can be killed by dasatinib and other senolytic drugs, but only at high concentrations, while most of them had no effect on control cells (Fig. 3D). Thus, we postulated that a targeted delivery using nanoMIPs could increase the sensitivity of the cells to the drug while minimizing the impact on other cells. As shown in Fig. 3E, dasatinib-containing nanoMIPs were able to importantly reduce the viability of senescent EJp16 cells, while the proliferating controls were significantly less affected. These proof-of-principle experiments demonstrate that nanoMIPs can selectively kill senescent cells by delivering a cytotoxic drug into them.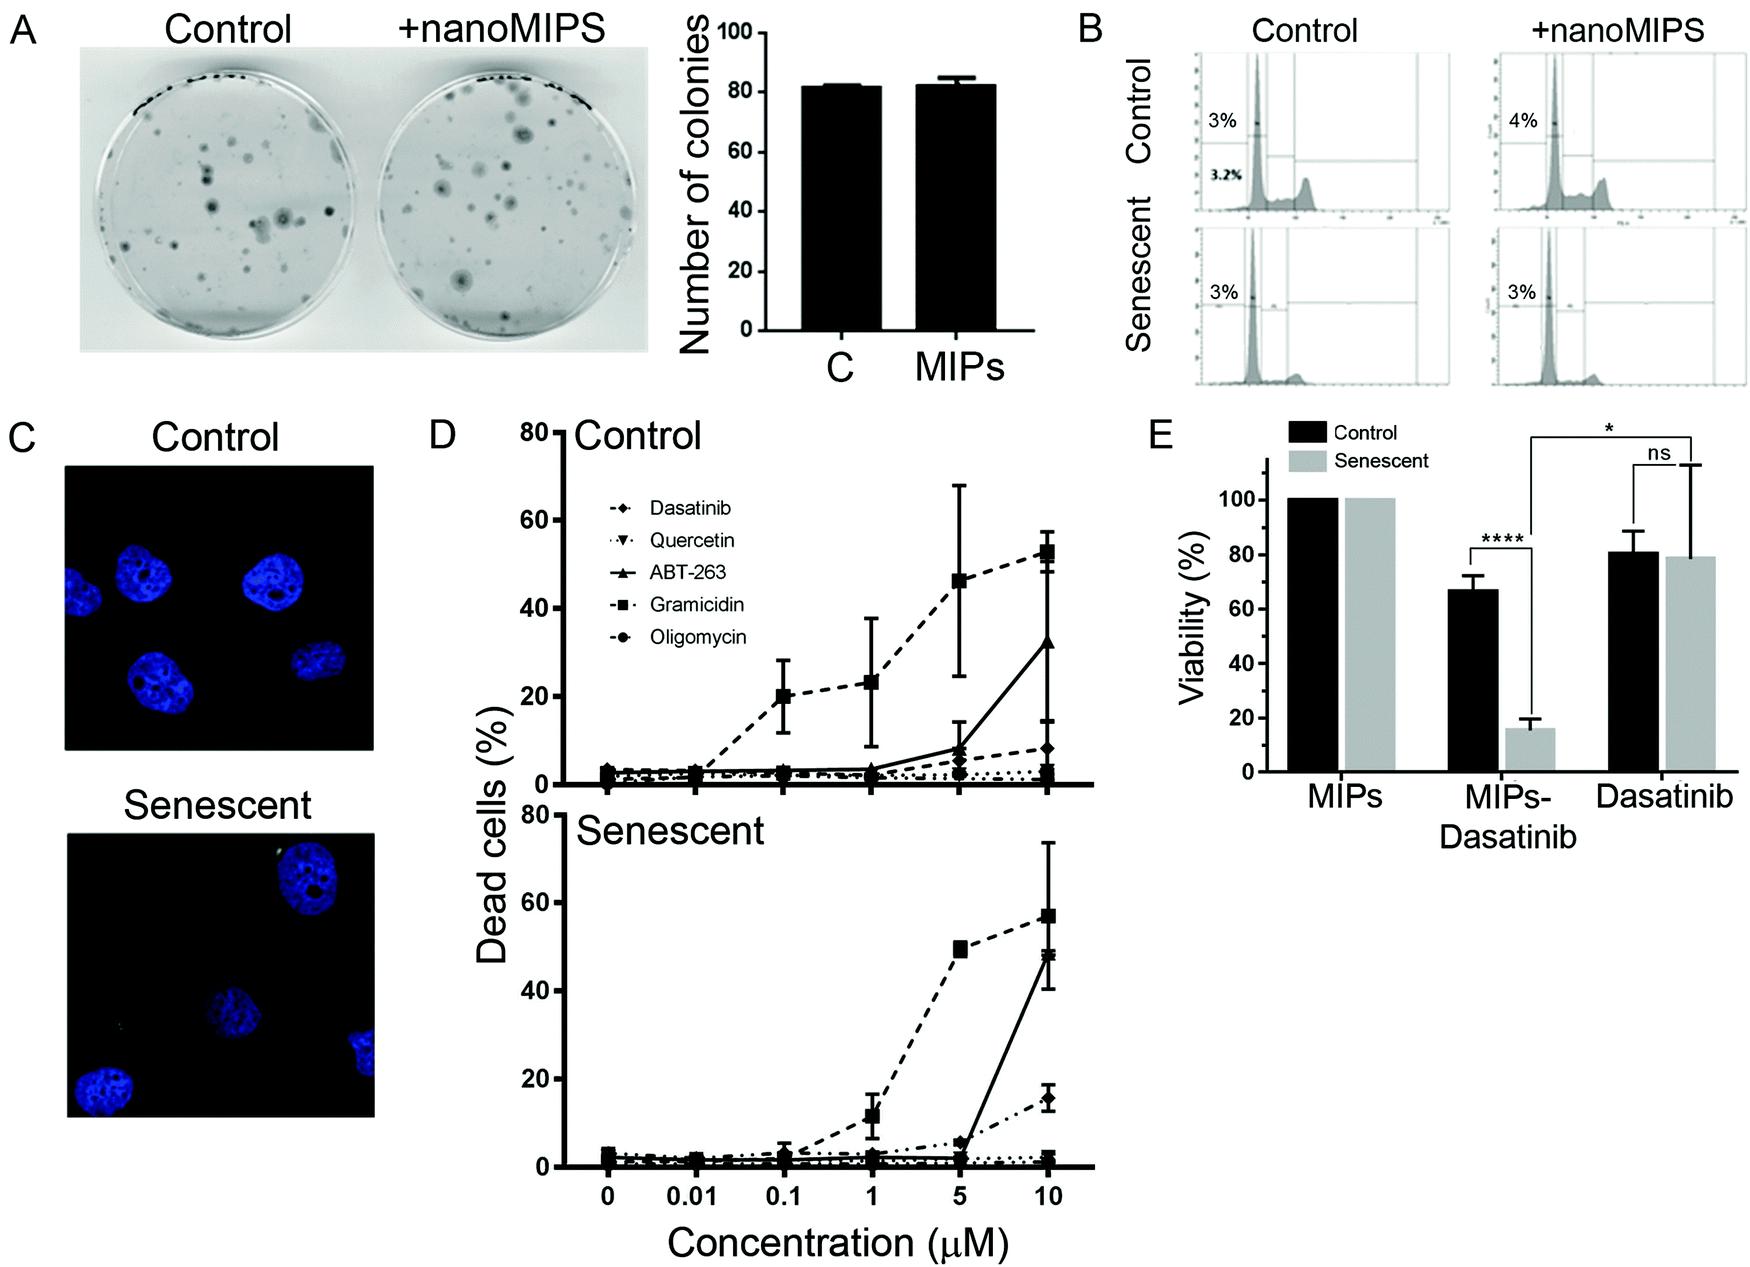 | ||
| Fig. 3 Targeted delivery of drugs into senescent cells by nanoMIPs. (A) Colony formation assays of control EJp16 (cultured in the presence of tet) incubated with nanoMIPs. Graphs show results from two independent experiments in duplicate, and are plotted as mean ± SD. (B) Representative cell cycle analysis plots obtained by FACS analysis of PI-stained EJp16 cells incubated with B2M nanoMIPs for 24 hours. Percentages of cell death (subG1 populations) are indicated. (C) Representative confocal microscope images of control and senescent EJp16 fixed with formalin and stained with DAPI 24 hours after incubation with B2M nanoMIPs at 37 °C. (D) Percentage of cell death, as measured by PI staining, of control and senescent EJp16 treated with different concentrations of oligomycin, gramicidin, ABT-263, quercetin and dasatinib for 48 hours. Results represent the average of three independent experiments. Error bars show standard deviation. (E) Cell viability measured by an MTS assay of proliferating and senescent EJp16 (4 days after tet removal) treated with B2M nanoMIPs, 10 μM Dasatinib-conjugated B2M nanoMIPs or 10 μM Dasatinib for 24 hours. Results show average ± SD of four replicates. *p < 0.05; ****p < 0.0005; ns: not significant (two-tailed paired t tests). | ||
In vivo detection of senescent cells by B2M nanoMIPs
We finally studied whether nanoMIPs can also recognize senescent cells in vivo. We observed that the administration of B2M targeted nanoMIPs did not significantly affect the weight of the animals when given orally, intraperitoneally or intravenously during a 14-day follow-up after treatment, suggesting that they had no important effects on their general health (Fig. 4A). We also found that the liver and kidney functions were preserved (Fig. 4B). Moreover, these mice were assessed daily to measure any distress symptoms and no changes were reported during the 14-day period (Table S1, ESI†). This supports previous reports that suggested that nanoMIPs were safe to be delivered intravenously.39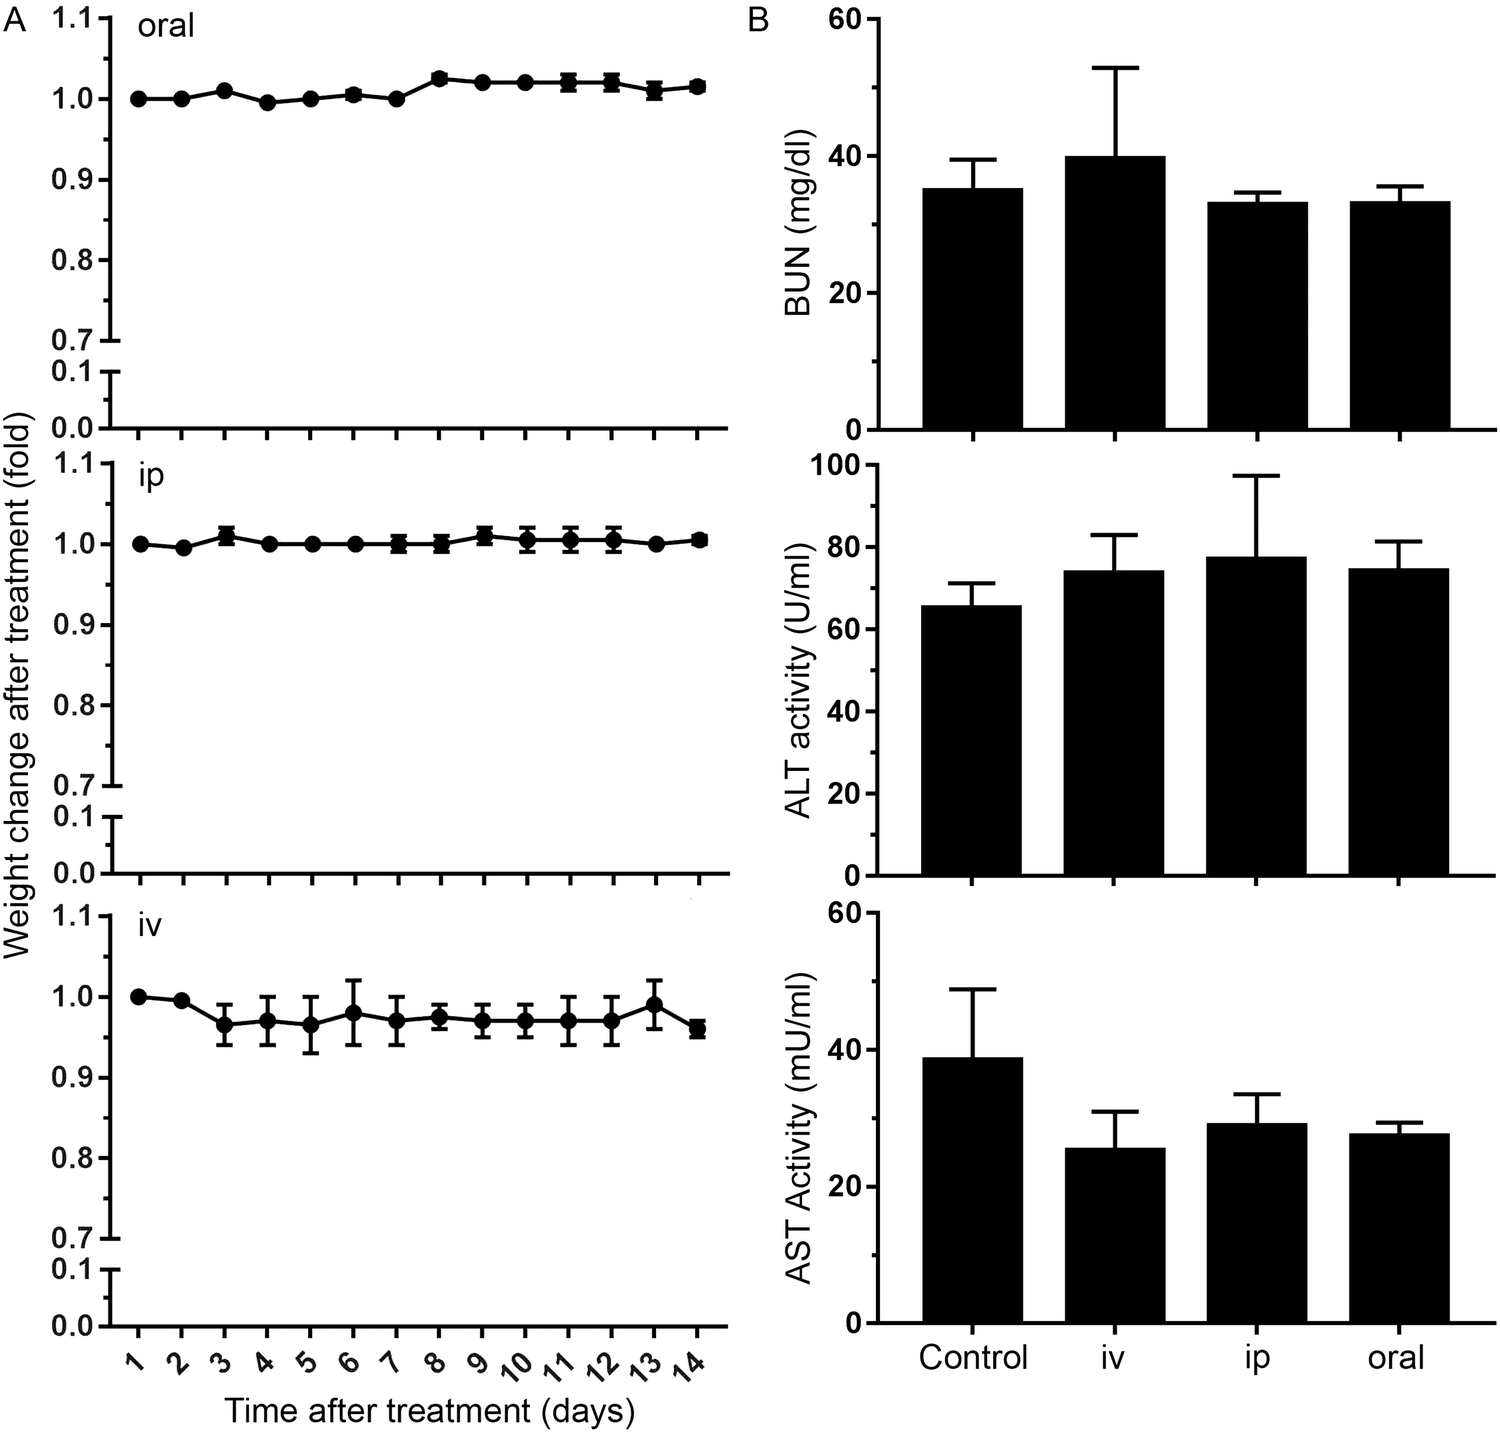 | ||
| Fig. 4 Effects of nanoMIPs in vivo. (A) Body weight change of mice exposed to a nanoMIP solution (0.4 mg ml−1) via 3 different means of delivery: by oral gavage (10 ml kg−1), intraperitoneally (10 ml kg−1) and intravenously (5 ml kg−1). The weight of two animals was measured 14 days after treatment and normalized to the weight on day 0. Error bars show ± SEM. (B) Blood Urea Nitrogen (BUN), Alanine aminotransferase (ALT), and Aspartate aminotransferase (AST) levels in serum samples from two mice 14 days after treatment with nanoMIPs. Blood samples were collected through exsanguination via the caudal vena cava and every sample was assayed in triplicate for all tested enzymes. Data represent the mean ± SD. The statistical analysis revealed a nonsignificant difference between all the groups and the control (One-way ANOVA, p > 0.05). | ||
Since the B2M epitope used to generate the B2M MIPs is well conserved between human and mouse (Fig. S1B, ESI†), we utilized the same B2M nanoMIPs described above for the in vivo tests. As shown in Fig. 5A, nanoMIPs tagged with DyLight 800 NHS Ester and injected intravenously into C57/BL6J mice did not show any fluorescence in young mice (2-month-old) 2 hours after the treatment, similar to what was observed in the untreated control. On the other hand, old mice (11 months) were positive for a fluorescent signal, suggesting that the nanoMIPs were bound to senescent cells and thus were not cleared from the animals. The accumulation of the nanoMIPs was preferentially in the intestine, specifically the jejunum (Fig. 5B and Fig. S3C, ESI†). This pattern is consistent with an increased presence of senescent cells in the gastrointestinal tract of old mice.40 When mice were imaged post-mortem after opening the abdominal cavity, old mice showed a diffuse pattern of fluorescence 4-fold higher than the background levels of young and untreated mice (Fig. 5C). Similar results were obtained with nanoMIPs tagged with Alexa Fluor 647, although the shorter wavelength used to image these nanoMIPs led to a higher background fluorescence in control mice (Fig. S3A–C, ESI†). Our results suggest that B2M nanoMIPs accumulate in senescent cells in vivo, thus acting as a marker for aged tissues that could have clinical relevance.
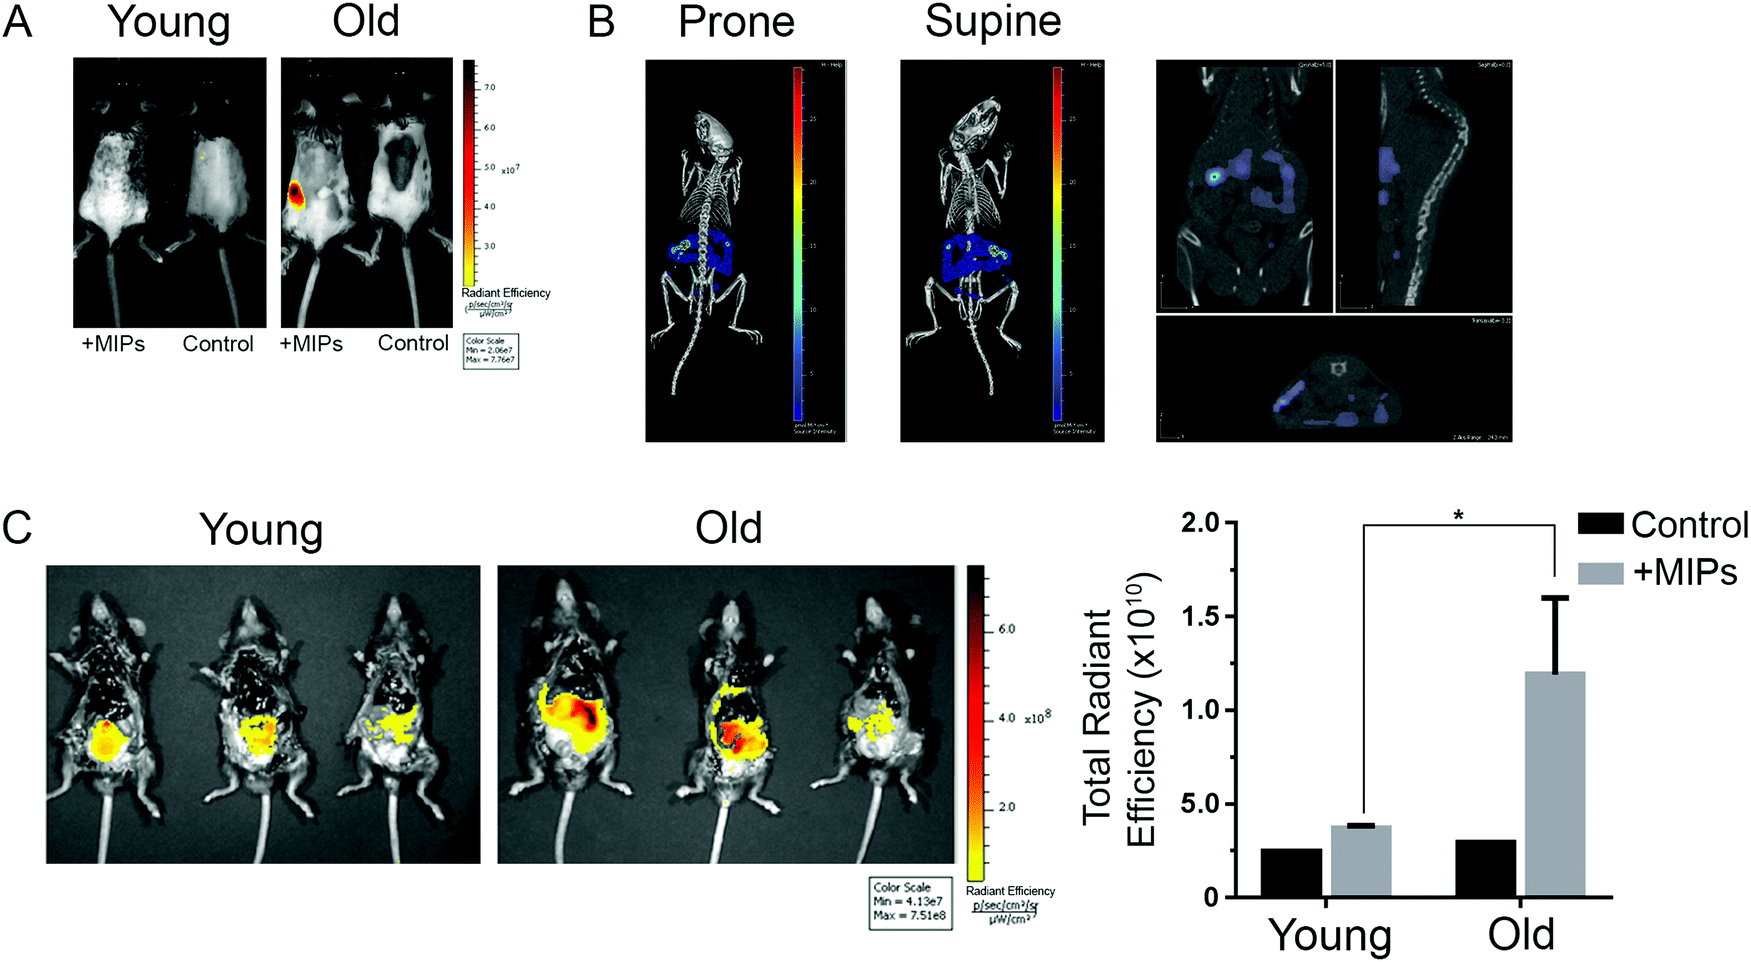 | ||
| Fig. 5 In vivo imaging of senescent cells by fluorescent nanoMIPs. (A) Representative 2D epi-fluorescence images of young (2 month) and old (11 month) mice injected intravenously with DyLight™ 800-labelled B2M nanoMIPs, compared with untreated controls from the same age group. (B) A 3D registration and signal localization of these nanoMIPs in a 16 month old mouse in the abdominal cavity. (C) Ex vivo imaging of dissected young (2 month) and old (11 month) mice in the supine position. The first two animals of each group were given B2M nanoMIPs, while the last one only received the vehicle (to control for autofluorescence of the tissues). Total radiant efficiency of fluorescence signals of the nanoMIP-treated mice is quantified and presented as mean ± SD. Unpaired t test shows statistical significance (*p < 0.05). | ||
Discussion
In recent years, the accumulation of senescent cells has been shown to play a significant role in triggering or maintaining several pathologies.10 This provides a rationale for devising strategies to detect the presence of senescent cells in tissues, which could be used for diagnostic and prognostic purposes. A key limiting factor for this is the ability to identify the senescent cells, although novel techniques are being developed to quantitate their presence.41 We hypothesized that (i) senescent cells would have a particular pattern of expression of cell surface proteins (the senescent surfaceome) and that (ii) this could be used to recognise these cells both in vitro and in vivo. We characterized several extracellular epitopes preferentially present in the senescent cells21 that could be used to detect them.22 In the current study, we tested the potential clinical relevance of our findings by using a new strategy that takes advantage of the senescent surfaceome to locate and eliminate these cells.We developed a nanoparticle that recognizes B2M, one of the proteins we previously identified as a membrane marker of senescence,21 using nanoMIP technology. These “plastic antibodies” represent an entirely new compound class, the production of which does not involve the use of animals and it is more cost-effective compared to actual antibodies. They can also withstand harsher conditions and have a longer shelf life. NanoMIPs are currently applied as recognition elements in both optical and electrochemical sensors and assays,42–44 for instance as replacement of antibodies in ELISA-like assays.45–47 Also, their production can be easily automated to improve batch-to-batch consistency.23 NanoMIPs have already been successfully employed as imaging tools in vivo, thus demonstrating their safety and potential diagnostic use.48
The B2M nanoMIPs showed selective binding to the senescent cells, proportional to the amount of B2M protein expressed on their surface. On their own, the nanoMIPs had no short-term toxic effects, a feature that could be exploited to use the nanoparticles as drug delivery mechanisms. Our data shows that the specificity of nanoMIPs allows them to carry a toxic payload into the senescence cells with a reduced effect in normal cells. Although this difference is ample and significant, the therapeutic window would have to be further increased before testing these tools in vivo with minimal side effects. These proof-of-principle results could be the basis for designing improved and more specific nanoMIP-drug combinations that could eventually be used in mouse models.
Our experiments also show that fluorescently tagged nanoMIPs could be used to detect the senescent cells in vivo and that, importantly, are not toxic when injected at single doses. Although B2M has basal levels of expression in several organs, we found that it can be successfully used to differentiate young from old mice. The B2M nanoMIPs preferentially accumulated in the abdominal cavity of old mice, which could indicate a higher presence of B2M-expressing senescent cells in the GI tract, as well as liver and spleen. Further experiments will be needed to better understand the localization of these cells in the body. Also, the choice of the right fluorophore needs to be considered carefully. Our results show that a wavelength of 647 nm is not as useful as 800 nm because much of the emitted light at a low wavelength is absorbed by tissue (specifically hemoglobin). This reduces the sensitivity of the imaging technique and makes it more difficult to separate true fluorophore signal from background tissue signal using post-processing methods (spectral unmixing).
It would also be important to design nanoMIPs against other members of the senescent surfaceome and characterize their accumulation in vivo, not only in ageing animals but also in mouse models of senescent-related diseases. We have previously shown that the expression of cell surface senescent markers is variable depending on the tissue of origin and the mechanism of induction of senescence.21 Therefore, it is expected that not all senescent cells would display a significant increase in B2M expression. This information will have to be taken into account when designing and using nanoMIPs for detection of senescence in specific situations. It would be necessary to determine which of the known membrane markers of senescence is more expressed in each condition of interest, as well as consider the off-target expression to reduce potential false negatives. This could provide an array of specific probes to be used as diagnostic, prognostic and therapeutic tools. Of note, mesoporous silica nanoparticles (MSN) capped with a galacto-oligosaccharide have also been used to deliver cytotoxic drugs to senescent cells, in this case using β-galactosidase as a target.49 Intracellular epitopes could be an alternative to our approach, although the fact that β-galactosidase expression may sometimes be nonspecific may reduce the specificity window. When tested in vivo, this approach was able to reduce the load of senescent cells in tissues and thus improved pathologies such as cancer and pulmonary fibrosis,50 which confirms that targeted delivery of drugs into senescent cells could have therapeutic relevance. Moreover, senescence clearance could also be achieved using chemical probes51 or a cellular approach.52
Our proof-of-principle results using nanoMIPs demonstrated the feasibility of a targeted approach to detect and kill senescent cells. Previously, it has been shown that nanoMIPs can also eliminate cancer cells.32 Our system opens the possibility of using tools that do not need to enter the cells to highlight and clear them, thus providing the basis of devising the first specific drug-delivery system based on the senescent surfaceome. This idea could be tested next using antibody–drug conjugates instead of nanoparticles, which could have a more immediate clinical application due to the previous experience with similar tools in approved cancer treatments.53
Materials and methods
Preparation of epitope-modified glass beads (solid-phase)
Glass beads (Spheriglass® 2429 CP00, 53–106 μm diameter, from Blagden Chemicals) were first activated by boiling in a 2 M NaOH solution for 15 min, then washed with deionized water and rinsed with acetone, dried at 80 °C and subsequently incubated overnight in 2% v/v 3-aminopropyltrimethyloxysilane in dry toluene solution (0.4 ml solution per g glass beads). This last step leads to beads bearing –NH2 surface groups. Afterwards, 60 g of glass beads were placed in a solution of succinimidyl iodoacetate linker, at 0.2 mg ml−1 in acetonitrile for 2 h in the dark (0.4 ml solution g per glass beads). The succinic moiety allows the linker to react with the amine-derivatized solid-phase, and the haloacetyl group enables subsequent coupling with the thiol group from cysteine added on the N-terminus of the peptide sequence. Afterwards, the beads were washed with 400 ml of acetonitrile in a sintered glass funnel and placed in a bottle containing 7 mg of the cysteine-modified peptide epitope (primary template) in 40 ml of deoxygenated phosphate buffered saline (PBS) containing 5 mM EDTA, pH 8.2. For the preparation of control nanoMIPs, biotin was used as a template. In particular, 60 g of amine-derivatized glass beads were incubated with a solution of biotin (Sigma Aldrich) containing 1-ethyl-3-(3-dimethylaminopropyl) carbodiimide hydrochloride (EDC) and N-hydroxysuccinimide (NHS) (both from Sigma Aldrich) at 0.5, 10 and 15 mg ml−1 respectively, in PBS, pH 7.4. After overnight incubation, the beads were washed with 500 ml of water in a sintered funnel and used for the synthesis of nanoMIPs.Synthesis of nanoMIPs
The following monomers were dissolved in PBS 5 mM, pH 7.4 (100 ml): N-isopropylacrylamide (39 mg), N,N′-methylenebisacrylamide (4 mg), N-tert-butylacrylamide (33 mg), N-(3-aminopropyl)methacrylamide hydrochloride (5.8 mg), acrylic acid (2.2 μl) and N-fluoresceinylacrylamide (2.9 mg). N-tert-Butylacrylamide was previously dissolved in ethanol (0.5 ml) and then added to the aqueous solution. We have found out that this monomer mix works very well when it comes to imprinting peptides or proteins.32,54 For the synthesis of control nanoMIPs (non-B2M-imprinted), biotin-derivatized glass beads were used, and all remaining conditions were kept identical. This was necessary, as no non-imprinted materials can be produced using the solid-phase approach (because the affinity separation step cannot be performed in the absence of a template, as the majority of the material produced is eluted during the washing steps). Biotin is sufficiently dissimilar to the B2M epitope and not naturally exposed on the cell surface, so these can be considered for practical purposes as non-B2M-imprinted materials. The solution containing the monomers was degassed under vacuum and sonicated for 5 min, and then purged with N2 for 20 min. Then, 60 g of B2M-derivatized glass beads were added to the solution. Polymerization was initiated by adding ammonium persulfate aqueous solution (800 μl, 60 mg ml−1) and N,N,N′,N′-tetramethylethylenediamine (24 μl). The headspace was flushed with N2 and the bottle was sealed with a screw cap. Polymerization was carried out at room temperature for 1 h. Subsequently, the content of the polymerization vessel was poured into a solid-phase extraction (SPE) cartridge (60 ml) equipped with a frit (20 μm porosity). A total of 9 washes with 20 ml of distilled water at 20 °C was carried out to remove low-affinity nanoMIPs, polymers and unreacted monomers. Afterwards, the SPE cartridge containing the solid phase was placed in a water bath at 70 °C for 15 min. An aliquot of 20 ml of distilled water pre-warmed at 65 °C was poured into the SPE to collect the high-affinity nanoMIPs. This action was repeated 7 times until about 140 ml of a solution of high-affinity nanoMIPs in water was collected. To ensure complete removal of all unreacted monomer from the bulk of the nanoparticles, aliquots of the collected solution were concentrated down to 2 ml using a centrifugal dialysis cartridge fitted with a membrane with 30 kDa molecular weight cut-off (Amicon Ultra, Merck Millipore). This was followed by seven washes (14 ml) with deionized water on the same dialysis cartridge. The procedure was repeated using biotin-derivatized glass beads to prepare control nanoMIPs.NanoMIP affinity testing
NanoMIPs were tested by surface plasmon resonance (SPR) to determine their affinity towards the primary template and compared against control nanoparticles (non-imprinted) prepared with the same monomer composition. An equilibrium dissociation constant (KD) of 52 nM was obtained for B2M-imprinted nanoMIPs. Experiments were performed on SIA Au SPR gold chips (GE Healthcare) modified with mercaptoundecanoic acid. Bare gold chips were first cleaned by hydrogen plasma at 50 W during five minutes on an Emitech K1050X Plasma Cleaner (Emitech) and then placed in ethanol containing 2.2 mg ml−1 mercaptoundecanoic acid, overnight in a sealed vial. After surface modification, chips were rinsed with ethanol and dried under a stream of N2, assembled on the holder following the manufacturer's instructions and docked onto the SPR instrument (Biacore 3000, GE Healthcare). For polymer coupling, the chips were activated by injection of 100 μl EDC 0.2 M and NHS 0.05 M in water at 5 μl min−1, followed by 1 injection of nanoMIPs (at 0.1 mg ml−1) in phosphate buffer at 5 μl min−1 until around 1000 RU were reached. Remaining NHS esters were deactivated by injection of 100 μl of ethanolamine hydrochloride (0.1 M) at 10 μl min−1 in PBS. The B2M epitope was then injected onto the nanoMIP-modified chip in concentrations ranging from 0.01 to 50 nM, and a control channel passivated with ethanolamine was used as a control. The analysis was performed in 1× PBS at pH 7.4. Kinetic analysis of the sensorgrams was performed with the BiaEvaluation software v4.1 assuming a 1![[thin space (1/6-em)]](https://www.rsc.org/images/entities/char_2009.gif) :1 Langmuir binding model with baseline drifting. To assess the nanoMIP specificity, albumin was injected in another nanoMIP-modified channel and the binding response was analysed using the BiaEvaluation software. In this case, a KD of 39 μM was obtained. Producing non-targeted nanoNIPs is difficult because, in order to collect the nanoMIPs from the solid phase, the presence of a template molecule on the solid-phase is required. Hence, we used nanoMIPs produced against a non-related peptide as control MIPs in SPR tests. These nanoMIPs showed a very poor affinity towards the target peptide (thus, a KD was not obtained for this interaction).
:1 Langmuir binding model with baseline drifting. To assess the nanoMIP specificity, albumin was injected in another nanoMIP-modified channel and the binding response was analysed using the BiaEvaluation software. In this case, a KD of 39 μM was obtained. Producing non-targeted nanoNIPs is difficult because, in order to collect the nanoMIPs from the solid phase, the presence of a template molecule on the solid-phase is required. Hence, we used nanoMIPs produced against a non-related peptide as control MIPs in SPR tests. These nanoMIPs showed a very poor affinity towards the target peptide (thus, a KD was not obtained for this interaction).
Size and concentration analysis of nanoMIPs
Particle size was measured with a Zetasizer Nano (Nano-S) particle-size analyzer from Malvern Instruments Ltd (UK). An aliquot of the dispersion of nanoMIPs in distilled water was sonicated for 2 min and then analyzed by dynamic light scattering at 25 °C in a 3 cm3 disposable polystyrene cuvette. Attenuator position, measurement duration and the number of runs were automatically chosen by the instrument. The values are reported as an average of 4 measurements. TEM images of nanoMIPs were taken using a JEOL JEM 1010, 100 kV high contrast TEM equipped with a Gatan SC1000 Orius CCD camera (Gatan, Abingdon Oxon, UK). Samples for the analysis were prepared by depositing a drop of the nanoMIPs dispersion, previously filtered through a 1.2 μm PES syringe filter, on a carbon-coated TEM copper grid (400 mesh), and leaving them to dry at room temperature. The nanoMIP concentration was assessed by freeze-drying an aliquot (20 ml) of the particle solution and then weighing the solid.Fluorescent tagging of nanoMIPs
The procedure to synthesize and analyse nanoMIPs has been adapted from previously reported protocols23 (see ESI†). NanoMIPs were tagged using two different approaches: (i) a fluorescein-based monomer (1.9 mg) was added to the polymeric mixture prior to the initiation of the polymerisation; (ii) nanoMIPs bearing primary amine groups were conjugated with NHS-derivatised fluorophores, such as Alexa Fluor 647 or DyLight 800. In particular, 20 μg of either AlexaFluor 647 NHS or DyLight 800 NHS were added to 0.3 mg of nanoMIPs in 2 ml of phosphate buffer pH 7.6. After 30 minutes, the excess of NHS-dye was washed off with 15 ml of MilliQ water using a 10 kDa Amicon centrifuge filter. This procedure was repeated 6 times until negligible fluorescence was detected in the eluate from the filter. Measurements of fluorescence intensity were performed using a Cary Eclipse spectrofluorometer (Varian Australia Pty Ltd) at 25 °C. Excitation and emission wavelengths were set at 492 nm and 515 nm. The fluorescent monomer used in this manuscript has been proved very useful in previous works.32 Furthermore, experiments with control nanoMIPs showed a much lower fluorescence intensity compared to cells incubated with B2M-specific nanoMIPs. This supports the reliability of the fluorescence signal given by the fluorescent monomer. The fluorescence measurements were performed using 1 ml quartz cuvettes of 10 mm path length. Before measuring the fluorescence, the absorbance of each sample at the excitation wavelength was checked to be below 0.1 AU, to minimize inner filtering effects. The KD was 48 nM for fluorescein-labelled nanoMIPs and 67 nM for DyLight-labelled nanoMIPs, which is in line with untagged nanoMIPs. This is consistent with the fact that the amount of fluorescent monomer which is eventually incorporated in the nanoMIPs is between 0.01 and 0.04%.Preparation of drug-loaded nanoMIPs
The solid-phase method employed for the MIP preparation relies on the covalent immobilization of the primary template (a synthetic short B2M peptide) on a solid support (glass beads). This support bearing the immobilized template is placed in contact with the monomer mixture, which also contains the drug to be incorporated as a secondary template in solution. The drug is not covalently linked nor physically entrapped within the nanoparticle but kept in the polymer matrix by relatively weak interactions with the polymer. This is effectively a sort of secondary imprinting process, whereby monomers will bind the drug whilst other monomers form the polymer matrix of the nanoMIP. Because of the nature of the interactions, the drug will be kept inside the nanoMIP due to the equilibrium with free drug outside the nanoparticle. As soon as the drug-loaded nanoMIP is placed in a drug-free solution, the drug will be free to diffuse outside due to the concentration gradient. The nanoMIPs should contain an amount of drug similar to what was used during the imprinting process (5 μM).Cell viability
Cell viability was assessed by flow cytometry using propidium iodide staining, as previously described.55 Samples were analysed using a BD FACSCanto II (Becton Dickenson Biosciences). Data acquisition and cell cycle analysis were done using the FACS Diva™ version 6.1.3 software (BD Biosciences) and graphs were plotted using the GraphPad Prism 7.0 software. Alternatively, the MTS (3-(4,5-dimethylthiazol-2-yl)-5-(3-carboxymethoxyphenyl)-2-(4-sulfophenyl)-2H-tetrazolium) assay was used to determine the number of metabolically active cells (CellTiter 96® AQueous One Solution Cell Proliferation Assay, Promega), following the manufacturer's instructions. 100000 cells were seeded per well in a 24-well plate and allowed to attach overnight. The medium was replaced with 500 μl of fresh medium and the cells were treated for 1 hour, after which they were washed gently with warm media to remove unbound MIPs and excess drug. Plates were read at an absorbance of 492 nm using the Infinite F50 absorbance plate reader (Tecan) and data recorded with the Magellan for F50 data analysis software. Using Microsoft Excel 2013, cell viability was calculated by the formula: % viability = (OD sample)/(OD control) × 100, where OD is the optical density (absorbance).
In vivo fluorescent imaging
1.9 mg kg−1 of B2M-targeted nanoMIPs were injected via the tail vein two hours before imaging. Wild type C57/BL6J mice, ranging in age from 2 to 24 months, were anaesthetised using 5% isoflurane in oxygen and maintained in 1–2% isoflurane for imaging. Prior to imaging, hair was removed from the back using hair clippers and depilatory cream. Sterile eye lubricant was applied to each eye. Mice were transferred to an IVIS Spectrum imaging system (PerkinElmer Inc.) for imaging. A range of excitation and emission filters were chosen for each fluorophore to enable spectral unmixing of the fluorescence signal from the background auto-fluorescence signal. 2D epi-fluorescence images were acquired from all mice. In a subset of representative mice, 3D fluorescence imaging tomography (FLIT) and whole-body micro-CT images were acquired using the IVIS Spectrum and QuantumFX micro-CT scanner (PerkinElmer Inc.) respectively, to allow localisation of the signal source. Analysis was performed in LivingImage software (version 4.5.2, PerkinElmer Inc.). For analysis of 2D images, whole abdomen regions were drawn on all mice and the total fluorescence signal was quantified in units of radiant efficiency. The spectral unmixing tool was used to separate the fluorophore signal from the background signal in all mice. 3D FLIT images were reconstructed and co-registered with both the LivingImage organ atlas and whole body micro-CT images using the multi-modality registration tool.In vivo toxicity measurements
Two animals per group were treated with nanoMIPs (0.4 mg ml−1) intravenously (5 ml kg−1 body weight), intraperitoneally or by oral gavage (10 ml kg−1 both). The weight of animals was measured and recorded daily for a period of 2 weeks, together with distress symptoms checks (skin appearance, natural behaviour, food and water intake, hydration status, body changes, locomotion, muscle tone). At the end of the study, animals were sacrificed and blood samples were collected through exsanguination via caudal vena cava. Blood samples were incubated on ice for 30 min to coagulate and were centrifuged for 15 min at 5000 rpm to separate the serum. Serum samples were frozen and assayed within 2 weeks for blood urea nitrogen (BUN), alanine transaminase (ALT) and aspartate transaminase (AST). Colorimetric determination of the above-mentioned enzyme levels was performed following the manufacturer's instructions, as follows: BUN (Kit no. EIABUN, Invitrogen, Carlsbad, CA), AST (K753-100, Biovision, Minneapolis, MN, USA) and ALT (Kit no. 700260, Cayman chemicals, Michigan, USA). Every serum sample was assayed in triplicate for all tested enzymes. For analysis of kidney and liver enzyme activity, the statistical analyses were performed using one-way ANOVA (GraphPad Software, La Jolla, CA). Differences were considered significant at the 95% level of confidence.Cell culture and senescence induction
All cells were cultured in Dulbecco's Modified Eagle's Medium (DMEM) supplemented with 10% foetal bovine serum (FBS), 100 IU ml−1 penicillin and 100 μg ml−1 streptomycin. Cells were incubated at 37 °C in a humidified incubator with 5% CO2. To keep the EJ cells proliferating, 1 μM tetracycline was added to the culture medium and this was replaced every three days. EJ p16 cells were maintained in complete culture medium supplemented with 100 μg ml−1 hygromycin and 2 μg ml−1 puromycin. To induce senescence by tetracycline removal, cells were trypsinized, washed with 1× phosphate buffered saline (PBS) and centrifuged at 1100 rpm for three minutes. This wash step was carried out three times. Cells were incubated with quercetin (Selleckchem), dasatinib (Selleckchem), oligomycin (Selleckchem), gramicidin (Sigma) or ABT-263 (Selleckchem) for the specified times.Western blot analysis
For lysate extraction, the medium was removed from the cells and the plates were washed once with 1× PBS. Cells were trypsinized, collected, and centrifuged and the pellets kept on ice. The cell pellet was re-suspended in 100 μl of ice-cold RIPA lysis buffer (radioimmunoprecipitation assay – 150 mM NaCl, 50 mM Tris HCl pH 8.0, 1% NP40, 0.1% SDS, 0.5% sodium deoxycholate) containing a 1:100 dilution of protease inhibitor cocktail and 1:100 dilution of phosphatase inhibitor cocktail (Sigma Aldrich) and incubated for 20 minutes on ice. Cells were ruptured by passing through a syringe 10 times or with sonication and centrifuged at 14000g for 15 minutes at 4 °C. The supernatant was transferred into Eppendorf tubes and protein concentrations were determined using the Bradford protein assay (Fermentas). A total of 35 μl of 4× Laemmli buffer was added and the samples were heated at 95 °C for 5 minutes. A total of 20 μg of total protein per sample was subjected to 10% or 15% SDS-PAGE and transferred to immobilon-P membranes (Millipore). Primary antibodies used were: β-actin (Abcam, #ab8227), p16 (Abcam, #ab54210) and B2M (LifeSpan BioSciences, #LS-B2200 and Abcam, #Ab87483).
Fluorescence measurements
Cells were grown on sterile 22 mm × 22 mm coverslips (Thermo Fisher) in 6-well plate. 3 × 10⁵ cells were seeded per well, incubated at 37 °C and allowed to attach overnight. A 1:50 dilution (2%) of sonicated MIPs (5 minutes with 30 seconds on–off intervals, using a Diagenode Bioruptor 2000 standard sonicator) was added to the medium and incubated at 37 °C for 24 hours. The following day, the cells were fixed with formalin, washed and then incubated with 1 μg ml−1 diamidino-2-phenylindole, dihydrochloride (DAPI, Invitrogen) in the dark for 10 minutes. Anti-fade mounting medium was dropped on a microscope slide and the washed coverslip was gently laid on the slide. The edges were sealed with nail varnish. Slides were protected from light and imaged using a Leica TCS SP5 confocal laser scanning microscope (Leica Microsystems).
A modified antibody binding assay protocol was used to detect nanoMIPs binding to cells by flow cytometry. Cells were detached either by using trypsin or by scraping with ice-cold PBS. Cells were counted, washed and re-suspended in ice-cold FACS buffer (2% FBS in 1× PBS) to obtain at least 1 × 10⁶ cells per ml. Samples were transferred to round bottom polystyrene tubes (Falcon) on ice and fluorescent nanoMIPs were added to the cells and incubated in the dark for 10 minutes. Samples were immediately read on the BD FACS Canto II (Becton Dickenson Biosciences). Unstained controls were used to gate the positive populations. Acquisition and analysis of data were done using the FACS Diva™ version 6.1.3 software (BD Biosciences).
Author contributions
Experiments were designed by AEEA, FC, SP and SM. NanoMIPs were generated by FC, SP, BHA and EP. Cellular experiments were performed by AEA with help from MP, MC and LC. Mouse work was performed by AEA with help from GKF and MP. JJ and MEK contributed to the mouse imaging experiments and analysis. The manuscript was written by SM with help from AEEA and FC, and reviewed by all authors.Conflicts of interest
FC and SP declare competing financial interests: FC is an employee and SP is the founder of MIP Diagnostics Ltd.Acknowledgements
Work in SM's lab was supported by an Innovation Fellowship from the University of Leicester and the M.C. Andreu Memorial Fund. AEEA was partly supported by a TETFund PhD fellowship. MP was supported by an MIBTP fellowship and the M. C. Andreu PhD Support Fellowship. MA was supported by a Saudi Government Doctoral Scholarship. We thank Dr Andrew Jamieson for help in designing the epitope for nanoMIP synthesis. We thank Dr Kees Straatman and the Advanced Imaging Facility for their help in obtaining and preparing the images. We also thank the staff of the Division of Biomedical Services, University of Leicester, for their care of the experimental animals.References
- M. Collado and M. Serrano, Nat. Rev. Cancer, 2010, 10, 51–57 CrossRef CAS PubMed.
- J. Campisi and F. d'Adda di Fagagna, Nat. Rev. Mol. Cell Biol., 2007, 8, 729–740 CrossRef CAS PubMed.
- T. Kuilman, C. Michaloglou, W. J. Mooi and D. S. Peeper, Genes Dev., 2010, 24, 2463–2479 CrossRef CAS PubMed.
- Z. Chen, L. C. Trotman, D. Shaffer, H. K. Lin, Z. A. Dotan, M. Niki, J. A. Koutcher, H. I. Scher, T. Ludwig, W. Gerald, C. Cordon-Cardo and P. P. Pandolfi, Nature, 2005, 436, 725–730 CrossRef CAS PubMed.
- C. Michaloglou, L. C. Vredeveld, M. S. Soengas, C. Denoyelle, T. Kuilman, C. M. van der Horst, D. M. Majoor, J. W. Shay, W. J. Mooi and D. S. Peeper, Nature, 2005, 436, 720–724 CrossRef CAS PubMed.
- M. Collado, J. Gil, A. Efeyan, C. Guerra, A. J. Schuhmacher, M. Barradas, A. Benguria, A. Zaballos, J. M. Flores, M. Barbacid, D. Beach and M. Serrano, Nature, 2005, 436, 642 CrossRef CAS PubMed.
- D. Drummond-Barbosa, Genetics, 2008, 180, 1787–1797 CrossRef PubMed.
- V. Krizhanovsky, M. Yon, R. A. Dickins, S. Hearn, J. Simon, C. Miething, H. Yee, L. Zender and S. W. Lowe, Cell, 2008, 134, 657–667 CrossRef CAS PubMed.
- T. W. Kang, T. Yevsa, N. Woller, L. Hoenicke, T. Wuestefeld, D. Dauch, A. Hohmeyer, M. Gereke, R. Rudalska, A. Potapova, M. Iken, M. Vucur, S. Weiss, M. Heikenwalder, S. Khan, J. Gil, D. Bruder, M. Manns, P. Schirmacher, F. Tacke, M. Ott, T. Luedde, T. Longerich, S. Kubicka and L. Zender, Nature, 2011, 479, 547–551 CrossRef CAS PubMed.
- D. Munoz-Espin and M. Serrano, Nat. Rev. Mol. Cell Biol., 2014, 15, 482–496 CrossRef CAS PubMed.
- S. He and N. E. Sharpless, Cell, 2017, 169, 1000–1011 CrossRef CAS PubMed.
- D. Munoz-Espin, M. Canamero, A. Maraver, G. Gomez-Lopez, J. Contreras, S. Murillo-Cuesta, A. Rodriguez-Baeza, I. Varela-Nieto, J. Ruberte, M. Collado and M. Serrano, Cell, 2013, 155, 1104–1118 CrossRef CAS PubMed.
- M. Demaria, N. Ohtani, S. A. Youssef, F. Rodier, W. Toussaint, J. R. Mitchell, R. M. Laberge, J. Vijg, H. Van Steeg, M. E. Dolle, J. H. Hoeijmakers, A. de Bruin, E. Hara and J. Campisi, Dev. Cell, 2014, 31, 722–733 CrossRef CAS PubMed.
- J. Campisi, Cell, 2005, 120, 513–522 CrossRef CAS PubMed.
- C. Lawless, C. Wang, D. Jurk, A. Merz, T. Zglinicki and J. F. Passos, Exp. Gerontol., 2010, 45, 772–778 CrossRef CAS PubMed.
- M. Matjusaitis, G. Chin, E. A. Sarnoski and A. Stolzing, Ageing Res. Rev., 2016, 29, 1–12 CrossRef CAS PubMed.
- M. Serrano, A. W. Lin, M. E. McCurrach, D. Beach and S. W. Lowe, Cell, 1997, 88, 593–602 CrossRef CAS PubMed.
- G. P. Dimri, X. H. Lee, G. Basile, M. Acosta, C. Scott, C. Roskelley, E. E. Medrano, M. Linskens, I. Rubelj, O. Pereirasmith, M. Peacocke and J. Campisi, Proc. Natl. Acad. Sci. U. S. A., 1995, 92, 9363–9367 CrossRef CAS.
- N. C. Yang and M. L. Hu, Exp. Gerontol., 2005, 40, 813–819 CrossRef CAS PubMed.
- S. Macip, M. Igarashi, L. Fang, A. Chen, Z. Q. Pan, S. W. Lee and S. A. Aaronson, EMBO J., 2002, 21, 2180–2188 CrossRef CAS PubMed.
- M. Althubiti, L. Lezina, S. Carrera, R. Jukes-Jones, S. M. Giblett, A. Antonov, N. Barlev, G. S. Saldanha, C. A. Pritchard, K. Cain and S. Macip, Cell Death Dis., 2014, 5, e1528 CrossRef CAS PubMed.
- M. Althubiti and S. Macip, Methods Mol. Biol., 2017, 1534, 147–153 CrossRef CAS PubMed.
- A. Poma, A. Guerreiro, M. J. Whitcombe, E. V. Piletska, A. P. Turner and S. A. Piletsky, Adv. Funct. Mater., 2013, 23, 2821–2827 CrossRef CAS PubMed.
- F. Canfarotta, A. Poma, A. Guerreiro and S. Piletsky, Nat. Protoc., 2016, 11, 443–455 CrossRef CAS PubMed.
- G. Pan, Q. Guo, Y. Ma, H. Yang and B. Li, Angew. Chem., Int. Ed. Engl., 2013, 52, 6907–6911 CrossRef CAS PubMed.
- J. Pan, W. Chen, Y. Ma and G. Pan, Chem. Soc. Rev., 2018, 47, 5574–5587 RSC.
- G. Pan, S. Shinde, S. Y. Yeung, M. Jakstaite, Q. Li, A. G. Wingren and B. Sellergren, Angew. Chem., Int. Ed. Engl., 2017, 56, 15959–15963 CrossRef CAS PubMed.
- M. Panagiotopoulou, Y. Salinas, S. Beyazit, S. Kunath, L. Duma, E. Prost, A. G. Mayes, M. Resmini, B. Tse Sum Bui and K. Haupt, Angew. Chem., Int. Ed., 2016, 55, 8244–8248 CrossRef CAS PubMed.
- B. Demir, M. M. Lemberger, M. Panagiotopoulou, P. X. Medina Rangel, S. Timur, T. Hirsch, B. Tse Sum Bui, J. Wegener and K. Haupt, ACS Appl. Mater. Interfaces, 2018, 10, 3305–3313 CrossRef CAS PubMed.
- S. Shinde, Z. El-Schich, A. Malakpour, W. Wan, N. Dizeyi, R. Mohammadi, K. Rurack, A. Gjorloff Wingren and B. Sellergren, J. Am. Chem. Soc., 2015, 137, 13908–13912 CrossRef CAS PubMed.
- D. Gussow, R. Rein, I. Ginjaar, F. Hochstenbach, G. Seemann, A. Kottman and H. L. Ploegh, J. Immunol., 1987, 139, 3132–3138 CAS.
- F. Canfarotta, L. Lezina, A. Guerreiro, J. Czulak, A. Petukhov, A. Daks, K. Smolinska-Kempisty, A. Poma, S. Piletsky and N. A. Barlev, Nano Lett., 2018, 18, 4641–4646 CrossRef CAS PubMed.
- R. Salama, M. Sadaie, M. Hoare and M. Narita, Genes Dev., 2014, 28, 99–114 CrossRef CAS PubMed.
- D. J. Baker, B. G. Childs, M. Durik, M. E. Wijers, C. J. Sieben, J. Zhong, R. A. Saltness, K. B. Jeganathan, G. C. Verzosa, A. Pezeshki, K. Khazaie, J. D. Miller and J. M. van Deursen, Nature, 2016, 530, 184–189 CrossRef CAS PubMed.
- D. J. Baker, T. Wijshake, T. Tchkonia, N. K. LeBrasseur, B. G. Childs, B. van de Sluis, J. L. Kirkland and J. M. van Deursen, Nature, 2011, 479, 232–236 CrossRef CAS PubMed.
- B. G. Childs, M. Gluscevic, D. J. Baker, R. M. Laberge, D. Marquess, J. Dananberg and J. M. van Deursen, Nat. Rev. Drug Discovery, 2017, 16, 718–735 CrossRef CAS PubMed.
- F. Canfarotta, A. Waters, R. Sadler, P. McGill, A. Guerreiro, D. Papkovsky, K. Haupt and S. Piletsky, Nano Res., 2016, 9, 3463–3477 CrossRef CAS.
- J. L. Kirkland and T. Tchkonia, EBioMedicine, 2017, 21, 21–28 CrossRef PubMed.
- Y. Hoshino, H. Koide, T. Urakami, H. Kanazawa, T. Kodama, N. Oku and K. J. Shea, J. Am. Chem. Soc., 2010, 132, 6644–6645 CrossRef CAS PubMed.
- M. J. Saffrey, Age, 2014, 36, 9603 CrossRef PubMed.
- A. Biran, L. Zada, P. Abou Karam, E. Vadai, L. Roitman, Y. Ovadya, Z. Porat and V. Krizhanovsky, Aging Cell, 2017, 16, 661–671 CrossRef CAS PubMed.
- S. Korposh, I. Chianella, A. Guerreiro, S. Caygill, S. Piletsky, S. W. James and R. P. Tatam, Analyst, 2014, 139, 2229–2236 RSC.
- F. Canfarotta, J. Czulak, K. Betlem, A. Sachdeva, K. Eersels, B. van Grinsven, T. J. Cleij and M. Peeters, Nanoscale, 2018, 10, 2081–2089 RSC.
- I. Basozabal, A. Guerreiro, A. Gomez-Caballero, M. Aranzazu Goicolea and R. J. Barrio, Biosens. Bioelectron., 2014, 58, 138–144 CrossRef CAS PubMed.
- C. Caceres, F. Canfarotta, I. Chianella, E. Pereira, E. Moczko, C. Esen, A. Guerreiro, E. Piletska, M. J. Whitcombe and S. A. Piletsky, Analyst, 2016, 141, 1405–1412 RSC.
- F. Canfarotta, K. Smolinska-Kempisty and S. Piletsky, Methods Mol. Biol., 2017, 1575, 389–398 CrossRef CAS PubMed.
- K. Smolinska-Kempisty, A. Guerreiro, F. Canfarotta, C. Caceres, M. J. Whitcombe and S. Piletsky, Sci. Rep., 2016, 6, 37638 CrossRef CAS PubMed.
- A. Cecchini, V. Raffa, F. Canfarotta, G. Signore, S. Piletsky, M. P. MacDonald and A. Cuschieri, Nano Lett., 2017, 17, 2307–2312 CrossRef CAS PubMed.
- A. Agostini, L. Mondragon, A. Bernardos, R. Martinez-Manez, M. D. Marcos, F. Sancenon, J. Soto, A. Costero, C. Manguan-Garcia, R. Perona, M. Moreno-Torres, R. Aparicio-Sanchis and J. R. Murguia, Angew. Chem., Int. Ed. Engl., 2012, 51, 10556–10560 CrossRef CAS PubMed.
- D. Munoz-Espin, M. Rovira, I. Galiana, C. Gimenez, B. Lozano-Torres, M. Paez-Ribes, S. Llanos, S. Chaib, M. Munoz-Martin, A. C. Ucero, G. Garaulet, F. Mulero, S. G. Dann, T. VanArsdale, D. J. Shields, A. Bernardos, J. R. Murguia, R. Martinez-Manez and M. Serrano, EMBO Mol. Med., 2018, 10, e9355 CrossRef PubMed.
- B. Lozano-Torres, I. Galiana, M. Rovira, E. Garrido, S. Chaib, A. Bernardos, D. Munoz-Espin, M. Serrano, R. Martinez-Manez and F. Sancenon, J. Am. Chem. Soc., 2017, 139, 8808–8811 CrossRef CAS PubMed.
- K. M. Kim, J. H. Noh, M. Bodogai, J. L. Martindale, X. Yang, F. E. Indig, S. K. Basu, K. Ohnuma, C. Morimoto, P. F. Johnson, A. Biragyn, K. Abdelmohsen and M. Gorospe, Genes Dev., 2017, 31, 1529–1534 CrossRef CAS PubMed.
- A. Thomas, B. A. Teicher and R. Hassan, Lancet Oncol., 2016, 17, e254–e262 CrossRef CAS PubMed.
- F. Canfarotta, J. Czulak, A. Guerreiro, A. G. Cruz, S. Piletsky, G. E. Bergdahl, M. Hedstrom and B. Mattiasson, Biosens. Bioelectron., 2018, 120, 108–114 CrossRef CAS PubMed.
- J. Samuel, S. Jayne, Y. Chen, A. Majid, A. Wignall, T. Wormull, H. Najeeb, J. L. Luo, G. D. Jones, S. Macip and M. J. Dyer, Cancer Res., 2016, 76, 6311–6319 CrossRef CAS PubMed.
Footnotes |
| † Electronic supplementary information (ESI) available. See DOI: 10.1039/c8nh00473k |
| ‡ These authors contributed equally to this paper. |
| § These authors contributed equally to this paper. |
| ¶ Current address: Chemistry Department, College of Science, Mustansiriyah University, Baghdad, Iraq. |
| This journal is © The Royal Society of Chemistry 2019 |