DOI:
10.1039/C7RA03632A
(Paper)
RSC Adv., 2017,
7, 36728-36734
Pharmacokinetics study of isorhamnetin in rat plasma by a sensitive electrochemical sensor based on reduced graphene oxide†
Received
29th March 2017
, Accepted 20th July 2017
First published on 25th July 2017
Abstract
Isorhamnetin (ISO), a flavonol aglycone, plays an important role in human health, such as cardiovascular protection, anti-allergy activity, anti-inflammatory effects, and anticancer activity. Thus, the highly sensitive and rapid detection of ISO, and its pharmacokinetic study, has important clinical significance in the field of medicine. Herein, a simple, rapid, sensitive, and accurate method for the electrochemical determination of isorhamnetin (ISO) for pharmaceutical quality control and pharmacokinetic research was developed using an electrochemically reduced graphene oxide modified glassy carbon electrode (ERGO/GCE). The results indicated that the ERGO/GCE remarkably increased the peak currents of ISO oxidation. Under optimized conditions, using differential pulse voltammetry (DPV), the peak current had a linear dependence on the concentration of ISO in the range of 1.0 × 10⁻⁸ to 1.2 × 10⁻⁵ M with a low detection limit of 3.2 × 10⁻⁹ M. The present voltammetric method has been successfully applied to the detection of ISO in tablets and in plasma. Moreover, this assay has also been successfully applied in the pharmacokinetic study of ISO in vivo through intragastric administration of tablets to SD-rats. Therefore, this strategy opens up a new avenue for the application of an electrochemical method in the field of ISO pharmacokinetics.
1. Introduction
Isorhamnetin (ISO) is an important member of the flavonoid family from Hippophae rhamnoides L. and the Ginkgo biloba L. Studies have shown that ISO acts as a powerful antioxidant and is capable of mopping up free radicals, the harmful molecules linked to cancer, hence ISO has good anti-cancer activity.1 Furthermore, it also has a significant effect on relieving angina and decreasing the content of cholesterol in serum. In clinical practice, ISO plays an important role in suppressing the aggregation of platelets, and it appears to cause many biochemical and pharmacological effects on human health.2 Thus, it is imperative to establish a rapid, simple and convenient method for the determination of ISO in tablets or in serum samples.
Up to now, many methods have been developed for the determination of ISO, including high performance liquid chromatography (HPLC),3 gas chromatography (GC),4 capillary electrophoresis (CE)5 and a quartz microchip6 coupled with various detection techniques, such as UV spectrophotometry.7 The coupling of these techniques may provide high selectivity of the assay, but brings also some disadvantages of operating complexity, time and reagent consumption, and high cost, which hamper their further application. In contrast to these methods, electrochemical techniques have been extensively used as non-tedious procedures, accurate, with inexpensive instruments, less time consumption, highly selective and sensitive method of analysis.8–10 As we know, flavonoids and related polyphenols, including ISO, generally consist of two benzene rings linked by an oxygen containing heterocycle. Meanwhile, the oxidation reaction of flavonoids is strongly related to the structure of the flavonoids, which contains several free phenolic hydroxyl groups. Therefore, electrochemical methods had been widely used to determine flavonoids.11–14 Furthermore, it is worth mentioning that the electrochemical behavior of ISO at bare glassy carbon electrode (GCE) has been studied by our group.15 However, the sensitivity and detection range of the analytical methods should be improved, and it is of great importance to study the further application of the presented approach.
Graphene, a two dimensional carbon-based nanomaterials, has recently received extensive interest in the fields of electrochemical sensors and biosensors due to their intrinsic properties, including high surface-to-volume ratio, ease of functionalizing its surface, excellent conductivity, and biocompatibility.16–18 Additionally, graphene-based materials modified films can significantly improve the electrocatalytic properties of substrates, decrease the overpotential, increase the reaction rate and improve the stability and reproducibility of the electrode response. Thus, graphene-based materials modified electrodes have been widely used in the determination of biomolecules, drugs, small-molecules, and other organic species.16,19–22
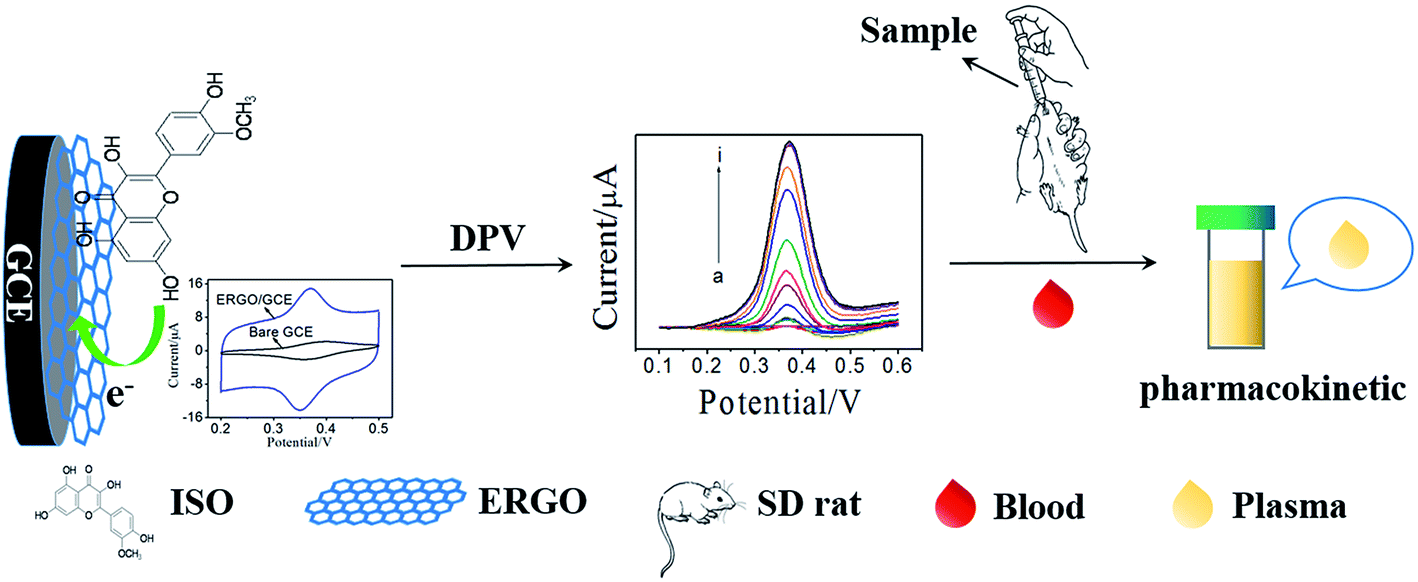
Pharmacokinetic studies on active ingredients in natural products and traditional Chinese medicines are important to illustrate their action mechanism.23,24 Thus, developing a facile and reliable method to investigate the pharmacokinetic of ISO is imperative. In the present work, a sensitive electrochemical sensor for ISO detection was fabricated using graphene modified GCE, which was prepared by electrochemical reduction of graphene oxide (ERGO). Subsequently, the electrochemical behavior of ISO on the ERGO/GCE was studied and compared with that on bare GCE. The results demonstrated that this ERGO modified GCE showed a high sensitive detection of ISO with good selectivity due to the formation of a stable conjugated π–π structure between benzene ring of ISO and ERGO. More importantly, the practical application of this novel voltammetric method was demonstrated to determine ISO in tablet, and ISO in plasma after intragastric administration of ISO tablets to SD-rats with satisfied results (Scheme 1). Therefore, the proposed method has a significant attraction both in pharmaceutical control and in pharmacokinetic studies.
 |
| | Scheme 1 Scheme of ISO detection and its pharmacokinetics investigation. | |
2. Experimental
2.1. Reagents and solutions
Graphite flakes (99.99%, 325 mesh) was purchased from Alfa Aesar. ISO standards were purchased from Aladdin (Shanghai, China). Xindakang tablets (were 5 mg total flavonoids per tablet) were purchased from local drug store (Sichuan giada pharmaceutical Co., Ltd). Phosphate buffer solution (PBS, purchased from Sinopharm Chemical Reagent Co., Ltd) were prepared by mixing the stock solutions of 0.2 M NaH2PO4 and 0.2 M Na2HPO4, and then adjusting the pH with 0.05 M H3PO4 or 0.05 M NaOH. All reagents were analytical grade and used without further purification. All the solutions were prepared with double-distilled water.
2.2. Apparatus
All cyclic voltammetry (CV) and differential pulse voltammetric (DPV) measurements were performed using CHI 630C electrochemical workstation (Shanghai CH Instruments, China). A conventional three-electrode system was used throughout the experiments, including an ERGO/GCE as the working electrode, a platinum wire as a counter electrode, and an Ag/AgCl (saturated) electrode as a reference. Scanning electron microscopy (SEM) was conducted on a Hitachi SU8010 scanning electron microscope for the structural and morphological characterization of the GO (HITACHI, Japan).
2.3. Preparation of GO
GO was synthesized from natural graphite powder using a modified Hummers and Offeman's method.25,26 In brief, 0.5 g of graphite flake, 0.5 g of NaNO3, and 23 mL of H2SO4 were stirred together in an ice bath. While maintaining vigorous agitation, an amount of 3 g of KMnO4 was slowly added, and the rate of addition was controlled carefully to avoid a sudden increase in temperature. The mixture was then maintained at 35 °C for about 1 h. Deionized water (40 mL) was gradually added, causing an increase in temperature to 90 °C. Finally, the mixture was further treated with 100 mL of deionized water and 3 mL of 30% H2O2, turning the color of the solution from dark brown to yellow. GO was then obtained through filtering, water washing, sonicating and drying process.
2.4. Fabrication of the ERGO/GCE
The ERGO/GCE was prepared using our previous work.27 In brief, GCE (3 mm diameter, CH Instruments, Inc.) was polished successively with 0.3 and 0.05 μm Al2O3 slurry, respectively, and rinsed thoroughly with doubly distilled water between each polishing step. The electrode was then successively sonicated in 1![[thin space (1/6-em)]](https://www.rsc.org/images/entities/char_2009.gif) :1 nitric acid, acetone and doubly distilled water for 2 min, respectively. After being cleaned, dried with purified nitrogen stream, 5 μL of the GO solution (1 mg mL−1) was drop casted on the surface of well-polished GCE. After being dried, the electrochemically reduced ERGO modified electrode were prepared at reduced potential from 0 to −1.5 V for 10 scan cycles by cyclic voltammetry in phosphate buffer (0.1 M pH 4.0).
:1 nitric acid, acetone and doubly distilled water for 2 min, respectively. After being cleaned, dried with purified nitrogen stream, 5 μL of the GO solution (1 mg mL−1) was drop casted on the surface of well-polished GCE. After being dried, the electrochemically reduced ERGO modified electrode were prepared at reduced potential from 0 to −1.5 V for 10 scan cycles by cyclic voltammetry in phosphate buffer (0.1 M pH 4.0).
2.5. Preparation of standard and sample solution
The standard solution of 1 mM ISO was prepared by dissolving ISO powder in ethanol, and then it was stored in the dark. Aqueous stock solution of ISO was used for further preparation of final solutions.
Five tablets (5 mg per tablet) were finely pulverized, then weighted the average mass and dissolved with 10 mL ethanol. After sonication and filtration, a suitable aliquot of the clear filtrate was diluted with pH 4.0 PBS to form appropriated sample solutions.
2.6. Analytical procedure
All electrochemical analysis were performed in 10 mL electrochemical cell containing a certain volume of standard solution or sample solution of ISO, 10 mL 0.1 M PBS (pH 4.0) as supporting electrolyte fitted with magnetic stirrer. Then, the CV or DPV curves were recorded. The CV was recorded from 0.2 to 0.5 V at scan rates from 5 to 500 mV s−1. The DPV was recorded from 0.1 to 0.6 V with amplitude of 0.05 V, pulse width of 0.05 s, and pulse period of 0.2 s.
2.7. Application to the pharmacokinetics study in rats
A pharmacokinetic study was performed in Sprague-Dawley (SD) rats (n = 6, weight range 200–250 g), which obtained from the Fuzhou Wushi Animal Center. Before experiments, the SD-rats were fasted, and fed with standard laboratory water. The 6 SD rats were set into three groups randomly (2 in each). ISO solution was intragastric administered to each rats at a dose of 50 mg kg−1. The blood samples were collected from rat tail vessels under light post-dosing using microfuge tubes which containing heparin as anti-coagulant before administration and after intragastric administration (0, 0.5 h, 1 h, 1.5 h, 3 h, 5 h, 6 h, 7 h, 8 h, and 24 h). Then, the plasma samples were obtained by immediately centrifuging blood samples at 3000 rpm for 10 min and stored frozen at −20 °C until analysis. All plasma samples were analyzed within 1 day. The experimental protocol was approved by the Institutional Animal Ethics Committee (IAEC) for the use of experimental animals and all animal studies were carried out according to the Guide for Care and Use of Laboratory Animals.
3. Results and discussion
3.1. Choice of the materials
To study the clinical pharmacokinetic of ISO by electrochemical method, it is necessary to select a highly sensitive, rapid and stable detection method. For this purpose, various materials have been investigated to develop the electrochemical sensor interface, such as electrochemically reduced graphene oxide (ERGO), CdS QDs quantum dots (QDs), TiO2 nanomaterial, MoS2 nanosheets and Au nanoclusters (Fig. S1†). The results indicated that the ERGO modified GCE exhibited the most stable and sensitive signal. We rationalize this result as the good biocompatibility, electrical conductivity, stability, and large specific surface area of the ERGO. Besides, the π–π effect between ERGO and ISO could facilitate the enrichment of the ISO on the electrode surface, which greatly improved the sensitivity of the sensor. Therefore, in this experiment, ERGO/GCE was chosen to study the pharmacokinetics of ISO.
3.2. Characterization of the modified electrode
SEM was used to investigate the surface morphologies of bare GCE and ERGO/GCE. As can be seen from Fig. 1A, the bare GCE surface was rather smooth and flat, and the shape of graphene on the ERGO/GCE surface was planar sheet-like, indicating that the ERGO was successfully casted on the bare GCE surface (Fig. 1B). On the other hand, the AFM images showed that after the ISO enriched on the surface of the ERGO/GCE, the thickness of the modified electrode was significantly increased (Fig. 1C and D).
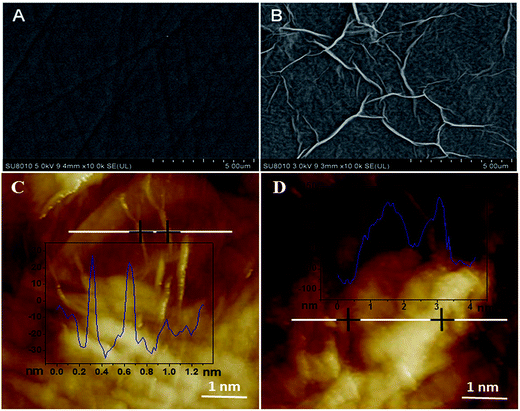 |
| | Fig. 1 SEM images of bare GCE (A) and ERGO modified GCE (B); AFM images of ERGO modified GCE (C) and after enrichment of ISO (D). | |
3.3. Electrochemical behavior of ISO on the ERGO/GCE
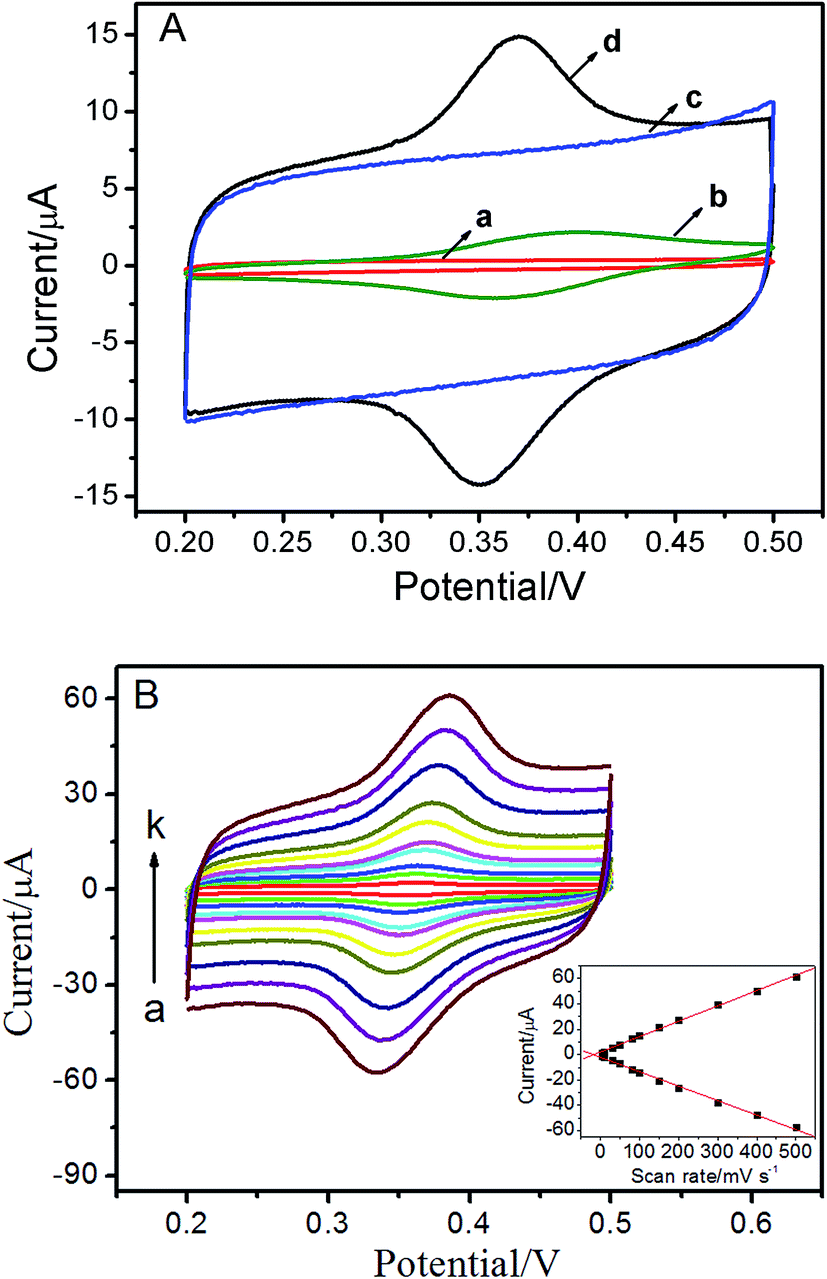
The electrochemical response of ISO at the bare GCE and the ERGO/GCE were examined by CVs. As shown in Fig. 2A, no redox peaks were observed on both the bare GCE (curve a) and ERGO/GCE (curve c) in blank buffer solution. When ISO was added into the blank solution, a tiny pair of redox peaks appeared (Epa = 0.399 V, Epc = 0.359 V) at the bare GCE (curve b). As expected, for the ERGO/GCE (curve d, Epa = 0.372 V, Epc = 0.349 V), the currents of the redox peaks (Ipa, ERGO/GCE = 7.16 μA, Ipc, ERGO/GCE = 7.01 μA) increased remarkably compared with bare GCE (Ipa, GCE = 1.71 μA, Ipc, GCE = 1.58 μA), which could be attributed to the high specific surface area and good conductivity of ERGO. The scan rate is probably the most important experimental parameter for evaluating the effects due to adsorbed reactant and/or due to reactant reaching the electrode via diffusion. With the increase of the scan rates, the redox peak currents of ISO increase simultaneously, accompanied with an enlargement of the peak separation (Fig. 2B). Moreover, both the anodic and cathodic peak currents increase linearly with the scan rates between 5 and 500 mV s−1 (inset of Fig. 2B). These results suggested that the electron-transfer was relatively fast and the reaction of this reversible couple is a surface adsorption-controlled process of the ISO, which is in agreement with the previous report.15
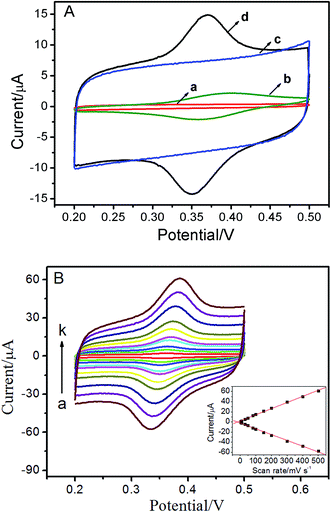 |
| | Fig. 2 (A) CVs on bare GCE (a, b) and ERGO/GCE (c, d) in the absence (a, c) and in the presence (b, d) of 5 × 10⁻⁶ M ISO in pH 4.0 PBS. (B) CVs of ISO on ERGO modified electrode at different scan rate of 5, 10, 30, 50, 80, 100, 150, 200, 300, 400 and 500 mV s−1. Inset: plot of peak currents vs. scan rates. | |
3.4. Optimization of experimental conditions
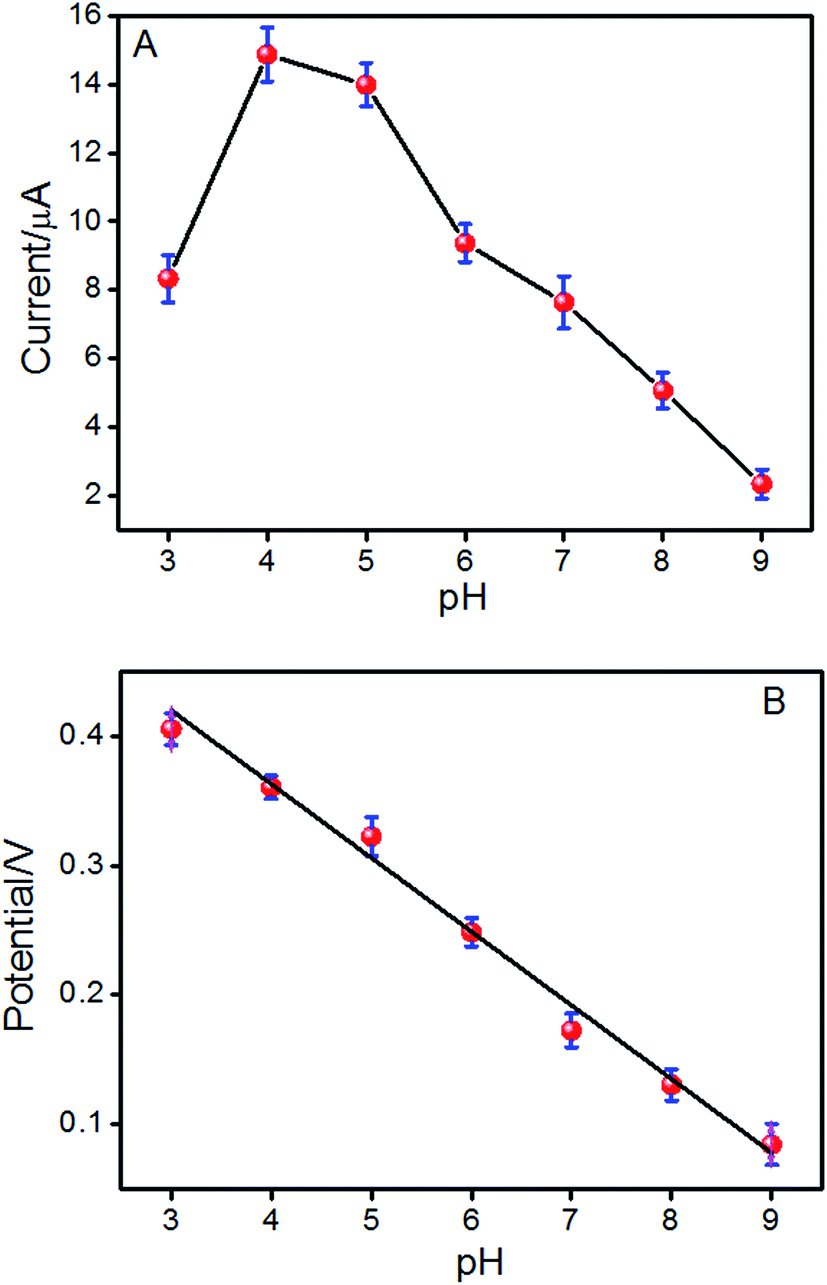
The effect of pH values on the redox reaction of ISO on the ERGO/GCE was also investigated in the pH range from 3.0 to 9.0. In Fig. 3A, the oxidation peak current of ISO increased with increasing pH value until it reaches 4.0, and then decreases when the pH increases further, which is in agreement with previous reports.15,28 Considering the sensitivity for determining ISO, pH 4.0 is chosen for the subsequent analytical experiments. What is more, with pH value of the solution increasing, the oxidation peak potential (Epa) shifts negatively, indicating that protons have taken part in the electrode reaction process of ISO.29 It is found that the value of the oxidation peak potential changes linearly with pH values in the range of 3.0–9.0 with a slop of −56.2 mV pH−1 (Fig. 3B), which is approximately close to the theoretical value for a reversible process (59 mV pH−1 at 298 K), suggesting that the number of protons and electrons involved in the electrochemical redox process of ISO is equal.14
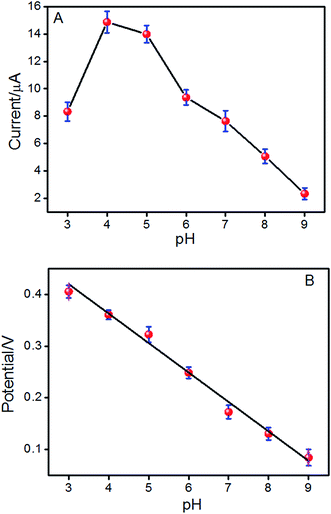 |
| | Fig. 3 The effect of pH on the peak current (A) and peak potential (Epa) (B) of the reversible couple for ISO in phosphate buffer solutions. | |
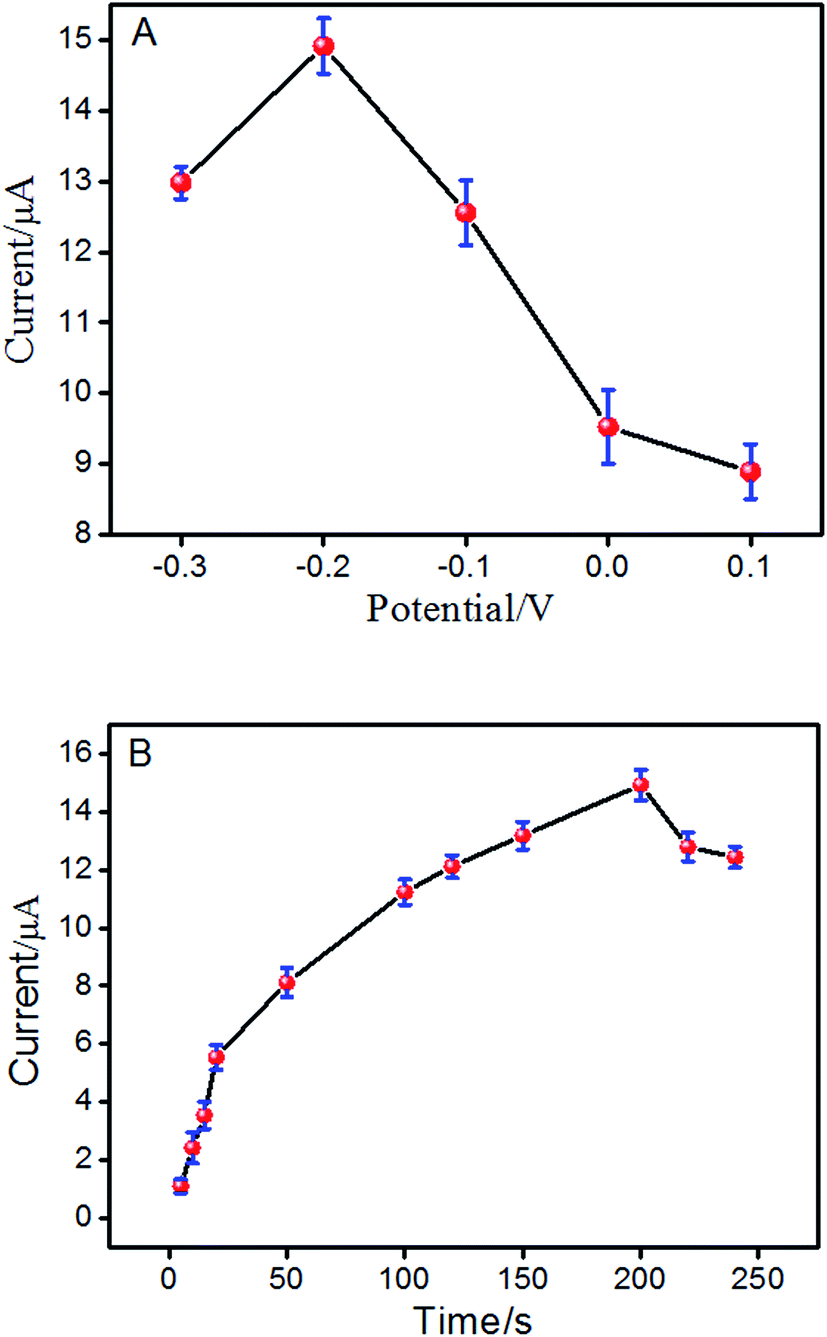
Hence, the effect of different accumulation conditions on the electrochemical response of ISO at ERGO/GCE was also studied. Fig. 4A reveals that at the accumulation potential of −0.2 V, the maximum peak current was reached. Thus, the optimal adsorption potential was performed at −0.2 V. In addition, the effect of accumulation time on the oxidation peak current of ISO was also investigated with varying the accumulation time with a −0.2 V accumulation potential. As shown in Fig. 4B, the peak current increased rapidly with the accumulation time and reached a maximum at 200 s. Then, it decreased rapidly with increased accumulation time. Thus, the preconcentration time of 200 s has been used in the following measurements.
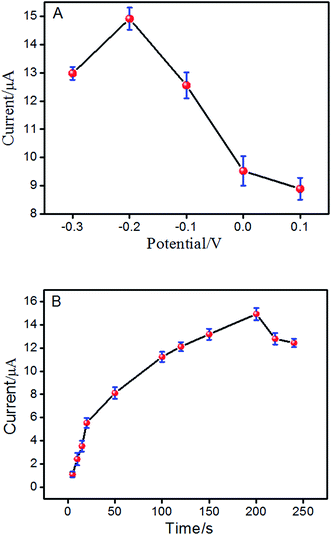 |
| | Fig. 4 Effect of the preconcentration potential (A) and preconcentration time (B) on peak current of ISO by DPV in pH 4.0 PBS. | |
3.5. Linearity, detection limit and reproducibility
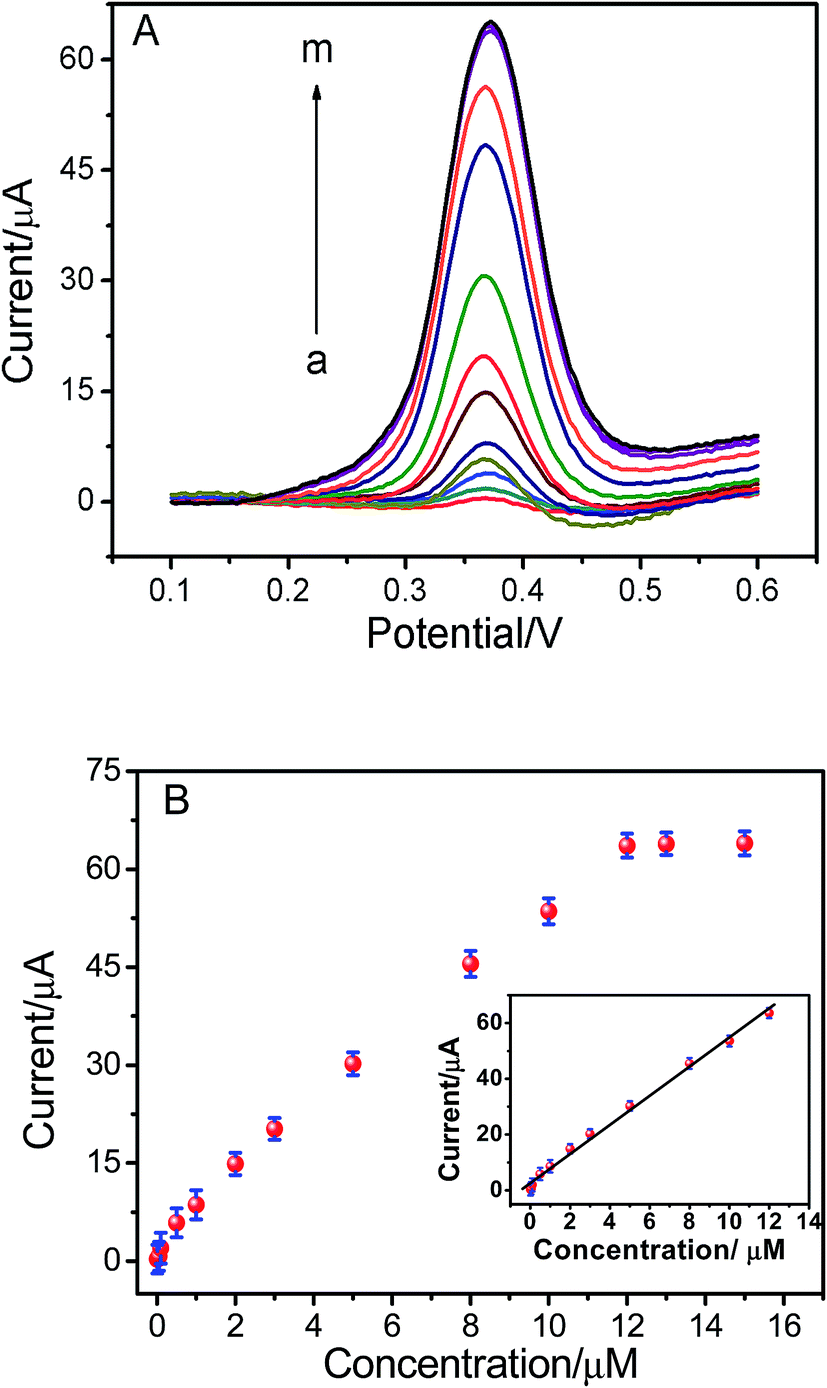
Under the optimum conditions mentioned above, the determination of ISO using the ERGO/GCE could be achieved. As shown in the Fig. 5, the peak currents were linearly proportional to ISO concentrations in the ranges of 1.0 × 10⁻⁸ to 1.2 × 10⁻⁵ M, I = 5.198 C + 2.669 (r = 0.9902). The detection limits for ISO was 4.3 × 10⁻⁹ M. The linear range and detection limit of this method was compared with other methods reported previously (Table 1), the results indicated that the analytical performance of this sensor was better than that of the other existing sensors for detection of ISO. Thus, this method not only expanded the application of ERGO, but also opened new doors toward the rapid detection of ISO. The relative standard deviation of six repetitive measurements of standard solution containing 1 × 10⁻⁶ M ISO is 2.53%, showing good reproducibility.
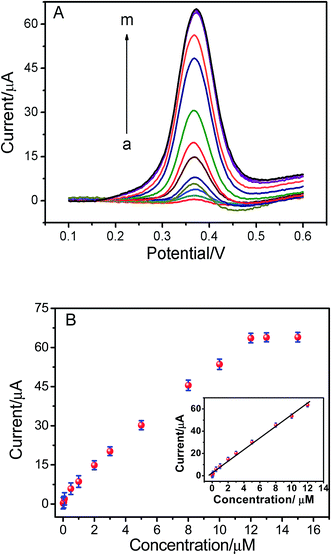 |
| | Fig. 5 (A) DPVs of different ISO concentrations at ERGO/GCE. ISO concentrations (from a to m: 0.01, 0.05, 0.1, 0.5, 1.0, 2.0, 3.0, 5.0, 8.0, 10.0, 12.0, 13.0 and 15.0 μM). (B) The relationship between ISO concentrations and peak current. | |
Table 1 Comparison of different methods for the detection of ISO
| Methods |
Linear range |
Detection limits |
Ref. |
| Ultra-performance liquid chromatography-mass spectrometry. Gas chromatography-mass spectrometry. Reversed phase high performance liquid chromatography. |
| Electrochemistry |
1 × 10⁻⁸ to 1 × 10⁻⁷ M, 1 × 10⁻⁶ to 1.0 × 10⁻⁵ M |
5.0 × 10⁻⁹ M |
15 |
| UPLC-MSa |
0.01–1.0 μg mL−1 |
3.48 ng mL−1 |
30 |
| GC-MSb |
— |
2.5 μg mL−1 |
4 |
| RP-HPLCc |
0.008–0.400 mg mL−1 |
2.33 μg mL−1 |
5 |
| RP-HPLC |
0.425–17.008 μg mL−1 |
0.061 μg mL−1 |
31 |
| Electrochemistry |
1.0 × 10⁻⁸ to 1.2 × 10⁻⁵ M |
4.3 × 10⁻⁹ M |
This work |
3.6. Interference study
The effect of possible interfering species such as uric acid (UA), ascorbic acid (AA), glycine and some ions on ISO detection has been examined (Fig. 6). No significant interfering was observed upon addition of 0.1 mM UA, AA, glucose, glycine, K+, Mg2+, Ca2+ and Na+ in 5 μM ISO. These results suggested that the proposed ERGO/GCE based sensor has good selectivity.
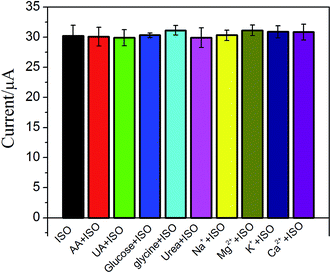 |
| | Fig. 6 The effect of different interfering substances on electrical signals. | |
3.7. The recovery of the method
The method presented above was applied to the determination of ISO in tablets by DPV method described here. The results were listed in the Table 2. It shows that the proposed method has an acceptable recovery and could be used to determine ISO in tablets.
Table 2 Determination of ISO in tablet (n = 6, repetitive measurement number)
| Analyst |
Labeled (mg) |
Added (mg) |
Found (mg) |
R.S.D. (%) |
Recovery (%) |
| ISO |
3.74 |
0 |
3.74 ± 0.07 |
1.2 |
— |
| 1 |
4.63 ± 0.09 |
3.3% |
89% |
| 1.5 |
5.04 ± 0.11 |
2.5% |
104% |
| 2 |
6.00 ± 0.17 |
2.9% |
113% |
3.8. Study of pharmacokinetics
To demonstrate the utility of the present method in vivo conditions, the pharmacokinetics of ISO in the plasma of SD rats was studied. The oxidation peak currents of ISO spiked in blank plasma as measured by DPV increased linearly with the concentration of ISO in the range of 5.0 × 10⁻⁸ to 1.2 × 10⁻⁵ M (Fig. 6A, r = 0.9956). The present method was applied to the pharmacokinetic investigations of ISO in SD-rats plasma after intragastric administration. The mean plasma concentration–time curve profile was illustrated in Fig. 7B. Pharmacokinetic parameters were estimated by Kinetica version 4.4.1 software (Thermo Electron Corporation, USA) and listed in Table 3. As shown in Fig. 7B, there was a secondary absorption peak appeared on 7 hours due to the enterohepatic circulation, which was in accordance with the previous reports by LC-MS/MS.32 The results indicated that the method is applicable to pharmacokinetic studies of ISO.
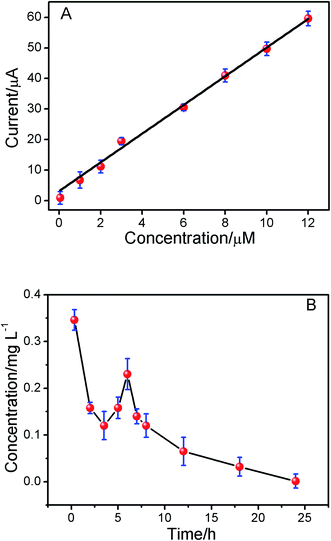 |
| | Fig. 7 (A) The relationship between ISO concentration (0.05, 1.0, 2.0, 3.0, 6.0, 8.0, 10.0 and 12.0 μM) in plasma and peak current. (B) The concentration–time curve of ISO after intragastric administration in rat. | |
Table 3 Pharmacokinetic parameters of ISO in SD rats' plasma after administering ISO solutions (50 mg kg−1, n = 6)a
| Parameters |
SD rat estimate (mean ± S.D.) |
| T1/2α, distribution half-life; T1/2β, elimination half-life; Cmax, maximum plasma concentration; AUC0–∞, areas under the curve; AUMC0–t, the area under the first moment of the plasma concentration–time curve; MRT0–t, mean residence time. |
| T1/2α (h) |
1.684 ± 0.23 |
| T1/2β (h) |
6.728 ± 0.37 |
| Cmax (mg L−1) |
0.346 ± 0.29 |
| AUC0–∞ (mg L−1 h−1) |
4.119 ± 0.33 |
| AUMC0–t |
5.121 ± 0.039 |
| MRT0–t (h) |
3.633 ± 0.28 |
4. Conclusions
A sensitive and rapid electrochemical assay method to study the pharmacokinetics of ISO based on ERGO/GCE was successfully established. The present electrochemical assay approach improved the detection limit and provided a wide range of concentrations for determination of ISO. Furthermore, the validated methods were successfully applied to study the pharmacokinetic of ISO in SD rat after intragastric administration. The present method is rapid, easy, low cost, and showed satisfactory reproducibility, good stability, excellent sensitivity, and acceptable recovery. Thus, this method could be a promising approach to the clinical pharmacokinetics research as well as for intensive medicines monitoring.
Acknowledgements
We gratefully acknowledge the financial support of the National Natural Science Foundation of China (21405015), Joint Funds for the Innovation of Science and Technology, Fujian Province (2016Y9055, 2016Y9054), the Natural Science Foundation of Fujian Province of China (2014J07009), and the Medical Elite Cultivation Program of Fujian (2013-ZQN-JC-25).
References
- K. A. Manu, M. K. Shanmugam, L. Ramachandran, F. Li, K. S. Siveen, A. Chinnathambi, M. E. Zayed, S. A. Alharbi, F. Arfuso, A. P. Kumar, K. S. Ahn and G. Sethi, Cancer Lett., 2015, 363, 28–36 CrossRef CAS PubMed.
- A. Carotenuto, E. Fattorusso, V. Lanzotti, S. Magno, V. De Feo and C. Cicala, Phytochemistry, 1997, 44, 949–957 CrossRef CAS PubMed.
- F. Pellati, F. P. Precipe, D. Bertelli and S. Benvenuti, J. Pharm. Biomed. Anal., 2013, 81–82, 126–132 CrossRef CAS PubMed.
- F. X. Deng and S. W. Zito, J. Chromatogr. A, 2003, 986, 121–127 CrossRef CAS PubMed.
- Y. G. Zu, C. Y. Li, Y. J. Fu and C. J. Zhao, J. Pharm. Biomed. Anal., 2006, 41, 714–719 CrossRef CAS PubMed.
- P. Gebauer, D. Malá and P. Boček, Electrophoresis, 2009, 30, 29–35 CrossRef CAS PubMed.
- B. Ma, X. M. Zhou, G. Wang, H. Q. Huang, Z. P. Dai, J. H. Qin and B. C. Lin, Electrophoresis, 2006, 27, 904–909 CrossRef PubMed.
- S. A. Lim and M. U. Ahmed, RSC Adv., 2016, 6, 24995–25014 RSC.
- S. T. Sultana, J. T. Babauta and H. Beyenal, Biofouling, 2015, 31, 745–758 CrossRef CAS PubMed.
- H. Wang and Z. J. Ren, Biotechnol. Adv., 2013, 31, 1796–1807 CrossRef CAS PubMed.
- P. Xiao, Q. Zhou, F. Xiao, F. Q. Zhao and B. Z. Zeng, Int. J. Electrochem. Sci., 2006, 1, 228–237 CAS.
- A. L. Liu, S. B. Zhang, L. Y. Huang, Y. Y. Cao, H. Yao, W. Chen and X. H. Lin, Chem. Pharm. Bull., 2008, 56, 745–748 CrossRef CAS PubMed.
- S. Sun, M. Q. Zhang, Y. J. Li and X. W. He, Sensors, 2013, 13, 5493–5506 CrossRef CAS PubMed.
- D. B. Lu, S. X. Lin, L. T. Wang, T. Li, C. M. Wang and Y. Zhang, J. Solid State Electrochem., 2014, 18, 269–278 CrossRef CAS.
- A. L. Liu, S. B. Zhang, W. Chen, L. Y. Huang, X. H. Lin and X. H. Xia, Talanta, 2008, 77, 314–318 CrossRef CAS PubMed.
- A. T. Lawal, Talanta, 2015, 131, 424–443 CrossRef CAS PubMed.
- F. H. Cincotto, D. L. C. Golinelli, S. A. S. Machado and F. C. Moraes, Sens. Actuators, B, 2017, 239, 488–493 CrossRef CAS.
- J. H. Xu, Y. Z. Wang and S. S. Hu, Microchim. Acta, 2017, 184, 1–44 CrossRef CAS.
- D. Chen, H. B. Feng and J. H. Li, Chem. Rev., 2012, 112, 6027–6053 CrossRef CAS PubMed.
- M. Thakur, M. K. Kumawat and R. Srivastava, RSC Adv., 2017, 7, 5251–5261 RSC.
- Y. H. Zheng, L. Huang, Z. Y. Zhang, J. Z. Jiang, K. Y. Wang, L. M. Peng and G. Yu, RSC Adv., 2017, 7, 1776–1781 RSC.
- Y. Song, Y. Luo, C. Z. Zhu, H. Li, D. Du and Y. H. Lin, Biosens. Bioelectron., 2016, 76, 195–212 CrossRef CAS PubMed.
- W. Zhou, K. Y. Tam, M. X. Meng, J. J. Shan, S. C. Wang, W. Z. Ju, B. C. Cai and L. Q. Di, J. Chromatogr. A, 2015, 1376, 84–97 CrossRef CAS PubMed.
- G. W. Li, X. L. Zeng, Y. Xie, Z. Z. Cai, J. C. Moore, X. R. Yuan, Z. H. Cheng and G. Ji, Fitoterapia, 2012, 83, 182–191 CrossRef CAS PubMed.
- W. S. Hummers and R. E. Offeman, J. Am. Chem. Soc., 1958, 80, 1339 CrossRef CAS.
- L. J. Cote, F. Kim, J. X. Huang and L. Blodgett, J. Am. Chem. Soc., 2009, 131, 1043–1049 CrossRef CAS PubMed.
- H. L. Guo, X. F. Wang, Q. Y. Qian, F. B. Wang and X. H. Xia, ACS Nano, 2009, 3, 2653–2659 CrossRef CAS PubMed.
- S. V. Jovanovic, S. Steenken, M. Tosic, B. Marjanovic and M. G. Simic, J. Am. Chem. Soc., 1994, 116, 4846–4851 CrossRef CAS.
- H. R. Zare, Z. Sobhani and M. Mazloum-Ardakani, Sens. Actuators, B, 2007, 126, 641–647 CrossRef CAS.
- G. W. Li, X. L. Zeng, Y. Xie, Z. Z. Cai, J. C. Moore, X. R. Yuan, Z. H. Cheng and G. Ji, Fitoterapia, 2012, 83, 182–191 CrossRef CAS PubMed.
- M. Olszewska, J. Pharm. Biomed. Anal., 2008, 48, 629–635 CrossRef CAS PubMed.
- J. He, Y. Feng, H. Z. Ouyang, B. Yu, Y. X. Chang, G. X. Pan, G. Y. Dong, T. Wang and X. M. Gao, J. Pharm. Biomed. Anal., 2013, 84, 189–195 CrossRef CAS PubMed.
Footnotes |
| † Electronic supplementary information (ESI) available. See DOI: 10.1039/c7ra03632a |
| ‡ Huaping Peng and Lingling Zhang contributed equally to the present study. |
|
| This journal is © The Royal Society of Chemistry 2017 |
Click here to see how this site uses Cookies. View our privacy policy here. 
 Open Access Article
 This Open Access Article is licensed under a Creative Commons Attribution-Non Commercial 3.0 Unported Licence
 d and
Ailin Liu
d and
Ailin Liu