Silicon nanoparticles–graphene paper composites for Li ion battery anodes†
Jeong K.
Lee
a,
Kurt B.
Smith
b,
Cary M.
Hayner
b and
Harold H.
Kung
*b
aDepartment of Chemical Engineering, Dong-A University, 840 Hadan2-dong, Saha-gu, Pusan 604-714, Korea. E-mail: jklee88@dau.ac.kr
bDepartment of Chemical and Biological Engineering, Northwestern University, Evanston, IL 60208-312, USA. E-mail: hkung@northwestern.edu
First published on 10th February 2010
Abstract
Composites of Si nanoparticles highly dispersed between graphene sheets, and supported by a 3-D network of graphite formed by reconstituting regions of graphene stacks exhibit high Li ion storage capacities and cycling stability. An electrode was prepared with a storage capacity >2200 mA h g−1 after 50 cycles and >1500 mA h g−1 after 200 cycles that decreased by <0.5% per cycle.
The possibility of using rechargeable Li ion batteries (LIBs) for various automobile and stationary power storage applications has generated significant research activities to improve their energy and power densities, cost, and cycling life. One area of active research is to replace graphite as the energy storage component in the anode with materials of higher storage capacities. Because silicon possesses the highest theoretical energy density among common elements,1 cheap, and easy to handle, it is an attractive candidate and a focus of investigations. Various forms of Si electrode materials have been tested, including Si particles mixed with a binder and conducting carbon,2–4 nanowires,5 thin films,6 and 3-D porous particles.7 However, they are still not satisfactory, either because of poor cycling stability, cost of manufacturing, and/or insufficient capacity improvement. Although the exact causes for storage capacity loss upon cycling are not known, one contribution is fracturing of the Si structure consequent to the large volume changes upon lithiation/delithiation, resulting in loss of electrical contact of some Si fragments. Various attempts to stabilize these structures have been reported. The most common attempt is to encapsulate the Si structure with a conducting carbonaceous layer, in hope that this would better retain the Si fragments from being disconnected from the conducting electrode. Various precursors can be used for encapsulation, including resorcinol–formaldehyde gel,4 poly(vinyl chloride)-co-vinyl acetate8 or polyvinyl chloride and chlorinated polyethylene,9 glucose,10 and fullerene C60.11 Noticeable improvements were achieved, but capacity degradation was not eliminated.
In many engineered structures, such as nanowires and thin films, Si exhibits near-theoretical storage capacities. However, the need to maintain electric conductivity with the current collector limits their dimensions to hundreds of nm. These structures also typically require a metallic current collector as support, the weight of which significantly lowers the overall storage capacity of the electrode assembly. Si nanoparticles, on the other hand, can be readily dispersed onto light-weight conducting carbon as support, which minimizes and even eliminates the weight penalty due to the current collector. In addition, Si-conducting carbon composites are generally easy to manufacture.
Graphene papers, made from stacks of graphene sheets, are electrically conducting, mechanically strong, and rather easy to prepare from exfoliated graphite.12 They possess limited Li storage capacities, consistent with carbon-based materials.13,14 On the other hand, since they can be made from a low-cost starting material and the preparation process is also cheap and readily scalable, they are attractive supports for other high-storage capacity materials. Indeed, graphene has been used successfully to support SnO2 nanoparticles as an LIB anode.15 Here, we report the preparation and performance of high-capacity Si nanoparticle–graphene paper anodes and identify important properties that govern the performance.
Graphene oxide (GO) was prepared by oxidizing graphite (Asbury Carbons, 230U Grade) with a procedure following Kovtyukhova et al.16 that produces mostly single sheet GO. Briefly, the graphite was first treated with conc. H2SO4, P2O5, and K2S2O8. After filtering, washing, and drying, the solid was re-suspended in conc. H2SO4 and oxidized further with KMnO4 and H2O2 to obtain a thick, brownish yellow suspension. The GO suspension was washed with 10% HCl, then repeatedly with DDI (distilled, deionized) water, and kept in the dark as a suspension (∼7 mg ml−1) until use.
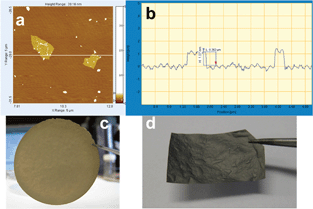
The Si–graphene (SG) paper composite was prepared in air. Si nanoparticles (H-terminated, stored in Ar, <30 nm, Meliorum Nanotechnology) were transferred from storage into a vial and exposed to air overnight to ensure formation of a surface layer of silicon oxide in order to facilitate dispersion in water. First, they were dispersed in a small amount of DDI water using sonication. Then, the GO suspension was added. The mixture was sonicated for 60 min and then suction filtered. The suspension settled on the filter membrane as a thin sheet of self-supporting Si–graphene oxide (SGO) composite paper. The paper, which was a random but oriented stack of mostly single sheet graphene oxide (Fig. 1a and b), was removed carefully from the filter membrane and air-dried. The dried paper (Fig. 1c) was cut into smaller strips and loaded into a quartz tube for reduction in a flow of 10% H2 in Ar at 700 °C for 1 h to form the SG composite. See ESI† for more details of the preparation procedure.
 | ||
| Fig. 1 (a) and (b) AFM scan of two graphene oxide sheets, showing a single layer height of about 1 nm and about 1 × 1 μm wide (also determined by DLS, Fig. S3 (ESI†)). (c) Si–graphene oxide (SGO) composite paper. (d) Si–graphene (SG) composite paper obtained by reduction of SGO. | ||
The SGO composite changed from amber and somewhat translucent to the grey and opaque SG composite after reduction (Fig. 1d). It also became more brittle, but was still flexible and could be cut with a metal cutter into free-standing circular disks for electrochemical testing. The Si loading was determined from weight loss during thermogravimetric analysis in air. In some cases, the SG composite paper was crushed and mixed with a binder to form an electrode.
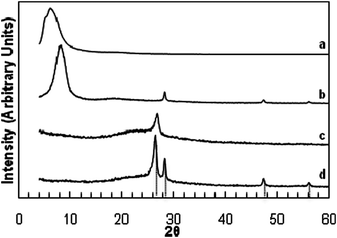
A dried GO paper without Si showed a strong, broad X-ray diffraction peak at 6–10° 2θ (∼10 Å d-spacing). A similar intense peak at 8–10° 2θ was observed for a sample containing ∼60% Si (Fig. 2 curves a and b, and Fig. S1 (ESI†)). These values are consistent with the reported interlayer spacing for graphene.17 For a SGO sample, peaks corresponding to (111), (220), and (311) diffractions of Si were also observed, suggesting that as prepared, the Si nanoparticles remained mostly in the metallic state. After reduction in H2 to form a SG sample, the low-angle diffraction peak of interlayer spacing disappeared, while a peak appeared at about 26.4° on top of a broad hump, indicating the presence of both crystalline and disordered graphite phases (Fig. 2 curves c and d). The Si diffractions were still clearly observed, and, from the line width of the (220) diffraction, the Si particles were estimated to be 21–22 nm, suggesting little particle coarsening (Fig. S2, ESI†).
 | ||
| Fig. 2 X-Ray diffraction patterns of: (a) GO paper; (b) SGO paper; (c) graphene paper by reduction of GO paper; (d) SG paper by reduction of SGO. Diffractions due to graphite (26.4°) and Si (111), (220), and (311) at 28.3°, 47.2°, and 56.1°, respectively, are indicated. | ||
The thermal reduction temperature and time significantly affected the extent of graphite reconstitution in SG samples (Fig. S8, ESI†) and their conductivity (Table S1, ESI†). The conductivities were 13.1, 18.7, and 33.1 S cm−1 for SG samples reduced at 550, 700, and 850 °C, respectively, versus 6.8 × 10⁻³ S cm−1 for an unreduced SGO paper. The corresponding sheet resistances were 153, 107, 60, and 2.9 × 10⁵ Ω for the three SG samples and the SGO sample, respectively. The degree of graphite reconstitution, however, decreased as 550 > 700 > 850 °C sample.
The SEM image of a SGO composite (Fig. 3a) showed a stack of GO sheets. After reduction, the sheets appeared more crumpled, and pockets of void space were clearly visible (Fig. 3b). The sheet-like morphology is also shown in the TEM images of graphene sheets (Fig. S6, ESI†), and of SG samples containing Si nanoparticles, 20–25 nm in diameter, dispersed between graphene sheets (Fig. 3c and Fig. S5 (ESI†)).
 | ||
| Fig. 3 Edge-view SEM images of: (a) SGO paper; (b) SG paper, and TEM images of: (c) SG paper. | ||
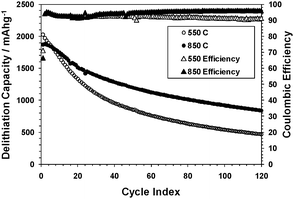
The effect of conductivity (and graphite crystallinity) on the electrochemical behavior was examined using two SG samples reduced at 550 or 850 °C. The results (Fig. 4) show that the sample with a higher conductivity retained better the charge capacity upon cycling. This is consistent with the hypothesis that a sample with a higher conductivity would be more tolerant to Si particles fracturing and redepositing on other parts of the graphene surface.
 | ||
| Fig. 4 Delithiation capacities and coulomb efficiencies of SG samples reduced at 550 or 850 °C, using a constant current–constant voltage (CCCV) method (1.5–0.020 V, 1000–50 mA g−1). | ||
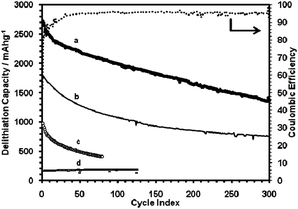
The Li ion storage capacities of these SG samples are much higher than graphene alone (cf. curve d, Fig. 5). Destroying the extended 3-D network of graphite by crushing a SG sample also had a deleterious effect (curve c, Fig. 5). The SG paper thickness also appeared to be important. The sample shown in curve a, Fig. 5, was the thinnest made (5 μm versus typically 15 μm), and it exhibited the highest capacity. This might indicate Li diffusion limitation into the bulk structure of the thicker samples at the high currents used (1000 mA g−1).
 | ||
| Fig. 5 Delithiation capacity of: (a) SG paper sample 2, 61 wt% Si, shown with coulombic efficiencies; (b) SG paper sample 1, 59 wt% Si, tested using the CCCV method (sample 1: 1.5–0.005 V, 1000–80 mA g−1; sample 2: 1.5–0.02 V, 1000–50 mA g−1); (c) SG paper sample 1, crushed and mixed with PVDF binder, cycled at 100 mA g−1 constant current mode (2.0–0.02 V); (d) graphene-only sample cycled using CCCV method. | ||
In addition to thermal reduction, chemical reduction of graphene oxide using hydrazine was also attempted.18 After reduction, the reduced material could not form a stable suspension in water but “phase segregated” as precipitates. After drying by evaporation, the resulting solid was visually inhomogeneous, and an electrode made with this solid showed a low-storage capacity that rapidly decreased with cycling.
The surface of the Si nanoparticles could be made hydrophobic by HF etching to remove the surface SiO2 layer and convert the surface to Si–H groups. A suspension of such Si nanoparticles and dimethylhydrazine-reduced, isocyanate modified graphene oxide19 in DMF was dried in a rotavap and the resulting solid was crushed and mixed with a binder to form an electrode. The electrode showed a low-storage capacity and poor cycling stability (Fig. S12, ESI†).
These results suggest that electrodes of high-storage capacities and good cycling stability can be obtained from graphene–Si composites provided that the Si nanoparticles are well dispersed between the graphene sheets, and portions of the graphene sheet stacks reconstitute to form a network of graphite (Fig. 6). The latter is important as the network provides high electrical conductivity throughout the electrode and serves as a mechanically strong framework to anchor the more flexible graphene sheets that sandwich the Si nanoparticles. That the graphite is reconstituted from the graphene sheets ensures excellent electrical contact between the crystalline and noncrystalline regions, as well as mechanical integrity of the junctions between regions. However, overly extensive reconstitution of the 3-D graphite network should be avoided to prevent excessive crowding and, consequently, agglomeration of the Si particles, which would degrade the cycling stability. Storage materials other than Si can be used in this manner.
 | ||
| Fig. 6 Cross-sectional schematic drawing (not to scale) of a high-capacity, stable electrode, made of a continuous, conducting 3-D network of graphite (red) anchoring regions of graphene–Si composite. Blue circles: Si nanoparticles, black lines: graphene sheets. | ||
In conclusion, electrodes that exhibit high-storage capacities and good cycling stability can be prepared starting with graphene sheets, derived from low-cost graphite and using a simple, easily scalable procedure. This is demonstrated with a composite of graphene and Si nanoparticles as anode for the Li ion battery. It is important, however, that the Si nanoparticles are very well dispersed in the graphene composite, and a portion of the graphene sheets reconstitute graphite to form a continuous, highly conducting 3-D network that also serves as a structural scaffold to anchor the graphene sheets that sandwich and trap the Si nanoparticles.
This work was supported by the US Department of Energy, grant DE-FG02-01ER15184. JKL acknowledges support from the National Research Foundation of Korea Grant funded by MEST (NRF-2009-C1AAA001-0093307) for part of this work. CMH was supported in part by DOE-EFRC (DE-AC02-06CH11357). The authors thank Asbury Carbons for the supply of natural graphite flakes and Prof. M. Hersam and L. Jaber-Ansari for conductivity measurements. EM measurements were performed in the EPIC facility of NUANCE Center at Northwestern University, supported by NSF-NSEC, NSF-MRSEC, Keck Foundation, the State of Illinois, and Northwestern University, and X-ray measurements in the J. B. Cohen X-Ray Diffraction Facility supported by the MRSEC program of the National Science Foundation (DMR-0520513) at the Materials Research Center of Northwestern University.
Notes and references
- D. Larcher, S. Beattie, M. Morcrette, K. Edstroem, J. C. Jumas and J. M. Tarascon, J. Mater. Chem., 2007, 17, 3759–3772 RSC.
- B. A. Boukamp, G. C. Lesh and R. A. Huggins, J. Electrochem. Soc., 1981, 128, 725–729 CAS.
- B. Gao, S. Sinha, L. Fleming and O. Zhou, Adv. Mater., 2001, 13, 816–819 CrossRef CAS.
- J.-K. Lee, M. C. Kung, L. Trahey, M. N. Missaghi and H. H. Kung, Chem. Mater., 2009, 21, 6–8 CrossRef CAS.
- C. K. Chan, H. Peng, G. Liu, K. McIlwrath, X. F. Zhang, R. A. Huggins and Y. Cui, Nat. Nanotechnol., 2008, 3, 31–35 CrossRef CAS.
- T. Takamura, M. Uehara, J. Suzuki, K. Sekine and K. Tamura, J. Power Sources, 2006, 158, 1401–1404 CrossRef CAS.
- H. Kim, B. Han, J. Choo and J. Cho, Angew. Chem., Int. Ed., 2008, 47, 10151–10154 CrossRef CAS.
- Y. Liu, Z. Y. Wen, X. Y. Wang, X. L. Yang, A. Hirano, N. Imanishi and Y. Takeda, J. Power Sources, 2009, 189, 480–484 CrossRef CAS.
- Q. Si, K. Hanai, N. Imanishi, M. Kubo, A. Hirano, Y. Takeda and O. Yamamoto, J. Power Sources, 2009, 189, 761–765 CrossRef CAS.
- Y. S. Hu, R. Demir-Cakan, M. M. Titirici, J. O. Muller, R. Schlogl, M. Antonietti and J. Maier, Angew. Chem., Int. Ed., 2008, 47, 1645–1649 CrossRef CAS.
- A. A. Arie, J. O. Song and J. K. Lee, Mater. Chem. Phys., 2009, 113, 249–254 CrossRef CAS.
- M. J. Allen, V. C. Tung and R. B. Kaner, Chem. Rev., 2010, 110, 132–145 CrossRef CAS.
- C. Wang, D. Li, C. O. Too and G. G. Wallace, Chem. Mater., 2009, 21, 2604–2606 CrossRef CAS.
- M. Liang and L. Zhi, J. Mater. Chem., 2009, 19, 5871–5878 RSC.
- S.-M. Paek, E. Yoo and I. Honma, Nano Lett., 2009, 9, 72–75 CrossRef CAS.
- N. I. Kovtyukhova, P. J. Ollivier, B. R. Martin, T. E. Mallouk, S. A. Chizhik, E. V. Buzaneva and A. D. Gorchinskiy, Chem. Mater., 1999, 11, 771–778 CrossRef CAS.
- D. A. Dikin, S. Stankovich, E. J. Zimney, R. D. Piner, G. H. B. Dommett, G. Evmenenko, S. T. Nguyen and R. S. Ruoff, Nature, 2007, 448, 457–460 CrossRef CAS.
- S. Stankovich, D. A. Dikin, R. D. Piner, K. A. Kohlhaas, A. Kleinhammes, Y. Jia, Y. Wu, S. T. Nguyen and R. S. Ruoff, Carbon, 2007, 45, 1558–1565 CrossRef CAS.
- S. Stankovich, R. D. Piner, S. T. Nguyen and R. S. Ruoff, Carbon, 2006, 44, 3342–3347 CrossRef CAS.
Footnote |
| † Electronic supplementary information (ESI) available: Material preparation procedure and characterization (XRD, DLS, AFM, TEM, SEM, conductivity, electrochemistry data). See DOI: 10.1039/b919738a |
| This journal is © The Royal Society of Chemistry 2010 |
