 Open Access Article
Exploring borderline SN1–SN2 mechanisms: the role of explicit solvation protocols in the DFT investigation of isopropyl chloride†
Karine Nascimento de Andrade a,
Bárbara Pereira Peixotoa,
José Walkimar de Mesquita Carneiro
 b and
Rodolfo Goetze Fiorot
 *a
*a
aDepartment of Organic Chemistry, Chemistry Institute, Universidade Federal Fluminense (UFF), Outeiro de São João Batista, 24020-141, Niterói, RJ, Brazil. E-mail: rodolfofiorot@id.uff.br
bDepartment of Inorganic Chemistry, Chemistry Institute, Universidade Federal Fluminense (UFF), Outeiro de São João Batista, 24020-141, Niterói, RJ, Brazil
First published on 5th February 2024
Abstract
Nucleophilic substitution at saturated carbon is a crucial class of organic reactions, playing a pivotal role in various chemical transformations that yield valuable compounds for society. Despite the well-established SN1 and SN2 mechanisms, secondary substrates, particularly in solvolysis reactions, often exhibit a borderline pathway. A molecular-level understanding of these processes is fundamental for developing more efficient chemical transformations. Typically, quantum-chemical simulations of the solvent medium combine explicit and implicit solvation methods. The configuration of explicit molecules can be defined through top-down approaches, such as Monte Carlo (MC) calculations for generating initial configurations, and bottom-up methods that involve user-dependent protocols to add solvent molecules around the substrate. Herein, we investigated the borderline mechanism of the hydrolysis of a secondary substrate, isopropyl chloride (iPrCl), at DFT-M06-2X/aug-cc-pVDZ level, employing explicit and explicit + implicit protocols. Top-down and bottom-up approaches were employed to generate substrate–solvent complexes of varying number (n = 1, 3, 5, 7, 9, and 12) and configurations of H2O molecules. Our findings consistently reveal that regardless of the solvation approach, the hydrolysis of iPrCl follows a loose-SN2-like mechanism with nucleophilic solvent assistance. Increasing the water cluster around the substrate in most cases led to reaction barriers of ΔH‡ ≈ 21 kcal mol−1, with nine water molecules from MC configurations sufficient to describe the reaction. The More O'Ferrall–Jencks plot demonstrates an SN1-like character for all transition state structures, showing a clear merged profile. The fragmentation activation strain analyses indicate that energy barriers are predominantly controlled by solvent–substrate interactions, supported by the leaving group stabilization assessed through CHELPG atomic charges.
Introduction
SN1 and SN2 are the limiting archetypical mechanisms for nucleophilic substitution reactions. The former, also known as DN + AN, involves a stepwise mechanism, while the latter, referred to as ANDN, is associated with a concerted process. DN stands for dissociation of the nucleofuge, while AN for association of the nucleophile.1,2 Substrates with leaving groups (e.g., halides and sulfonates) bonded to saturated secondary carbon atoms can undergo both mechanisms and/or pass by borderline pathways (intermediate processes between the two extremes) depending on the solvent and nucleophile nature. When the solvent also acts as a nucleophile, the chemical reaction is commonly referred to as solvolysis. Along the continuum between these two mechanisms, the SN2 may gradually shift toward SN1 as the transition state develops a carbocation character.3–6A key factor influencing the gradual transition from SN1 to SN2 mechanisms is the solvent activity.3 Some studies describe the solvolysis reactions of secondary substrates following a merged mechanism, exhibiting both SN1 and SN2 characteristics.5–8 This process often involves active nucleophilic solvent assistance (NSA) in the rate-determining step (sometimes referred as SN3).9,10 While extensive efforts have been devoted to unraveling the intricate effects of solvation in chemical processes, accounting for precise solvent effects into quantum simulations of chemical reactions remains a substantial challenge.11–13 An efficient strategy to describe these processes at the atomic level combines explicit and implicit solvation methods.14,15 There are two main methodologies for defining the solvent arrangement around a particular solute: top-down and bottom-up.16 The top-down approach begins with simulating the condensed phase using molecular dynamics or Monte Carlo calculations. Subsequently, a selected number of explicit solvent molecules are introduced at a specific distance from the solute, considering relevant interactions (e.g., 3–4 Å) or based to the radial pair distribution function, to be evaluated at the quantum level.4,17–20 In the bottom-up approach, explicit solvent molecules are added one by one around the substrate, seeking stable interactions based on the user's chemical intuition or molecular electrostatic potential analysis.16,21–25
Yamabe and co-workers utilized the top-down approach through molecular dynamics simulations to investigate the continuous changes between SN1–SN2 and SN2–SN3 (NSA effect) in reactions with benzylic substrates. Their study demonstrated that the number of water molecules (n = 9, 11, 17, 23, and 29) changes the mechanism from SN1 to SN2 or SN3.4 In a similar vein, Fu and co-workers employed this methodology to establish a mechanistic spectrum for glycosylation reactions based on solvent activity, including tightly (SN2-character) or loosely (SN1-character) associated ion pairs.18 Fiorot and co-workers employed Monte Carlo calculations to determine the configuration and the number of water molecules around the substrates, with the goal of mapping a non-ionic Prins cyclization mechanism without catalysts in aqueous media. This mechanism is only assessable by explicitly simulating the solvent molecules.19 Pereira also employed this stochastic generation of solvent configurations to investigate the mechanism for the alkaline hydrolysis of phosphoranes.20 In both cases, the authors determined the number of water molecules based on the radial pair distribution function.19,20
The bottom-up approach is also widely employed in the exploration of reaction mechanism.21–25 Shi and co-workers identified that the solvolysis of tert-butyl halides (tBuX) can follow both DN + AN or ANDN mechanisms, depending on the solvent's attack orientation with respect to the leaving group.21 In a similar reaction, simulating tBuCl as substrate, Otomo and co-workers found that the solvolysis predominantly follows a dissociative DN + AN mechanism, although the concerted one is also feasible.22 Although the authors conducted a meticulous computational investigation regarding the positioning of solvent molecules around the substrates, the identification of both SN1 and SN2 reaction mechanisms may be influenced by the orientation and number of water molecules, which are placed according to the user's chemical intuition.22 Similarly, recent studies have applied this methodology to guide the solvent molecules' orientation by the user, exploring various chemical transformations, including α- and β-lapachone isomerization,23 CO2 capture by methanol,24 and SN2/E2 mechanism competition,25 to cite some.
Despite the exploration of reaction pathways involving explicit solvent molecules in the mentioned works, none of them have proposed an assessment for systems with merged or borderline mechanisms. Furthermore, these approaches are associated with advantages and disadvantages, essentially correlated with computational cost, nature of the potential energy surface, and inadequate descriptions of solute–solvent interactions.16,26 The top-down approach, while offering a comprehensive description of the condensed phase, is often limited by the computational cost. Usually, these methodologies select several solvent molecules to account for the complete effect of the entire solvation shells.16 To evaluate chemical transformations using quantum methods (e.g., DFT), which allow to properly evaluate the bond-forming/-breaking phenomena, the simulation routine might require large computational resources. On the other hand, the bottom-up approach remarkably influences the rugged nature of the potential energy surface, which can lead to erroneous results or the identification of multiple reaction mechanisms.26 There are some reports of automated methodologies for such an approach; however, they depend on auxiliary packages or user programming mastery.26
Based on these considerations, herein, we explored a reaction significantly influenced by solvent effects: the hydrolysis (solvolysis with water as the solvent) reaction of a secondary substrate. This phenomenon is recognized as a merged or borderline mechanism, displaying characteristics of both SN1 and SN2 reactions.5–8 Nucleophilic substitution reactions, such as hydrolysis, play pivotal roles in numerous biochemical and synthetic transformations.27–29 Our primary goal is to evaluate the nature of borderline mechanisms in the hydrolysis reaction and investigate how the number (n) and the configuration of explicit water molecules influence the overall energy profile and the nature of the transition state structures. We conducted comparative simulations to generate the initial configuration, employing both a top-down approach through Monte Carlo (MC) calculations and a bottom-up protocol known as microsolvation (MS). To the best of our knowledge, this work is the first to delve into comparing these methodologies and evaluating which one yields the more reasonable results. In the microsolvation approach, solvent molecules are strategically introduced to stabilize both the charged nucleophile and nucleofuge. We selected isopropyl chloride as the prototype system because it is the simplest secondary substrate that undergoes hydrolysis reactions by both the SN1 and/or the SN2 mechanisms (eqn (1)). The structural simplicity allowed us to focus specifically on the SN1–SN2 mechanistic continuum and evaluate the influence of the explicit solvation methodology.
| iso-PrCl·n(H2O) ⇌ iso-PrOH·[H3O·(n − 2)H2O]+·Cl− | (1) |
Methods
All the quantum calculations were performed using the density functional theory (DFT), implemented in the Gaussian 09 (ref. 30) software package, with the default convergence criteria. The hybrid meta-exchange–correlation functional M06-2X31 associated with the Dunning double-zeta basis set aug-cc-pVDZ32,33 was used for all geometry optimization and frequency calculations. The M06-2X, a highly-nonlocal functional that incorporates the double amount of nonlocal exchange (2X),31 was selected as the density functional due to its widespread applications in exploring reaction mechanism, especially when accounting for the solvent effects.34–37 The Dunning aug-cc-pVQZ Gaussian-type basis set has previously been identified as suitable for describing nucleophilic substitution at carbon.38 The choice of a double-zeta basis set over a quadruple-zeta one was driven by the computational cost associated with the simulated systems.39 A brief discussion on the Basis Set Superposition Error (BSSE) and its correction40,41 in describing our system is included in the ESI.† Additionally, the M06-2X/aug-cc-pVDZ combination has been previously recommended for calculations involving H-bonded water dimers,42 which plays a crucial role in our analyses of hydrolysis reactions. This computational method is implemented in the Gaussian 09. All structures were pre-optimized using the semiempirical tight-binding (TB) method called Geometry, Frequency, Noncovalent, eXtended TB (GFN-xTB)43 aiming to get a better initial guess structure before proceeding to the mechanistic evaluations. The nature of the stationary points was characterized by computing their second-order Hessian matrix. Minimum energy points were identified as those with only positive eigenvalues, while first-order saddle points (TS) with only one negative eigenvalue. In addition, intrinsic reaction coordinate (IRC)44 calculations were performed to confirm that each transition structure connects the precedent reactants to their respective products. Thermodynamic parameters were computed at 298 K and 1 atm, after frequency calculation in the default configuration using the standard statistical thermodynamic equations.45 The energy profile is reported in terms of the enthalpy (H) change relative to the initial complex (IC) for all the evaluated systems. The reaction enthalpy, ΔH (thermodynamic profile), and the activation enthalpy, ΔH‡ (kinetic profile), are calculated using eqn (2) and (3), where FC refers to the final complex (product), and TS‡ refers to the transition state structure:| ΔH = H(FC) − H(IC) | (2) |
| ΔH‡ = H(TS‡) − H(IC) | (3) |
The results in terms of Gibbs free energy (ΔG) and electronic energy change (ΔE) were likewise calculated and are provided in the ESI file (Table S1†).
We assessed two approaches to model the arrangement of water molecules around the substrate for obtaining the initial complex configuration. This involved utilizing the automatic Metropolis Monte Carlo method calculations (MC) performed at DICE software,46,47 and employing explicit microsolvation (MS). In the latter, water molecules were inserted into suitable sites to establish interactions with the nucleophile and nucleofuge. The MC calculations were performed only to select initial distribution of solvent molecules around the substrate. For a detailed description of the MC protocol, see the ESI.† In the MS approach, we progressively added the water molecules in each MS calculation two by two: one on the nucleophile site and the other on the leaving group site. Thus, the minimum amount of simulated water molecules was n = 3, one as the nucleophile (isopropyl chloride monohydrated) and two as explicit solvent. We also explored n = 5 and n = 7. The different water molecules configurations were categorized using the microsolvation motif (l, m), where l and m denote the number of solvent molecules coordinating around the leaving group and the nucleophile site, respectively.22 In addition, we considered implicit solvation with the self-consistent reaction field (SCRF). The integral equation formalism variant of the polarizable continuum model (IEFPCM) was used to simulate the continuous medium of water (ε = 78.35).48 The combination of explicit solvent molecules and a continuum medium (implicit solvation) is reported as a cluster-continuum model or a mixed discrete-continuum model.17,22 In this work, we will refer to this combination as the explicit + implicit model, while the evaluation without implicit solvation will be called only explicit.
To rationalize the nature of the transition structures (tight or loose), we constructed More O'Ferrall–Jencks plots in terms of the C–Cl (leaving group) and C–Onuc (nucleophile) bond orders. The bond orders were calculated based on the Wiberg bond index49 using natural bond orbital (NBO)50 analysis.
Finally, we employed the activation strain model (ASM)51,52 to understand how the number of water molecules affects the reactivity of the secondary halide in SN reaction. This model decomposes the total electronic energy, ΔE(ζ), in terms of interaction, ΔEint(ζ), and strain, ΔEstrain(ζ), as represented in the following eqn (4):
| ΔE(ζ) = ΔEint(ζ) + ΔEstrain(ζ) | (4) |
Strain (or distortion) is related to the geometrical deformation of the fragments and is typically a destabilizing factor (computed as positive value), whereas the interaction energy is frequently a stabilization factor (computed as negative value, in most cases). The ASM allows for both quantitative and qualitative interpretation of the physical factors that influence the activation barriers. It has been widely used in reaction mechanism studies, particularly in SN2 processes.25,27,53 Here, we conducted energy decomposition along the intrinsic reaction coordinate (IRC) projected onto the C(electrophilic center)⋯Cl(leaving group) (Cα⋯Cl) distance using the PyFrag program54 on the Gaussian 09 interface.
Results and discussion
The energy barrier for the isopropyl chloride hydrolysis was experimentally determined as ΔH‡ = 25.9 kcal mol−1 at 298 K and 1 atm, determined through quasi-thermodynamic analysis.55 This methodology, however, has faced criticism for theoretical inconsistencies.55–57 To the best of our knowledge, there are no recent experimental data for the solvolysis reaction. Thus, the available data may be unreliable, emphasizing the importance of investigating solvolysis reactions and their borderline profiles. Herein we examined two different approaches to define initial configurations of the water molecules around the substrate to further investigate the solvolysis reactions: Monte Carlo (MC) and explicit microsolvation (MS) calculations. The former is user-independent, as Metropolis Monte Carlo method generates configurations of the substrate solvated by the water molecules based on stochastic methods and adjusts the arrangement of the molecules during the simulations. In contrast, the latter is user-dependent as the orientation of the water molecules is defined to establish stabilizing intermolecular interactions. Our results are organized into three sections. First, we discuss the acquisition of the initial configuration through Monte Carlo (MC) and molecular dynamics (MS) explicit solvation approaches. Next, we present the energy profiles (varying the number n of water molecules) for the nucleophilic substitution reaction, addressing the impact of different solvation approaches on the reaction pathways. Finally, we analyze the reactivity of the secondary alkyl halide in the various configurations using the More O'Ferrall–Jencks plot and the activation strain model.Explicit solvation: exploring initial configurations of substrate–solvent clusters
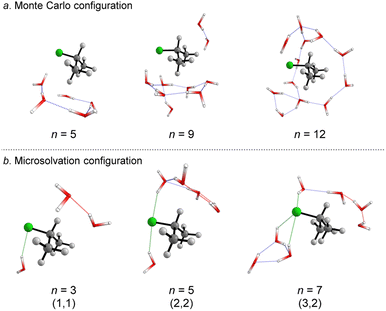
We started simulating initial complexes (substrate + water cluster) by MC calculations. Further details regarding the Monte Carlo simulation are present in the ESI.† To account for the solvation effects in the cybotactic region (i.e., the interacting water molecules in the first solvation shell), three radial distribution functions (RDFs) were explored to generate the initial structures. The 1st RDF defines the solvation shell from the center of mass of the iPrCl; the 2nd RDF considers any atoms in the substrate; and the 3rd RDF accounts for the distance of the solvent molecules from the electrophilic carbon atom (Fig. S1, in ESI†). The complete first solvation shell for those RDFs comprises more than 20 solvent molecules. It means that the simulation at the M06-2X/aug-cc-pVDZ level would have a considerably high computational cost (approx. 1100 basis functions). Thus, we decided to take the maximum point of the G(r) and integrate it to obtain the number of water molecules instead of simulating the complete first solvation shell for all the RDFs. It resulted in three substrate–solvent complexes with n = 5 (2nd RDF), 9 (3rd RDF), and 12 (1st RDF) water molecules. Fig. 1a shows the optimized structures (M06-2X/aug-cc-pVDZ) of these MC initial complexes (IC).Stable three- and five-membered water rings are present in all simulated structures, consistent with previous reports exploring the simulation of a cluster of water molecules.58 In neutral solutions, water molecules tend to form cyclic trimers and pentamers as dominant clusters. Interestingly, for the configuration with n = 5, the formation of a pentameric stable water cluster prevents the orientation of water molecules on the opposite side of the leaving group, which is a suitable position for the nucleophilic substitution.53 For n > 5, there are enough molecules to form stable clusters with an orientation prompt to the nucleophilic attack.
For the user-dependent explicit microsolvation (MS) procedure, the solvent molecules were oriented around the substrate to establish stabilizing interactions, such as hydrogen bonds, with the nucleophilic oxygen atom (H2O⋯H–OH) and dipole–dipole interactions with the leaving group from the substrate (H–O–H⋯Clδ−). Progressively, we added two by two water molecules around the substrate: one close to the nucleophile and the other close to the leaving group. Using the microsolvation motif (l, m), where l denotes the number of solvent molecules directly interacting with the leaving group and m denotes the number of molecules interacting with the nucleophilic water, we expected to identify configurations like (1,1) for n = 3, (2,2) for n = 5 and (3,3) for n = 7. For n = 3, (1,1) is the only possible configuration that allows the solvation of both nucleophilic water molecule and chloride leaving group. However, for n = 5 and n = 7, multiple configurations may be obtained as minimum energy points on the PES. A comprehensive discussion regarding these additional configurations is in the ESI file.† The most stable configurations for the IC from the microsolvation approach obtained after full geometry optimization at the M06-2X/aug-cc-pVDZ are shown in Fig. 1b. As the MC and empirical MS approaches result in different amounts of water molecules, a direct correlation between the energy of the individual clusters cannot be established. Thus, our comparison will be limited to the hydrolysis reaction, focusing on variations in the energy barriers.
Energy profiles for the nucleophilic substitution reactions
We explored the potential energy surfaces for the hydrolysis reaction and identified that in all cases the initial complex (IC) is connected to the final complex (FC) by a first-order saddle point, confirmed by IRC calculations. This suggests that all the processes undergo a SN2 mechanism, as the O⋯C(substrate) bond formation occurs concertedly (but not synchronously, as we will explore in the next section) to the C⋯Cl bond breaking. All enthalpy changes (ΔH and ΔH‡) in the energy diagram were calculated relative to their respective initial complex obtained by MC or MS approach. In addition, we also explored the solvolysis in the absence of explicit solvent (n = 1), i.e. the monohydrated substrate.Monte Carlo configurations
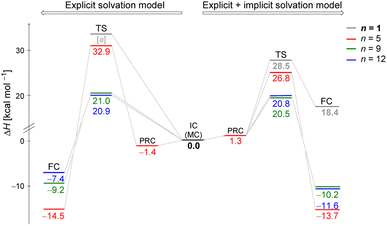
Fig. 2 illustrates enthalpy changes (in kcal mol−1) for the hydrolysis reaction, considering the initial configurations of substrate–solvent clusters generated by Monte Carlo (MC) calculations with n = 5, 9, 12. The left side displays results obtained using exclusively the explicit solvation model, that is, without the implicit simulation of the solvent as a continuum medium. On the right side, both explicit and implicit solvation models were employed. The energy of the transition state, identified as TS and the energy of the products, represented by a final complex (FC) were calculated relative to the initial complex (IC, center of the image), representing the activation enthalpy (ΔH‡) and the reaction energy (ΔH) for each n, respectively.The data indicate that for n = 9 and 12, the activation energy (ΔH‡) and reaction enthalpy (ΔH) have nearly identical values for both the explicit and explicit + implicit solvation models. Therefore, according to our findings, when simulating a substantial number of water molecules, there are no noteworthy deviations in the energy profile, resulting in convergent barriers of approximately 21 kcal mol−1. Among all the assessed configurations, n = 5 exhibited the highest activation barrier. In this case, the IC configuration (Fig. 1) does not have a water molecule suitably positioned to act as a nucleophile. Thus, we computed an extra stationary point (pre-reactive complex, PRC), with a water molecule in the backside of the leaving group (see Fig. S3, in ESI†). This structure was further confirmed by IRC calculation of the respective TS. Although this rearrangement of solvent molecules breaks the stable cyclic water pentamer,58 the number of hydrogen bonds is preserved. Consequently, the change in the relative enthalpy values is almost negligible (ΔH = −1.4 kcal mol−1 for the explicit solvation and +1.3 kcal mol−1 for the explicit + implicit solvation model compared to the ICn=5).
The structural analysis of the TS for each system allows us to infer that there is a progressive decrease in the computed barrier height value as the leaving group establishes more interactions with the water molecules (Fig. 3). The TS for n = 5 has only one ion–dipole interaction, Clδ−⋯H–OH, being the most energetic for both explicit and explicit + implicit solvation models. For n = 9 and 12, three and four water molecules stabilize the leaving group, respectively. These interactions allow for charge density dispersion for the chloride anion, reducing the activation energy. The highest barrier is relative to n = 1, since no water molecules are able to interact with the anionic leaving group. It was not possible to locate the TS without simulating the continuum model, probably due to the necessity of the charge on the chloride anion to be stabilized by explicit solvent or a continuum medium (Fig. 2, TS [a]).
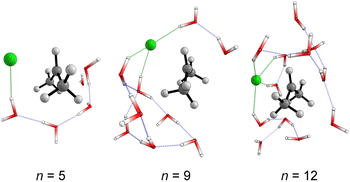 | ||
| Fig. 3 Optimized (M06-2X/aug-cc-pVDZ) transition states structures obtained from Monte Carlo simulations. Solvent-leaving group interactions are highlighted in green. | ||
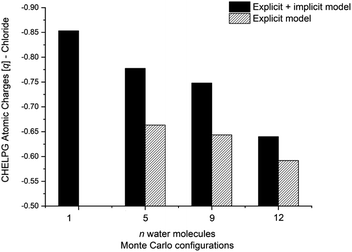
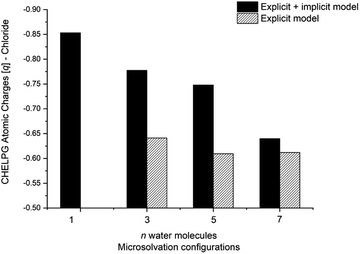
The calculated atomic charges of the leaving group on the TS structures corroborate our hypothesis regarding chloride charge stabilization (Fig. 4). The increase in the number of water molecules is followed by the reduction of the charge density of the nucleofuge (Clδ−) in the TSs. In the overall comparison between the explicit and explicit + implicit models, an important decrease in atomic charges is observed in the explicit model, potentially attributed to the strong stabilization provided by explicit solvent molecules. This indicates that in the absence of a continuum medium, the intrinsic interactions between solvent molecules and the substrate become more influential. In the case of the monohydrated substrate (n = 1), the explicit + implicit model exhibited the highest charge localization on the chloride atom (no transition state was found in the explicit model). This highlights the importance of explicit water molecules in stabilizing the nucleofuge and facilitating long-range solvation.
Microsolvation configurations
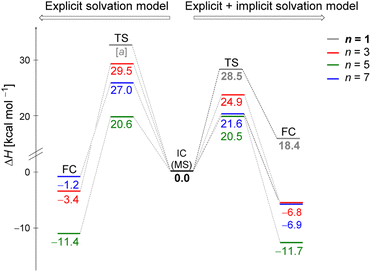
Fig. 5 displays the computed enthalpy change for the systems obtained using the microsolvation approach. Like the MC configurations, a convergence is observed towards the 21 kcal mol−1 range for n = 5 (both explicit and explicit + implicit models) and n = 7 (explicit + implicit model). Notably, the simulation with the minimum number of water molecules, n = 3 (indicated in red), exhibits the highest deviation from these values, with an activation enthalpy of ΔH‡ = 29.5 kcal mol−1 for the only explicit solvation model and 24.9 kcal mol−1 for the explicit + implicit model.For n = 5, the energy barriers exhibit identical values when employing both the explicit and explicit + implicit models. This suggests that solvent orientation alone is sufficient to describe both the direct interaction and the stabilization attributed to the continuum medium. Along the reaction coordinate, the orientation of water molecules can facilitate leaving group stabilization (by two solvent molecules) as well as provide the appropriate direction to promote the solvolysis reaction.
One could expect with an increase in the number of water molecules, there would be a gradual stabilization of the charged transition state through interactions between water and the leaving group. However, it is interesting to note that for n = 7 (Fig. 5 in blue, left) in the explicit solvation model, a high energy barrier is observed. Surprisingly, the CHELPG calculations depicted in Fig. 7 reveal no change in the chloride atomic charge from n = 5 to 7 in the explicit model.
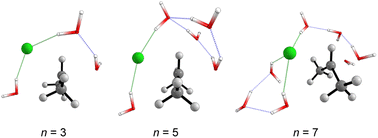 | ||
| Fig. 6 Optimized transition states structures (M06-2X/aug-cc-pVDZ) obtained from the explicit microsolvation approach. Solvent-leaving group interactions are highlighted in green. | ||
This suggests that the barrier height is likely not significantly influenced by chloride charge stabilization, in contrast to the observations from the MC approach. To further investigate the differing effects of each solvation approach modeled, we explore these reaction profiles using the activation strain model in the subsequent section.
Reactivity analysis
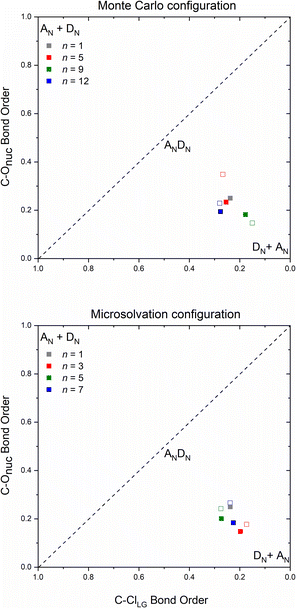
The number and the arrangement of the simulated water molecules play an important role in the position of the solvolysis reaction on the SN1–SN2 mechanistic continuum. Some solvent orientations for a front or backside pathway can lead to SN1 (DN + AN) or SN2 (ANDN) mechanism due to the charge stabilization of the intermediate.22 It is known, however, that the backside-SN2 is preferred over frontside-SN2 for reactions at electrophilic carbon.27,38 From our simulations, all the TSs point to a backside ANDN (SN2-like) process. To find the TS starting guesses, we performed a relaxed scan calculation elongating the Cα⋯Cl bond. Following this strategy, no water molecule approached the electrophilic carbon to promote a frontside nucleophilic attack. From the IRC calculations (either for MC or MS), shown in Fig. S5 and S6 in ESI,† the nucleophilic solvent assistance (NSA) is clear. Thus, according to our simulations, the hydrolysis reactions follow an ANDN-NSA mechanism, with more than one solvent molecule interacting with the nucleophilic water molecule in the TS structure. From the TS structures (Fig. 3 and 6), we can identify a strict SN3 profile for n = 3 (MS), and for n = 5 and 9 (MC), as defined by Bentley.9 For n = 12 (Fig. 3), the nucleophile is assisted by three water molecules, and for n = 5 and 7 (Fig. 6), by two solvent molecules. Using the SNX nomenclature, these reactions would be termed SN5 and SN4, respectively, which could promote kinetic misleading interpretations, since the solvent concentration is constant along the chemical process. Besides that, this reaction profile presents characteristics of SN1, SN2, and SNX (X = 3, 4, 5) mechanisms. So, for this system, we could not fit the reaction in terms of the SN1–SN2 and SN2–SN3 spectrum. The ANDN-NSA term fits better in this case.The More O'Ferrall–Jencks59,60 diagrams were plotted (Fig. 8) for each system to position the mechanism closer to the SN2 (ANDN) mechanistic limit, that is, with a tight TS, in which the nucleophile and nucleofuge intimately associated with the electrophilic carbon atom, Cα; or closer to the SN1 (DN + AN) mechanistic limit, that is, with a loose TS, with nucleophile and nucleofuge more distant to Cα.
All transition states show a remarkable dissociative character, meaning that the Cα⋯Cl bond dissociation occurs earlier than the C⋯ONu bond association, even though the IRC confirm their nature as a concerted mechanism. Transition states of this type are known as loose, in which the electrophilic center has a high electron deficiency and resembles a carbocation. Processes with this type of saddle points are characterized by flat potential energy surfaces,22 which can be visualized on the IRC diagrams (Fig. S7–S9†). The highly dissociative nature observed in the loose transition state suggests that the reaction mechanism exhibits intermediate characteristics of the archetypal borderline models SN1 and SN2. Consequently, these reactions can be classified as mixed or intermediate, falling between the two extremes.
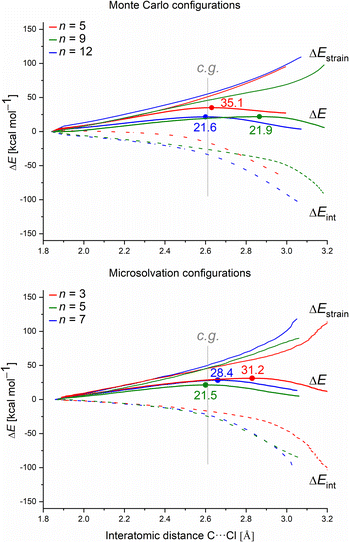
Finally, we employed the ASM to gain quantitative insight into how the different solvation models affect the barrier height (ΔE‡) in terms of the distortion of the substrate (fragment 1) and the water clusters (fragment 2), ΔEstrain(ζ), and the magnitude of their interaction ΔEint(ζ). To understand the intrinsic effect of explicit solvation, we evaluated only the explicit solvation model. Fig. 9 presents the activation strain diagrams (ASDs) for the MC and MS configurations.
For each system, we analyzed the strain and interaction contribution along all the reaction coordinates. A single-point analysis at the TS can provide misleading conclusions,61 once the TSs occurs at different reaction coordinates (i.e., different C⋯Cl interatomic distances) for each system. We chose the C⋯Cl interatomic distance at dC⋯Cl = 2.61 Å as the consistent geometry (c.g. in Fig. 9) to compare with the other systems. Regardless of the assessed solvation approach, one can see that as the number of water molecules increase, the interaction (ΔEint) becomes more stabilizing. Overall, as the number of water molecules increases for both solvation approaches, the computed energy barrier values decrease. This suggests that the solvent–substrate interaction determines the barrier height, influenced by both the leaving group interaction and solvation energy of the substrate.
Regarding the MS configurations (Fig. 9b), the interaction curves for n = 5 and 7 almost overlap. This agrees with the CHELPG calculations (Fig. 7), as the chloride charge on TS using explicit solvation is the same for n = 5 and 7. Thus, the differences in the energy barriers are associated with the strain energy change. For this case, it comes from the more destabilizing distortion of the water cluster for n = 7 compared to n = 3 and 5 (see Fig. S4, ESI†). The imposed geometry for seven water molecules is associated with a notable distortion along the reaction pathway, which is not observed for n = 5, as there is a small water reorganization along the reaction path. Noteworthy, the highest energy barrier for n = 3 is caused by a less stabilizing interaction between the fragments along the entire reaction coordinate. It suggests that the three water molecules are insufficient to promote effective interaction between solvent and substrate.
Comparing the MC and MS solvation approaches, the former allows the formation of ICs by which the solvolysis reaction occurs without significant changes in the water clusters (pointing by a higher influence of interaction, e.g. leaving group charge stabilization rather than strain). On the other hand, for the empirical MS configurations, there is a higher strain influence and no direct correlation with the leaving group charge stabilization. Since we impose the orientation of the solvent molecules around the substrate, the MS approach is highly user-biased. Despite the energy barriers and the nature of the TSs presenting the same profile for the two approaches (about 21 kcal mol−1 and loose TSs), we consider that the user-biased character of MS can provide misleading interpretations and needs to be done cautiously.
Conclusions
We quantum-chemically explored the hydrolysis of the secondary substrate, isopropyl chloride. This reaction is described as a nucleophilic substitution that deviates from the limiting pathways SN1 (DN + AN) or SN2 (ANDN), lying within the borderline mechanism. To account for the solvent effects, we employed two explicit solvation approaches to generate initial configurations for the substrate–solvent clusters: Monte Carlo (MC) calculations and empirical microsolvation (MS). These protocols yielded different number (n) and configuration of water molecules around the substrate.Notably, in contrast to the MC approach, the results from the MS approach demonstrated a high level of user bias, as solvent molecules are added based on the user's chemical intuition to establish stabilizing interaction with both the leaving group and the nucleophile. Our findings consistently reveal that, despite the solvation approach, the reaction follows SN2-like (ANDN) mechanisms in all cases, with the computed energy barrier values converging to 21 kcal mol−1, as the solvent cluster increases. Notwithstanding a concerted SN2-like mechanism with a significant nucleophilic solvent assistance, the More O'Ferrall–Jencks plot revealed loose transition state structures, with carbocation character, corroborating the borderline nature of these mechanisms.
Finally, the results from the fragmentation activation strain analyses strongly suggest that the interaction between substrate and solvent molecules plays an important role in controlling the energy barriers. As the number of water molecules increases, a more stabilizing interaction with the substrate along the reaction coordinate is observed, supported by the leaving group stabilization assessed through CHELPG atomic charge calculations. The strain (distortion) curve becomes more significant for configurations obtained from empirical MS, suggesting that the imposition of the water molecules in the IC causes a more pronounced reorganization of the fragments along the reaction, once again evidencing the high bias in this user-dependent method.
We intend to apply this computational protocol to assess the solvent influence on the reactivity of other secondary substrates, such as the congener isopropyl halides. The explicit solvation obtained from the Monte Carlo calculations and the n amount of water extracted from the highest G(r) value of the RDF calculated from the distance between the reactive sites provided us with suitable descriptions of the initial configurations. Besides that, the activation strain analysis and More O'Ferrall–Jencks plot proved to be useful to understand physical features commanding the reactive patterns. Thus, we show a consistent computational methodology to evaluate reaction mechanisms in solvent media that can be applied to comprehend solvent effects on fundamental reactions in organic chemistry.
Author contributions
KNA contributed to conceptualization, methodology, performed investigation, formal analysis, and participated in writing and reviewing the original draft. BPP contributed to investigation and formal analysis. JWMC was responsible for funding acquisition and conceptualization. RGF contributed to conceptualization, project administration, supervision, methodology, and participated in writing and reviewing the original draft.Conflicts of interest
There are no conflicts to declare.Acknowledgements
The theoretical calculations were performed using the Lobo Carneiro supercomputer from Núcleo Avançado de Computação de Alto Desempenho (NACAD), under Project ID a20006 and the datacenter OSCAR of Federal Fluminense University. The authors are grateful to CAPES (Coordenação de Aperfeiçoamento de Pessoal de Nível Superior), CNPq (Conselho Nacional de Desenvolvimento Científico e Tecnológico, 309080/2015-0 and 434955/2018-3), and FAPERJ (Fundação Carlos Chagas Filho de Amparo à Pesquisa do Estado do Rio de Janeiro, E-26/203.001/2017, E-26/010.101118/2018, E-26/010.001424/2019, E-26/211.517/2021, and E-26/200.227/2023) for funding this research project.References
- F. A. Carey and R. J. Sundberg, Advanced Organic Chemistry – Part A: Structure and Mechanisms, Springer, New York, 5th edn, 2007 Search PubMed.
- E. Uggerud, Adv. Phys. Org. Chem., 2017, 51, 1–57 CrossRef CAS.
- T. B. Phan, C. Nolte, S. Kobayashi, A. R. Ofial and H. Mayr, J. Am. Chem. Soc., 2009, 131, 11392–11401 CrossRef CAS PubMed.
- S. Yamabe, G. Zeng, W. Guan and S. Sakaki, J. Comput. Chem., 2014, 35, 1140–1148 CrossRef CAS PubMed.
- R. M. Pagni, Found. Chem., 2011, 13, 131–143 CrossRef CAS.
- T. W. Bentley, C. T. Bowen, D. H. Morten and P. v. R. Schleyer, J. Am. Chem. Soc., 1981, 103, 5466–5475 CrossRef CAS.
- F. L. Schadt, T. W. Bentley and P. v. R. Schleyer, J. Am. Chem. Soc., 1976, 98, 7667–7675 CrossRef CAS.
- T. W. Bentley and P. v. R. Schleyer, J. Am. Chem. Soc., 1976, 98, 7658–7666 CrossRef CAS.
- T. W. Bentley, R. O. Jones, D. H. Kang and I. S. Koo, J. Phys. Org. Chem., 2009, 22, 799–806 CrossRef CAS.
- T. W. Bentley, H. Choi, I. S. Koo and D. N. Kevill, J. Phys. Org. Chem., 2017, 30, e3585 CrossRef.
- L. Xu and M. L. Coote, in Annual Reports in Computational Chemistry, ed. D. A. Dixon, Elsevier, Amsterdam, 2022, vol. 18, ch. 2, pp. 53–121 Search PubMed.
- Y. P. Chin, N. W. See, I. D. Jenkins and E. H. Krenske, Org. Biomol. Chem., 2022, 20, 2028–2042 RSC.
- K. N. de Andrade, J. R. D. Fajardo, C. A. Leal, J. W. M. Carneiro and R. G. Fiorot, J. Braz. Chem. Soc., 2023, 34(6), 755–895 CAS.
- J. Zhang, H. Zhang, T. Wu, Q. Wang and D. van der Spoel, J. Chem. Theory Comput., 2017, 13, 1034–1043 CrossRef CAS PubMed.
- J. R. Pliego and J. M. Riveros, Wiley Interdiscip. Rev.: Comput. Mol. Sci., 2020, 10, e1140 Search PubMed.
- M. Steiner, T. Holzknecht, M. Schauperl and M. Podewitz, Molecules, 2021, 26, 1793 CrossRef CAS PubMed.
- J. R. Pliego and J. M. Riveros, J. Phys. Chem. A, 2001, 105, 7241–7247 CrossRef CAS.
- Y. Fu, L. Bernasconi and P. Liu, J. Am. Chem. Soc., 2021, 143(3), 1577–1589 CrossRef CAS PubMed.
- R. G. Fiorot, G. Rambabu, V. Vijayakumar, Y. B. Kiran and J. W. M. Carneiro, J. Braz. Chem. Soc., 2019, 30(8), 1717–1727 CAS.
- E. S. Pereira, J. C. S. Da Silva, T. A. S. Brandão and W. R. Rocha, Phys. Chem. Chem. Phys., 2016, 18, 18255–18267 RSC.
- H. A. Shi, React. Kinet., Mech. Catal., 2020, 129, 583–612 CrossRef CAS.
- T. Otomo, H. Suzuki, R. Iida and T. Takayanagi, Comput. Theor. Chem., 2021, 1201, 113278 CrossRef CAS.
- M. Delarmelina, C. D. Nicoletti, M. C. Moraes, D. O. Futuro, M. Buhl, F. C. da Silva, V. F. Ferreira and J. W. M. Carneiro, ChemPlusChem, 2018, 84, 52–61 CrossRef PubMed.
- K. N. de Andrade, L. M. da Costa and J. W. M. Carneiro, J. Phys. Chem. A, 2021, 125, 2413–2424 CrossRef CAS PubMed.
- T. Hansen, J. C. Roozee, F. M. Bickelhaupt and T. A. Hamlin, J. Org. Chem., 2022, 87, 1805–1813 CrossRef CAS PubMed.
- G. N. Simm, P. L. Türtscher and M. Reiher, J. Comput. Chem., 2020, 41, 1144–1155 CrossRef CAS PubMed.
- T. A. Hamlin, M. Swart and F. M. Bickelhaupt, ChemPhysChem, 2018, 19, 1248 CrossRef CAS.
- R. Wang, X. Shi, K. Li, A. Bunker and C. Li, Int. J. Biol. Macromol., 2023, 242, 125120 CrossRef CAS PubMed.
- D. Bareth, S. Jain, J. Kumawat, D. Kishore, J. Dwivedi and S. Z. Hashmi, Bioorg. Chem., 2024, 143, 106971 CrossRef CAS PubMed.
- G. M. J. Frisch, W. Trucks, H. B. Schlegel, G. E. Scuseria, M. A. Robb, J. R. Cheeseman, G. Scalmani, V. Barone, B. Mennucci, G. A. Petersson, H. Nakatsuji, M. Caricato, X. Li, H. P. Hratchian, A. F. Izmaylov, J. Bloino, G. Zheng, J. L. Sonnenberg, M. J. Frisch, G. W. Trucks, H. B. Schlegel, G. E. Scuseria, M. A. Robb, G. Cheeseman, J. R. Scalmani, V. Barone, B. Mennucci, H. Petersson, G. A. Nakatsuji, M. Caricato, X. Li, H. P. Hratchian, A. F. Izmaylov, J. Bloino, G. Zheng, J. L. Sonnenberg, K. Hada, M. Ehara, M. Toyota, R. Fukuda, J. Hasegawa, M. Ishida, T. Nakajima, Y. Honda, O. Kitao, H. Nakai, T. Vreven, J. E. Montgomery, J. A. Peralta Jr, F. Ogliaro, M. Bearpark, J. J. Heyd, E. Brothers, K. N. Kudin, R. Staroverov, V. N. Kobayashi, K. Normand, J. Raghavachari, A. Rendell, J. C. Burant, S. S. Iyengar, J. Tomasi, M. Cossi, N. Rega, J. M. Millam, M. Klene, J. E. Knox, J. B. Cross, V. Bakken, C. Adamo, J. Jaramillo, R. Gomperts, R. E. Stratmann, O. Yazyev, A. J. Austin, R. Cammi, C. Pomelli, J. W. Ochterski, R. L. Martin, K. Morokuma, V. G. Zakrzewski, G. A. Voth, P. Salvador, S. Dannenberg, J. J. Dapprich, A. D. Daniels, Ö. Farkas, J. B. Foresman, J. V. Ortiz, J. Cioslowski and D. J. Fox, Gaussian 09, Revision E.01, Gaussian, 2009 Search PubMed.
- Y. Zhao and D. G. Truhlar, Theor. Chem. Acc., 2008, 120, 215–241 Search PubMed.
- T. H. Dunning, K. A. Peterson and A. K. Wilson, J. Chem. Phys., 2001, 114, 9244–9253 CrossRef CAS.
- R. A. Kendall, T. H. Dunning and R. J. Harrison, J. Chem. Phys., 1992, 96, 6796–6806 CrossRef CAS.
- G. Koleva, B. Galabov, J. Kong, H. F. Schaefer and P. v. R. Schleyer, J. Am. Chem. Soc., 2011, 133, 19094–19101 CrossRef CAS PubMed.
- F. C. Hill, L. K. Sviatenko, L. Gorb, S. I. Okovytyy, G. S. Blaustein and J. Leszczynski, Chemosphere, 2012, 88, 635–643 CrossRef CAS PubMed.
- M. M. Lawal, T. Govender, G. E. M. Maguire, H. G. Kruger and B. Honarparvar, Int. J. Quantum Chem., 2018, 118, e25497 CrossRef.
- R. Sure, M. E. Mahdali, A. Plajer and P. Deglmann, J. Comput.-Aided Mol. Des., 2021, 35, 473–492 CrossRef CAS PubMed.
- A. P. Bento, M. Solà and F. M. Bickelhaupt, J. Comput. Chem., 2005, 26, 1497–1504 CrossRef CAS PubMed.
- M. W. Li and P. M. Zimmerman, J. Comput. Chem., 2018, 39, 2153–2162 CrossRef CAS PubMed.
- S. Simon, M. Duran and J. J. Dannenberg, J. Chem. Phys., 1996, 105, 11024–11031 CrossRef CAS.
- S. F. Boys and F. Bernardi, Mol. Phys., 1970, 19, 553–566 CrossRef CAS.
- J. A. Plumley and J. J. Dannenberg, J. Comput. Chem., 2011, 32, 1519–1527 CrossRef CAS PubMed.
- C. Bannwarth, S. Ehlert and S. Grimme, J. Chem. Theory Comput., 2019, 15, 1652–1671 CrossRef CAS PubMed.
- K. Fukui, Acc. Chem. Res., 1981, 14, 363–368 CrossRef CAS.
- D. A. McQuarrie and J. Simon, Physical Chemistry: A Molecular Approach, University Science Books, 1997 Search PubMed.
- H. M. Cezar, S. Canuto and K. Coutinho, Int. J. Quantum Chem., 2019, 119, e25688, DOI:10.1002/qua.25688.
- H. M. Cezar, S. Canuto and K. Coutinho, J. Chem. Inf. Model., 2020, 60, 3472–3488 CrossRef CAS PubMed.
- J. Tomasi, B. Mennucci and E. Cancès, J. Mol. Struct.: THEOCHEM, 1999, 464, 211–226 CrossRef CAS.
- K. B. Wiberg, J. Am. Chem. Soc., 1968, 90, 59–63 CrossRef CAS.
- J. P. Foster and F. Weinhold, J. Am. Chem. Soc., 1980, 102, 7211–7218 CrossRef CAS.
- F. M. Bickelhaupt and K. N. Houk, Angew. Chem., Int. Ed., 2017, 56, 10070–10086 CrossRef CAS PubMed.
- P. Vermeeren, S. C. C. van der Lubbe, C. Fonseca Guerra, F. M. Bickelhaupt and T. A. Hamlin, Nat. Protoc., 2020, 15, 649–667 CrossRef CAS PubMed.
- A. P. Bento and F. M. Bickelhaupt, Chem.–Asian J., 2008, 3(10), 1783–1792 CrossRef CAS PubMed.
- X. Sun, T. M. Soini, J. Poater, T. A. Hamlin and F. M. Bickelhaupt, J. Comput. Chem., 2019, 40, 2227–2233 CrossRef CAS PubMed.
- M. H. Abraham and D. J. McLennan, J. Chem. Soc., Perkin Trans. 2, 1977, 873, 10.1039/p29770000873.
- R. E. Robertson, A. Annesa and J. M. W. Scott, Can. J. Chem., 1975, 53, 3106–3115 CrossRef CAS.
- R. L. Heppolette and R. E. Robertson, Can. J. Chem., 1966, 44, 677–684 CrossRef CAS.
- E. Perlt, M. von Domaros, B. Kirchner, R. Ludwig and F. Weinhold, Sci. Rep., 2017, 7, 10244 CrossRef PubMed.
- W. P. Jencks, Chem. Rev., 1985, 85, 511–527 CrossRef CAS.
- R. A. M. O'Ferrall, J. Chem. Soc. B, 1970, 274–277, 10.1039/J29700000274.
- I. Fernández and F. M. Bickelhaupt, Chem. Soc. Rev., 2014, 43, 4953–4967 RSC.
Footnote |
| † Electronic supplementary information (ESI) available. See DOI: https://doi.org/10.1039/d4ra00066h |
| This journal is © The Royal Society of Chemistry 2024 |

