Ultrathin 2D–2D NiFe LDH/MOF heterojunction nanosheets: an efficient oxygen evolution reaction catalyst for water oxidation†
Haoran
Yin‡
a,
Shibiao
Su‡
a,
Di
Yao‡
a,
Lixia
Wang
a,
Xinqiang
Liu
a,
Tayirjan Taylor
Isimjan
c,
Xiulin
Yang
 *a and
Dandan
Cai
 *ab
*ab
aGuangxi Key Laboratory of Low Carbon Energy Materials, School of Chemistry and Pharmaceutical Sciences, Guangxi Normal University, Guilin 541004, P.R. China. E-mail: caidandan86@163.com; xlyang@gxnu.edu.cn
bSchool of Chemical Engineering and Technology, Sun Yat-sen University, Zhuhai 519082, P.R. China
cSaudi Arabia Basic Industries Corporation (SABIC) at King Abdullah University of Science and Technology (KAUST), Thuwal 23955-6900, Saudi Arabia
First published on 18th March 2024
Abstract
Designing ultrathin MOF-based heterostructural nanosheets with high conductivity and rich active sites and studying their dynamic structural evolution during the OER remain an ideal but challenging task. Here, the hierarchical NiFe LDH/MOF structure constructed using an in situ self-dissociation–assembly strategy exhibits a typical sheet-on-sheet hierarchical morphology with a thickness of approximately 1.5–4 nm. Electrochemical tests indicate that the NiFe LDH/MOF catalyst reveals an impressively low overpotential of 196 mV at 10 mA cm−2 with a Tafel slope of 32.5 mV dec−1 in the OER process, surpassing most recently reported catalysts. The overall water splitting device, incorporating the NiFe LDH/MOF, achieves competitive current densities at low cell voltages and exceptional stability, emphasizing its potential as a promising catalyst for efficient and durable water oxidation in sustainable energy conversion. Studies reveal that the unique 2D ultra-thin self-supporting array structure provides abundant active sites and high conductivity, as well as strong electronic interactions between different components and heterogeneous interfaces that jointly optimize the activation energy of active sites and oxygen-containing intermediates, thereby improving OER performance. This study also provides insights into the dynamic active sites, revealing Ni(Fe)OOH as the true active species during the OER process, thereby contributing to the rational design of heterogeneous catalysts.
Introduction
Hydrogen energy plays a pivotal role in achieving carbon neutrality due to its cleanliness and renewable and low-carbon energy.1,2 Electrochemical water splitting stands out as a promising strategy for generating green hydrogen without carbon emissions.3 Unfortunately, the oxygen evolution reaction (OER), a critical step in water splitting, involves a complex four-step proton-coupled electron transfer process with sluggish kinetics, significantly impeding the overall energy conversion process.4,5 Currently, widely used OER catalysts are precious metal-based catalysts, such as RuO2 and IrO2.6 However, their drawbacks, including high cost, limited reserves, and insufficient stability, hinder their large-scale application.7–9Over the past few decades, various low-cost, high-performance transition metal-based OER catalysts, such as oxides, hydroxides, oxyhydroxides, chalcogenides, nitrides, and phosphides, have been extensively synthesized and explored.10–12 Among these electrocatalysts, NiFe-layered double hydroxides (NiFe LDHs) have attracted extensive attention due to their unique layered structure and impactful cooperative effect between Ni and Fe.13 Nevertheless, bulk NiFe LDHs face challenges such as limited active sites and poor conductivity, significantly restricting their catalytic performance.14,15 To address these issues, extensive efforts have been made to optimize the intrinsic structure and chemical components of NiFe LDHs, including the fabrication of ultrathin nanosheets, defect engineering, elemental doping, and compound modification.16,17 Additionally, self-supporting electrodes, achieved by growing materials on conductive substrates, have been explored to prevent stacking and enhance the conductivity, stability, and reactivity of catalysts.18 However, for single-component NiFe LDHs, the inevitable self-agglomeration of the 2D-layered structures hampers the maximization of their catalytic activities in the alkaline OER.19
Conversely, coupling LDHs with other active materials (hydroxide, MXene, MOFs) to form heterostructures can compensate for the deficiencies of single-component LDHs. Notably, LDH/MOF heterojunctions exhibit remarkable OER performance, inheriting both the active sites of LDHs and the flexibility and porosity of MOFs.20 Recent studies indicate that the electron rearrangement at the heterojunction interface of the LDH/MOF can modulate the electronic structure and promote the synergistic effect of the LDH and MOF, enhancing their catalytic ability.21,22 For instance, Dong et al. fabricated a conductive MOF/LDH heteronanotube, providing excellent OER activity with overpotentials of 216/227 mV at 50/100 cm−2.23 Chen et al. proposed an in situ semi-sacrificial strategy, growing MOFs on NiFe LDH to synthesize NiFe LDH/MOF heterojunction arrays, exhibiting impressive catalytic performance in 1.0 M KOH with a low overpotential of 272 mV at 100 mA cm−2 for the OER.24 However, designing ultrathin 2D–2D NiFe LDH/MOF nanosheet arrays through a facile method and investigating their dynamic structural evolution during the OER process remain of paramount importance.
In this study, we have systematically synthesized hierarchical NiFe LDH/MOF nanosheet arrays via a straightforward self-dissociation–assembly strategy. The resulting NiFe LDH/MOF heterostructure features an ultrathin cross-linked sheet-on-sheet morphology, providing more accessible active sites and a larger contact area with the electrolyte. Studies reveal that the surface of the NiFe LDH/MOF rapidly reconstructs into Ni(Fe)OOH, acting as the actual active sites during the OER process, demonstrating an overpotential of 196 mV to deliver 10 mA cm−2 with admirable durability for 100 h. Meanwhile, the NiFe LDH/MOF/CP(+)∥Pt/C/CP(−) achieves an ultra-low cell voltage of 1.47 and 1.65 V at 10 and 100 mA cm−2, respectively, and exhibits good durability of 60 h at 100 mA cm−2 in 1.0 M KOH.
Results and discussion
The self-dissociation–assembly mechanism of electrocatalysts is depicted in Fig. 1a. Initially, the NiFe LDH precursor is cultivated on the pre-treated hydrophilic CP using a standard hydrothermal method. Subsequently, the previously obtained NiFe LDH, serving as the self-supporting template and metal source, is immersed in a mixed NDA–DMF–water solution for a solvothermal reaction. Notably, by adjusting the reaction time, the resulting products can be efficiently controlled. A NiFe LDH/MOF heterojunction is achieved after 24 hours of reaction, while a fully transformed NiFe MOF is obtained after 48 hours.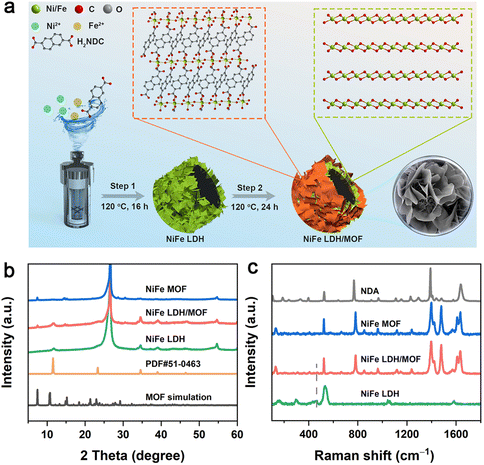 | ||
| Fig. 1 (a) Schematic illustration of the synthesis of the NiFe LDH/MOF. (b) XRD patterns and (c) Raman spectra of the NiFe LDH, NiFe LDH/MOF, and NiFe MOF, respectively. | ||
The crystal structures and phase compositions of the NiFe LDH, NiFe LDH/MOF and NiFe MOF are examined by X-ray diffraction (XRD). In Fig. 1b, it is observed that all samples exhibit two prominent peaks at 26.6° and 54.8°, corresponding to the (005) and (0010) planes of CP (PDF# 26-1077).23 For the NiFe LDH precursor, the peaks located at 11.5°, 23.3° and 34.6° align with the main diffraction peaks of NiFe LDH (PDF# 51-0463).23,25 In the NiFe LDH/MOF, in addition to the characteristic peaks of NiFe LDH, new peaks at 7.4°, 14.8°, 29.0° and 30.5° can be indexed to the (001), (1![[1 with combining macron]](https://www.rsc.org/images/entities/char_0031_0304.gif) 1), (210) and (0
1), (210) and (0![[3 with combining macron]](https://www.rsc.org/images/entities/char_0033_0304.gif) 2) planes of the NDA-based MOF (CCDC 231755).26 When the reaction time is further extended to 48 h, only the peaks of the NiFe MOF could be observed, indicating the complete conversion of NiFe LDH into the NiFe MOF. In addition, Raman spectroscopy also confirmed the formation of the composite catalyst. As shown in Fig. 1c, the peaks at around 1400–1800 cm−1 can be attributed to NDA organic ligands while the peaks located at 447 and 533 cm−1 correspond to the M–O bonds of NiFe LDH.27 Obviously, the characteristic peaks of both NiFe LDH and the NiFe MOF in the NiFe LDH/MOF can be detected, further indicating the successful synthesis of the NiFe LDH/MOF heterojunction. Fourier transform infrared (FT-IR) spectroscopy (Fig. S1†) supports these findings, showing distinct peaks for surface functional groups in the NiFe LDH/MOF.
2) planes of the NDA-based MOF (CCDC 231755).26 When the reaction time is further extended to 48 h, only the peaks of the NiFe MOF could be observed, indicating the complete conversion of NiFe LDH into the NiFe MOF. In addition, Raman spectroscopy also confirmed the formation of the composite catalyst. As shown in Fig. 1c, the peaks at around 1400–1800 cm−1 can be attributed to NDA organic ligands while the peaks located at 447 and 533 cm−1 correspond to the M–O bonds of NiFe LDH.27 Obviously, the characteristic peaks of both NiFe LDH and the NiFe MOF in the NiFe LDH/MOF can be detected, further indicating the successful synthesis of the NiFe LDH/MOF heterojunction. Fourier transform infrared (FT-IR) spectroscopy (Fig. S1†) supports these findings, showing distinct peaks for surface functional groups in the NiFe LDH/MOF.
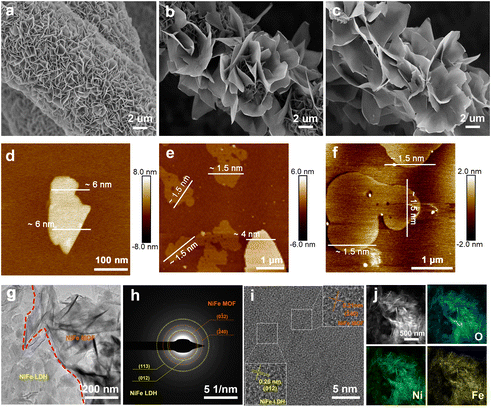
To examine the in situ growth process, scanning electron microscopy (SEM) and atomic force microscopy (AFM) were employed to investigate sample morphologies and thicknesses. For the NiFe LDH precursor, smooth-surfaced 2D nanosheets can be observed to grow vertically and uniformly on the CP (Fig. 2a). The thickness of NiFe LDH is approximately 6 nm (Fig. 2d). After reacting with NDA organic ligands for 24 h, the obtained NiFe LDH/MOF shows a typical sheet-on-sheet hierarchical morphology (Fig. 2b), with the geometric area of the NiFe MOF notably larger than that of NiFe LDH. The thicknesses of NiFe LDH and the NiFe MOF are 4 nm and 1.5 nm, respectively (Fig. 2e). Extending the reaction time to 48 hours (Fig. 2c) results in the complete transformation of NiFe LDH into a sheet-like NiFe MOF, adhering to the CP surface with a constant thickness of 1.5 nm (Fig. 2f). The formation mechanism of the NiFe LDH/MOF heterojunction is speculated to involve the dissolution of NiFe LDH, leading to a decrease in its thickness from 6 nm to 4 nm. Subsequently, NDA ligands coordinate with metal ions released by NiFe LDH, forming an ultra-thin NiFe MOF with a thickness of 1.5 nm on the NiFe LDH surface. This confirms the heterojunction formation via a dissolution–crystallization mechanism.
Transmission electron microscopy (TEM) provides insights into the 2D morphology and heterojunction interface of the NiFe LDH/MOF. As depicted in Fig. 2g, it is apparent that the NiFe LDH/MOF heterojunction is composed of interconnected ultra-thin NiFe LDH and the NiFe MOF. The selected area electron diffraction (SAED) image in Fig. 2h shows diffraction rings corresponding to the (012) and (113) facets of NiFe LDH and the (0![[3 with combining macron]](https://www.rsc.org/images/entities/char_0033_0304.gif) 2) and (
2) and (![[2 with combining macron]](https://www.rsc.org/images/entities/char_0032_0304.gif) 40) facets of the NiFe MOF. The high-resolution TEM (HR-TEM) image in Fig. 2i shows the lattice spacings of 0.26 nm and 0.21 nm, matching well with the (012) facet of NiFe LDH and the (0
40) facets of the NiFe MOF. The high-resolution TEM (HR-TEM) image in Fig. 2i shows the lattice spacings of 0.26 nm and 0.21 nm, matching well with the (012) facet of NiFe LDH and the (0![[3 with combining macron]](https://www.rsc.org/images/entities/char_0033_0304.gif) 2) facet of the NiFe MOF, respectively, which is in agreement with the SAED results and further indicates the successful synthesis of the NiFe LDH/MOF heterojunction. Besides, the HAADF-STEM image and elemental mappings (Fig. 2j) demonstrate the uniform distribution of Fe, Ni, and O in NiFe LDH/MOF heterojunction nanosheets, with a Ni and Fe content of around 30.6 wt% and 45.3 wt%, respectively (Table S1†), as determined by ICP-MS.
2) facet of the NiFe MOF, respectively, which is in agreement with the SAED results and further indicates the successful synthesis of the NiFe LDH/MOF heterojunction. Besides, the HAADF-STEM image and elemental mappings (Fig. 2j) demonstrate the uniform distribution of Fe, Ni, and O in NiFe LDH/MOF heterojunction nanosheets, with a Ni and Fe content of around 30.6 wt% and 45.3 wt%, respectively (Table S1†), as determined by ICP-MS.
X-ray photoelectron spectra (XPS) were used to analyze the surface composition and element valence states of samples. In detail, the C 1s binding energy of the original data was corrected to 284.8 eV as the standard, and then the high-resolution O 1s, Ni 2p, and Fe 2p XPS spectra were fitted using peak splitting rules. All XPS survey spectra of different catalysts show the coexistence of C, O, Ni, and Fe elements (Fig. 3a), which is consistent with the theoretical values. In the O 1s spectra (Fig. 3b), three peaks at 530.8 eV, 531.8 eV and 533.2 eV corresponded to the metal–O, C–O/C![[double bond, length as m-dash]](https://www.rsc.org/images/entities/char_e001.gif) O and H2Oads, respectively.28 In the Ni 2p spectra (Fig. 3c), the peaks located at 855.5 eV and 857.1 eV can be assigned to Ni2+ and Ni3+, respectively. It can be observed that the area ratio of Ni3+/Ni2+ gradually increases from the NiFe MOF (0.78) and NiFe LDH/MOF (0.91) to NiFe LDH (1.23), indicating that the NDA ligand can gain more electrons from Ni–O bonds.29,30 For the Fe 2p spectra (Fig. 3d), the characteristic peaks at 712.5 and 709.8 eV can be traced back to Fe3+ and Fe2+, and the other set of peaks are their corresponding satellite peaks.31,32 Similarly, the area ratio of Fe3+/Fe2+ decreased from NiFe LDH (2.06) and the NiFe LDH/MOF (1.19) to the NiFe MOF (0.75), indicating electron transfer from Ni species to Fe species through bridging oxygen, resulting in enhanced Fe2+ specificity and electron redistribution.33
O and H2Oads, respectively.28 In the Ni 2p spectra (Fig. 3c), the peaks located at 855.5 eV and 857.1 eV can be assigned to Ni2+ and Ni3+, respectively. It can be observed that the area ratio of Ni3+/Ni2+ gradually increases from the NiFe MOF (0.78) and NiFe LDH/MOF (0.91) to NiFe LDH (1.23), indicating that the NDA ligand can gain more electrons from Ni–O bonds.29,30 For the Fe 2p spectra (Fig. 3d), the characteristic peaks at 712.5 and 709.8 eV can be traced back to Fe3+ and Fe2+, and the other set of peaks are their corresponding satellite peaks.31,32 Similarly, the area ratio of Fe3+/Fe2+ decreased from NiFe LDH (2.06) and the NiFe LDH/MOF (1.19) to the NiFe MOF (0.75), indicating electron transfer from Ni species to Fe species through bridging oxygen, resulting in enhanced Fe2+ specificity and electron redistribution.33
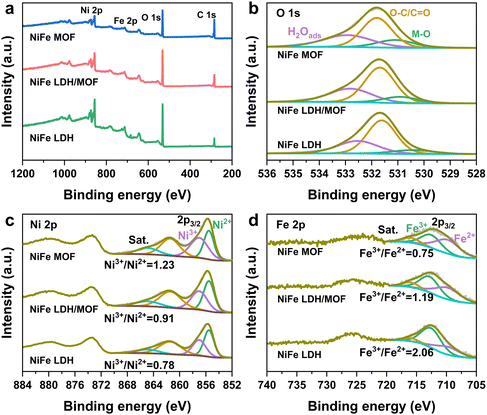 | ||
| Fig. 3 (a) XPS survey spectra and high-resolution (b) O 1s, (c) Ni 2p, and (d) Fe 2p XPS spectra of the NiFe LDH, NiFe LDH/MOF and NiFe MOF, respectively. | ||
The catalysts were thoroughly characterized using various techniques. X-ray diffraction (XRD) confirmed the crystal structures, with distinct peaks for CP, NiFe LDH, and the NiFe MOF. Raman spectroscopy supported composite formation, capturing NDA organic ligand peaks. Fourier transform infrared (FT-IR) spectroscopy revealed surface functional groups in the NiFe LDH/MOF. Scanning electron microscopy (SEM) and atomic force microscopy (AFM) showcased morphological changes, emphasizing sheet-on-sheet heterojunction formation. Transmission electron microscopy (TEM) and high-resolution TEM illustrated the well-defined crystal interface in the NiFe LDH/MOF heterojunction. X-ray photoelectron spectra (XPS) detailed the surface composition and valence states, highlighting electron transfer dynamics between Ni and Fe species.
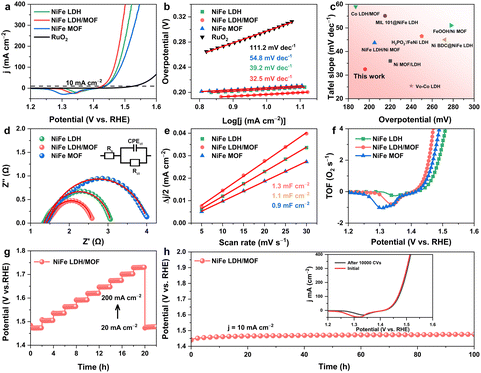
The 2D–2D NiFe LDH/MOF heterojunction nanosheets preserve the crystal structure of LDH and the MOF while inducing notable changes in the electronic structure and surface chemical composition, resulting in an effective enhancement in charge and mass transfer capacity. In a typical three-electrode system, the NiFe MOF, NiFe LDH, NiFe LDH/MOF and RuO2/CP were used as working electrodes to evaluate the electrocatalytic OER performance. All LSV test data were manually compensated using ohmic potential drop (iR). Notably, at a current density of 10 mA cm−2, the potential of the NiFe LDH/MOF heterojunction was 196 mV, lower than that of the NiFe MOF (207 mV), NiFe LDH (204 mV) and RuO2/CP (295 mV) (Fig. 4a). Tafel slopes are used to judge the OER kinetics of catalysts. As shown in Fig. 4b, the Tafel slope of 32.5 mV dec−1 for the NiFe LDH/MOF is much lower than those of the NiFe MOF (54.8 mV dec−1), NiFe LDH (39.2 mV dec−1) and RuO2/CP (111.2 mV dec−1), showing the fast reaction kinetics of the NiFe LDH/MOF. Moreover, the NiFe LDH/MOF heterojunction nanosheets exhibited competitive OER performance compared to some previously reported LDH-based heterojunctions (Fig. 4c, Table S2†). In terms of charge transfer kinetics, the electrochemical impedance spectroscopy (EIS) test was performed with the pre-set test voltage (1.48 V) and disturbance voltage (5 mV) in 1.0 M KOH solution, and the impedance data are fitted and analyzed using Zview software. The NiFe LDH/MOF has the lowest Rct (1.1 Ω cm2) compared with NiFe LDH (1.3 Ω cm2) and the NiFe MOF (2.6 Ω cm2), which means that the NiFe LDH/MOF has the fastest charge transfer ability and better OER performance (Fig. 4d). In addition, the improved OER activity of the heterojunction can also be attributed to the increased number of active sites. To explain this, cyclic voltammetry at different scan rates was performed to calculate Cdl, which is a parameter that can estimate the electrochemical active surface area (ECSA). Obviously, the NiFe LDH/MOF has larger Cdl (1.3 mF cm−2) compared to other control catalysts, indicating that the NiFe LDH/MOF exposes more catalytic sites (Fig. 4e, Fig. S2†). The intrinsic activity of the samples was further investigated by turnover frequency (TOF).34 As shown in Fig. 4f, the NiFe LDH/MOF has the largest TOF value, indicating optimal intrinsic activity. These results collectively demonstrate that the remarkable catalytic ability of the NiFe LDH/MOF arises from faster electron transfer rates and more accessible active sites compared to individual NiFe LDH and NiFe MOF. The stability assessment using a multi-step galvanostatic stability (ISTEP) test at different current densities (20–200 mA cm−2) revealed that the potential of the NiFe LDH/MOF electrode increased immediately but remained stable across a range of low to high current densities, underscoring its impressive mass transport properties, conductivity, and mechanical robustness.35 Notably, upon adjusting the current density back to 20 mA cm−2, the overpotential remained consistent, further confirming the superior stability of the NiFe LDH/MOF. Additionally, as demonstrated in Fig. 4h, the NiFe LDH/MOF catalyst exhibits impressive durability over 100 h at a current density of 10 mA cm−2, further indicating its excellent catalytic stability. Furthermore, 10![[thin space (1/6-em)]](https://www.rsc.org/images/entities/char_2009.gif) 000 consecutive CV scans on the NiFe LDH/MOF showed almost no change in the OER activity before and after scanning (inset in Fig. 4h), highlighting the excellent electrocatalytic activity and stability of the NiFe LDH/MOF due to its unique composition and structural characteristics.
000 consecutive CV scans on the NiFe LDH/MOF showed almost no change in the OER activity before and after scanning (inset in Fig. 4h), highlighting the excellent electrocatalytic activity and stability of the NiFe LDH/MOF due to its unique composition and structural characteristics.
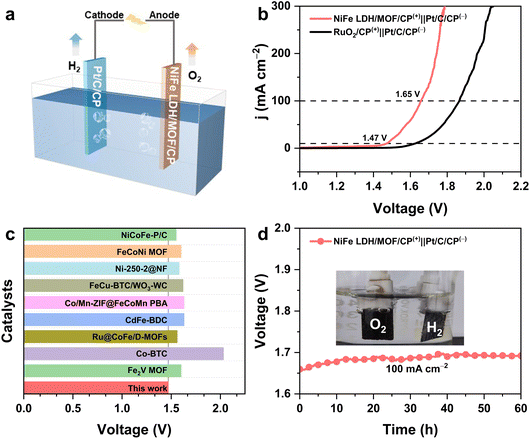
Given the exceptional performance of the NiFe–LDH/MOF in the OER, we further combined the NiFe–LDH/MOF with Pt/C to create a comprehensive OWS system (Fig. 5a). The polarization curve reveals that the NiFe–LDH/MOF only requires low cell voltages of 1.47/1.65 V to realize a current density of 10/100 mA cm−2 in 1.0 M KOH, which is competitive among OER-based catalysts (Fig. 5b and c, Table S3†). The durability test demonstrated the robust and stable potential of the NiFe LDH/MOF for 60 h at 100 mA cm−2 (Fig. 5d), affirming its promising prospects for commercial applications.
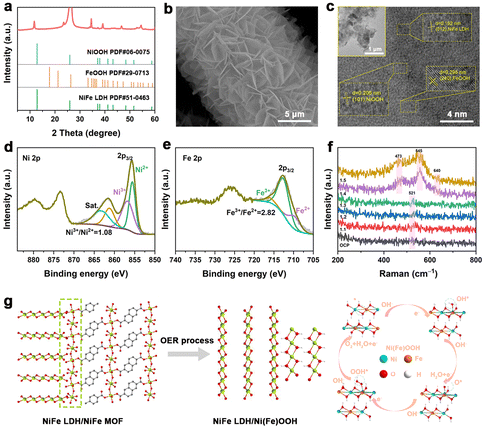
Examining the electronic and microstructural changes in post-reaction catalysts is crucial for understanding the OER mechanism. In Fig. 6a, the diffraction peaks of the NiFe MOF disappeared, while the XRD peaks of NiFe LDH persisted, accompanied by new FeOOH and NiOOH diffraction peaks after 100 hours of the OER. Raman analysis also supported the generation of Ni(Fe)OOH after the stability test (Fig. S3†).36Fig. 6b reveals a single layer of interlaced nanosheets in the SEM image, which is in contrast with the initial double layer where the upper NiFe MOF layer is absent. The ultrasound-exfoliated catalyst exhibits a sheet-like structure in HR-TEM images, exhibiting lattice stripe spacings matching NiOOH, FeOOH, and NiFe LDH crystal planes (Fig. 6c). The fitted high-resolution Ni 2p XPS spectrum revealed that the ratio of Ni3+/Ni2+ increased from 0.91 to 1.08 compared to the original NiFe LDH/MOF, attributed to the formation of NiOOH species (Fig. 6d).37–39 As shown in the Fe 2p spectrum (Fig. 6e), the ratio of Fe3+/Fe2+ increased from 1.19 to 2.82, and the formation of this high valence state of Fe also favors the OER.40,41In situ Raman spectra (Fig. 6f) reveal Ni(Fe)OOH formation during the OER process, evidenced by peaks at 473 and 545 cm−1 as the voltage increases.42,43 Additional peaks at 640 cm−1 indicate the presence of Fe species.44 These results indicate that NiFe MOF/LDH underwent surface reconstruction during electrochemical testing, yielding Ni(Fe)OOH as the true active site (Fig. 6g). The proposed catalytic adsorbate evolution mechanism is as follows:
| *+OH− → HO* + e− | (1) |
| OH− + HO* → H2O + O* + e− | (2) |
| OH− + O* → HOO* + e− | (3) |
| OH− + HOO* → * + O2 + H2O + e− | (4) |
The outstanding OER performance of the NiFe LDH/MOF can be attributed to several factors: (1) the sheet-like array structure maximizes active site exposure, increases the electrolyte contact area, and facilitates efficient electrolyte transport and gas emissions.45,46 (2) The in situ grown self-supporting catalyst exhibits robust structural integrity, enhancing conductivity and avoiding the need for adhesives that could mask active sites, thereby improving durability of the catalyst.47,48 (3) The carboxylic acid-based ligand of the MOF dissolved in the electrolyte promotes proton transfer on the catalyst surface, leading to superior kinetics.49 (4) The heterojunction interface and strong electronic interaction between Ni and Fe components redistribute electrons in the hybrid catalyst, optimizing the electronic structure.50,51 This optimization reduces the activation energy between active sites and oxygen-containing intermediates, ultimately enhancing OER catalysis.52,53
Conclusions
In summary, ultrathin 2D–2D NiFe LDH/MOF heterojunction nanosheets were fabricated using an in situ self-dissociation–assembly strategy, serving as a pre-catalyst for the OER in an alkaline environment. The hierarchical NiFe LDH/MOF, with its ultrathin 2D nanosheets and unique sheet-on-sheet structure, offers a larger accessible surface area, a faster electron transfer rate, and more accessible active sites. The obtained results reveal an impressive overpotential of only 196 mV at 10 mA cm−2, coupled with a low Tafel slope of 32.5 mV dec−1. Moreover, the NiFe LDH/MOF-based overall water splitting device achieves current densities of 10 and 100 mA cm−2 at only 1.47 and 1.65 V, respectively, and remains stable for 60 hours at 100 mA cm−2, demonstrating excellent durability. The identification of Ni(Fe)OOH as the true active species during the OER process further enhances our understanding of dynamic active sites. This work not only contributes to the rational design of heterogeneous catalysts but also unveils the intricate details of the evolution of active sites during the OER process.Author contributions
Haoran Yin: investigation and writing – original draft. Shibiao Su: conceptualization and writing – original draft. Di Yao: methodology. Lixia Wang: investigation and methodology. Xinqiang Liu: investigation. Xiulin Yang: supervision and writing – review & editing. Dandan Cai: supervision and writing – review & editing.Conflicts of interest
The authors declare no competing financial interest.Acknowledgements
The authors would like to thank the financial support from the National Natural Science Foundation of China (no. 22068008 and 21965005) and the Guangxi Province Natural Science Foundation (No. 2020GXNSFAA159104 and 2019GXNSFGA245003).References
- Z. Wang, J. Xu, J. Yang, Y. Xue and L. Dai, Ultraviolet/ozone treatment for boosting OER activity of MOF nanoneedle arrays, Chem. Eng. J., 2022, 427, 131498 CrossRef CAS.
- J. Yuan, Y. Qiao, Y. Li, Y. Lu, J. He, Y. Ge, G. He and H. Chen, A B-doped layered VOPO4·2H2O cathode for high-performance zinc-ion batteries with an H+/Zn2+ co-insertion mechanism, Inorg. Chem. Front., 2024, 11, 874–881 RSC.
- Z. Y. Yu, Y. Duan, X. Y. Feng, X. Yu, M. R. Gao and S. H. Yu, Clean and Affordable Hydrogen Fuel from Alkaline Water Splitting: Past, Recent Progress, and Future Prospects, Adv. Mater., 2021, 33, 2007100 CrossRef CAS PubMed.
- L. Tian, X. Zhai, X. Wang, J. Li and Z. Li, Advances in manganese-based oxides for oxygen evolution reaction, J. Mater. Chem. A, 2020, 8, 14400–14414 RSC.
- H. Yan, Y. Xie, A. Wu, Z. Cai, L. Wang, C. Tian, X. Zhang and H. Fu, Anion-Modulated HER and OER Activities of 3D Ni-V-Based Interstitial Compound Heterojunctions for High-Efficiency and Stable Overall Water Splitting, Adv. Mater., 2019, 31, 1901174 CrossRef PubMed.
- W. Li, B. Guo, K. Zhang, H. Zhang, K. Bu, H. Chen and X. Feng, A co-axial structure composed of RuO2 on defective N-doped carbon nanotubes as a highly efficient electrocatalyst for overall water splitting, Inorg. Chem. Front., 2024, 11, 745–755 RSC.
- Q. Yao, B. Huang, Y. Xu, L. Li, Q. Shao and X. Huang, A chemical etching strategy to improve and stabilize RuO2-based nanoassemblies for acidic oxygen evolution, Nano Energy, 2021, 84, 105909 CrossRef CAS.
- Y. Hu, Z. Huang, Q. Zhang, T. Taylor Isimjan, Y. Chu, Y. Mu, B. Wu, Z. Huang, X. Yang and L. Zeng, Interfacial engineering of Co5.47N/Mo5N6 nanosheets with rich active sites synergistically accelerates water dissociation kinetics for Pt-like hydrogen evolution, J. Colloid Interface Sci., 2023, 643, 455–464 CrossRef CAS PubMed.
- Z. Ma, X. Ma, W. Luo, Y. Jiang, W. Shen, R. He and M. Li, Dopant-Induced Surface Self-Etching of Cobalt Carbonate Hydroxide Boosts Efficient Water Splitting, ChemSusChem, 2023, 16, e202201892 CrossRef CAS PubMed.
- H. Sun, Z. Yan, F. Liu, W. Xu, F. Cheng and J. Chen, Self-Supported Transition-Metal-Based Electrocatalysts for Hydrogen and Oxygen Evolution, Adv. Mater., 2020, 32, 1806326 CrossRef CAS PubMed.
- G. Wang, Y. Meng, C. Chi and Z. Liu, Acetate ion-intercalated NiCo-LDH with quasi-theoretical capacitance for high energy/power density aqueous supercapacitors, Inorg. Chem. Front., 2024, 11, 863–863 RSC.
- N. Yao, G. Wang, H. Jia, J. Yin, H. Cong, S. Chen and W. Luo, Intermolecular Energy Gap-Induced Formation of High-Valent Cobalt Species in CoOOH Surface Layer on Cobalt Sulfides for Efficient Water Oxidation, Angew. Chem., Int. Ed., 2022, 61, e202117178 CrossRef CAS PubMed.
- M. Gorlin, P. Chernev, J. Ferreira de Araujo, T. Reier, S. Dresp, B. Paul, R. Krahnert, H. Dau and P. Strasser, Oxygen Evolution Reaction Dynamics, Faradaic Charge Efficiency, and the Active Metal Redox States of Ni-Fe Oxide Water Splitting Electrocatalysts, J. Am. Chem. Soc., 2016, 138, 5603–5614 CrossRef PubMed.
- X. Zhang, J. Luo, K. Wan, D. Plessers, B. Sels, J. Song, L. Chen, T. Zhang, P. Tang, J. R. Morante, J. Arbiol and J. Fransaer, From rational design of a new bimetallic MOF family with tunable linkers to OER catalysts, J. Mater. Chem. A, 2019, 7, 1616–1628 RSC.
- P. Roy Chowdhury, H. Medhi, K. G. Bhattacharyya and C. Mustansar Hussain, Recent progress in the design and functionalization strategies of transition metal-based layered double hydroxides for enhanced oxygen evolution reaction: A critical review, Coord. Chem. Rev., 2023, 483, 215083 CrossRef CAS.
- H. Liu, Y. Wang, X. Lu, Y. Hu, G. Zhu, R. Chen, L. Ma, H. Zhu, Z. Tie, J. Liu and Z. Jin, The effects of Al substitution and partial dissolution on ultrathin NiFeAl trinary layered double hydroxide nanosheets for oxygen evolution reaction in alkaline solution, Nano Energy, 2017, 35, 350–357 CrossRef CAS.
- R. Gao and D. Yan, Fast formation of single-unit-cell-thick and defect-rich layered double hydroxide nanosheets with highly enhanced oxygen evolution reaction for water splitting, Nano Res., 2018, 11, 1883–1894 CrossRef CAS.
- F. Yan, D. Guo, J. Kang, L. Liu, C. Zhu, P. Gao, X. Zhang and Y. Chen, Fast fabrication of ultrathin CoMn LDH nanoarray as flexible electrode for water oxidation, Electrochim. Acta, 2018, 283, 755–763 CrossRef CAS.
- J. Huo, Y. Wang, L. Yan, Y. Xue, S. Li, M. Hu, Y. Jiang and Q. G. Zhai, In situ semi-transformation from heterometallic MOFs to Fe-Ni LDH/MOF hierarchical architectures for boosted oxygen evolution reaction, Nanoscale, 2020, 12, 14514–14523 RSC.
- W.-D. Zhang, Q.-T. Hu, L.-L. Wang, J. Gao, H.-Y. Zhu, X. Yan and Z.-G. Gu, In situ generated Ni-MOF/LDH heterostructures with abundant phase interfaces for enhanced oxygen evolution reaction, Appl. Catal., B, 2021, 286, 119906 CrossRef CAS.
- Y. He, F. Yan, B. Geng, C. Zhu, X. Zhang, X. Zhang and Y. Chen, Metal-organic framework interface engineering for highly efficient oxygen evolution reaction, J. Colloid Interface Sci., 2022, 619, 148–157 CrossRef CAS PubMed.
- T. Wei, J. Bie, W. Wei, S. Chen, X. Xu, W. Fa and X. Wu, High-density electron transfer in Ni-metal-organic framework@FeNi-layered double hydroxide for efficient electrocatalytic oxygen evolution, J. Colloid Interface Sci., 2023, 642, 505–512 CrossRef CAS PubMed.
- G. Dong, F. Xie, F. Kou, T. Chen, F. Wang, Y. Zhou, K. Wu, S. Du, M. Fang and J. C. Ho, NiFe-layered double hydroxide arrays for oxygen evolution reaction in fresh water and seawater, Mater. Today Energy, 2021, 22, 100883 CrossRef CAS.
- F. Zheng, W. Zhang, X. Zhang, Y. Zhang and W. Chen, Sub–2 nm Ultrathin and Robust 2D FeNi Layered Double Hydroxide Nanosheets Packed with 1D FeNi–MOFs for Enhanced Oxygen Evolution Electrocatalysis, Adv. Funct. Mater., 2021, 31, 2103318 CrossRef CAS.
- F. Liu, C. Shi, X. Guo, Z. He, L. Pan, Z. F. Huang, X. Zhang and J. J. Zou, Rational Design of Better Hydrogen Evolution Electrocatalysts for Water Splitting: A Review, Adv. Sci., 2022, 9, 2200307 CrossRef CAS PubMed.
- H. Xu and Z. Xu, A microporous coordination polymer of 2,6-Naphthalenedicarboxylate and cobalt(II) showing reversible structural and functional transformation, Microporous Mesoporous Mater., 2012, 157, 33–36 CrossRef CAS.
- M. Tian, C. Liu, Z. G. Neale, J. Zheng, D. Long and G. Cao, Chemically Bonding NiFe-LDH Nanosheets on rGO for Superior Lithium-Ion Capacitors, ACS Appl. Mater. Interfaces, 2019, 11, 35977–35986 CrossRef CAS PubMed.
- S. Yao, Y. Jiao, C. Lv, Y. Kong, S. Ramakrishna and G. Chen, Lattice-strain engineering of CoOOH induced by NiMn-MOF for high-efficiency supercapacitor and water oxidation electrocatalysis, J. Colloid Interface Sci., 2022, 623, 1111–1121 CrossRef CAS.
- C. Jiang, S. Li, B. Li, S. Liu, W. W. Dong, Y. P. Wu, Z. F. Tian, Q. Zhang and D. S. Li, In situ synthesis of hierarchical NiCo-MOF@Ni1−xCox(OH)2 heterostructures for enhanced pseudocapacitor and oxygen evolution reaction performances, Dalton Trans., 2021, 50, 3060–3066 RSC.
- S. Jiang, M. Wu, Z. Xu, J. Zhao and R. Liu, Controllable construction of NiFe MOF/LDH heterojunction with interfacial charge transfer as efficient oxygen evolution electrocatalyst, Colloids Surf., A, 2023, 677, 132400 CrossRef CAS.
- G.-H. Lee, Y. Seon Kim and D.-W. Kim, Redox effect of Fe2+/Fe3+ in iron phosphates for enhanced electrocatalytic activity in Li-O2 batteries, Chem. Eng. J., 2020, 388, 124294 CrossRef CAS.
- Y. Guo, X. Zou, X. Wei, W. Bao, J. Zhang, J. Han and F. Jia, Fe regulates Ni3S2/ZrCoFe-LDH@NF heterojunction catalysts for overall water splitting, Chin. J. Struct. Chem., 2023, 100206 Search PubMed.
- Y. Luo, X. Yang, L. He, Y. Zheng, J. Pang, L. Wang, R. Jiang, J. Hou, X. Guo and L. Chen, Structural and Electronic Modulation of Iron-Based Bimetallic Metal-Organic Framework Bifunctional Electrocatalysts for Efficient Overall Water Splitting in Alkaline and Seawater Environment, ACS Appl. Mater. Interfaces, 2022, 14, 46374–46385 CrossRef CAS PubMed.
- H. Qian, J. Wei, C. Yu, F. Tang, W. Jiang, D. Xia and L. Gan, In Situ Quantification of the Active Sites, Turnover Frequency, and Stability of Ni–Fe (Oxy)hydroxides for the Oxygen Evolution Reaction, ACS Catal., 2022, 12, 14280–14289 CrossRef CAS.
- S. Feng, J. Wang, W. Wang, X. Wang, Y. Zhang, C. Chen, A. Ju, J. Pan and R. Xu, The Ni–Mo–S Catalyst @Copper Foams with Excellent Stability and 1.5 V Drive Electrolytic Water, Adv. Mater. Interfaces, 2021, 8, 2100500 CrossRef CAS.
- M. Chen, Y. Zhang, J. Chen, R. Wang, B. Zhang, B. Song and P. Xu, In Situ Raman Study of Surface Reconstruction of FeOOH/Ni3S2 Oxygen Evolution Reaction Electrocatalysts, Small, 2024, 2309371 CrossRef PubMed.
- J. M. Huo, Z. L. Ma, Y. Wang, Y. J. Cao, Y. C. Jiang, S. N. Li, Y. Chen, M. C. Hu and Q. G. Zhai, Monodispersed Pt Sites Supported on NiFe-LDH from Synchronous Anchoring and Reduction for High Efficiency Overall Water Splitting, Small, 2023, 19, 2207044 CrossRef CAS PubMed.
- J. Yan, L. Kong, Y. Ji, J. White, Y. Li, J. Zhang, P. An, S. Liu, S. T. Lee and T. Ma, Single atom tungsten doped ultrathin alpha-Ni(OH)2 for enhanced electrocatalytic water oxidation, Nat. Commun., 2019, 10, 2149 CrossRef PubMed.
- X. Zhang, Y. Chen, Z. Ye, H. Hu, L. Lei, F. You, J. Yao, H. Yang and X. Jiang, Magnetic field-assisted microbial corrosion construction iron sulfides incorporated nickel-iron hydroxide towards efficient oxygen evolution, Chin. J. Struct. Chem., 2024, 43, 100200 CrossRef CAS.
- T. Ai, H. Wang, W. Bao, L. Feng, X. Zou, X. Wei, L. Ding, Z. Deng and B. Rao, Fe-V synergistic doping effect of hierarchical Ni3S2 oblate-nanorod arrays for efficient electrocatalytic oxygen evolution reaction, Chem. Eng. J., 2022, 450, 138358 CrossRef CAS.
- X. Li, Y. Pi, L. Wu, Q. Xia, J. Wu, Z. Li and J. Xiao, Facilitation of the visible light-induced Fenton-like excitation of H2O2 via heterojunction of g-C3N4/NH2-Iron terephthalate metal-organic framework for MB degradation, Appl. Catal., B, 2017, 202, 653–663 CrossRef CAS.
- Q. Li, Q. Chen, K. Jiang, S. Lei, Y. Deng and J. Bao, Boosting high-current water electrolysis: Superhydrophilic/superaerophobic nanosheet arrays of NiFe LDH with oxygen vacancies in situ grown on iron foam, Int. J. Hydrogen Energy, 2023, 48, 17501–17511 CrossRef CAS.
- H. Jia, N. Yao, J. Zhu and W. Luo, Reconstructured Electrocatalysts during Oxygen Evolution Reaction under Alkaline Electrolytes, Chem. – Eur. J., 2023, 29, e202203073 CrossRef CAS PubMed.
- Y. Yang, S. Wei, Y. Li, D. Guo, H. Liu and L. Liu, Effect of cobalt doping-regulated crystallinity in nickel-iron layered double hydroxide catalyzing oxygen evolution, Appl. Catal., B, 2022, 314, 121491 CrossRef CAS.
- P. Yan, Y. Qin, Y. Yang, X. Shao, T. T. Isimjan and X. Yang, Controllable transformation of sheet-like CoMo-hydro(oxide) and phosphide arrays on nickel foam as efficient catalysts for alkali water splitting and Zn–H2O cell, Int. J. Hydrogen Energy, 2022, 47, 23530–23539 CrossRef CAS.
- X. Jin, L. Feng, J. Zhang, W. Yuan and X. Guo, Template-Induced Ni(OH)2 Nanosheet-Constructed Hierarchically Porous Aerogel Boosts Superior Specific Capacitance and Rate Performance for Supercapacitors, ACS Appl. Nano Mater., 2023, 6, 22837–22845 CrossRef CAS.
- S. Weng, S. Li, Y. Xu, Y. Xu, Y. Jiao and J. Chen, Transition metal based organic framework with three-dimensional conducting network for electrochemical energy storage and conversion, Mater. Lett., 2022, 309, 131350 CrossRef CAS.
- A. Goswami, D. Ghosh, D. Pradhan and K. Biradha, In Situ Grown Mn(II) MOF upon Nickel Foam Acts as a Robust Self-Supporting Bifunctional Electrode for Overall Water Splitting: A Bimetallic Synergistic Collaboration Strategy, ACS Appl. Mater. Interfaces, 2022, 14, 29722–29734 CrossRef CAS PubMed.
- C. F. Li, J. W. Zhao, L. J. Xie, J. Q. Wu, Q. Ren, Y. Wang and G. R. Li, Surface-Adsorbed Carboxylate Ligands on Layered Double Hydroxides/Metal-Organic Frameworks Promote the Electrocatalytic Oxygen Evolution Reaction, Angew. Chem., Int. Ed., 2021, 60, 18129–18137 CrossRef CAS PubMed.
- H. Yu, Y. Xie, L. Deng, H. Huang, J. Song, D. Yu, L. Li and S. Peng, In situ construction of FeNi2Se4-FeNi LDH heterointerfaces with electron redistribution for enhanced overall water splitting, Inorg. Chem. Front., 2022, 9, 146–154 RSC.
- Y. Zhai, X. Ren, Y. Sun, D. Li, B. Wang and S. Liu, Synergistic effect of multiple vacancies to induce lattice oxygen redox in NiFe-layered double hydroxide OER catalysts, Appl. Catal., B, 2023, 323, 122091 CrossRef CAS.
- F.-Y. Chen, Z.-Y. Wu, Z. Adler and H. Wang, Stability challenges of electrocatalytic oxygen evolution reaction: From mechanistic understanding to reactor design, Joule, 2021, 5, 1704–1731 CrossRef CAS.
- T. Zhao, Y. Wang, S. Karuturi, K. Catchpole, Q. Zhang and C. Zhao, Design and operando/in situ characterization of precious–metal–free electrocatalysts for alkaline water splitting, Carbon Energy, 2020, 2, 582–613 CrossRef CAS.
Footnotes |
| † Electronic supplementary information (ESI) available. See DOI: https://doi.org/10.1039/d4qi00090k |
| ‡ These authors contributed equally. |
| This journal is © the Partner Organisations 2024 |

