 Open Access Article
Functional magnetic nanoparticles for protein delivery applications: understanding protein–nanoparticle interactions†
Rajat
Sharma
 a,
Daniel
Ungar
 b,
Edward
Dyson
 c,
Stephen
Rimmer
 c and
Victor
Chechik
 *a
*a
aDepartment of Chemistry, University of York, UK. E-mail: victor.chechik@york.ac.uk
bDepartment of Biology, University of York, UK
cPolymer and Biomaterials Chemistry Laboratories, University of Bradford, UK
First published on 29th December 2023
Abstract
Iron oxide nanoparticles (IONPs) surface functionalised with thermo-responsive polymers can encapsulate therapeutic proteins and release them upon heating with an alternating magnetic field above the lower critical solution temperature (LCST). In order to make this delivery system clinically-relevant, we prepared IONPs coated with poly-N-isopropylmethacrylamide (PNIPMAM), a polymer with LCST above human body temperature. The optimal polymer chain length and nanoparticle size to achieve LCST of ca. 45 °C were 19 kDa PNIPMAM and 16 nm IONPs. The PNIPMAM-coated IONPs could encapsulate a range of proteins which were released upon heating above LCST in the presence of a competitor protein or serum. A small amount of encapsulated protein leakage was observed below LCST. The efficiency of protein encapsulation and release was correlated with molecular weight and glycosylation state of the proteins. Magnetic heating resulted in a faster protein release as compared to conventional heating without significant temperature increase of the bulk solution.
1. Introduction
Stimuli-responsive nano-assemblies have attracted significant attention, due to their ability to undergo controlled morphological or functional changes.1–3,6,8 Heat is a particularly attractive trigger as it can be easily applied either directly with good spatiotemporal control, or indirectly through photothermal or magneto-thermal effects.8 Many examples of thermo-responsive polymer assemblies for heat-triggered drug release applications have been reported.1–3,8 For instance, some polymers undergo fast and reversible phase transition from a swollen to a collapsed state at the lower critical solution temperature (LCST), which could trigger release of an encapsulated guest molecule. This thermo-responsive behaviour can be combined with magnetic iron oxide nanoparticles (IONPs), which are able to generate heat in the presence of alternating magnetic field (AMF). Polymer-coated IONPs thus can be used to release the encapsulated guest locally at the targeted sites.8The best studied material of this type of application is poly(N-isopropylacrylamide) (PNIPAM). However, the LCST of the PNIPAM polymer (ca. 32 °C) is below the human body temperature hindering in vivo drug delivery application.8 The LCST can be increased by co-polymerisation with hydrophilic monomers such as acrylamide. For instance, poly(N-isopropylacrylamide-co-acrylamide)-block-polyethylene imine coated IONPs provided heat-triggered release of doxorubicin at 39 °C.2 Moreover, nanocomposite membranes based on nanogels (LCST ca. 40 °C) and magnetite IONPs achieved “on-demand” drug delivery upon the application of an oscillating magnetic field.3 In this case the nanogel was a co-polymer of N-isopropylacrylamide, acrylamide and N-isopropylmethacrylamide. The latter monomer can also be used to make a homo-polymer, poly(N-isopropylmethacrylamide) (PNIPMAM), which has an LCST of ca. 42 °C.4,5 As PNIPMAM only differs from PNIPAM in one methyl group in its repeat unit, similar drug encapsulation/triggered release behaviour to PNIPAM could be expected.
Most reports on polymer-coated IONPs are focussed on the delivery and release of small molecules.6,7 Encapsulation of therapeutic proteins is less explored. Recently, we reported successful protein encapsulation and magneto-thermal release from 10 kDa PNIPAM coated 6 nm IONPs.8 With conventional heating, the protein cargo was released above the LCST in the presence of a competitor protein. Importantly, AMF selectively heated the core of IONPs and magnetic heating-triggered protein release could be observed at bulk solution temperatures below the LCST (ca. 21 °C). This proof-of-principle study showed successful delivery of the growth factor Wnt3a in a functional form to the mesenchymal stem cells (MSCs). Wnt3a release from coated IONPs resulted in significant increase of cell proliferation.
Here, building on our previous findings, we report construction of PNIPMAM coated IONPs that can release a cargo protein above 45 °C (Scheme 1). The particle size and morphology of IONPs have been optimised to enable efficient heating by AMF. We also show that protein size and glycosylation state are important determinants for encapsulation and competitive release of cargo proteins.
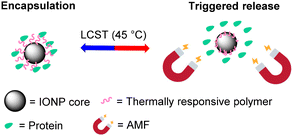 | ||
| Scheme 1 Schematic illustration of the protein release from the thermally-responsive polymer-coated IONPs using magnetic heating as a trigger. | ||
2. Results and discussion
2.1. PNIPMAM synthesis and characterization
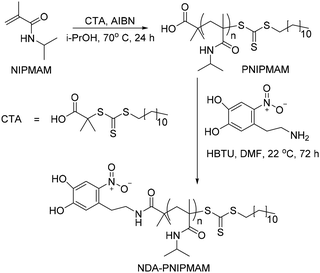
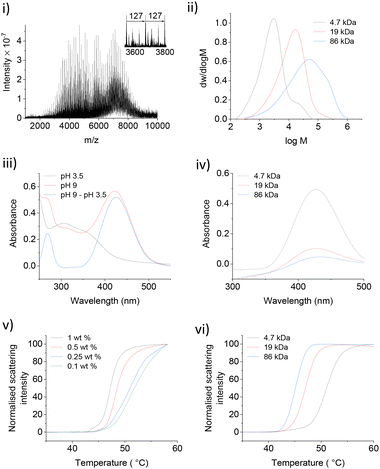
Thermally responsive PNIPMAM polymers were synthesized via RAFT polymerization with azobisisobutyronitrile (AIBN) as a radical initiator and S-1-dodecyl-S′-(α,α′-dimethyl-α′′-acetic acid)trithiocarbonate as a chain transfer agent (CTA) (Scheme 2).9,10 Polymer with the smallest average molecular weight Mw was characterised by matrix assisted laser desorption ionization mass spectrometry (MALDI-MS) (Fig. 1(i)). The expanded spectrum revealed a repeating set of peaks separated from neighbouring sets by the monomer mass (127 Da), which confirmed the successful synthesis of PNIPMAM. MALDI MS spectra of polymers with higher Mw > 10 kDa were too weak. Gel permeation chromatography (GPC) analysis showed that polymer size distribution (Fig. 1(ii)) was broad, presumably due to insufficient removal of oxygen during polymerisation. Nonetheless, both free polymer and polymer-coated nanoparticles showed good phase transition properties in the desired temperature range (vide infra).To facilitate the attachment of PNIPMAM to the IONPs, the end group of the polymer was functionalised with 6-nitrodopamine (NDA), which is a commonly used catechol anchor for iron oxide.11 It can be attached to the PNIPMAM polymer chains either before (pre-functionalisation) or after polymerisation (post-functionalisation).12,13 We used the post-functionalisation approach because it allows incorporation of functionalities incompatible with the polymerisation process.11 Functionalisation with NDA was carried out by coupling the acid terminal group of the polymer to the amine functionality of NDA using HBTU as a coupling agent (Scheme 2). MALDI-MS confirmed complete disappearance of the original polymer peaks and the appearance of a new set of NDA functionalized polymer peaks consistent with the conversion of PNIPMAM to NDA-PNIPMAM (Fig. S1.1†).
Since both the thiocarbonylthio and NDA end groups are UV active, the resultant polymer was characterised by UV-Vis spectroscopy (Fig. 1(iii)). The shoulder corresponding to the thiocarbonylthio group (308 nm) confirmed its presence in the functionalised polymer (Fig. 1(iii)).14 The UV spectrum of NDA-PNIPMAM showed a nitrocatechol peak at 350 nm (λmax) at acidic pH (below the 1st pKa ≈ 7 of the nitrocatechol group), which shifted to the visible range (ca. 422 nm) at pH 9. Free NDA also showed peaks at the same positions. Using a pH 3.5 UV spectrum as a background for the pH 9 spectrum significantly cleans up the nitrocatechol peak at 422 nm (Fig. 1(iv)) which made it possible to quantify NDA functionalisation (Fig. S2.1†). Polymers were further characterised by 1H NMR (Fig. S3.1†).
Several NDA-PNIPMAM polymers with different chain length were prepared (Table 1). Phase transition behaviour of NDA-PNIPMAM was studied using nano-differential scanning fluorimetry (NanoDSF), which can be used as small-scale turbidimetry. NanoDSF is well-suited for studying LCST as it detects the intensity of scattered light (at 280 nm) as a function of temperature with excellent temperature control. NDA-PNIPMAM showed concentration dependence of its phase transition (Fig. 1(v)). The LCST increased with decrease in the concentration of the polymer sample. This is consistent with literature reports on similar materials.15,16 In the literature, LCSTs are usually reported either as the onset of the transition or as the temperature corresponding to the peak rate of scattering intensity change.17,18 For our studies, the latter values are reported (Table 1). In addition to the concentration dependence of the LCST, we also observed an increase in the LCST with decreasing PNIPMAM molecular weight (Fig. 1(vi)). This molecular weight dependence of the polymer LCST is also consistent with literature reports.4
| M w (kDa) | M n/Mw | Yield (%) | LCST (°C) |
|---|---|---|---|
| 4.7 | 2.9 | 70 | 50.5 |
| 19 | 3.2 | 80 | 45.9 |
| 86 | 8.3 | 76 | 44.6 |
2.2. PNIPMAM coated IONPs
![[thin space (1/6-em)]](https://www.rsc.org/images/entities/char_2009.gif) 000g (22 °C). After purification, the nanoparticles were dispersed and stored in deionised water (dH2O) at 4 °C. Polymer-coated IONPs showed excellent long-term stability, e.g., no aggregation was observed after storage in physiological buffer at room temperature for 6 months (Fig. S4.2†).
000g (22 °C). After purification, the nanoparticles were dispersed and stored in deionised water (dH2O) at 4 °C. Polymer-coated IONPs showed excellent long-term stability, e.g., no aggregation was observed after storage in physiological buffer at room temperature for 6 months (Fig. S4.2†).
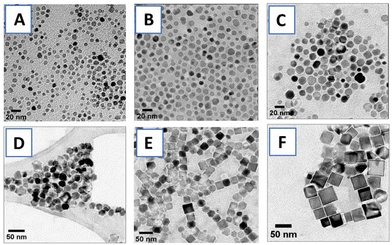
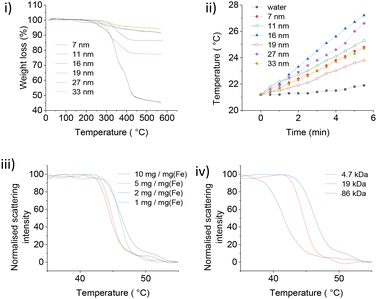
PNIPMAM surface coverage of IONPs was estimated by thermogravimetric analysis (TGA) (Fig. 3(i)). Weight loss between 300 °C–450 °C corresponded to the amount of PNIPMAM present on the IONP surface.8,11 We observed a gradual increase in the polymer weight loss with decrease in IONP size from 33 nm to 7 nm. For 19 kDa PNIPMAM, the grafting densities for each IONP size were 0.098 chains per nm2 (7 nm), 0.062 chains per nm2 (11 nm), 0.058 chains per nm2 (16 nm), 0.032 chains per nm2 (19 nm), 0.050 chains per nm2, (27 nm) and 0.034 chains per nm2 (33 nm). These values are significantly lower than our previous report for 5 nm IONPs coated with 10 kDa PNIPAM (0.3 chains per nm2).8 The low grafting density of PNIPMAM could be attributed to the steric hindrance of the α-methyl groups and the increased polymer length. TEM images of PNIPMAM-coated IONPs (Fig. S4.1†) are similar to the uncoated ones (Fig. 2). Nanoparticles were also characterised by dynamic light scattering (DLS); hydrodynamic diameters and zeta potentials are given in Table 2 and section S5.†
| IONP core diameter (TEM) (nm) | Hydrodynamic diameter (nm) | Zeta potential (mV) | Citric acid IONP SAR (W g−1) | PNIPMAM IONP SAR (W g−1) |
|---|---|---|---|---|
| 7 | 38 | −18 | 6.1 ± 0.1 | 4.2 ± 0.3 |
| 11 | 52 | −2.6 | 8.1 ± 0.3 | 5.0 ± 0.1 |
| 16 | 70 | −1.9 | 13.1 ± 0.6 | 7.5 ± 0.1 |
| 19 | 80 | −1.8 | 3.1 ± 0.3 | 2.5 ± 0.6 |
| 27 | 150 | −1.0 | 4.7 ± 0.7 | 6.1 ± 0.7 |
| 33 | 180 | −3.2 | 3.1 ± 0.4 | 3.9 ± 0.4 |
The heating performance of PNIPMAM coated IONPs (Fig. 3(ii)) was assessed by applying alternating magnetic field (AMF) at a constant voltage (30.0 V) and current (1.95 A) using a home-made equipment (section S6†).8 To quantify and compare magnetic heating for different IONPs, specific absorption rate (SAR) values were calculated (Table 2).8
The SAR values of all IONPs were lower (Table 2) than many literature reports,19–22 which was mainly due to the milder AMF conditions used in our study (magnetic field 28.7 mT, frequency 102.4 kHz, field-frequency product 2884.2 T s−1). These parameters were designed to adhere to established human tolerance limits (6270 T s−1),23,24 and were similar to the clinical magnetic hyperthermia system approved for the treatment of prostate cancer (2257.2 T s−1).25 Unlike magnetic hyperthermia applications, protein release from PNIPMAM coated IONPs does not require a significant increase in the temperature of the bulk environment and so can be used with milder AMF parameters and lower SAR values.
Citrate (CA) coated IONPs were used as a benchmark (section S6†) to check the effect of polymer coating on the heating behaviour of IONPs. CA coated IONPs initially showed an increase in SAR with nanoparticle size (Table 2) from 6.1 W g−1 for 7 nm IONPs to 8.1 W g−1 for and 13.1 W g−1 for 11 nm and 16 nm IONPs, respectively. With further increase in size, SAR decreased to 4.7 W g−1 for 27 nm and 3.06 W g−1 for 33 nm nanocubes. In a related study, Mohapatra et al. also observed a bell-shape dependence of SAR with particle size, and maximum SAR was observed for 28 nm IONPs.19 We also observed a similar size trend for PNIPMAM coated IONPs (Table 2), with 16 nm IONPs showing maximum heating performance (SAR = 7.5 W g−1). The heating rate (SAR) of PNIPMAM coated IONPs was lower than that of citric acid coated IONPs.
PNIPMAM coated IONPs also showed concentration dependence of their LCST, similar to pure polymer, however the dependence was much weaker (Fig. 3(iii) and 1(v)). This can be tentatively explained by the interactions between adjacent polymer chains adsorbed on the same particle, which is absent in dilute polymer solutions. This interaction does not depend on concentration, and hence the phase transition of PNIPMAM-coated particles does not show strong dependence on the concentration. Interestingly, the effect of PNIPMAM chain length on the LCST of free polymer and polymer-coated nanoparticles was opposite (Fig. 3(iv) and 1(vi)). LCST of PNIPMAM decreased with increasing polymer length. In contrast, LCST of PNIPMAM coated IONPs increased with increasing polymer chain length. This can also be attributed to the interactions between adjacent polymer chains attached to the same NP. In the particles coated with shorter polymers, all repeat units from different chains attached to the same particle are close to (and strongly interacting with) each other, essentially resembling a very high molecular weight polymer thus decreasing the LCST. However, for the longer polymer coated NPs, polymer chains protrude further into solution and behave independently, with weaker interactions between adjacent chains. For practical protein delivery applications, PNIPMAM-coated IONPs must have a phase transition onset at or above 45 °C to avoid significant protein leak at normal body temperature (37 °C). Hence, larger polymers (≥19 kDa, with LCST 43–46 °C) were used for further studies.
2.3. Protein–nanoparticle interactions
Understanding protein–nanoparticle interactions is critical for optimising protein encapsulation and release processes.26–32 In our case, the polymer grafting density was low and hence the thickness of the polymer shell on the nanoparticle surface was also estimated to be low (ca. 2 nm for 19 kDa PNIPMAM @ 16 nm IONPs). Therefore, it was expected that the protein might interact with both the iron oxide core and the polymer shell.33,34 These interactions could be of several different types. Proteins are negatively charged above and positively charged below their isoelectric point (pI). Zeta potential measurements of PNIPMAM coated IONPs revealed an overall negative surface charge (Table 2). There are no ionizable groups in the PNIPMAM repeat units at pH 7.4 and hence this negative charge would be on the IONP core leading to electrostatic interactions with charged proteins. Some amino acids (mainly histidine or cysteine) in the protein structure could bind to the metal oxide surface.31 The amide functionalities in PNIPMAM repeat units can encapsulate protein by H-bonding. Below the LCST, the polymer chains on the IONP surface would be in the expanded form, which makes the polymer chains accessible for H-bonding with proteins. However, above the LCST, the polymer chains collapse to create a hydrophobic shell on the nanoparticle surface, which would lead to hydrophobic interactions with adsorbed proteins. Overall, protein encapsulation by PNIPMAM coated IONPs is likely to include contributions from a range of different types of non-covalent interactions (Fig. 4).In order to get some information about the nature of protein–nanoparticle interactions, the effect of particle size and polymer chain length on the encapsulation/release of the model glycoprotein apotransferrin (TRF) was studied. Encapsulation was carried out by suspending the PNIPMAM-coated IONPs and the guest protein in a buffer at 45 °C followed by incubation at room temperature. While loading at high temperature could lead to partial denaturation of the guest protein, we found that this procedure is essential for successful loading and the following release of the protein guest, consistent with our previous observation.8 A control experiment with model guest proteins showed no appreciable denaturation under these conditions (Fig. S12.1 and S12.2†).
Protein-loaded IONPs were stable in physiological buffer over a 24 h period. However visible precipitation appeared after 48 h storage, and TEM images showed aggregation after 1 week of storage (Fig. S4.3†). Protein-loaded IONPs were therefore used in subsequent experiments immediately after preparation.
2.4. Protein encapsulation/release studies
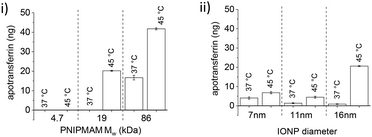
16 nm IONPs were used as a common core to study the effect of polymer chain length on protein encapsulation and release. TRF encapsulation increased with increasing chain length. When 0.5 mg of PNIPMAM coated IONPs was incubated with 1000 ng of TRF, only minimal protein loading was observed for 4.7 kDa (20 ng). However, as polymer chain length increased, protein encapsulation also increased, reaching 400 ng for 19 kDa polymer, and 700 ng for 86 kDa polymer. Increase in protein encapsulation with increasing polymer MW suggests that encapsulation is at least partly driven by the interactions between proteins and polymer chains. After TRF encapsulation, its release was studied at 45 °C in the presence of RNaseB (Fig. 5(i)).
No protein release was observed for 4.7 kDa polymer coated IONPs, however 21 ng TRF was released at 45 °C with minimum leakage at 37 °C for 19 kDa PNIPMAM (Fig. 5(i)).
Further increase in MW to 86 kDa led to an approximately 2-fold increase in triggered protein release. However, TRF leaching at 37 °C also increased to ca. 15 ng. The protein leak at 37 °C could be due to some protein loosely bound to IONPs functionalised with the longest polymer chains. This partial leak at 37 °C indicates the complexity of protein–nanoparticle interactions and underscores the importance of experimental validation of the encapsulation/release system. From these experiments we concluded that the 19 kDa PNIPMAM functionalised IONPs were the most advantageous for our further studies.
The effect of the IONP core diameter on protein encapsulation and release was studied with 7, 11 and 16 nm IONPs. 19 kDa PNIPMAM was used as a common coating and the same amount of IONPs (based on the mass of Fe) was used in these experiments. TRF encapsulation decreased with increasing NP diameter and maximum loading was observed for 7 nm IONPs (ca. 900 ng of 1000 ng TRF). This can be readily explained by the high surface area of smaller IONPs.
After TRF loading, we assessed release and found this to be strongly affected by the IONP size (Fig. 5(ii)). Despite higher protein encapsulation, only a small amount of TRF was released from 7 nm (ca. 7 ng) and 11 nm (ca. 5 ng) IONPs. However, 16 nm IONPs released ca. 21 ng at 45 °C with only a slight protein leak observed at 37 °C (ca. 1 ng). The smaller particles have higher curvature and hence likely a greater potential for the protein to irreversibly bind to iron oxide, which could be the reason for the observed lower protein release.
In conclusion, protein encapsulation increased with increased polymer chain length and decreased with IONP size. However, only 16 nm IONPs showed an appreciable temperature triggered protein release and hence 16 nm IONPs coated with 19 kDa PNIPMAM were used for all further studies.
Following TRF encapsulation by PNIPMAM coated IONPs, release experiments with different glycosylated competitor proteins showed increased temperature-triggered TRF release with increasing competitor size. About 21 ng of the 400 ng loaded TRF was released with the 14.9 kDa RNaseB competitor and close to 175 ng with the 45 kDa OVL (Table 3). This increased release was accompanied by a slight increase in TRF leakage, which was dramatically increased when using an even larger protein, the 160 kDa IgG as a competitor. Thus, although IgG allowed releasing as much as 350 ng of the encapsulated TRF at 45 °C, leakage below the transition temperature amounted to almost a third of this. This can be explained by higher avidity of the bigger competitor proteins for IONPs. No clear effect of the competitor protein's pI was apparent in our experiments.
To test the effect of glycosylation on the TRF release we compared RNaseA and RNaseB as competitors. These two isoforms of RNase share the same polypeptide chains but only RNaseB is glycosylated.42 Heat-triggered TRF release (Fig. 6) in the presence of RNaseA was only about 10% of the amount released in the presence of RNaseB. This is a strong indication that glycosylation significantly affects the interactions between proteins and polymer-coated IONPs above the LCST. This is presumably mediated through hydrogen bonding and/or chelating interactions of the multiple OH groups in the glycans with the iron oxide surface.
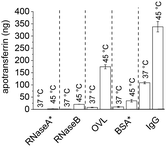 | ||
| Fig. 6 Effect of competitor protein properties on heat-triggered TRF release. * = non-glycosylated proteins. Western blots are given in the ESI (section S7).† | ||
The importance of glycosylation for the effectiveness of the competitor protein was further confirmed in release experiments with the non-glycosylated competitor BSA (Fig. 6). Despite BSA having a larger size than OVL (66 vs. 45 kDa), the amount of TRF released by BSA was only about 20% (ca. 30 ng) of that released by OVL (ca. 175 ng). This is consistent with a significant effect of competitor glycosylation on heat-triggered protein release.
To probe the specificity of this glycosylation effect, three monosaccharides (D-mannose, D-galactose and D-glucose) along with a disaccharide (maltose) and a polysaccharide (alginic acid) were used as competitors for heat-triggered TRF release, all at 10 mg ml−1 and pH 7.4. Only D-mannose resulted in a partial release of TRF above the LCST of PNIPMAM coated IONPs (Fig. S8.1†). Meng et al. found mannose to be a better chelator for iron compared to glucose and other sugars, which could explain our observation.37 Additionally, the glycoproteins used in this study are mannose rich.38,39 Specifically, RNaseB and OVL are primarily decorated with oligomannose structures, containing approximately 70–80% mannose, while IgG predominantly consists of complex glycans, with only about 30% mannose.44 Based on these findings, it is plausible to suggest that the enhanced TRF release by glycosylated competitors could be attributed to mannose-IONP interactions. Furthermore, the size of the competitor may also play a role, as IgG, which has a lower proportion of mannose compared to RNaseB and OVL, showed increased TRF release.
After loading TRF and IgG, most of the loosely bound protein was removed with fewer than 10 competitor protein washes. However, GFP-loaded IONPs experienced significant protein loss during the initial RNaseB washes, followed by constant leakage with every subsequent wash below LCST. The amount of protein leak was approximately three times higher when the larger OVL was used as a competitor (Fig. 7(i)). Heat-triggered GFP release with RNaseB or OVL did not differ significantly from the control experiment at 37 °C, suggesting that the small non-glycosylated GFP protein binds weakly to polymer-coated IONPs. In contrast, IgG's heat-triggered release with OVL as a competitor yielded a similar amount of protein as for TRF (about 150 ng, Fig. 7(ii)). However, there was a significant increase in the IgG leakage at 37 °C with the competitor OVL (ca. 30 ng) as compared to RNaseB (ca. 10 ng).
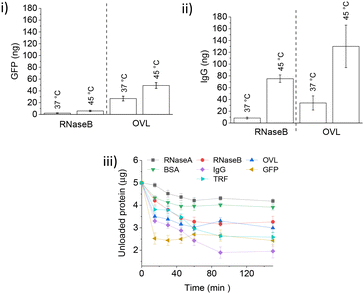 | ||
| Fig. 7 (i) Heat-triggered release of GFP with different competitors. Quantification of GFP (Fig. S9.1†) release following competitor treatment for 60 min at 37 °C and 45 °C (RNaseB and OVL as indicated) of PNIPMAM coated IONPs loaded with 1000 ng GFP at pH 7.4 (n = 3, error bars denote standard error). (ii) Heat-triggered release of IgG with different competitors. Western blot analysis and quantification of IgG (section S10†) release following competitor treatment for 60 min at 37 °C and 45 °C (RNaseB and OVL as indicated) of PNIPMAM coated IONPs loaded with 1000 ng IgG at pH 7.4 (n = 3, error bars denote standard error). (iii) Protein encapsulation by IONPs at 22 °C: 0.5 mg PNIPMAM coated IONPs were mixed (350 rpm) with 5000 ng of the protein in the physiological buffer (20 mM HEPES, 100 mM NaCl, pH 7.4) (n = 3, error bars denote standard error). Protein quantification was done using Coomassie staining. | ||
Finally, we investigated the kinetics of protein encapsulation by IONPs (Fig. 7(iii)). A range of glycosylated and non-glycosylated proteins used in this study (except GFP) showed similar loading behaviour with the saturation of the binding sites achieved within 60 min. More of the larger and glycosylated proteins was encapsulated as compared to the smaller and non-glycosylated ones, with GFP binding significantly faster than all other tested guest proteins.
Overall, protein encapsulation onto and release from PNIPMAM coated IONP is a complex process which depends on a number of physico-chemical properties of both the guest and competitor proteins. Both below and above the LCST, protein–nanoparticle interactions increased with glycosylation and increasing size of guest or competitor proteins. GFP, a small non-glycosylated protein, binds quickly but leaks out below the LCST, suggesting highly reversible binding.
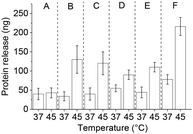
After IgG loading, treatment with goat serum as a competitor (10% in 20 mM HEPES, pH 7.4) during washings resulted in more protein leaching as compared to the OVL washings. The protein release with the serum was somewhat lower than with OVL as a competitor. At 45 °C, ca. 70 ng of IgG were released with a significant leakage of ca. 40 ng at 37 °C (Fig. 8(B) and 9(i)). The protein concentration in serum is approximately 60–80 mg mL−1, with 50–60% composed of albumins (ca. 60–70 kDa) and 40% of globulins, among which 10–20% are IgG (160 kDa).45 These findings suggest that serum can serve as a potential source of competitor proteins for triggered protein release, but the issue of leakage below LCST still needs to be addressed.
The experiments carried out so far used conventional heating above the LCST to trigger guest protein release. Magnetic heating can lead to a different release profile as it affects the nanoparticle core much stronger than the surrounding medium. In order to assess suitability of the PNIPMAM coated IONP system for these applications, we explored magnetically-triggered release of IgG using serum as a competitor. AMF heating was applied in a pulsed sequence (10 s on–30 s off) to avoid heating of the bulk solution. Under these conditions, protein release after 30 min of magnetic heating was significantly higher (ca. 85 ng, Fig. 9(ii)) than with conventional heating (ca. 30 ng, Fig. 9(i)). Importantly, the bulk solution temperature stayed below the LCST of PNIPMAM coated IONPs (37.3 °C) during magnetic treatment. Protein leak at 37 °C in the absence of an AMF over a 30 min period was relatively small which suggests that the PNIPMAM coated IONP system can be used for delivery of therapeutic proteins using magnetic heating in a biological milieu acting as a source of competitor proteins.
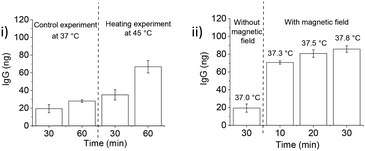 | ||
| Fig. 9 IgG release from IONPs in a temperature-dependent manner. (i) Western blot analysis (section S11†) and quantification of IgG release following 10% goat serum treatment for 60 min at 37 °C and 45 °C of PNIPMAM coated IONPs loaded with 1000 ng IgG at pH 7.4 (n = 3, error bars denote standard error). (ii) Magnetic heating triggered IgG release from PNIPMAM @ IONPs at 37 °C: western blot analysis (section S11†) and quantification of IgG release following 10% goat serum treatment for 30 min at 37 °C with and without magnetic heating (10 s on/30 s off) of PNIPMAM coated IONPs loaded with 1000 ng IgG at pH 7.4 (n = 3, error bars denote standard error). Fe concentration 5 mg mL−1, alternating magnetic field strength and frequency 28.7 mT and 102.4 kHz, respectively. Bulk solution temperatures measured during magnetic heating are provided above each timepoint. Protein release was calculated as the absolute amount of IgG associated with the particles after 10 washings. | ||
3. Conclusions
We have successfully developed PNIPMAM-functionalised IONPs which could be used for the encapsulation and magnetically-triggered release of guest proteins. The polymer shell undergoes a phase transition above the LCST at ca. 45 °C, which makes the system suitable for in vivo applications. The PNIPMAM coated nanoparticles showed less pronounced dependence of LCST on polymer chain length than the free polymer. The IONPs with optimal particle size (ca. 16 nm) encapsulated and released guest proteins in the presence of a competitor protein. Protein–nanoparticle interactions showed complex dependence on protein properties, with stronger binding observed for larger and glycosylated proteins. Importantly, serum could be used as a physiologically relevant source of competitor proteins for guest release. Heat-triggered release experiments showed that some encapsulated protein leaches out below the LCST, but a significantly larger amount is released above the LCST. Magnetically-triggered heating released the encapsulated guest proteins at a faster rate than conventional heating, and without significant heating of the bulk solution. These observations show the potential of PNIPMAM coated IONPs for the delivery and magnetic release of therapeutic proteins in medicinal applications.4. Experimental
4.1. Materials and methods
All chemicals and solvents were used as received unless mentioned otherwise. CTA was purchased from Fluorochem. Azobisisobutyronitrile (AIBN) was purchased from Sigma-Aldrich. Dopamine hydrochloride and sodium nitrite were purchased from Alfa Aesar. HBTU (2-(1H-benzotriazol-1-yl)-1,1,3,3-tetramethyluronium hexafluorophosphate) and N,N-diisopropylethylamine (DIPEA) were purchased from Sigma-Aldrich. Iron(III) acetylacetonate, oleylamine (OAm), 1,2-tertadecanediol, decanoic acid and benzyl ether were purchased from Sigma-Aldrich. Oleic acid (OA) and 4-biphenyl carboxylic acid were purchased from Alfa Aesar. Water used for lower critical solution temperature (LCST) studies was purified using a Millipore Milli-Q system with a QPAK 2 column. All syringe injections for water and air sensitive reactions were made using a syringe purged with nitrogen gas three times immediately prior to use. Proteins used in this study were purchased from Sigma Aldrich unless mentioned otherwise. All antibodies except anti bovine IgG (Bethyl) were purchased from Bio Rad.4.2. General characterizations
UV-Vis spectroscopy was recorded on a Shimadzu UV-1800 UV-Vis spectrophotometer. 1H-NMR (400 MHz) spectra were obtained in CDCl3, D2O or DMSO-d6 using a JEOL ECS-400 spectrometer. Matrix-assisted laser desorption/ionisation-time of flight (MALDI-TOF) mass spectrometry was carried out on an Ultraflex spectrometer (Bruker) in positive linear ion mode. 1 mg mL−1 samples were spotted (2 μL) at dilutions of 1/10, 1/100 and 1/1000, made up in a 20 mg mL−1 matrix solution of alpha-cyano-4-hydroxycinnamic acid (CHCA) in THF. LCST of the polymer was determined by NanoDSF. Different concentrations of PNIPMAM were prepared in deionised water (dH2O) (0.1–1 wt%) and loaded into the instrument in capillary tubes. Temperature ramp rate was set to 0.4 °C min−1 and the scattering data were recorded from 20–75 °C. LCST was estimated by plotting first derivatives of the scattering intensity against temperature change. For the size determination of IONPs, TEM images were obtained using a JEOL 2011 transmission electron microscope operated at 200 kV accelerating voltage. Hydrodynamic diameter and zeta potential measurements were recorded using a Zetasizer and analysed using the DTS v. 5.1 supplied by Malvern. 1 mg mL−1 ([Fe]) samples were prepared by sonication in dH2O for 15 min before placing sample (1 mL) into a disposable DLS cuvette for size distribution and a U-bend cell for zeta potential. Measurements were made at 25 °C, and carried out in triplicate at 10 runs per measurement. Molecular weight distributions of polymer samples were determined by gel permeation chromatography (GPC). Samples were prepared in pre-filtered methanol (2.5 mg cm−3) and injected through three Agilent 8 μm Polargel columns (1 mL min−1) maintained at 30 °C. This was then fed through Agilent UV (254 nm), refractive index, and viscometric (Agilent 1260 Infinity Detector Suite) detectors each maintained at 30 °C. The column was calibrated with linear PNIPAM standards.4.3. Synthesis of PNIPMAM using RAFT
For a 1 g scale reaction, a mixture of N-isopropylmethacrylamide (NIPMAM) (1 g, 7.86 mmol) and isopropanol (1 mL) was heated to 70 °C until complete dissolution and cooled to room temperature. CTA (28.7 mg, 0.0786 mmol) in isopropanol (1 ml) was added to the NIPMAM solution and the reaction mixture was purged with Ar for 1 h. In a separate sample vial, a stock solution of AIBN in isopropanol (30.4 mM) was purged for 20 min under Ar. 200 μL (1 mg, 0.006 mmol) of this purged AIBN solution was added to the NIPMAM solution at 70 °C with vigorous stirring to start the polymerization. After 24 h, the reaction was quenched by cooling to room temperature. Solvent was removed on a rotary evaporator and the solid was dissolved in THF (5 ml). PNIPMAM was then selectively precipitated by adding n-pentane (40 ml) and the precipitates were collected by centrifugation (4500 rpm, 10 min). The precipitates were dissolved in THF and combined before evaporating the solvent on a rotary evaporator to get a solid product. Yield: 0.7 g (70%).1H NMR: (D2O, 400 MHz), 1H NMR: (D2O, 400 MHz), δ (ppm) = 6.9–7.3 (br m 1H), 3.6–3.9 (br m, 1H), 1.4–2.0 (br m, 2H), 0.5–1.1 (br m, 6H), 0.5–1.1 (br m, 3H). To synthesise polymers with Mw 4.7, 19 and 86 kDa, the following molar ratios of monomer![[thin space (1/6-em)]](https://www.rsc.org/images/entities/char_2009.gif) :
:![[thin space (1/6-em)]](https://www.rsc.org/images/entities/char_2009.gif) CTA
CTA![[thin space (1/6-em)]](https://www.rsc.org/images/entities/char_2009.gif) :
:![[thin space (1/6-em)]](https://www.rsc.org/images/entities/char_2009.gif) AIBN were used, respectively: 100
AIBN were used, respectively: 100![[thin space (1/6-em)]](https://www.rsc.org/images/entities/char_2009.gif) :
:![[thin space (1/6-em)]](https://www.rsc.org/images/entities/char_2009.gif) 1
1![[thin space (1/6-em)]](https://www.rsc.org/images/entities/char_2009.gif) :
:![[thin space (1/6-em)]](https://www.rsc.org/images/entities/char_2009.gif) 0.08; 400
0.08; 400![[thin space (1/6-em)]](https://www.rsc.org/images/entities/char_2009.gif) :
:![[thin space (1/6-em)]](https://www.rsc.org/images/entities/char_2009.gif) 1
1![[thin space (1/6-em)]](https://www.rsc.org/images/entities/char_2009.gif) :
:![[thin space (1/6-em)]](https://www.rsc.org/images/entities/char_2009.gif) 0.3; 1000
0.3; 1000![[thin space (1/6-em)]](https://www.rsc.org/images/entities/char_2009.gif) :
:![[thin space (1/6-em)]](https://www.rsc.org/images/entities/char_2009.gif) 1
1![[thin space (1/6-em)]](https://www.rsc.org/images/entities/char_2009.gif) :
:![[thin space (1/6-em)]](https://www.rsc.org/images/entities/char_2009.gif) 0.8.
0.8.
4.4. Conversion of PNIPMAM to NDA-PNIPMAM
Synthesis was adapted from a previous study.11 PNIPMAM (2 g, 0.67 mmol, 3 kDa), HBTU (304.91 mg, 0.804 mmol) and DIPEA (116.7 μL, 0.67 mmol) were dissolved in dry DMF (19 mL) and purged with nitrogen gas for 15 min and stirred for 1 h. NDA (398.34 mg, 2.01 mmol) in DMF (1 mL) and DIPEA (233.4 μL, 1.34 mmol) were added under inert conditions, and the resulting solution was stirred at room temperature for 3 days. The solution was acidified with a few drops of 2 M HCl. The polymer was precipitated by dropping the solution in cold diethyl ether (100 ml) and collected via centrifugation (4500g, 10 min). The polymer was further purified by dissolving in a minimum volume of dH2O (∼10 ml) followed by centrifugation (4500g, 30 min) to remove unreacted NDA and dialysis (2 days), and dried on a rotary evaporator at 40 °C. Yield: 1.34 g (67%). 1H NMR: (D2O, 400 MHz), δ (ppm) = 7.5–7.6 (br m, 1H), 6.9–7.3 (br m, 1H), 6.6–6.7 (br m, 1H), 3.6–3.9 (br m, 1H), 13.48 (br m, 2H), 3.05 (br m, 2H), 1.4–2.0 (br m, 2H), 0.5–1.1 (br m, 6H), 0.5–1.1 (br m, 3H).4.5 IONP synthesis
IONPs with diameter 7 nm were synthesized by following a recently developed colloidal synthesis route in which a mixture of Fe(acac)3 (1.4 g, 4 mmol), 1,2-tetradecanediol (4.6 g, 20 mmol), oleic acid (6.78 g, 24 mmol) and oleylamine (6.4 g, 24 mmol) in benzyl ether (20.86 g) was refluxed at 300 °C to give monodisperse and highly crystalline IONPs.20 The reaction mixture was magnetically separated (neodymium magnet) to yield black precipitates of IONPs which were redispersed in ethanol (10 ml) and reprecipitated by adding ethyl acetate (100 ml). The precipitated IONPs were magnetically separated and washed 3–5 times using ethanol/ethyl acetate washings. Washed IONPs were dispersed in toluene (5 ml) and stored at 4 °C. Similar washing procedure was used for the isolation, purification and storage of all the IONPs synthesized in this study. IONPs with average diameter 11 nm and 16 nm were obtained via a solvent-free Fe(acac)3 thermal decomposition/reduction approach in oleylamine/oleic acid.19 Iron oxide nano-octahedral (19 nm) and nanocubes (27 nm) were prepared by a modified literature approach.21 For 19 nm nano-octahedral, Fe(acac)3 (0.71 g, 4 mmol), oleic acid (2.82 g, 10 mmol), 4-biphenyl carboxylic acid (0.793 g, 4 mmol) and dibenzyl ether (20.8 g) were refluxed with an over-head stirrer. 27 nm IONPs were prepared as described for 19 nm octahedral IONPs using Fe(acac)3 (1.4 g, 4 mmol), OA (2.54 g, 9 mmol), 4-biphenyl carboxylic acid (0.793 g, 4 mmol) and benzyl ether (20.8 g). The synthesis was done under magnetic stirring instead of using over-head stirrer. The nanocubes (40 nm) were obtained by refluxing a mixture of Fe(acac)3 (0.353 g, 1 mmol) and decanoic acid (0.69 g, 4 mmol) in benzyl ether (25 ml).224.6. PNIPMAM coated IONPs
A toluene suspension (1 ml) of oleic acid/oleylamine (OA/OAm) capped IONPs (30 mg) and NDA-PNIPMAM (450 mg) were resuspended in DMF (5 ml). The reaction mixture was sonicated for 5 h at room temperature, and left overnight stirring. The polymer coated nanoparticles were then precipitated in diethyl ether (40 ml) and centrifuged (4500g, 15 min). The supernatant was removed and the particles were re-dissolved in dH2O (10 ml). The unreacted polymer was removed using ultracentrifugation (160![[thin space (1/6-em)]](https://www.rsc.org/images/entities/char_2009.gif) 000g, 1 h at room temperature). The precipitates were further washed 3–5 times by re-dissolving in dH2O and separation using Eppendorf centrifugation (20
000g, 1 h at room temperature). The precipitates were further washed 3–5 times by re-dissolving in dH2O and separation using Eppendorf centrifugation (20![[thin space (1/6-em)]](https://www.rsc.org/images/entities/char_2009.gif) 000g, 30 min at room temperature). The washed precipitates were dissolved in dH2O (3 ml) and stored at 4 °C. Yield: 20 mg (70%).
000g, 30 min at room temperature). The washed precipitates were dissolved in dH2O (3 ml) and stored at 4 °C. Yield: 20 mg (70%).
4.7. Determination of iron content in the IONPs
Total iron content of IONPs was determined using UV-Vis spectrophotometer.41 The process was started with dissolving the known weight (5–10 mg) of IONPs in the minimum volume of conc. HCl (0.4 ml), resulting in the formation of a solution containing a mixture of Fe2+ and Fe3+ ions. The resulted solution was then diluted with dH2O (25 ml) in a 50 ml volumetric flask and all the iron was then reduced to Fe2+ by adding excess of hydroxylamine hydrochloride (4 ml, 10 wt% in dH2O). To this Fe2+ solution, o-phenanthroline (4 ml, 0.3 wt% in ethanol) was added resulting in the formation of an orange red complex (pH = 6–6.5) and the content of the iron was determined using the UV-Vis spectrophotometer (λmax = 511 nm). The standard for the determination of the total iron content was Mohr salt.4.8. Magnetic heating measurements
The heating performance of the water dispersible IONPs was assessed using an applied alternating magnetic field (magnetic field 28.7 mT, frequency 102.4 kHz, field-frequency product 2884.2 T s−1) at a constant voltage (30.0 V) and current limit (1.95 A). A control experiment checked the background heating of deionised water (dH2O). 0.45 ml dH2O was loaded to a sample tube of dimensions 8 mm × 40 mm (diameter × height, Sigma) and the sample was put inside the heating chamber. Sample tube was held in a fixed position by a plastic holder and a lid was adapted to allow for insertion of thin plastic tubing for gallium arsenide thermocouple probe to monitor the temperature changes inside the chamber.8 Magnetic heating data for various ligand coated IONPs were then recorded using above described procedure.4.9. Preparation of protein-loaded nanoparticles
Prior to protein encapsulation, 0.5 mg of polymer-coated nanoparticles (100 μL, 5 mg ml−1 in dH2O) were washed with 1 ml diethyl ether. Centrifugation (20![[thin space (1/6-em)]](https://www.rsc.org/images/entities/char_2009.gif) 000g, 20 min) was used to separate washed IONPs. After ether washing, IONPs were washed three times by suspending in physiological buffer (1 ml) followed by centrifugation (20
000g, 20 min) was used to separate washed IONPs. After ether washing, IONPs were washed three times by suspending in physiological buffer (1 ml) followed by centrifugation (20![[thin space (1/6-em)]](https://www.rsc.org/images/entities/char_2009.gif) 000g, 20 min). After washing, IONPs were resuspended in 100 μl physiological buffer containing 1 μg guest protein. The solution was then incubated on a shaker at 45 °C for 15 min to agitate and suspend nanoparticles following precipitation at a temperature above polymer LCST (45 °C). IONPs were then incubated on a shaker at room temperature for 2 h. Particles were then separated using centrifugation, and the supernatant retained as the unloaded protein sample. Particles were then washed by suspending them in 100 μL of 10 mg mL−1 competitor protein solution in physiological buffer and incubating for 1 h at room temperature on a shaker. Particles were then separated using centrifugation and the supernatant was retained as first wash sample. This washing step was repeated multiple times (7–10), retaining each wash solution for further analysis.
000g, 20 min). After washing, IONPs were resuspended in 100 μl physiological buffer containing 1 μg guest protein. The solution was then incubated on a shaker at 45 °C for 15 min to agitate and suspend nanoparticles following precipitation at a temperature above polymer LCST (45 °C). IONPs were then incubated on a shaker at room temperature for 2 h. Particles were then separated using centrifugation, and the supernatant retained as the unloaded protein sample. Particles were then washed by suspending them in 100 μL of 10 mg mL−1 competitor protein solution in physiological buffer and incubating for 1 h at room temperature on a shaker. Particles were then separated using centrifugation and the supernatant was retained as first wash sample. This washing step was repeated multiple times (7–10), retaining each wash solution for further analysis.
4.10. Protein release assays
0.5 mg of protein-loaded, PNIPMAM coated IONPs were subjected to changes in temperature with or without magnetic heating. Experiments were conducted in 100 μL solutions of 10 mg mL−1 competitor protein in physiological buffer. To study triggered protein release above polymer LCST without magnetic heating, IONPs were resuspended in the competitor protein solution and incubated at 45 °C for 1 h. Between sampling time points IONPs were regularly agitated and at each sampling time point IONPs were magnetically separated before removing 10 μL of the sample volume for analysis. For magnetic heating experiment, pulsed AMF (10 s on–30 s off cycles) was used. 15 μl samples were collected and centrifuged to remove IONPs before collecting 10 μl supernatant for analysis.4.11. Sample preparation for protein analysis
Following collection, protein samples were made up to 15 μL in SDS-PAGE sample buffer (5% (v/v) glycerol, 50 mM Tris-HCl pH 6.8, 50 mM dithiothreitol (DTT), 1% (w/v) sodium dodecyl sulfate (SDS), 0.7 mM Bromophenol Blue) and boiled at 97 °C for 5 min.4.12. SDS-PAGE
SDS-PAGE gels were prepared according to the conditions reported in section S12.† For a separating gel composed of 10% (w/v) acrylamide, 375 mM pH 8.8 tris buffer, 0.05% (w/v) ammonium persulfate (APS) and 0.067% (w/v) N,N,N′,N′-tetramethylethylenediamine (TEMED), and a stacking gel containing 4% (w/v) acrylamide, 125 mM Tris pH 6.8, 0.1% (w/v) APS, 0.1% (w/v) TEMED. Samples were loaded into wells alongside 5 μL of a pre-stained protein ladder (Precision Plus All-Blue, Bio-Rad). Gels were placed in gel tanks and immersed in running buffer (25 mM Tris, 250 mM glycine, 0.1% (w/v) SDS) before running at 100 V constant voltage for 10 min and then at 150 V constant voltage until the dye had reached the bottom of the gel.4.13. Coomassie staining
Fairbanks Coomassie staining43 was carried out by heating gels in Fairbanks solution A (25% (v/v) isopropanol, 10% (v/v) acetic acid, 0.05% (w/v) Coomassie Brilliant Blue) to boiling before incubation for 5 min then washing with dH2O. The heating and washing process was repeated with Fairbanks solution B (10% (v/v) isopropanol, 10% (v/v) acetic acid, 0.005% (w/v) Coomassie Brilliant Blue), Fairbanks solution C (10% (v/v) acetic acid, 0.002% (w/v) Coomassie Brilliant Blue) and Fairbanks solution D (10% (v/v) acetic acid). Gels were left in solution D until the background was completely destained. Quantification was carried out using ImageJ software after scanning the gels.4.14. Western blotting
Western blotting was conducted by semi-dry transfer of gels onto PVDF membranes (Thermo Fisher) for 70 min at 0.3A using 48 mM Tris-HCl, 39 mM glycine, 20% (v/v) MeOH and 0.0375% (w/v) SDS as the transfer buffer. After membrane transfer, different blocking procedures were used for TRF and IgG. For TRF, membranes were blocked using phosphate buffered saline (PBS) with 0.05% (v/v) Tween-20 (PBST) and 5% (w/v) dried fat free milk powder (PBSTM) for 1 h at room temperature. Membranes were then incubated with primary antibody: anti-TRF (1![[thin space (1/6-em)]](https://www.rsc.org/images/entities/char_2009.gif) :
:![[thin space (1/6-em)]](https://www.rsc.org/images/entities/char_2009.gif) 500, Dako) in PBSTM solution overnight at 4 °C. Following six 10 min washes at room temperature in PBSTM solution, goat anti rabbit-horseradish peroxidase (1
500, Dako) in PBSTM solution overnight at 4 °C. Following six 10 min washes at room temperature in PBSTM solution, goat anti rabbit-horseradish peroxidase (1![[thin space (1/6-em)]](https://www.rsc.org/images/entities/char_2009.gif) :
:![[thin space (1/6-em)]](https://www.rsc.org/images/entities/char_2009.gif) 1000, Bio-Rad) secondary antibody in PBSTM solution was added for 1 h at room temperature. The blot was then washed 3 times with PBSTM solution (5 min each) and 3 times in PBST for 10 min each at room temperature. For IgG, membranes were blocked in tris-buffered saline (TBS) with 0.05% (v/v) Tween-20 (TBST) and Roche blocking solution (1
1000, Bio-Rad) secondary antibody in PBSTM solution was added for 1 h at room temperature. The blot was then washed 3 times with PBSTM solution (5 min each) and 3 times in PBST for 10 min each at room temperature. For IgG, membranes were blocked in tris-buffered saline (TBS) with 0.05% (v/v) Tween-20 (TBST) and Roche blocking solution (1![[thin space (1/6-em)]](https://www.rsc.org/images/entities/char_2009.gif) :
:![[thin space (1/6-em)]](https://www.rsc.org/images/entities/char_2009.gif) 10) for 1 h at room temperature. Membranes were then incubated with goat anti bovine IgG-horseradish peroxidase (1
10) for 1 h at room temperature. Membranes were then incubated with goat anti bovine IgG-horseradish peroxidase (1![[thin space (1/6-em)]](https://www.rsc.org/images/entities/char_2009.gif) :
:![[thin space (1/6-em)]](https://www.rsc.org/images/entities/char_2009.gif) 250) for 1 h followed by three 5 min washings with blocking solution followed by three 10 min TBST washings. Blots were imaged on an Invitrogen iBright imaging system after application of Immobilon horseradish peroxidase (HRP) substrate (Millipore). Quantification was carried out using ImageJ software.
250) for 1 h followed by three 5 min washings with blocking solution followed by three 10 min TBST washings. Blots were imaged on an Invitrogen iBright imaging system after application of Immobilon horseradish peroxidase (HRP) substrate (Millipore). Quantification was carried out using ImageJ software.
Conflicts of interest
There are no conflicts to declare.Acknowledgements
The authors acknowledge the University of York and Wild fund for funding this project. Dr I. Will (University of York) is gratefully acknowledged for supporting magnetic heating experiments.References
- J. Zhang and R. D. K. Misra, Acta Biomater., 2007, 3, 838–850 CrossRef CAS PubMed.
- R. K. Dani, C. Schumann, O. Taratula and O. Taratula, AAPS PharmSciTech, 2014, 15, 963–972 CrossRef CAS PubMed.
- T. Hoare, J. Santamaria, G. F. Goya, S. Irusta, D. Lin, S. Lau, R. Padera, R. Langer and D. S. Kohane, Nano Lett., 2009, 10, 3651–3657 CrossRef PubMed.
- J. Rathfon and G. Tew, Polymer, 2008, 49, 1761–1769 CrossRef CAS.
- R. Shunmugam and N. G. Tew, Polymer, 2005, 43, 5831–5843 CAS.
- M. Giannaccini, M. P. Calatayud, A. Poggetti, S. Corbianco, M. Novelli, M. Paoli, P. Battistini, M. Castagna, L. Dente, P. Parchi, M. Lisanti, G. Cavallini, C. Junquera, G. Goya and V. Raffa, Adv. Healthcare Mater., 2017, 6, 1601429 CrossRef PubMed.
- D. Maity, S. N. Kale, K. R. Ghanekar, M. J. Xue and J. Ding, J. Magn. Magn. Mater., 2009, 321, 3093–3098 CrossRef CAS.
- M. Walker, I. Will, A. Pratt, V. Chechik, P. Genever and D. Ungar, ACS Appl. Nano Mater., 2020, 3, 5008–5013 CrossRef CAS PubMed.
- R. T. A. Mayadunne, E. Rizzardo, J. Chiefari, J. Krstina, G. Moad, A. Postma and S. H. Thang, Macromolecules, 2000, 33, 243–245 CrossRef CAS.
- J. V. John, C. W. Chung, R. P. Johnson, Y. I. Jeong, K. D. Chung, D. H. Kang, H. Suh, H. Chen and I. Kim, Biomacromolecules, 2016, 17, 20–31 CrossRef CAS PubMed.
- S. Kurzhals, R. Zirbs and E. Reimhult, ACS Appl. Mater. Interfaces, 2015, 7, 19342–19352 CrossRef CAS PubMed.
- J. S. Kim, T. G. Kim, W. H. Kong, T. G. Parka and Y. S. Nam, Chem. Commun., 2012, 48, 9227–9229 RSC.
- M. Arslan, T. N. Gevrek, J. Lyskawa, S. Szunerits, R. Boukherroub, R. Sanyal, P. Woisel and A. Sanyal, Macromolecules, 2014, 47, 5124–5134 CrossRef CAS.
- K. Skrabania, A. Miasnikova, A. M. B. Koumba, D. Zehm and A. Laschewsky, Polym. Chem., 2011, 2, 2074–2083 RSC.
- C. Boutris, E. G. Chatzi and C. Kiparissides, Polymer, 1998, 38, 2567–2570 CrossRef.
- F. Afroze, E. Nies and H. Berghmans, J. Mol. Struct., 2000, 554, 55–68 CrossRef CAS.
- K. Otake, H. Inomata, M. Konno and S. Saito, Macromolecules, 1990, 23, 283–289 CrossRef CAS.
- H. G. Schild and D. A. Tirrell, J. Phys. Chem., 1990, 94, 4352–4356 CrossRef CAS.
- J. Mohapatra, Z. Fanhao, K. Elkins, M. Xing, M. Ghimire, S. Yoon, S. R. Mishra and J. P. Liu, Phys. Chem. Chem. Phys., 2018, 20, 12879–12887 RSC.
- S. Tong, C. A. Quinto, L. Zhang, P. Mohindra and G. Bao, ACS Nano, 2017, 11, 6808–6816 CrossRef CAS PubMed.
- D. Kim, N. Lee, M. Park, B. H. Kim, K. An and T. Hyeon, J. Am. Chem. Soc., 2009, 131, 454–455 CrossRef CAS PubMed.
- P. Guardia, R. D. Corato, L. Lartigue, C. Wilhelm, A. Espinosa, M. G. Hernandez, F. Gazeau, L. Manna and T. Pellegrino, ACS Nano, 2012, 6, 3080–3091 CrossRef CAS PubMed.
- W. J. Atkinson, I. A. Brezovich and D. P. Chakraborty, IEEE Trans. Biomed. Eng., 1984, 31, 70–75 CAS.
- R. Hergt and S. Dutz, J. Magn. Magn. Mater., 2007, 311, 187–192 CrossRef CAS.
- U. Gneveckow, A. Jordan, R. Scholz, V. Brüss, N. Waldöfner, J. Ricke, A. Feussner, B. Hildebrandt, B. Rau and P. Wust, Med. Phys., 2004, 31, 1444–1451 CrossRef PubMed.
- H. Mok and M. Zhang, Expert Opin. Drug Delivery, 2013, 10, 73–87 CrossRef CAS PubMed.
- P. M. Price, W. E. Mahmoud, A. A. Al-Ghamdi and L. M. Bronstein, Front. Chem., 2018, 11, 1–7 Search PubMed.
- R. K. Dani, C. Schumann, O. Taratula and O. Taratula, AAPS PharmSciTech, 2014, 15, 963–972 CrossRef CAS PubMed.
- N. Pandey, J. U. Menon, M. Takahashi, J. T. Hsieh, J. Yang, K. T. Nguyen and A. S. Wadajkar, Nanotheranostics, 2020, 4, 1–13 CrossRef PubMed.
- M. A. C. Stuart, W. T. S. Huck, J. Genzer, M. Müller, C. Ober, M. Stamm, G. B. Sukhorukov, I. Szleifer, V. V. Tsukruk, M. Urban, F. Winnik, S. Zauscher, I. Luzinov and S. Minko, Nat. Mater., 2010, 9, 101–113 CrossRef PubMed.
- D. Chakraborty, K. R. Ethiraj and A. Mukherjee, RSC Adv., 2020, 10, 27161–27172 RSC.
- W. J. Jeong, J. Yu and W. J. Song, Chem. Commun., 2020, 56, 9586–9599 RSC.
- N. Zhang, X. Shen, K. Liu, Z. Nie and E. Kumacheva, Acc. Chem. Res., 2022, 55, 1503–1513 CrossRef CAS PubMed.
- M. A. Firestone, S. C. Hayden and D. L. Huber, MRS Bull., 2015, 40, 760–767 CrossRef CAS.
- M. Ardejani, L. Noodleman, E. Powers and J. Kelly, Nat. Chem., 2021, 13, 480–487 CrossRef CAS PubMed.
- Z. Ghanbari, M. R. Housaindokht, M. R. Bozorgmehr and M. Izadyar, J. Theor. Biol., 2016, 404, 73–81 CrossRef CAS PubMed.
- K. Meng, C. Yao, Q. Ma, Z. Xue, Y. Du, W. Liu and D. Yang, Adv. Sci., 2019, 6, 1802112 CrossRef PubMed.
- J. Prien, D. Ashline, A. Lapadula, H. Zhang and V. Reinhold, J. Am. Soc. Mass Spectrom., 2009, 20, 539–556 CrossRef CAS PubMed.
- L. Lang, R. Couso and S. Kor, J. Biol. Chem., 1986, 261, 6320–6325 CrossRef CAS PubMed.
- M. Leeman, J. Choi, S. Hansson, M. U. Storm and L. Nilsson, Anal. Bioanal. Chem., 2018, 410, 4867–4873 CrossRef CAS PubMed.
- H. Khurshid, J. Alonso, Z. Nemati, M. H. Phan, P. Mukherjee, M. L. F. Gubieda, J. M. Barandiar and H. Srikanth, J. Appl. Phys., 2015, 117, 17A3371–17A3374 CrossRef.
- H. C. Joao, I. G. Scragg and R. A. Dwek, FEBS Lett., 1992, 307, 343–346 CrossRef CAS PubMed.
- G. Fairbanks, T. L. Steck and D. F. Wallach, Biochemistry, 1971, 10, 2606–2617 CrossRef CAS PubMed.
- S. Boune, P. Hu, A. L. Epstein and L. A. Khawli, Antibodies, 2020, 9, 1–20 CrossRef PubMed.
- M. Leeman, J. Choi, S. Hansson, M. U. Storm and L. Nilsson, Anal. Bioanal. Chem., 2018, 410, 4867–4873 CrossRef CAS PubMed.
Footnote |
| † Electronic supplementary information (ESI) available. See DOI: https://doi.org/10.1039/d3nr04544g |
| This journal is © The Royal Society of Chemistry 2024 |

