 Open Access Article
Fabrication and preliminary testing of patterned silver cathodes for proton conducting IT-SOFCs†
Md Shariful Islam
Sozal
 a,
Wenhao
Li
a,
Suprabha
Das
a,
Borzooye
Jafarizadeh
a,
Azmal Huda
Chowdhury
a,
Chunlei
Wang
b and
Zhe
Cheng
*a
a,
Wenhao
Li
a,
Suprabha
Das
a,
Borzooye
Jafarizadeh
a,
Azmal Huda
Chowdhury
a,
Chunlei
Wang
b and
Zhe
Cheng
*a
aDepartment of Mechanical and Materials Engineering, Florida International University, Miami, FL 33174, USA. E-mail: zhcheng@fiu.edu
bDepartment of Mechanical and Aerospace Engineering, University of Miami, Miami, FL 33146, USA
First published on 9th January 2024
Abstract
Dense silver (Ag) cathodes with defined triple phase boundary (TPB between the interface of electrolyte, electrode, and gas) lengths (LTPB) and electrode areas (AELT) were fabricated by photolithography and E-beam evaporation over a proton conducting BaZr0.4Ce0.4Y0.1Yb0.1O3−δ (BZCYYb4411) electrolyte. A bi-layer lift-off resist method appears to be more versatile than a single layer lift-off resist method for successful patterned cathode fabrication. The electrochemical behaviors of the patterned Ag cathodes over the BZCYYb4411 electrolyte were tested by electrochemical impedance spectroscopy (EIS) at different temperatures in atmospheres with different concentrations of O2 and H2O. The results were processed using Distribution of Relaxation Times (DRT) and reaction order analyses and also fitted to equivalent circuits. The directions for future work on patterned electrodes with different LTPB and AELT and theoretical calculations to gain further insights into the kinetics and mechanism of the cathode oxygen reduction reaction (ORR) over proton conducting electrolytes are pointed out.
Introduction
Solid oxide fuel cells (SOFCs) have been extensively researched for a variety of applications including portable or stationary power generation and transportation.1–5 The commercialization of conventional SOFCs faces a notable obstacle due to the required high operating temperature – typically ∼700–1000 °C. The high operating temperature results in prolonged start-up time and difficulties in ensuring the compatibility and durability of the materials used in the system, leading to a higher than ideal degradation rate.5,6 To address this challenge, extensive research is currently being conducted on intermediate temperature (400–600 °C) solid oxide fuel cells (IT-SOFCs), especially proton conducting (PC) IT SOFCs due to the high ionic conductivities of proton conducting ceramic (PCC) electrolytes at intermediate temperatures.7–11However, when the operating temperature drops, the oxygen reduction reaction (ORR) at the cathode becomes more critical to the efficient functioning of SOFCs. This is due to sluggish ORR kinetics at intermediate temperatures. The cathode reaction processes for oxygen ion conducting SOFCs and proton conducting SOFCs follow different pathways. The cathode ORR process for conventional SOFCs based on oxygen ion (i.e., O2− or  ) conducting electrolytes would proceed via the pathway of oxygen vacancies.12,13
 | (1) |
The ORR for oxygen ion conducting SOFCs includes elementary steps such as oxygen adsorption, oxygen dissociation, charge transfer, and mass transfer of oxide ions into the bulk of the electrolyte.12,13 The mechanism of the ORR via the oxygen vacancy pathway has been extensively studied using various approaches, including the use of cells with patterned electrodes over oxygen ion conducting electrolytes. In comparison, the cathode ORR process for proton conducting SOFCs would proceed via a different pathway, as described below:12,13
| O2 + 4e′ + 4(OH)o ↔ 4O×o + 2H2O, | (2) |
 ) and water). The ORR of proton conducting SOFCs involves even more elementary steps including oxygen adsorption, oxygen dissociation, surface diffusion, charge transfer, mass transfer of protons into the bulk of the electrolyte, and water formation and desorption.12–15 A previous study conducted by He et al. analysed the reaction order of the ORR of proton conducting SOFCs (i.e., dependence of the reaction rate on atmospheres such as pO2 and pH2O) by hypothesizing eight elemental steps,14 while the study conducted by Grimaud et al. assumed 6 elemental steps.15 However, despite numerous studies, there are still aspects of the ORR mechanism of proton conducting SOFCs that remain uncertain.
On the other hand, a classical approach for understanding electrode reactions, including the ORR, was offered by dense patterned electrodes as mentioned.16–29 The utilization of patterned electrodes enables precise control of both the length of the triple phase boundary (TPB) and the area of the electrode, linking electrode geometry with reaction kinetics. Significant research has been carried out on the electrode reaction mechanism in conventional oxygen ion conducting SOFCs utilizing patterned electrodes made of noble metals such as platinum (Pt) or silver (Ag).16,19–21,23,26–28 Previous studies showed that for Pt, ORR kinetics was correlated with the length of the TPB.20,23,27,28 In contrast, Ag is less expensive and has a higher electronic conductivity than Pt. One study showed that an SOFC with a patterned Ag cathode exhibited comparable performance to that with the Pt cathode with an identical design.21 Another study showed that the rate-limiting step of the Ag cathode reaction for oxygen ion conducting SOFCs is the bulk diffusion through the Ag electrode at 70–900 °C.16 A subsequent study reported that at 350–550 °C, dissociative oxygen adsorption/reduction might be the rate limiting steps of the Ag cathode reaction for oxygen ion conducting SOFCs.30
However, for proton conducting IT-SOFCs, despite their recent development, there is no study carried out utilizing the patterned electrode approach except for the study conducted by Haile et al.31 who used PrBa0.5Sr0.5Co1.5Fe0.5O5+δ, a PBSCF mixed conducting cathode. It is expected that a simpler patterned Ag electrode over a proton conducting electrolyte will be very valuable to help identify the reaction site (i.e., at the TPB or cathode surface) and clarify if the proton conducting ceramic electrolyte plays any electro-catalytic role in the ORR reaction. Therefore, this study aims to fabricate patterned Ag cathodes on a proton conductive BaZr0.4Ce0.4Y0.1Yb0.1O3−δ (BZCYYb4411) electrolyte. Preliminary testing of the patterned electrode cells has been carried out showing the effects of moisture (H2O) and oxygen (O2) concentration on measured electrochemical behaviors. The implications of the preliminary study and the directions for subsequent research have also been discussed.
Experimental
Powder synthesis, sintering, and polishing
In this study, BZCYYb4411 proton conducting ceramic electrolyte and PrNi0.5Co0.5O3−δ (PNC, as the counter electrode) powders were synthesized using the Pechini method,32 and the details have been described previously.32 To fabricate the proton conducting electrolyte pellet, 0.4 g of BZCYYb4411 powder containing 0.5 wt% NiO as a sintering aid was pressed using a 13 mm die with a pressure of ∼300 MPa. The green pellet was sintered at 1550 °C for 10 h in air under protective conditions, as previously described.32 Subsequently, BZCYYb4411 pellets were subjected to grinding on both surfaces using silicon carbide abrasive papers of varying grit numbers from 600 to 1200. Finally, the samples underwent a polishing procedure using diamond suspensions of 1, 0.1, and 0.05 μm in succession. The thickness of the polished BZCYYb4411 pellet is ∼0.5 mm.Photolithography for fabrication of patterned Ag electrodes
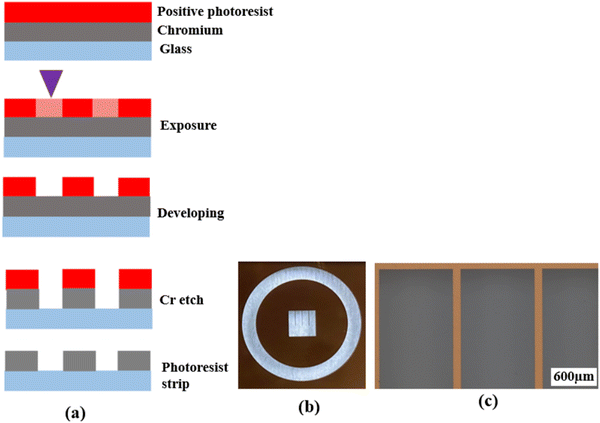
Photolithography is a microfabrication technique that uses a photomask to transfer a pre-defined pattern onto a substrate surface through a series of steps. It is widely used in integrated circuit (IC) and sensor fabrication. In the past two decades, photolithography was also used in the fabrication of patterned electrodes for oxygen ion-conducting SOFCs.16,18,19,22–25,27–29,33–36 However, most previous studies did not provide adequate details of the fabrication process, making the reproduction and further fine-tuning of the patterned electrode difficult. Meanwhile, as stated, there have been no studies on the fabrication of patterned electrodes over proton conducting electrolytes except for the study conducted by Haile et al.31 Therefore, a comprehensive description of the techniques and procedures used for the fabrication of patterned Ag electrodes over the BZCYYb4411 electrolyte is given below in detail.First, a blank photomask was purchased from Nano film and it consisted of three layers: a top surface layer of a positive photoresist, followed by a layer of chromium and a glass substrate, which is transparent to UV light. The desired pattern for the mask was designed using the LayoutEditor software (free version, 20230301) and subsequently transferred onto the mask by exposing the photoresist layer using a laser mask writer (μPG 101, a wavelength of 405 nm), as illustrated in Fig. 1(a). The laser power used for exposure was 4.8 mW. Following the exposure, the mask was developed using a developer solution (AZ400K (15% potassium borate/85% water)![[thin space (1/6-em)]](https://www.rsc.org/images/entities/char_2009.gif) :
:![[thin space (1/6-em)]](https://www.rsc.org/images/entities/char_2009.gif) water = 1
water = 1![[thin space (1/6-em)]](https://www.rsc.org/images/entities/char_2009.gif) :
:![[thin space (1/6-em)]](https://www.rsc.org/images/entities/char_2009.gif) 4 by volume) to remove the laser-exposed positive photoresist, which resulted in openings in the photoresist layer exposing the chromium layer according to the designed pattern. The exposed chromium was subsequently etched away by immersing the mask in Chromium Etch 1020 AC (containing nitric acid, ceric ammonium nitrate, water; exact concentration is unknown as this is a commercial product) for 3 min, and the pattern was transferred onto the glass. Finally, the remaining photoresist was removed through reactive ion etching by oxygen plasma, thus completing the fabrication of the mask as shown in Fig. 1.
4 by volume) to remove the laser-exposed positive photoresist, which resulted in openings in the photoresist layer exposing the chromium layer according to the designed pattern. The exposed chromium was subsequently etched away by immersing the mask in Chromium Etch 1020 AC (containing nitric acid, ceric ammonium nitrate, water; exact concentration is unknown as this is a commercial product) for 3 min, and the pattern was transferred onto the glass. Finally, the remaining photoresist was removed through reactive ion etching by oxygen plasma, thus completing the fabrication of the mask as shown in Fig. 1.
After the photomask is patterned, the subsequent step involves transferring the pattern onto the substrate coated with a photoresist layer. The photoresist comes in two forms, positive or negative. A positive photoresist, upon UV light exposure, undergoes molecular chain breakage and becomes more soluble in the developer solution.35,37 As a result, after development, the regions exposed to UV light undergo material removal/dissolution, leaving the unexposed regions intact and insoluble in the developer solution. In comparison, a negative photoresist, upon UV light exposure, experiences polymerization and becomes insoluble in the developer solution. Thus, after development, the regions exposed to UV light remain on the substrate.35,37 Due to the disparity in light dosage between the top and bottom layers, with the top layer experiencing a higher dose, positive photoresists tend to produce overcut profiles (i.e., the opening at the photoresist top surface is wider than at the bottom or near the substrate), while negative photoresists tend to produce undercut profiles (i.e., the opening at the photoresist top surface is narrower than at the bottom or near the substrate),38,39 after the development process, as depicted in Fig. 2(a) and (b).
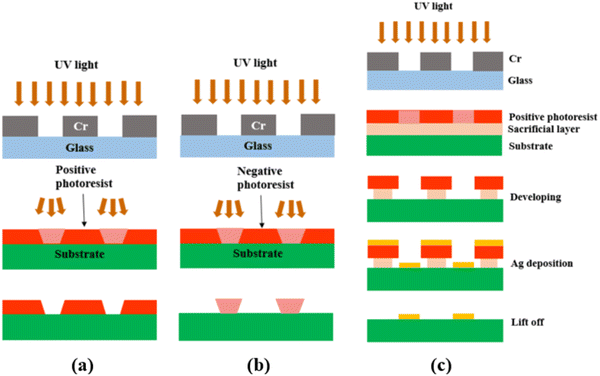 | ||
| Fig. 2 Schematic showing (a) the overcut profile formed in a positive photoresist, with wider opening at the photoresist top surface than at the bottom or near the substrate,39 (b) the undercut profile formed in a negative photoresist, with narrower opening at the photoresist top surface than at the bottom or near the substrate,39 and (c) the photolithography process using a bilayer resist system. | ||
Because of the difference in the sidewall profile, the lift-off process (i.e., the removal of the residual photoresist after metal deposition) is easier when using a negative photoresist than when using a positive photoresist, as the negative photoresist prevents the metal from accumulating on the walls of the resist after deposition.39 However, a negative photoresist often has lower resolution compared to a positive photoresist. This is because for the negative photoresist, the developer solution tends to infiltrate both the UV-exposed and unexposed areas, which results in reduced resolution or pattern distortion.40–42 On the contrary, a positive photoresist is capable of maintaining its high-resolution pattern unless it is overdeveloped (by being left in the developer solution longer than necessary). Therefore, in this study, a positive photoresist was chosen.
To achieve effective lift-off in photolithography with a positive photoresist, the use of a bilayer resist system composed of a bottom sacrificial layer and a top imaging photoresist layer was found to be crucial in this study.35,43 Although the sacrificial layer lacks photo-reactivity, it creates undercut during development due to its higher dissolution rate than the top imaging photoresist layer. This enables the successful removal of the resists after Ag electrode deposition, as demonstrated in Fig. 2(c). Without this bilayer approach, the lift-off process is challenging due to accumulation of the metal on the walls of the resist after deposition. Therefore, in this study, patterned Ag electrodes were fabricated over BZCYYb4411 electrolyte substrates using photolithography with a bilayer resist system.
Prior to the photolithography process, polished BZCYYb4411 substrates underwent cleaning with IPA, acetone, and DI water, followed by a dehydration bake at 170 °C for 10 min to improve the adhesion of the resist with the substrate. LOR 3B, a sacrificial layer, was spin-coated onto the cleaned substrates using the following parameters: 500 rpm for 10 s, 1000 rpm for 10 s, 1500 rpm for 10 s, and 2000 rpm for 120 s. Subsequently, the sacrificial layer underwent a soft bake process at 141 °C for 90 s to eliminate the solvent and improve its adhesion to the substrate. Then, AZ1518, a positive photoresist, was spin-coated over the LOR 3B sacrificial layer on the BZCYYb4411 substrate, using the same spinning parameters. Afterward, the photoresist underwent a soft bake process at 110 °C for 90 s to eliminate solvents and improve its adhesion to the sacrificial layer. Subsequently, the substrates were exposed to UV light of 150 mJ cm−2 to form the pattern. The photoresist was developed in AZ400K developer solution to form the pattern in the photoresist layer (as well as the bottom sacrificial layer, with undercut) over the electrolyte (see Fig. 3 for photos), which was necessary for subsequent Ag electrode deposition.
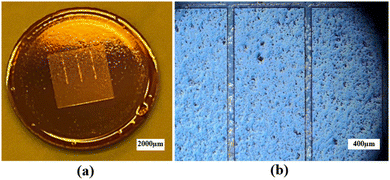 | ||
| Fig. 3 (a) Photograph and (b) optical microscopic image of the BZCYYb4411 electrolyte substrate covered by a patterned photoresist after development. | ||
In microfabrication, metals are deposited commonly by two techniques: E-beam evaporation and sputtering. In E-beam evaporation, metal deposition is unidirectional as the mean free path of metal atoms is longer than the distance between the substrate and the target due to high vacuum (∼10−7 Torr).35,37,39 This results in minimal sidewall deposition and effective lift-off. In sputtering, the lower vacuum (∼10−3 Torr) causes a shorter mean free path, leading to non-unidirectional deposition with more sidewall coverage and challenges in lift-off.35,37,39 In this study, an ∼75 nm thick Ag layer was deposited onto the BZCYYb4411 substrates by E-beam evaporation (base pressure: 5 × 10⁻⁶ Torr, soak-1 power: 12%, rise-1 time: 5 min, soak-1 time: 30 s; soak-2 power: 14%, rise-2 time: 10 s, and soak-2 time: 30 s). Finally, the lift-off of the remaining photoresist was carried out using Remover PG (N-methyl pyrrolidone) at ∼70 °C. Microstructural analysis and the EDS line scan of the patterned Ag electrodes over the BZCYYb441 electrolyte substrate were done using a scanning electron microscope (SEM JEOL JSM-F100) equipped with an energy dispersive X-ray spectrometer (EDS).
Electrochemical cell fabrication and test
In this study, electrochemical cells with patterned Ag working electrodes were fabricated using PNC as the counter electrode. To fabricate cells, fritless Ag paste was first brush painted on the contact pad of the patterned Ag electrode over the BZCYYb4411 electrolyte and dried. PNC slurry was then brushed onto the opposite side of the electrolyte, as previously discussed, to form the PNC counter electrode, followed by the application of Ag paste over the PNC electrode for current collection.32 The cell then underwent heat treatment at 600 °C for 2 h in simulated air (ultra-zero grade, Airgas, <5 ppm H2O and CO2 by volume).Following the heat treatment at 600 °C for 2 h, electrochemical impedance spectroscopy (EIS) tests were conducted using a potentiostat (Gamry Interface 1000) without any DC bias in a frequency range of 106 to 10−2 Hz at 400 to 600 °C. The AC amplitude used was 0.1 mA. The effect of oxygen partial pressure was tested by varying the flow rate of pure O2versus pure N2 using mass flow controllers to achieve pO2 values of 0.1, 0.2, 0.5, and 1 atm, while the effect of H2O was tested by passing the simulated air through a water bubbler at room temperature and 66 °C to achieve pH2O values of ∼0.03 and ∼0.26 atm, respectively. Each time the atmosphere was changed, and there was a typical delay of 2.5 h before the electrochemical measurements could be taken. (Such a delay was based on our previous experiments, which showed that the impedance stabilized after a similar time. On the other hand, from the gas flow point of view, this delay was also reasonable because the total flow rate was maintained at 40 cc min−1. Over 2.5 h, the total flow volume is 6000 cc, which is much larger than the test chamber volume of ∼100 cc (2.5 cm ID, 20 cm long).)
Results and discussion
Fabricated patterned electrode cell
Fig. 4(a) and (b) show the LayoutEditor design and a photograph, respectively, of a patterned Ag electrode fabricated over the BZCYYb4411 proton conducting electrolyte. The pattern has 4 long fingers and a wide busbar for current collection. The designed TPB length (LTPB) and the electrode area (AELT) were 30.4 mm and 15.3 mm2, respectively. Fig. 4(c) and (d) show the corresponding SEM micrograph and EDS line scan, respectively, of such a sample. The silver electrode is reasonably dense considering its thickness of only ∼75 nm.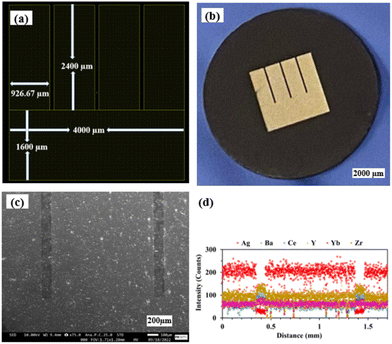 | ||
| Fig. 4 (a) The LayoutEditor design, (b) photograph, (c) SEM micrograph, and (d) EDS line scan of the patterned Ag electrode over the BZCYYb4411 electrolyte substrate. | ||
Preliminary electrochemical test of a patterned Ag electrode cell
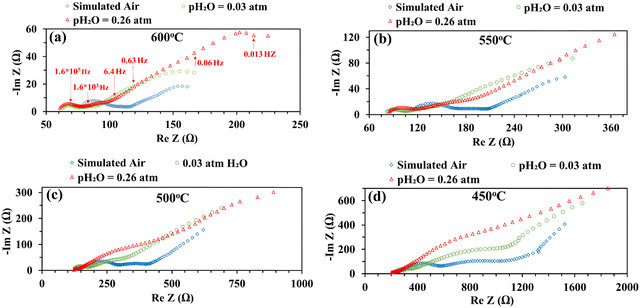
Fig. 5 shows the impedance spectra of a patterned silver electrode cell with the PNC counter electrode in simulated air (<5 ppm H2O and CO2 by volume, according to Airgas) as well as humidified air with pH2O values of 0.03 and 0.26 atm at 600–450 °C. A previous study conducted by the authors32 has shown that a porous PNC cathode over the same proton conducting electrolyte has a much lower interfacial resistance (about one tenth), which, as a first approximation, allows us to neglect the contribution of the PNC counter electrode in the current patterned Ag electrode cell.On the other hand, in comparison with simulated air, the addition of 0.03 atm H2O resulted in the reduction of ohmic resistance (RO, the high frequency intercept in the impedance spectra), indicating higher bulk conductivity, particularly at temperatures of 600 and 550 °C. This is attributed to the hydration of the BZCYYb4411 electrolyte and formation of protons  from oxygen vacancies, leading to higher ionic conductivity.9,32 As pH2O further increased to 0.26 atm, there was almost no further change in RO, indicating the saturation of hydration at 0.03 atm.
The electrode interfacial process can roughly be separated into two parts: a high-frequency resistance corresponding to the high frequency (HF) loops (∼106 to 104 Hz) and a mid-to-low frequency (MF-LF) resistance corresponding to multiple, partially overlapping loops in the mid to low frequency (∼104 to 10−3 Hz) range. With the introduction of 0.03 atm moisture, the HF loops of the EIS decreased at all temperatures from 600 to 450 °C. With increase of pH2O to 0.26 atm, the HF loops decreased further, especially at a lower temperature of 500 °C or 450 °C. It is natural to expect that, in a simulated air atmosphere with very little moisture, the ORR would proceed via the oxygen vacancy pathway (eqn (1)), while after the introduction of moisture and full hydration of the proton-conducting electrolyte, the ORR would proceed via the proton pathway (eqn (2)). It is hypothesized that the charge transfer step, as often believed to be represented by the HF loops in the EIS, might be intrinsically faster for the proton route than the oxygen vacancy route. Such a hypothesis is consistent with earlier observations of depressed HF loops with increasing pH2O for the BSCF cathode over the proton conducting electrolyte.12
On the other hand, with the introduction of moisture, the total apparent electrode interfacial resistance, Rai (i.e., the direct difference between the high and low frequency intercepts on the impedance spectra) actually increased significantly, primarily due to the large expansion of the mid-to-low frequency MF–LF loops, and the increase was more significant when the moisture content was higher (0.26 atm. vs. 0.03 atm.). One possible explanation for such an observation is related to the reduced shorting effect based on the defect reaction involving electron holes (h˙) and protonic defects
 | (3) |
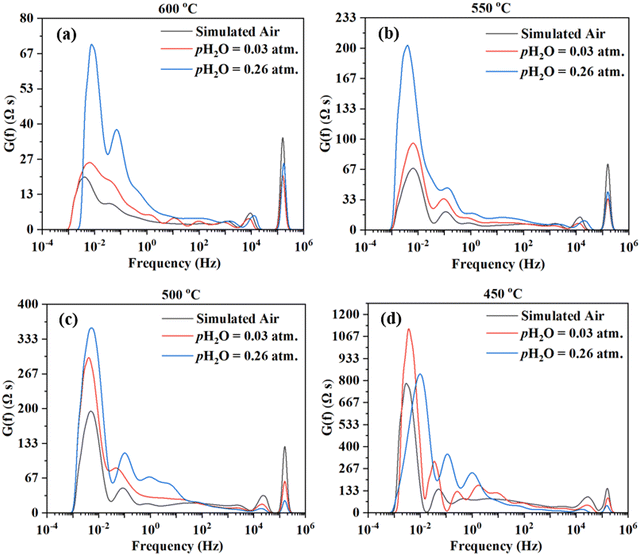
The impedance spectra are further analyzed using the Distribution of Relaxation Times (DRT) method,47–54 as shown in Fig. 6. Multiple peaks (7+) are observed across different frequency ranges. Consistent observation (i.e., multiple processes for the electrode reaction) is obtained by fitting the EIS data to the equivalent circuit using the ZView software. ESI,† Fig. S1 shows the fittings for the EIS plot at 550 °C in simulated air with water addition at pH2O = 0.03 atm, considering 4, 6, 7, and 8 RC circuits. It appears that 8 RC circuits provide the best fit, while 4 RC gives the worst fitting. ESI,† Fig. S3 shows the fittings for the EIS plot in simulated air with water addition at pH2O = 0.03 atm and at 600–450 °C. The fitted equivalent circuits turn out to contain 8–9 RC circuits in series. Such a number of RC elements seem to be high but still reasonable given the DRT plots in Fig. 6 showing 7+ peaks. The high number is also possible due to the complex nature of the 4-electron ORR process and the many elemental steps that may be involved, as suggested in earlier studies.14,15
On the other hand, there are still significant uncertainties in fittings. In addition, linking the elemental steps of the electrode reaction with the different peaks in DRT or the semi-circles in EIS is difficult due to the complex nature of the ORR process. In fact, with the limited information currently available, it is impossible at this stage. Therefore, both experiments and theoretical modeling are currently underway to deepen the understanding of the cathode ORR processes for proton conducting SOFCs.
Nevertheless, Fig. 7(a) shows electrode interfacial conductance, 1/Rai, normalized by the TPB length vs. inverse of temperature (i.e., 1/T) for the patterned Ag electrode over the BZCYYb4411 proton conducting electrolyte in simulated air and in air with pH2O values of 0.03 and 0.26 atm at 600–450 °C. For comparison, data from previous studies conducted by Herle et al.16 and Huang et al.30 on patterned Ag electrodes in air over a conventional oxygen ion conducting yttria-stabilized zirconia (YSZ) electrolyte are also plotted. Despite the many differences between the current study and the one conducted by Herle et al.,16i.e., silver pattern geometry, electrolyte type (BZCYYb4411 proton conducting electrolyte vs. YSZ oxygen ion conducting electrolyte), and testing temperature, the measured interfacial conductance (1/Rai) normalized by the TPB length appears to roughly follow the same trend for silver electrodes. In contrast, Huang et al.30 showed better activity of the patterned Ag electrode on YSZ from 550 °C down to 450 °C. Additionally, the activation energy determined in the current study is 0.93–0.98 eV, much lower than those proposed by Herle et al.16 (1.19 eV) and Huang et al.30 (1.65 eV) for patterned Ag electrodes over an oxygen ion conducting YSZ electrolyte. This suggests the potentially better activity of the patterned Ag electrode at a temperature below 450 °C over the proton conducting BZCYYb4411 electrolyte than the YSZ electrolyte. A further study is needed to verify this.
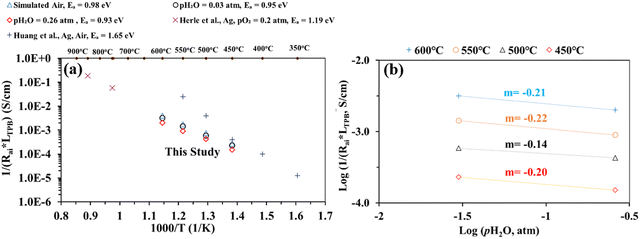 | ||
| Fig. 7 (a) Plot of inverse of Rai normalized by the TPB length versus inverse temperature for the patterned Ag electrode cell over the BZCYYb4411 proton conducting electrolyte in simulated air and in air with pH2O values of 0.03 and 0.26 atm at 600–450 °C. The results obtained from previous studies conducted by Herle et al.16 and Huang et al.30 on patterned Ag electrodes, all in air over the oxygen ion conducting yttria-stabilized zirconia (YSZ) electrolyte are also shown for comparison. (b) Inverse of Rai normalized by the TPB length vs. pH2O plot, both on the logarithmic scale, showing the fitted reaction order m with respect to pH2O for the patterned Ag cathode over the BZCYYb4411 electrolyte at 600–450 °C. | ||
To gain additional insights into the reaction process including possible rate limiting steps, reaction order analysis is often carried out.14,15,55–60 Such an analysis may provide information regarding the influence of different reactants' activity, such as the partial pressures of oxygen (pO2) and water vapor (pH2O), on the rate of the ORR. According to the literature, the overall reaction rate or the inverse of electrode apparent interfacial resistance depends on oxygen and water vapor pressure: 1/Rai ∝ (pO2)n·(pH2O)m, where n and m are the reaction orders of pO2 and pH2O, respectively. The cathode reaction involves several fundamental steps for proton conducting SOFCs: (1) oxygen adsorption, (2) oxygen dissociation, (3) charge transfer (multiple steps, actually), (4) water formation, and (5) desorption of water.14,15 By plotting 1/Rai against pO2 or pH2O (both on the logarithmic scale), the reaction order (the n or m value) might be obtained from the fitted slope of the plot. Fig. 7(b) shows plots of log(1/(Rai × LTPB)) vs. log (pH2O) for the patterned Ag cathode at different temperatures from 600 to 450 °C. The obtained reaction order with respect to pH2O, m, is −0.14 to −0.22. These values fall outside the range of m (0.5–1) modeled in previous studies. On the other hand, these values are very close to the value (−0.21) obtained for the La0.6Sr0.4Co0.2Fe0.8O3−δ (LSCF) cathode over the BaCe0.9Y0.1O3−δ (BCY10) proton conducting electrolyte at 600 °C.15 Whether such consistency is pure co-incidence given the difference in electrode and electrolyte materials or the two cells are indeed limited by the same fundamental process (e.g., the electronic leakage effect in the proton conducting electrolyte) needs to be studied in the future.
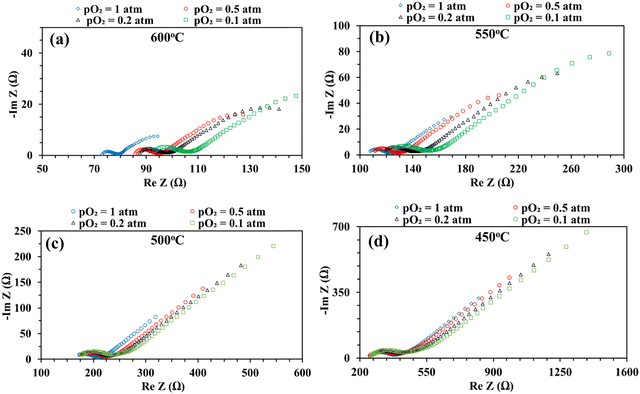
Fig. 8 shows the impedance spectra of the patterned Ag electrode cell at various pO2 (0.1, 0.2, 0.5, and 1 atm) at 600–450 °C. The bulk or ohmic resistance decreases with increasing temperature, which is expected for solid oxide fuel cells. The primary factor contributing to the observed drop in ohmic resistance with increasing temperature is the higher mobility of the charge carriers (oxygen vacancies or protons, if water is present) at higher temperature. It is also expected that the cell's ohmic resistance will be independent of the electrode's architecture, whether porous or dense, but should decrease with temperature. This was indeed observed in the current study: the area corrected ohmic resistance of the patterned Ag electrode cell matched very well with our earlier study using a porous electrode over the same BaZr0.4Ce0.4Y0.1Yb0.1O3–δ (BZCYYb4411) electrolyte.32
On the other hand, at 600 and 550 °C, ohmic resistance RO increased as pO2 decreased from 1 to 0.1 atm, which was attributed to the decrease in the electronic conduction (or leakage) of the BZCYYb4411 electrolyte resulting from a drop in pO2: based on the defect reaction involving oxygen vacancies and electron holes:
 | (4) |
Meanwhile, with reduced pO2, there is an increase in total apparent electrode interfacial resistance Rai. Such a behavior (increase of Rai with reduced pO2) is consistent with a porous Ag cathode symmetrical cell over the BaZr0.1Ce0.7Y0.1Yb0.1O3−δ (BZCYYb1711) proton conducting electrolyte13 and is expected to result from the slowdown of oxygen gas phase transport, surface adsorption, and dissociation with lower oxygen concentration. In addition, the reduced electronic leakage, due to shifting of reaction (4) to the right with lower pO2, especially at higher temperatures such as 600 and 550 °C, is also expected to contribute to the increase in Rai.62 Interestingly, at elevated temperatures such as 600 and 550 °C, there appears to be a continuation of the EIS loop at the low frequency end towards the real axis. The exact reason is not clear. One possibility is that the ORR elemental steps such as O2 dissociative adsorption may be much faster at these temperatures than those at a lower temperature (i.e., 450 °C). This might enable the presence of surface active species even under very low frequency conditions (near DC conditions) and the continuation of the EIS loop towards the real axis instead of the Warburg-like behavior seen at lower temperatures such as 450 °C.
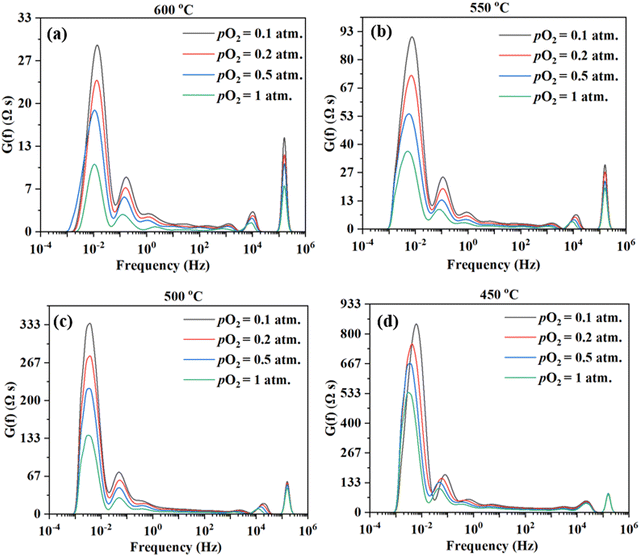
Fig. 9 shows the DRT curves of impedance spectra shown in Fig. 8. Similar to the testing in simulated air (see Fig. 6), multiple peaks (7+) are also observed across the frequency range. Like before, the ESI,† Fig. S2 shows the fittings for the EIS plot at 550 °C in a dry 20% O2–80% N2 mixture (i.e., pO2 = 0.2 atm.), considering 4, 5, 6, and 8 RC circuits. In this case, 6 RC circuits seem to be enough to give a reasonable fit, while the fitting with 4 RC gives unsatisfactory results. ESI,† Fig. S4 shows the fittings for the EIS plot in a dry 20% O2-80% N2 mixture (i.e., pO2 = 0.2 atm) at 600–450 °C. The fitted equivalent circuits turn out to contain 6–8 RC circuits in series. As explained before, such a high number of peaks are probably due to the complex nature of the 4-electron ORR process involving many elemental steps.
Fig. 10 shows the inverse of Rai normalized by the TPB length vs. pO2 plot, both on the logarithmic scale for the patterned Ag electrode cell over the BZCYYb4411 proton conducting electrolyte in this study at 600–450 °C in comparison to the dense Ag electrode reported by Herle et al. at 753 °C16 and by Huang et al.30 at 450 °C, all over the conventional YSZ electrolyte. For the current dense patterned Ag electrode over the proton conducting electrolyte, 1/Rai increases with increasing pO2 at all temperatures from 600 to 450 °C, with roughly the same slope, indicating the same rate-controlling mechanism. The fitted slope n is in the range of 0.39–0.47, which indicates that the ORR process on the Ag electrode over the BZCYYb4411 proton conducting electrolyte is likely controlled by both oxygen dissociation (n = 0.5) and charge transfer (n = 0.25), according to an earlier study conducted by Grimaud et al.15 A further study is needed to confirm this.
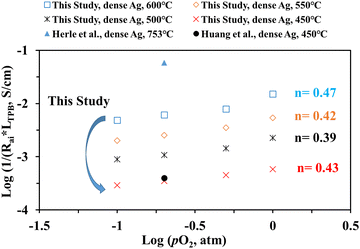 | ||
| Fig. 10 (a) Plot of log (1/(Rai × LTPB)) vs. log (pO2) for the dense patterned Ag electrode over the proton conducting BZCYYb4411 electrolyte in this study. Data for the dense patterned Ag electrode over the YSZ electrolyte reported by Herle et al.16 at 753 °C and Huang et al.30 at 450 °C are also shown for comparison. | ||
In addition to the studies discussed above, new experiments are currently underway involving the fabrication of dense patterned Ag electrodes with different TPB lengths and electrode contact areas to clarify the relationship between geometric parameters (e.g., LTPB) and electrode kinetics for the ORR over the proton conducting electrolyte. The reference electrode will also be added to the patterned electrode cell to get polarization curves. More systematic studies with respect to atmospheres and bias conditions will also be carried out. Additionally, patterned Ag electrodes with the same electrode geometry will be fabricated over both proton conducting and oxygen ion conducting electrolytes with comparable total ionic conductivities (e.g., BZCYYb4411 and GDC at ∼450 °C in simulated air). This will provide another way to examine the roles of proton conducting electrolytes in the critical ORR versus conventional oxygen conducting electrolytes. Last but not least, theoretical calculations using both the density functional theory (DFT) method and electrochemical modeling based on the finite element method (FEM) will be conducted to reveal the cathode ORR reaction mechanism, including all the elemental steps for proton conducting SOFCs.
Conclusion
In this study, patterned Ag cathodes were successfully fabricated on the BZCYYb4411 proton conducting electrolyte by photolithography and E-beam evaporation. Electrochemical cells with the fabricated patterned Ag working electrode and PNC counter electrode were tested by electrochemical impedance spectroscopy. The results for the Ag metal cathode over the proton conducting electrolyte, with the introduction of moisture into air, show that both ohmic resistance and EIS high frequency loops decrease, representing bulk hydration and a change in the reaction pathway from oxygen ions to protons, while the mid-to-low frequency loops increase, possibly due to either water adsorption blocking O2 adsorption/dissociation and diffusion to the TPB or reduced electronic leakage through the electrolyte. In addition, decreasing pO2 also appears to slow down the cathode process in a way similar to the moisture effect. The reaction order in terms of interfacial conductance is estimated to be in the range of −0.14 to −0.22 for moisture and 0.39 to 0.47 for oxygen. Analysis of the EIS data by both the DRT analysis and fitting to equivalent circuits suggests multiple elemental steps reflecting the complex nature of the cathode ORR reaction, especially when water and protons are involved. Future work, involving both experiments and theoretical calculations (e.g., by finite element electrochemical modeling and DFT calculations), will focus on revealing the effects of patterned electrode geometry on electrode kinetics and the fundamental mechanism (especially the pathway) of the ORR in proton conducting IT-SOFCs.Author contributions
Md Shariful Islam Sozal: methodology, investigation, data curation, writing – original draft; Wenhao Li: methodology; Suprabha Das: methodology; Borzooye Jafarizadeh: methodology; Azmal Huda Chowdhury: methodology; Chunlei Wang: methodology; and Zhe Cheng: conceptualization, funding, supervision, writing – reviewing and editing.Conflicts of interest
There are no conflicts to declare.Acknowledgements
This research is supported by the National Science Foundation (award no. DMR-1848305). The use of facilities at the FIU Advanced Materials Engineering Research Institute (AMERI) and Dr John T. Macdonald Foundation Biomedical Nanotechnology Institute (BioNIUM) Nanofabrication Facility of University of Miami is acknowledged. The Dissertation Acquisition Fellowship (DEA) from FIU is also acknowledged for its valuable support.References
- N. Q. Minh, Ceramic Fuel Cells, J. Am. Ceram. Soc., 1993, 76, 563–588 CrossRef CAS.
- S. C. Singhal, Solid oxide fuel cells for stationary, mobile, and military applications, Solid State Ionics, 2002, 152–153, 405–410 CrossRef CAS.
- C. Lu, S. An, W. L. Worrell, J. M. Vohs and R. J. Gorte, Development of intermediate-temperature solid oxide fuel cells for direct utilization of hydrocarbon fuels, Solid State Ionics, 2004, 175, 47–50 CrossRef CAS.
- P. Singh and N. Q. Minh, Solid oxide fuel cells: Technology status, Int. J. Appl. Ceram. Technol., 2004, 1, 5–15 CrossRef CAS.
- E. Wachsman and K. Lee, Lowering the Temperature of Solid Oxide Fuel Cells, Science, 2011, 334, 935–940 CrossRef CAS PubMed.
- M. Singh, D. Zappa and E. Comini, Solid oxide fuel cell: Decade of progress, future perspectives and challenges, Int. J. Hydrogen Energy, 2021, 46, 27643–27674 CrossRef CAS.
- Y. Yamazaki, R. Hernandez-Sanchez and S. M. Haile, High total proton conductivity in large-grained yttrium-doped barium zirconate, Chem. Mater., 2009, 21, 2755–2762 CrossRef CAS.
- Y. Guo, Y. Lin, R. Ran and Z. Shao, Zirconium doping effect on the performance of proton-conducting BaZryCe0.8−yY0.2O3−δ (0.0 ≤ y ≤ 0.8) for fuel cell applications, J. Power Sources, 2009, 193, 400–407 CrossRef CAS.
- L. Yang, et al., Enhanced Sulfur and Coking Tolerance of a Mixed Ion Conductor for SOFCs: BaZr0.1Ce0.7Y0.2–xYbxO3–δ, Science, 2009, 326, 126–129 CrossRef CAS PubMed.
- H. An, et al., A 5 × 5 cm2 protonic ceramic fuel cell with a power density of 1.3 W cm−2 at 600 °C, Nat. Energy, 2018, 3, 870–875 CrossRef CAS.
- C. Duan, J. Huang, N. Sullivan and R. O’Hayre, Proton-conducting oxides for energy conversion and storage, Appl. Phys. Rev., 2020, 7, 011314 CAS.
- S. Sun and Z. Cheng, Effects of H2O and CO2 on Electrochemical Behaviors of BSCF Cathode for Proton Conducting IT-SOFC Effects of H2O and CO2 on Electrochemical Behaviors of BSCF Cathode for Proton Conducting IT-SOFC, J. Electrochem. Soc., 2017, 164, F81–F88 CrossRef CAS.
- S. Sun and Z. Cheng, Electrochemical Behaviors for Ag, LSCF and BSCF as Oxygen Electrodes for Proton Conducting IT-SOFC Electrochemical Behaviors for Ag, LSCF and BSCF as Oxygen Electrodes for Proton Conducting IT-SOFC, J. Electrochem. Soc., 2017, 164, F3104–F3113 CrossRef CAS.
- F. He, T. Wu, R. Peng and C. Xia, Cathode reaction models and performance analysis of Sm0.5Sr0.5CoO3-δ–BaCe0.8Sm0.2O3−δ composite cathode for solid oxide fuel cells with proton conducting electrolyte, J. Power Sources, 2009, 194, 263–268 CrossRef CAS.
- A. Grimaud, et al., Hydration Properties and Rate Determining Steps of the Oxygen Reduction Reaction of Perovskite-Related Oxides as H + -SOFC Cathodes, J. Electrochem. Soc., 2012, 159, 683–694 CrossRef.
- J. Van Herle and A. J. McEvoy, Oxygen diffusion through silver cathodes for solid oxide fuel cells, J. Phys. Chem. Solids, 1994, 55, 339–347 CrossRef CAS.
- V. Brichzin, J. Fleig, H. U. Habermeier and J. Maier, Geometry Dependence of Cathode Polarization in Solid Oxide Fuel Cells Investigated by Defined Sr-Doped LaMnO3 Microelectrodes, Electrochem. Solid-State Lett., 2000, 3, 403–406 CrossRef CAS.
- J. Fleig, H. R. Kim, J. Jamnik and J. Maier, Oxygen Reduction Kinetics of Lanthanum Manganite (LSM)Model Cathodes: Partial Pressure Dependence and Rate-Limiting Steps, Fuel Cells, 2008, 8, 330–337 CrossRef CAS.
- A. K. Opitz and J. Fleig, Investigation of O2 reduction on Pt/YSZ by means of thin film microelectrodes: The geometry dependence of the electrode impedance, Solid State Ionics, 2010, 181, 684–693 CrossRef CAS.
- Y. B. Kim, et al., Nanopore Patterned Pt Array Electrodes for Triple Phase Boundary Study in Low Temperature SOFC, J. Electrochem. Soc., 2010, 157, B1269–B1274 CrossRef CAS.
- J. H. Shim, et al., Patterned Silver Nanomesh Cathode for Low-Temperature Solid Oxide Fuel Cells, J. Electrochem. Soc., 2012, 159, B541–B545 CrossRef CAS.
- V. Brichzin, J. Fleig, H. U. Habermeier, G. Cristiani and J. Maier, The geometry dependence of the polarization resistance of Sr-doped LaMnO3 microelectrodes on yttria-stabilized zirconia, Solid State Ionics, 2002, 152–153, 499–507 CrossRef CAS.
- J. L. Hertz and H. L. Tuller, Electrochemical Characterization of Thin Films for a Micro-Solid Oxide Fuel Cell, J. Electroceramics, 2004, 13, 663–668 CrossRef CAS.
- E. Koep, D. S. Mebane, R. Das, C. Compson and M. Liu, Characteristic thickness for a dense La0.8Sr0.2MnO3 electrode, Electrochem. Solid-State Lett., 2005, 8, A592–A595 CrossRef CAS.
- J. Fleig, et al., Thin Film Microelectrodes in SOFC Electrode Research, Fuel Cells, 2006, 6, 284–292 CrossRef CAS.
- J.-H. Wang, M. Liu and M. C. Lin, Oxygen reduction reactions in the SOFC cathode of Ag/CeO2, Solid State Ionics, 2006, 177, 939–947 CrossRef CAS.
- J. L. Hertz and H. L. Tuller, Measurement and finite element modeling of triple phase boundary-related current constriction in YSZ, Solid State Ionics, 2007, 178, 915–923 CrossRef CAS.
- S. Koc, G. J. La O’, T. Golfinopoulos and Y. Shao-Horn, Impedance Spectroscopy Studies of Oxygen Reduction Reaction on Thin Film Platinum Microelectrodes Supported on YSZ, ECS Trans., 2007, 7, 1271–1277 CrossRef.
- F. S. Baumann, et al., Quantitative Comparison of Mixed Conducting SOFC Cathode Materials by Means of Thin Film Model Electrodes, J. Electrochem. Soc., 2007, 154, B931–B941 CrossRef CAS.
- H. Huang, T. Holme and F. B. Prinz, Oxygen Reduction Characteristics on Ag, Pt, and Ag–Pt Alloys in Low Temperature SOFCs, ECS Trans., 2007, 3, 31–40 CrossRef CAS.
- S. Choi, et al., Exceptional power density and stability at intermediate temperatures in protonic ceramic fuel cells, Nat. Energy, 2018, 3, 202–210 CrossRef CAS.
- M. S. I. Sozal, et al., Electrical, thermal, and H2O and CO2 poisoning behaviors of PrNi0.5Co0.5O3−δ electrode for intermediate temperature protonic ceramic electrochemical cells, Int. J. Hydrogen Energy, 2022, 47, 21817–21827 CrossRef CAS.
- A. Bieberle, L. P. Meier and L. J. Gauckler, The Electrochemistry of Ni Pattern Anodes Used as Solid Oxide Fuel Cell Model Electrodes, J. Electrochem. Soc., 2001, 148, A646–A656 CrossRef CAS.
- A. Ehn, et al., Electrochemical Investigation of Nickel Pattern Electrodes in H2/H2O and CO/CO2 Atmospheres, J. Electrochem. Soc., 2010, 157, B1588–B1596 CrossRef CAS.
- W. Yao and E. Croiset, Ni/YSZ pattern anodes fabrication and their microstructure and electrochemical behavior changes in H2-H2O environments, J. Power Sources, 2013, 226, 162–172 CrossRef CAS.
- W. Li, Y. Shi, Y. Luo, Y. Wang and N. Cai, Carbon deposition on patterned nickel/yttria stabilized zirconia electrodes for solid oxide fuel cell/solid oxide electrolysis cell modes, J. Power Sources, 2015, 276, 26–31 CrossRef CAS.
- O. Cherry, Fabrication of an Atom Chip for Rydberg Atom-Metal Surface Interaction Studies, Master thesis, Univ. Waterloo, Waterloo, Canada, 2007.
- R. Zaouk, B. Y. Park and M. J. Madou, Introduction to Microfabrication Techniques, Methods Mol. Biol., 2010, 321, 5–15 Search PubMed.
- G. Marin, Inclined lithography and photoresist optimization for fabrication of 3D mesh structures, Master thesis, Aalto Univ., 74, 2014.
- J. M. Shaw, J. D. Gelorme, N. C. LaBianca, W. E. Conley and S. J. Holmes, Negative photoresists for optical lithography, IBM J. Res. Dev., 1997, 41, 81–94 CAS.
- H. S. Lee and J. B. Yoon, A simple and effective lift-off with positive photoresist, J. Micromech. Microeng., 2005, 15, 2136–2140 CrossRef CAS.
- R. A. Lawson, L. M. Tolbert, T. R. Younkin and C. L. Henderson, Negative-tone molecular resists based on cationic polymerization, Adv. Resist Mater. Process. Technol., 2009, XXVI 7273, 72733E1 Search PubMed.
- E. Koep, C. Compson, M. Liu and Z. Zhou, A photolithographic process for investigation of electrode reaction sites in solid oxide fuel cells, Solid State Ionics, 2005, 176, 1–8 CrossRef CAS.
- D. Poetzsch, R. Merkle and J. Maier, Investigation of oxygen exchange kinetics in proton-conducting ceramic fuel cells: Effect of electronic leakage current using symmetric cells, J. Power Sources, 2013, 242, 784–789 CrossRef CAS.
- R. Strandbakke, et al., Gd- and Pr-based double perovskite cobaltites as oxygen electrodes for proton ceramic fuel cells and electrolyser cells, Solid State Ionics, 2015, 278, 120–132 CrossRef CAS.
- F. J. A. Loureiro, et al., La4Ni3O10±δ–BaCe0.9y0.1O3−δ cathodes for proton ceramic fuel cells; short-circuiting analysis using BaCe0.9y0.1O3−δ symmetric cells, Int. J. Hydrogen Energy, 2021, 46, 13594–13605 CrossRef CAS.
- H. Schichlein, et al. System Identification: A New Modelling Approach for SOFC Single Cells. in Proceedings of The Electrochemical Society vol. 1999–19 1069–1077 (1999).
- T. Ramos, K. Thydén and M. Mogensen, Electrochemical Characterisation of Ni/(Sc)YSZ Electrodes, in ECS Transactions, ed. T. Ramos, 2010, vol. 28, pp.123–139 Search PubMed.
- M. Saccoccio, T. H. Wan, C. Chen and F. Ciucci, Optimal regularization in distribution of relaxation times applied to electrochemical impedance spectroscopy: Ridge and Lasso regression methods – A theoretical and experimental Study, Electrochim. Acta, 2014, 147, 470–482 CrossRef CAS.
- B. A. Boukamp and A. Rolle, Analysis and Application of Distribution of Relaxation Times in Solid State Ionics, Solid State Ionics, 2017, 302, 12–18 CrossRef CAS.
- E. Ivers-Tiffée and A. Weber, Evaluation of electrochemical impedance spectra by the distribution of relaxation times, J. Ceram. Soc. Jpn., 2017, 125, 193–201 CrossRef.
- B. A. Boukamp and A. Rolle, Use of a distribution function of relaxation times (DFRT) in impedance analysis of SOFC electrodes, Solid State Ionics, 2018, 314, 103–111 CrossRef CAS.
- J. Hong, A. Bhardwaj, H. Bae, I. Kim and S.-J. Song, Electrochemical Impedance Analysis of SOFC with Transmission Line Model Using Distribution of Relaxation Times (DRT), J. Electrochem. Soc., 2020, 167, 114504 CrossRef CAS.
- A. Zare, H. Salari, A. Babaei, H. Abdoli and H. Aslannejad, Electrochemical evaluation of Sr2Fe1.5Mo0.5O6−δ/Ce0.9Gd0.1O1.95 cathode of SOFCs by EIS and DRT analysis, J. Electroanal. Chem., 2023, 936, 1–8 CrossRef.
- J. Sasaki, J. Mizusaki, S. Yamauchi and K. Fueki, Studies on Electrode Processes of Stabilized Zirconia Cell System by Complex Impedance Method, Bull. Chem. Soc. Jpn., 1981, 54, 1688–1692 CrossRef CAS.
- H. Uchida, S. Tanaka and H. Iwahara, Polarization at Pt electrodes of a fuel cell with a high temperature-type proton conductive solid electrolyte, J. Appl. Electrochem., 1985, 15, 93–97 CrossRef CAS.
- N. Li, et al., Characterization of GdBaCo2O5+δ cathode for IT-SOFCs, J. Alloys Compd., 2008, 454, 274–279 CrossRef CAS.
- R. Peng, T. Wu, W. Liu, X. Liu and G. Meng, Cathode processes and materials for solid oxide fuel cells with proton conductors as electrolytes, J. Mater. Chem., 2010, 20, 6218–6225 RSC.
- C. Zhang and H. Zhao, A novel cobalt-free cathode material for proton-conducting solid oxide fuel cells, J. Mater. Chem., 2012, 22, 18387–18394 RSC.
- Z. Wang, et al., A high performance cathode for proton conducting solid oxide fuel cells, J. Mater. Chem. A, 2015, 3, 8405–8412 RSC.
- R. Radhakrishnan, A. V. Virkar and S. C. Singhal, Estimation of Charge-Transfer Resistivity of Pt Cathode on YSZ Electrolyte Using Patterned Electrodes, J. Electrochem. Soc., 2005, 152, A927–A936 CrossRef CAS.
- M. Liu and H. Hu, Effect of Interfacial Resistance on Determination of Transport Properties of Mixed-Conducting Electrolytes, J. Electrochem. Soc., 1996, 143, L109–L112 CrossRef CAS.
Footnote |
| † Electronic supplementary information (ESI) available. See DOI: https://doi.org/10.1039/d3ma00793f |
| This journal is © The Royal Society of Chemistry 2024 |

