Enhanced photocatalytic hydrogen production of microporous organic polymers by incorporation of afterglow phosphorescent materials†
Sang Hyun
Ryu
 a,
Gye Hong
Kim
 b,
Tae Kyu
Ahn
 *ac,
Kyoung Chul
Ko
 *d and
Seung Uk
Son
 *a
*a
aDepartment of Chemistry, Sungkyunkwan University, Suwon 16419, Korea. E-mail: sson@skku.edu
bDepartment of Earth Systems and Environmental Sciences, Chonnam National University, Gwangju 61186, Korea
cDepartment of Energy Science, Sungkyunkwan University, Suwon 16419, Korea. E-mail: taeahn@skku.edu
dDepartment of Chemistry Education, Chonnam National University, Gwangju 61186, Korea. E-mail: kcho1982@jnu.ac.kr
First published on 12th May 2023
Abstract
This work shows that photocatalytic hydrogen evolution from water by microporous organic polymer (MOP)-based photocatalysts can be enhanced by the incorporation of afterglow phosphorescent materials (AG). The photocatalytic MOPs were introduced on the surface of AG through the Stille coupling of tris(4-trimethylstannylphenyl)amine with 3,7-dibromodibenzothiophene sulfone. The resultant AG–MOP–TADS–Pds showed enhanced photocatalytic activities by 2.4 times, compared with MOP–TADS–Pd, due to the Förster resonance energy transfer or charge transfer between AG and MOP–TADS–Pds.
10th anniversary statementWe congratulate the Royal Society of Chemistry on the last 10 years of success of the Journal of Materials Chemistry A. It was our pleasure to see the surprising growth of the Journal of Materials Chemistry A. We have studied morphology-engineered microporous organic polymers (ME-MOPs) as functional materials for environmental and energy issues. Fortunately, we found that our research theme fits well with the Journal of Materials Chemistry A. We have enjoyed the rapid and convenient reviewing and publication process. As the reputation and criteria of the Journal of Materials Chemistry A grew, we could follow and improve the quality of our research. We hope for the continued success of the Journal of Materials Chemistry A and appreciate the efforts of editorial offices and reviewers. It will be our honor to submit our future works to the Journal of Materials Chemistry A. |
As global climate changes triggered by the consumption of fossil fuels come to pose actual threats to human life, carbon neutralization is becoming an increasingly important subject.1 In this regard, hydrogen has continually attracted attention as an alternative fuel instead of petroleum.2 To realize the hydrogen economy, the technologies of hydrogen generation, storage, and utilization must first be sufficiently accumulated and revolutionized.2
Photocatalytic water splitting is one of the promising methods for the generation of hydrogen.3 Over the last several decades, various photocatalytic systems have been developed for water splitting.4 Moreover, there has recently been great progress in microporous organic polymer (MOP)-based photocatalytic systems for the generation of hydrogen from water.5–8 MOPs can be prepared by the coupling of organic building blocks.9 Due to the network feature of MOPs, MOP-based photocatalytic systems showed enhanced stability in photocatalytic hydrogen production, compared with molecule-based photocatalysts.10 The introduction of electron push–pull structures into MOP-based photocatalysts can induce efficient utilization of visible light, thus resulting in enhanced photocatalytic performance.10 Further, residual palladium nanoparticles play critical roles as catalysts in the efficient photocatalytic production of hydrogen.11 However, new approaches should be continuously explored to enhance the photocatalytic performance of MOP-based photocatalysts.
While the performance of photocatalysts is highly important, efficient utilization of light is also a crucial point to consider. In this regard, collecting and concentrating light has been studied as a strategy to enhance the performance of light-related systems such as solar cells.12 We have shown that afterglow phosphorescent materials are helpful for the utilization of light by MOP-based photocatalysts. Afterglow phosphorescent materials have been utilized for emergency notifications in dark surroundings (Fig. 1a).13 When afterglow phosphorescent materials absorb light, they gradually emit visible light.13 One of the commercial afterglow phosphorescent materials is Sr4Al14O25 with doped Eu, Dy, and B (denoted by AG).14 After exposure to light, the commercial AG used in this study could maintain emission for ∼6 minutes (Fig. 1b).
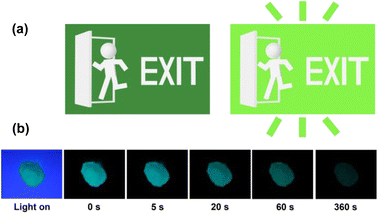 | ||
| Fig. 1 (a) An example of the application of afterglow phosphorescent materials in common life. (b) Afterglow properties of commercial Sr4Al14O25:Eu,Dy,B used in this study. | ||
Our research group has reported that the morphology control of MOPs can enhance their functional performance.15 For example, the nanorods and hollow spheres of photocatalytic MOPs have shown enhanced photocatalytic performance in hydrogen production from water.10,16 We have also shown that the MOPs can be incorporated into various inorganic materials including metal oxides.17 Here, we expect that incorporating photocatalytic MOPs into AG can enhance their photocatalytic performance, due to the additional utilization of light. In this work, we report the synthesis of AG–MOP composites and their enhanced photocatalytic performance.
Fig. 2 shows the synthetic method used for the composites (AG–MOP–TADS–Pds) of AG, MOP bearing triphenylamines and dibenzothiophene sulfones, and Pd in addition to the control materials (AG–Pd, MOP–TADS–Pd2). In the presence of commercial AG (Sr4Al14O25:Eu,Dy,B), the Stille coupling of tris(4-trimethylstannylphenyl)amine with 1.5 eq. of 3,7-dibromodibenzothiophene sulfone by a (PPh3)4Pd catalyst resulted in the formation of AG–MOP–TADS–Pds. The amounts of organic building blocks were carefully optimized to suppress the independent formation of MOP–TADS–Pds. With a fixed amount of AG (60 mg), the amounts of organic building blocks were gradually reduced. When 27 μmol of tris(4-trimethylstannylphenyl)amine and 40 μmol of 3,7-dibromodibenzothiophene sulfone were used, the independent formation of MOP–TADS–Pds was significantly suppressed.
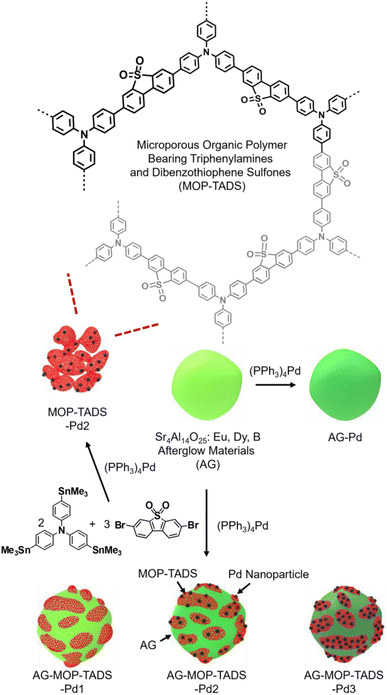 | ||
| Fig. 2 Synthesis of the composites (AG–MOP–TADS–Pds) of AG, MOP bearing triphenylamines and dibenzothiophene sulfones, and Pd and their control materials (AG–Pd, MOP–TADS–Pd2). | ||
It has been reported that the optimal amount of Pd is critical for achieving high performance MOP-based photocatalysts for water splitting.16 If the amount of Pd is insufficient, the catalytic performance is reduced, due to the less efficient redox reaction on the Pd. If the amount of Pd is excessive, it can hinder the light harvesting of MOP materials (Fig. S1 in the ESI†). In this regard, we varied the amount of (PPh3)4Pd from 11 μmol to 32 and 64 μmol with optimal amounts of organic building blocks to form three AG–MOP–TADS–Pds, which were denoted as AG–MOP–TADS–Pd1–3, respectively. As a control material, AG–Pd was prepared by the treatment of AG under the same synthetic conditions as AG–MOP–TADS–Pd2 without using organic building blocks (Fig. S2 in the ESI†). In addition, another control material, MOP–TADS–Pd2, was prepared under the same synthetic conditions as AG–MOP–TADS–Pd2 without using AG.
Scanning electron microscopy (SEM) showed that commercial AG is made up of 10–50 micron sized particles with relatively smooth surface (Fig. 3a and b). In comparison, granular MOP–TADS–Pds were loaded on the surface of AG in the AG–MOP–TADS–Pds (Fig. 3c–f). Energy dispersive X-ray spectroscopy (EDS)-based elemental mapping analysis showed the homogeneous distribution of Sr, Al, O, C, N, S, and Pd over AG–MOP–TADS–Pd2, indicating the loading of MOP–TADS and Pd on the AG (Fig. 3g). Transmission electron microscopy (TEM) and high resolution TEM analysis showed the incorporation of Pd nanoparticles with a diameter of 5–7 nm into MOP–TADS (Fig. S3 in the ESI†).
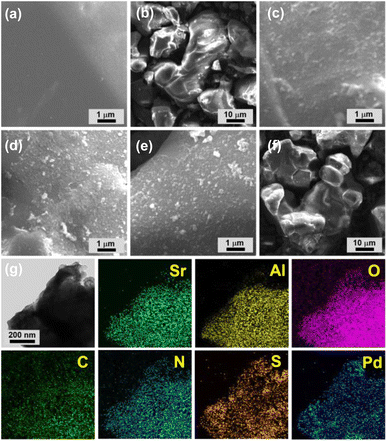 | ||
| Fig. 3 SEM images of (a and b) AG, (c) AG–MOP–TADS–Pd1, (d and f) AG–MOP–TADS–Pd2, and (e) AG–MOP–TADS–Pd3. (g) EDS-based elemental mapping images of AG–MOP–TADS–Pd2. | ||
Powder X-ray diffraction (PXRD) studies showed that AG has a crystalline structure of Sr4Al14O25 (JCPDS # 52-1876) (Fig. 4a). The PXRD pattern of MOP–TADS–Pd2 showed the diffraction peaks of zerovalent Pd (JCPDS # 46-1043). In the cases of AG–MOP–TADS–Pds, while the diffraction peaks of AG were mainly observed, those of zerovalent Pd gradually increased with increasing Pd amounts from AG–MOP–TADS–Pd1 to AG–MOP–TADS–Pd2 and AG–MOP–TADS–Pd3, respectively. The MOP–TADS obtained by Pd etching from MOP–TADS–Pd2 was amorphous, matching with the conventional properties of MOPs in the literature (Fig. S4 in the ESI†).9
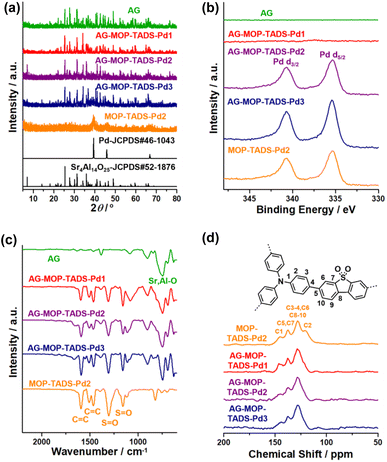 | ||
| Fig. 4 (a) PXRD patterns, (b) XPS, and (c) IR spectra of AG, AG–MOP–TADS–Pds, and MOP–TADS–Pd2, and (d) solid state 13C NMR spectra of AG–MOP–TADS–Pds and MOP–TADS–Pd2. | ||
The X-ray photoelectron spectra (XPS) of AG–MOP–TADS–Pd2, AG–MOP–TADS–Pd3, and MOP–TADS–Pd2 showed Pd 3d orbital peaks at 340.7 and 335.4 eV, corresponding to the zerovalent Pd species (Fig. 4b and S5 in the ESI†).16 In comparison, the XPS spectrum of AG–MOP–TADS–Pd1 revealed trace Pd 3d orbital peaks, due to the minor amount of Pd in the materials.
The N2 sorption studies based on Brunauer–Emmett–Teller theory showed that MOP–TADS has a surface area of 249 m2 g−1 and microporosity (Fig. S6 in the ESI†). The chemical structures of the materials were characterized by infrared absorption (IR) and solid state 13C nuclear magnetic resonance (NMR) spectroscopy (Fig. 4c and d). While AG showed Sr–O or Al–O vibration peaks at 747 cm−1,18 the IR spectrum of MOP–TADS–Pd2 showed aromatic C![[double bond, length as m-dash]](https://www.rsc.org/images/entities/char_e001.gif) C vibration peaks at 1590 and 1465 cm−1 in addition to S
C vibration peaks at 1590 and 1465 cm−1 in addition to S![[double bond, length as m-dash]](https://www.rsc.org/images/entities/char_e001.gif) O vibrations of the sulfone groups at 1303 and 1159 cm−1, matching with the expected chemical structures (Fig. 4c).16 The solid state 13C NMR spectrum of MOP–TADS–Pd2 showed aromatic 13C peaks at 145, 137, 128, and 120 ppm, corresponding to aromatic carbons adjacent to nitrogens, dibenzothiophene sulfones, overlapped aromatic carbons, and triphenylamines, respectively (Fig. 4d).16 The 13C NMR spectra of AG–MOP–TADS–Pds showed the same 13C peaks as MOP–TADS–Pd2, indicating that the MOP–TADS of AG–MOP–TADS–Pds has the same chemical structure as MOP–TADS–Pd2. Based on thermogravimetric analysis (TGA) and inductively coupled plasma atomic emission spectroscopy (ICP-AES), the content of MOP–TADS–Pds in the AG–MOP–TADS–Pd1, AG–MOP–TADS–Pd2, and AG–MOP–TADS–Pd3 was determined to be 5.9, 10.4, and 13.3 wt%, respectively.
O vibrations of the sulfone groups at 1303 and 1159 cm−1, matching with the expected chemical structures (Fig. 4c).16 The solid state 13C NMR spectrum of MOP–TADS–Pd2 showed aromatic 13C peaks at 145, 137, 128, and 120 ppm, corresponding to aromatic carbons adjacent to nitrogens, dibenzothiophene sulfones, overlapped aromatic carbons, and triphenylamines, respectively (Fig. 4d).16 The 13C NMR spectra of AG–MOP–TADS–Pds showed the same 13C peaks as MOP–TADS–Pd2, indicating that the MOP–TADS of AG–MOP–TADS–Pds has the same chemical structure as MOP–TADS–Pd2. Based on thermogravimetric analysis (TGA) and inductively coupled plasma atomic emission spectroscopy (ICP-AES), the content of MOP–TADS–Pds in the AG–MOP–TADS–Pd1, AG–MOP–TADS–Pd2, and AG–MOP–TADS–Pd3 was determined to be 5.9, 10.4, and 13.3 wt%, respectively.
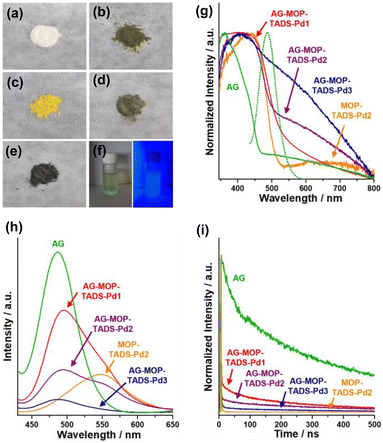
The optical properties of AG, AG–MOP–TADS–Pds, and MOP–TADS–Pd2 were investigated by reflectance and emission spectroscopy (Fig. 5). While AG had a white ivory appearance, AG–MOP–TADS–Pd1 turned yellow (Fig. 5a and c). With increasing amounts of Pd, the colors of MOP–TADS–Pd2, AG–MOP–TADS–Pd2, and AG–MOP–TADS–Pd3 became darker (Fig. 5b, d and e). The aqueous suspension of AG–MOP–TADS–Pd2 showed bright emission after light irradiation (Fig. 5f). The absorption behaviors of the materials were investigated through the conversion of reflectance spectra (Fig. 5g). Whilst AG showed absorption at 340–474 nm, MOP–TADS–Pd2 showed two absorption bands at 340–535 nm and 535–800 nm, corresponding to the absorption by MOP–TADS and black Pd nanoparticles, respectively. While AG–MOP–TADS–Pds showed the same absorption of MOP–TADS at 340–535 nm, the absorption at 535–800 nm gradually increased with increasing amounts of Pd. In emission spectroscopy, AG showed strong emission at 400–595 nm, which overlapped with the absorption band of MOP–TADS–Pd2 in the range of 400–535 nm, indicating that the emission of AG can be absorbed by MOP–TADS via Förster resonance energy transfer (Fig. 5g and h).19
While MOP–TADS–Pd2 showed emission at 450–650 nm, the AG–MOP–TADS–Pds showed two emission bands at 400–595 nm and 450–650 nm by AG and MOP–TADS, respectively (Fig. 5h). With increasing amounts of MOP–TADS–Pd in AG–MOP–TADS–Pds, the emission intensities gradually decreased, indicating efficient charge transfer between AG, MOP–TADS, and Pd. The emission decay behaviors were investigated by laser photophysical studies (Fig. 5i). While the emission by AG showed a long average lifetime of 360 ns, the average emission lifetime of AG–MOP–TADS–Pds gradually decreased to 36, 23, and 8 ns for AG–MOP–TADS–Pd1, AG–MOP–TADS–Pd2, and AG–MOP–TADS–Pd3, respectively (Fig. 5i and S7 in the ESI†). It is noteworthy that the emission of AG–Pd retained a long average lifetime of 362 ns, indicating that the reduced emission lifetimes of AG–MOP–TADS–Pds are attributable to the charge transfer between AG and MOP–TADS.
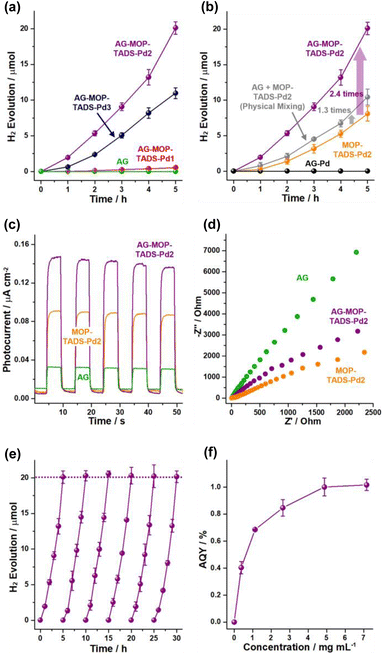
Next, the photocatalytic performance of the materials for hydrogen evolution from water was investigated (Fig. 6). While AG was inactive in the photocatalytic hydrogen generation, the photocatalytic activity of AG–MOP–TADS–Pd1 was relatively poor, due to the insufficient amount of Pd (0.05 wt%) (Fig. S1 in the ESI†). In comparison, while AG–MOP–TADS–Pd2 (6.3 wt% Pd) showed promising photocatalytic performance, the hydrogen evolution activity of AG–MOP–TADS–Pd3 (9.7 wt% Pd) decreased, compared with that of AG–MOP–TADS–Pd2, indicating that the AG–MOP–TADS–Pd2 is an optimal material (Fig. 6a). It has been well recognized that the optimal amount of Pd is critical to achieving efficient performance of MOP-based photocatalysts (Fig. S1 in the ESI†).16 In control studies, AG–Pd (5.6 wt% Pd) that had been prepared under the same synthetic conditions as AG–MOP–TADS–Pd2 in the absence of organic building blocks showed no hydrogen production (Fig. 6b and refer to the Experimental section in the ESI† for detailed procedures), revealing that the photocatalytic hydrogen evolution resulted from MOP–TADS–Pds. The introduction of AG into AG–MOP–TADS–Pd2 (6.3 wt% Pd) significantly enhanced hydrogen production by 2.4 times, compared with MOP–TADS–Pd2 (6.1 wt% Pd) (indicated by a violet arrow in Fig. 6b).
While the hydrogen evolution rate (HER) of MOP–TADS–Pd2 is 5.27 × 10³ μmol g−1 h−1, that of MOP–TADS–Pd in AG–MOP–TADS–Pd2 corresponds to 1.29 × 10⁴ μmol g−1 h−1, indicating that the AG plays a positive role including in the possible scattering effect12b in the photocatalytic production of hydrogen. It is noteworthy that during 2014–2020, MOP-based photocatalysts had shown HERs in the range of 1 × 10² to 8.52 × 10³ μmol g−1 h−1 in the literature (Table S1 in the ESI†).5–8 In the last two years, the HERs of MOP-based photocatalysts have been improved up to 1.58 × 10⁵ μmol g−1 h−1 in the literature.5–8 Although the HER performance of this work is not at the level of the world's best records, it reflects the significant improvement of the MOP-based photocatalysts developed by our research group10,15 from 1.25 × 10³ μmol g−1 h−1 to 1.29 × 10⁴ μmol g−1 h−1 (Table S1 in the ESI†). When we physically mixed the AG with MOP–TADS–Pd2, the HER increased by 1.3 times, compared with that of MOP–TADS–Pd2, indicating that the contact of MOP–TADS–Pd2 on the AG is also important for efficient hydrogen production (Fig. 6b and S1 in the ESI†).
To rationalize the superior photocatalytic performance of AG–MOP–TADS–Pd2, photoelectrochemical studies were conducted. As displayed in Fig. 6c, AG–MOP–TADS–Pd2 showed an enhanced photocurrent response, compared with AG and MOP–TADS–Pd2, indicating synergistic action between AG and MOP–TADS–Pd2 for efficient photo-induced charge transfer. Electrochemical impedance spectroscopy (EIS) showed that as the amount of AG increased from MOP–TADS–Pd2 to AG–MOP–TADS–Pd2 and AG, charge transfer resistances increased (Fig. 6d). These results imply that AG assisted the photocatalytic performance of AG–MOP–TADS–Pd2 in a photoelectrochemical manner.
Cycling tests of photocatalytic hydrogen evolution by AG–MOP–TADS–Pd2 were conducted (Fig. 6e). For 5 additional cycling tests, the photocatalytic hydrogen evolution rates remained in the range of 100–102%. IR and XPS studies showed that the AG–MOP–TADS–Pd2 recovered after 5 additional cycles completely retained the original chemical structure (Fig. S8 in the ESI†). Apparent quantum yields (AQYs) were measured at 420 nm by changing the concentration of AG–MOP–TADS–Pd2 (Fig. 6f), showing that the maximum AQY reached 1.02%. While higher AQYs (@420 nm) of the MOP-based photocatalysts for hydrogen evolution have been recently reported,8 it is noteworthy that the representative conjugated microporous polymer-based photocatalytic systems prepared by Cooper's research group showed AQYs (@420 nm) of 0.23% and 0.42% (Table S1 in the ESI†).6
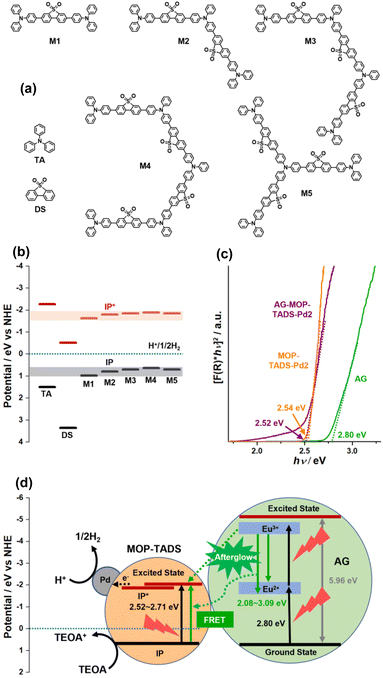
The photocatalytic process of AG–MOP–TADS–Pd2 was further rationalized with a density functional theory (DFT)-based computational simulation (Fig. 7 and S9–S12 in the ESI†). First, the ground state ionization energy (IP) and the excited state ionization energy (IP*) of MOP–TADS were computed to be 0.64–0.70 eV and −1.85 to −1.89 eV (vs. NHE), respectively, through the gradual extension of model systems (Fig. 7a and b). Second, to calculate the energy levels of AG, a bulk unit cell and the surface slab model of Sr4Al14O25 with a Pmma space group were optimized at PBE/light tier-1 level (Fig. S9–S12 in the ESI†). Then, the IP and the band gap of AG were simulated to be 0.74 (vs. NHE) and 5.96 eV, respectively. The Kubelka–Munk plots of the reflectance spectra indicated the band gaps of AG, MOP–TADS–Pd2, and AG–MOP–TADS–Pd2 to be 2.80, 2.54, and 2.52 eV, respectively (Fig. 7c). According to emission spectroscopy, the emission range of AG was 2.08–3.09 eV. Thus, as shown in Fig. 7d, it can be speculated that the afterglow emission of AG can induce the FRET from AG to MOP–TADS–Pd (2.52–2.71 eV) in the AG–MOP–TADS–Pd2 (indicated by a dotted curved arrow). In addition, charge transfer between the excited state of AG and MOP–TADS can occur (indicated by a dotted straight arrow in Fig. 7d). Finally, electrons can be transferred from the excited state of MOP–TADS to Pd nanoparticles to reduce protons to hydrogen gas, in addition to the oxidation of triethanolamine.
In conclusion, this work presents a conceptual approach for enhancing the hydrogen production efficiency of MOP-based photocatalysts by incorporating AG materials. The incorporation of MOP-based photocatalysts on the surface of AG resulted in enhanced hydrogen evolution efficiency by 2.4 times, compared with the control MOP-based photocatalysts, due to the efficient light utilization with the help of AG. We believe that the photocatalytic performance of AG–MOP materials can be further improved by applying nano-sized AGs instead of micron-sized ones.
Author contributions
S. U. Son: conceptualization, supervision, writing the original draft, and review & editing. K. C. Ko and T. K. Ahn: supervision and review. S. H. Ryu and G. H. Kim: investigation and formal analysis.Conflicts of interest
There are no conflicts to declare.Acknowledgements
This work was supported by National Research Foundation of Korea (NRF) grants (no. RS-2023-00208797 and NRF-2020R1F1A1076128) funded by the Korean government (MSIT).Notes and references
- Z. Liu, Z. Deng, S. J. Davis, C. Giron and P. Ciais, Nat. Rev. Earth Environ., 2022, 3, 217–219C CrossRef PubMed.
- M. Yue, H. Lambert, E. Pahon, R. Roche, S. Jemei and D. Hissel, Renewable Sustainable Energy Rev., 2021, 146, 111180 CrossRef.
- P. J. Megía, A. J. Vizcaíno, J. A. Calles and A. Carrero, Energy Fuels, 2021, 35, 16403–16415 CrossRef.
- (a) X. Tao, Y. Zhao, S. Wang, C. Li and R. Li, Chem. Soc. Rev., 2022, 51, 3561–3608 RSC; (b) Q. Wang and K. Domen, Chem. Rev., 2020, 120, 919–985 CrossRef CAS PubMed.
- (a) Y. Wang, A. Vogel, M. Sachs, R. S. Sprick, L. Wilbraham, S. J. A. Moniz, R. Godin, M. A. Zwijnenburg, J. R. Durrant, A. I. Copper and J. Tang, Nat. Energy, 2019, 4, 746–760 CrossRef CAS; (b) Y. Bai, K. Hippalgaonkar and R. S. Sprick, J. Mater. Chem. A, 2021, 9, 16222–16232 RSC; (c) Y. Liu, B. Li and Z. Xiang, Small, 2021, 17, 2007576 CrossRef CAS PubMed.
- (a) R. S. Sprick, J.-X. Jiang, B. Bonillo, S. Ren, T. Ratvijitvech, P. Guiglion, M. A. Zwijnenburg, D. J. Adams and A. I. Copper, J. Am. Chem. Soc., 2015, 137, 3265–3270 CrossRef CAS PubMed; (b) R. S. Sprick, B. Bonillo, M. Sachs, R. Clowes, J. R. Durrant, D. J. Adams and A. I. Cooper, Chem. Commun., 2016, 52, 10008–10011 RSC.
- (a) M. G. Schwab, M. Hamburger, X. Feng, J. Shu, H. W. Spiess, X. Wang, M. Antonietti and K. Müllen, Chem. Commun., 2010, 46, 8932–8934 RSC; (b) C. Yang, B. C. Ma, L. Zhang, S. Lin, S. Ghasimi, K. Landfester, K. A. I. Zhang and X. Wang, Angew. Chem., Int. Ed., 2016, 55, 9202–9206 CrossRef CAS PubMed; (c) L. Li and Z. Cai, Polym. Chem., 2016, 7, 4937–4943 RSC; (d) L. Wang, Y. Wan, Y. Ding, S. Wu, Y. Zhang, X. Zhang, G. Zhang, Y. Xiong, X. Wu, J. Yang and H. Xu, Adv. Mater., 2017, 29, 1702428 CrossRef PubMed; (e) Y. Xu, N. Mao, S. Feng, C. Zhang, F. Wang, Y. Chen, J. Zeng and J.-X. Jiang, Macromol. Chem. Phys., 2017, 218, 1700049 CrossRef; (f) Y. Xu, C. Zhang, P. Mu, N. Mao, X. Wang, Q. He, F. Wang and J.-X. Jiang, Sci. China: Chem., 2017, 60, 1075–1083 CrossRef CAS; (g) L. Wang, X. Zheng, L. Chen, Y. Xiong and H. Xu, Angew. Chem., Int. Ed., 2018, 57, 3454–3458 CrossRef CAS PubMed; (h) Y. Zhao, W. Ma, Y. Xu, C. Zhang, Q. Wang, T. Yang, X. Gao, F. Wang, C. Yan and J.-X. Jiang, Macromolecules, 2018, 51, 9502–9508 CrossRef CAS; (i) Z. Wang, X. Yang, T. Yang, Y. Zhao, F. Wang, Y. Chen, J. H. Zeng, C. Yan, F. Huang and J.-X. Jiang, ACS Catal., 2018, 8, 8590–8596 CrossRef CAS; (j) R. S. Sprick, Y. Bai, A. A. Y. Guibert, M. Zbiri, C. M. Aitchison, L. Wilbraham, Y. Yan, D. J. Woods, M. A. Zwijnenburg and A. I. Cooper, Chem. Mater., 2019, 31, 305–313 CrossRef CAS; (k) X.-J. Xiao, Y. Wang, W.-R. Wang, J. Li, J. Wang, Z.-W. Xu, J. Li, J. Yao and W.-S. Li, Macromolecules, 2020, 53, 2454–5463 CrossRef.
- (a) J.-L. Wang, G. Ouyang, D. Wang, J. Li, J. Yao, W.-S. Li and H. Li, Macromolecules, 2021, 54, 2661–2664 CrossRef CAS; (b) C. Shu, C. Han, X. Yang, C. Zhang, Y. Chen, S. Ren, F. Wang, F. Huang and J.-X. Jiang, Adv. Mater., 2021, 33, 2008498 CrossRef CAS PubMed; (c) M. G. Mohamed, M. H. Elsayed, A. M. Elewa, A. F. M. EL-Mahdy, C.-H. Yang, A. A. K. Mohammed, H.-H. Chou and S.-W. Kuo, Catal. Sci. Technol., 2021, 11, 2229–2241 RSC; (d) C. Han, P. Dong, H. Tang, P. Zheng, C. Zhang, F. Wang, F. Huang and J.-X. Jiang, Chem. Sci., 2021, 12, 1796–1802 RSC; (e) X. Zhao, B. Chen, W. Dong, S. Wang, Y. Xiang and H. Chen, J. Mater. Chem. A, 2021, 9, 10208–10216 RSC; (f) C. Yang, Z. Cheng, G. Divitini, C. Qian, B. Hou and Y. Liao, J. Mater. Chem. A, 2021, 9, 19894–19900 RSC; (g) C. Han, S. Xiang, M. Ge, P. Xie, C. Zhang and J.-X. Jiang, Small, 2022, 18, 2202072 CrossRef CAS PubMed; (h) Z.-R. Tang, Y.-Q. Xing, J.-Z. Cheng, G. Zhang, Z.-Q. Shen, Y.-J. Zhang, G. Liao, L. Chen and S.-Y. Liu, Chem. Sci., 2022, 13, 1725–1733 RSC; (i) X. Han, Y. Zhang, Y. Dong, J. Zhao, S. Ming and J. Zhang, RSC Adv., 2022, 12, 708–718 RSC; (j) C. Han, S. Xiang, P. Xie, P. Dong, C. Shu, C. Zhang and J.-X. Jiang, Adv. Funct. Mater., 2022, 32, 2109423 CrossRef CAS; (k) H. Zhao, Y. Dong, P. Sun, Y. Bai, C. Ru, X. Wu, Z. Li, X. Han, J. Wu and X. Pan, ACS Appl. Energy Mater., 2022, 5, 4631–4640 CrossRef CAS; (l) R. Li, C. Zhang, C.-X. Cui, Y. Hou, H. Niu, C.-H. Tan, X. Yang, F. Huang, J.-X. Jiang and Y. Zhang, Polymer, 2022, 240, 124509 CrossRef CAS.
- (a) M. G. Mohamed, A. F. M. El-Mahdy, M. G. Kotp and S.-W. Kuo, Mater. Adv., 2022, 3, 707–733 RSC; (b) J.-S. M. Lee and A. I. Cooper, Chem. Rev., 2020, 120, 2171–2214 CrossRef CAS PubMed; (c) D. Taylor, S. J. Dalgarno, Z. Xu and F. Vilela, Chem. Soc. Rev., 2020, 49, 3981–4042 RSC; (d) J. Wu, F. Xu, S. Li, P. Ma, X. Zhang, Q. Liu, R. Fu and D. Wu, Adv. Mater., 2019, 31, 1802922 CrossRef PubMed; (e) B. Zheng, X. Lin, X. Zhang, D. Wu and K. Matyjaszewski, Adv. Funct. Mater., 2019, 1907006 Search PubMed; (f) N. Chaoui, M. Trunk, R. Dawson, J. Schmidt and A. Thomas, Chem. Soc. Rev., 2017, 46, 3302–3321 RSC; (g) L. Tan and B. Tan, Chem. Soc. Rev., 2017, 46, 3322–3356 RSC; (h) S. Das, P. Heasman, T. Ben and S. Qiu, Chem. Rev., 2017, 117, 1515–1563 CrossRef CAS PubMed; (i) J.-K. Sun, M. Antonietti and J. Yuan, Chem. Soc. Rev., 2016, 45, 6627–6656 RSC; (j) Y. Xu, S. Jin, H. Xu, A. Nagai and D. Jiang, Chem. Soc. Rev., 2013, 42, 8012–8031 RSC; (k) D. Wu, F. Xu, B. Sun, R. Fu, H. He and K. Matyjaszewski, Chem. Rev., 2012, 112, 3959–4015 CrossRef CAS PubMed.
- J. H. Park, K. C. Ko, N. Park, H.-W. Shin, E. Kim, N. Kang, J. H. Ko, S. M. Lee, H. J. Kim, T. K. Ahn, J. Y. Lee and S. U. Son, J. Mater. Chem. A, 2014, 2, 7656–7661 RSC.
- L. Li, Z. Cai, Q. Wu, W.-Y. Lo, N. Zhang, L. X. Chen and L. Yu, J. Am. Chem. Soc., 2016, 138, 7681–7686 CrossRef CAS PubMed.
- (a) X. Liu, X. Chen, Y. Li, B. Wu, X. Luo, S. Quyang, S. Luo, A. A. A. Kheraif and J. Lin, J. Mater. Chem. A, 2019, 7, 19173–19186 RSC; (b) M. N. Mustafa, S. Shafie, M. H. Wahid and Y. Sulaiman, Sci. Rep., 2019, 9, 14952 CrossRef PubMed; (c) F. Berry, R. Mermet-Lyaudoz, J. M. C. Davila, D. A. Djemmah, H. S. Nguyen, C. Seassal, E. Fourmond, C. Chevalier, M. Amara and E. Drouard, Adv. Energy Mater., 2022, 12, 2200505 CrossRef CAS.
- D. V. Heggen, J. J. Joos, A. Feng, V. Fritz, T. Delgado, N. Gartmann, B. Walfort, D. Rytz, H. Hagemann, D. Poelman, B. Viana and P. F. Smet, Adv. Funct. Mater., 2022, 2208809 CrossRef.
- (a) T. Matsuzawa, Y. Aoki, N. Takeuchi and Y. Murayama, J. Electrochem. Soc., 1996, 143, 2670–2673 CrossRef CAS; (b) C. Chang, Z. Yuan and D. Mao, J. Alloys Compd., 2006, 415, 220–224 CrossRef CAS; (c) D. Dutczak, T. Justel, C. Ronda and A. Meijerink, Phys. Chem. Chem. Phys., 2015, 17, 15236–15249 RSC.
- K. Cho, C. W. Kang, S. H. Ryu, J. Y. Jang and S. U. Son, J. Mater. Chem. A, 2022, 10, 6950–6954 RSC.
- S. H. Ryu, S. M. Lee, H. J. Kim, Y.-J. Ko, K. C. Ko and S. U. Son, J. Mater. Chem. A, 2021, 9, 22262–22268 RSC.
- (a) N. Kang, J. H. Park, M. Jin, N. Park, S. M. Lee, H. J. Kim, J. M. Kim and S. U. Son, J. Am. Chem. Soc., 2013, 135, 19115–19118 CrossRef CAS PubMed; (b) C. W. Kang, D.-M. Lee, J. Park, S. Bang, S.-W. Kim and S. U. Son, Angew. Chem., Int. Ed., 2022, 61, 2202209659 Search PubMed.
- F. Li, Z. Li, X. Wang, M. Zhang, Y. Shen, P. Cai and X. He, J. Alloys Compd., 2017, 695, 10–21 CrossRef.
- (a) T. Förster, Ann. Phys., 1948, 2, 55–75 CrossRef; (b) A. Kaur, P. Kaur and S. Ahuja, Anal. Methods, 2020, 12, 5532–5550 RSC.
Footnote |
| † Electronic supplementary information (ESI) available: Experimental procedures, computational simulation, additional characterization data, and comparative photocatalytic performance of MOP-based photocatalysts. See DOI: https://doi.org/10.1039/d3ta02348f |
| This journal is © The Royal Society of Chemistry 2023 |

