 Open Access Article
Creative Commons Attribution 3.0 Unported Licence
Effect of Cr3+ doping on structural and optical properties of Eu3+ doped LaVO4 phosphor
Ekta Raia,
Ram Sagar Yadav *b,
Dinesh Kumar
 ce,
Akhilesh Kumar Singhc,
Vijay Janardhan Fularia and
Shyam Bahadur Rai
 *d
*d
aDepartment of Physics, Shivaji University, Kolhapur 416004, India
bDepartment of Zoology, Institute of Science, Banaras Hindu University, Varanasi 221005, India. E-mail: ramsagaryadav@gmail.com
cSchool of Materials Science and Technology, Indian Institute of Technology(Banaras Hindu University), Varanasi 221005, India
dDepartment of Physics, Institute of Science, Banaras Hindu University, Varanasi 221005, India. E-mail: sbrai49@yahoo.co.in
eDepartment of Physics, National Post Graduate College, Barhalganj, Gorakhpur 273402, India
First published on 31st January 2023
Abstract
In this work, the Eu3+, Cr3+ doped and co-doped LaVO4 phosphors have been prepared through a high temperature solid-state reaction method. The powder XRD patterns of phosphors are very sharp and intense, which reflects a highly crystalline nature of phosphors. The XRD data were also refined by a Rietveld refinement method. The particle size of the phosphor samples lies in the sub-micron to micron range. The existence of La, Eu, Cr, V and O elements was verified by EDS spectra. The FTIR spectra show various absorption bands due to different vibrating groups. The optical band gap of the phosphor decreases on increasing concentration of Cr3+ ion. The photoluminescence excitation spectra of Eu3+, Cr3+ co-doped LaVO4 phosphor exhibit bands due to Eu3+ and Cr3+ ions. The Eu3+ doped LaVO4 phosphor exciting at 393 and 316 nm wavelengths gives intense red color at 614 nm due to the 5D0 → 7F2 transition of the Eu3+ ion. When the Cr3+ ion is co-doped in the Eu3+ doped LaVO4 phosphor the emission spectra contain emission bands due to Eu3+ and Cr3+ ions. The emission intensity of Eu3+ doped phosphor reduces due to energy transfer from Eu3+ to Cr3+ ions in presence of Cr3+ ions upon 393 and 386 nm excitations. The lifetime of the 5D0 level of Eu3+ ions decreases in the Eu3+, Cr3+ co-doped LaVO4 phosphor, which also reflects the energy transfer. The Eu3+, Cr3+ co-doped LaVO4 phosphor also produces a large amount of heat upon 980 nm excitation. Thus, the Eu3+, Cr3+ co-doped LaVO4 phosphors may be used for LEDs, solid state lighting and heat generating devices.
1. Introduction
The rare earth doped phosphor materials have been a subject of extensive investigations for several decades due to their wide applications in different fields in day-to-day life.1–7 They give intense sharp emissions in UV-vis-NIR regions and often lead to lasing, and Nd:YAG laser lasing at 1.06 μm is a good example of this.8 The intensity of this laser in NIR region is large enough so that the frequency doubled, tripled and quadrupled laser emissions could be obtained at 0.532, 0.355 and 0.266 μm, respectively and they are used for various applications. The rare earth ions attached with biomolecules are used as biosensors.9,10 The optical energy absorbed by biomolecules is transferred to the rare earth ion, which gives intense emission and thus, serves as a biosensor. The photoluminescence intensity of the rare earth ion in the host materials can be enhanced by co-doping of another neutral/ionized species acting as a sensitizer/modifier for the rare earth ions. In several cases, the sensitizer plays a dominant role.11–15 These materials have promising applications in different fields, such as display devices, light emitting diodes (LEDs), white LEDs, tunable color sources, optoelectronic devices, luminescent security ink, solar energy converters, optical heating, temperature sensing, bio-imaging, etc.1–15The Eu3+ ion is a well-studied rare earth ion. It emits almost pure red color and often used in display devices, color televisions and computer screens. It also gives laser emission in the far-infrared region. The Eu3+ ion has been doped in large number of hosts including glass, micro- and nano-phosphors and also in the bio-mediums.7,16–25 The ground state of Eu3+ ion is 7FJ with 7F0 as the lowest one. The other component of it forms the low-lying excited states. The next low-lying excited state is regular 5DJ with 5D0 as the lowest one. The bands in visible region in it arise due to 5D0, 1 → 7FJ transitions. The Eu3+ ion emits very intense red band in almost all hosts in the range of 610–615 nm. The emitted radiation is mixed red because in many cases, it also emits intense orange at 590 nm and weak deep red near 650 nm and deep red at 700 nm. Ofcourse, the intensity of the red band is much larger than the orange band. Therefore, the Eu3+ doped materials are sometimes treated as pure red source of light for many practical purposes. It is also used to generate white light (RGB) with other rare earth/earths emitting green and blue colors.1–6,16–25 The 5D0 → 7F1 transition lies in orange region whereas 5D0 → 7F3 and 5D0 → 7F4 in deep red (NIR) regions. However, these bands are relatively weak. The band 5D0 → 7F0 appears with very small intensity and it is not seen in many cases. The 5D0 → 7F2 transition is due to change in electric dipole moment whereas the 5D0 → 7F1 transition occurs due to change in magnetic dipole moment. The ratio of the emission intensity of these bands i.e.,  gives the asymmetric nature of the host.16–21 The Eu3+ ion has been studied in different phosphor host matrices (ref. 26–31 and references therein) in which some of them are found to be self-activated.26–29
The LaVO4 as a self-activated host absorbs UV light efficiently. It emits blue color in the range of 350–450 nm with its maximum ∼430 nm. The Eu3+ ion absorbs this radiation and emits photoluminescence in the range of 420–750 nm. This induced us to select this as a host matrix.32–34 LaVO4 exists in monoclinic (m-LaVO4) as well as in tetragonal (t-LaVO4) phases. The formation of monoclinic or tetragonal phase depends on the temperature used for its preparation and also on the environment in which the samples have been prepared (in air or vacuum). Sometimes, it also depends on the doping of activator/sensitizer ions in the LaVO4 matrix.25,27,28 We have used 1473 K temperature for the preparation of phosphor samples. The XRD measurements clearly show that the phosphor samples exist in monoclinic phase at this temperature.25,27,28,32–34
The triply ionized Cr3+ ion with configuration 3d3 has been used as sensitizer as well as activators in different host matrices.35–38 The 2E state of Cr3+ ion is a long-lived state, which gives long lasting phosphorescence.35,37 It gives lasing at several wavelengths in IR and NIR regions in which the NIR emission at 695 nm is due to forbidden 2E → 4A2 transition and has been extensively studied in recent years.38 The Cr3+ ion also gives the blue (4T1(4P) → 4A2)/(4T1(4F) → 4A2), green (4T2(4P) → 4A2) and red (4T2(4F) → 4A2) emissions. It will be interesting to see that the energy level 4T2(4F) of Cr3+ ion lies in the red region at 15![[thin space (1/6-em)]](https://www.rsc.org/images/entities/char_2009.gif) 773 cm−1 while that of 4T1(4F) lies in the green region at 17
773 cm−1 while that of 4T1(4F) lies in the green region at 17![[thin space (1/6-em)]](https://www.rsc.org/images/entities/char_2009.gif) 211 cm−1. On the other hand, the 5D0 level of Eu3+ ion lies at 17
211 cm−1. On the other hand, the 5D0 level of Eu3+ ion lies at 17![[thin space (1/6-em)]](https://www.rsc.org/images/entities/char_2009.gif) 267 cm−1. Thus, when Eu3+ and Cr3+ ions are present in the host the 4T1(4F) of Cr3+ ion lies close but slightly below to the 5D0 level of Eu3+ ion. Thus, when Eu3+ ions are excited they transfer a small amount of their energy to Cr3+ ions and therefore, the emission intensity of Eu3+ ion as well as its lifetime are decreased. The presence of excess Cr3+ ion may also quench its own emission intensity.
267 cm−1. Thus, when Eu3+ and Cr3+ ions are present in the host the 4T1(4F) of Cr3+ ion lies close but slightly below to the 5D0 level of Eu3+ ion. Thus, when Eu3+ ions are excited they transfer a small amount of their energy to Cr3+ ions and therefore, the emission intensity of Eu3+ ion as well as its lifetime are decreased. The presence of excess Cr3+ ion may also quench its own emission intensity.
In the present work, we have doped different concentrations of Cr3+ ions in the LaVO4:1 mol% Eu3+ phosphor. Initially, the Eu3+ doped LaVO4 has been studied and its concentration was optimized for optimum emission intensity. It has been found that the emission intensity is optimum at 1 mol% concentration of Eu3+ ion. Further, the samples were prepared using LaVO4:1 mol% Eu3+ phosphor with different concentrations of Cr3+ ions (where x = 0.01, 0.05, 0.1, 0.5, 1.0 mol%). We have studied the effect of Cr3+ doping on the absorption and photoluminescence emission intensity of LaVO4:1 mol% Eu3+ phosphor. It has been found that the emission intensity of LaVO4:1 mol% Eu3+ phosphor decreases even with small concentration of Cr3+ ions. We have also measured the lifetime of 5D0 level of Eu3+ ion corresponding to 5D0 → 7F2 band at 614 nm. The lifetime of 5D0 level initially increases and then decreased with the increase in the concentration of Eu3+ ion. Further, the lifetime of 5D0 level decreases on increasing the concentration of Cr3+ ion, which is due to energy transfer from Eu3+ to Cr3+ ions. This supports that the Cr3+ ion behaves as a quenching center. We have also measured the heat produced in the Eu3+, Cr3+ co-doped LaVO4 phosphor on excitation with 980 nm diode laser.
2. Experimental methods
2.1. Synthesis and characterization of samples
The La(1−x)EuxVO4 (where x = 0, 0.5, 1.0, 1.5 and 2 mol%) and La(1−x−y)EuxCryVO4 (where x is fixed at 1 mol% and y was varied as 0.01, 0.05 and 0.1 mol%) phosphor samples were synthesized by a high temperature solid-state reaction method at 1473 K. The raw materials viz. La2O3 (99.9% Himedia), V2O5 (99.9% Alpha Aesar), Eu2O3 (99.99% Merck) and Cr2O3 (99.99% alpha Aesar) were used as the starting materials. The calculated amounts of all the raw materials were weighed and mixed homogeneously with the help of an agate mortar and pestle for one hour each using acetone as mixing agent. The prepared mixtures were put in alumina crucibles and calcined in a high temperature furnace at 1473 K for 5 h. After that, the furnace temperature was reduced till it reaches to the room temperature and products were taken out from different crucibles. The phosphor samples were then crushed to convert them into fine powder form. The structural and optical measurements of these phosphor samples were carried out separately and compared with each other.The XRD measurements of Eu3+, Cr3+ doped and co-doped LaVO4 phosphors monitored in the 2θ range of 10°–100° were carried out using MiniFlex 600 (Rigaku Japan) X-ray diffractometer at 2° per min scan speed with CuKα as X-ray radiation source (λ = 1.5406 Å). The Rietveld refinements of all the XRD data were made using FullProf Suite.32–34 In order to measure the morphology and the energy dispersive X-ray spectroscopic (EDS) spectra of all the samples, a Zeiss EVO 18 Research unit of the scanning electron microscope (SEM) system was used. The absorption spectra of samples were recorded in the range in 200–800 nm using Lambda-750 PerkinElmer UV-vis-NIR spectrophotometer unit. The Fourier transform infrared (FTIR) spectra of samples were also measured with the help of Frontier-1 spectrometer, PerkinElmer unit. The photoluminescence excitation and emission spectra of the samples were monitored using Fluorolog-3 (Horiba) attached with 450 W Xenon lamp and photomultiplier tube (PMT). The lifetime of 5D0 level of the Eu3+ ion at 614 nm was also measured using the same unit in phosphorescence mode using 25 W pulsed Xenon lamp. The heat generated in all the samples were also measured using a thermo-couple set up at different power densities of 980 nm diode laser.
3. Results and discussion
3.1. Crystal structure and rietveld analysis
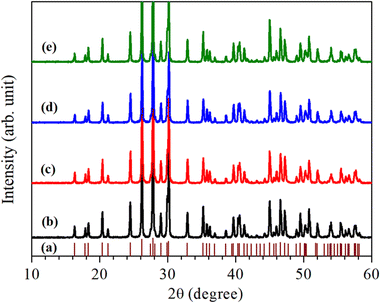
For the structural analysis of LaVO4:1Eu3+:yCr3+ phosphors with y = 0.01, 0.05 and 0.1 mol%, the powder X-ray diffraction (XRD) patterns of these phosphor samples were monitored at room-temperature and are presented in Fig. 1. The powder XRD patterns of these phosphors are very sharp and highly intense, which reveal that the crystallinity of the LaVO4:1Eu3+:yCr3+ phosphors are very high.The diffraction peaks in the powder XRD patterns of all the compounds, well match with the standard XRD data of monoclinic LaVO4 compound belonging to P21/n space group with JCPDF File No. 50-0367 alongwith lattice parameters a = 7.0433(1) Å, b = 7.2806(2) Å, c = 6.7219(1) Å and β = 104.834(2)° (see Fig. 1). This implies that all Eu3+ and Cr3+ co-doped LaVO4 phosphors crystallize into monoclinic crystal structure belonging to P21/n space group.32–34 No traces of any secondary phase in the XRD profile of these compounds are seen. The XRD patterns shift towards higher 2θ value with the increase of concentration of Cr3+ ion.
In order to find out different crystal structure parameters, Rietveld structural analysis of the XRD patterns of all the phosphors have been carried out by the use of FullProf Suite.39,40 In the course of Rietveld structural analysis, we had supposed that the Eu3+ and/or Cr3+ ions are substituting at La-site in the LaVO4 host. In the monoclinic crystal structure having P21/n space group, V5+, La3+/Eu3+/Cr3+, O2−(I), O2−(II), O2−(III) and O2−(IV) ions substitute at 4e site (δx, δy, δz). Further, for Rietveld structural analysis, we have used atomic coordinates for constituent atoms as reported earlier.32–34 A good fit between the calculated and the observed XRD patterns was observed. Rietveld plots for the LaVO4:1Eu3+, LaVO4:1Eu3+:0.01Cr3+, LaVO4:1Eu3+:0.05Cr3+ and LaVO4:1Eu3+:0.1Cr3+ phosphors are displayed in Fig. 2a–d, respectively. In Fig. 2, solid red dots designate the observed XRD patterns and the continuous curve over the observed XRD patterns indicates the calculated patterns. The vertical bars in Rietveld fits demonstrate the positions of Bragg's peak and the lower most continuous curve signifies the difference among the observed and the calculated XRD patterns.
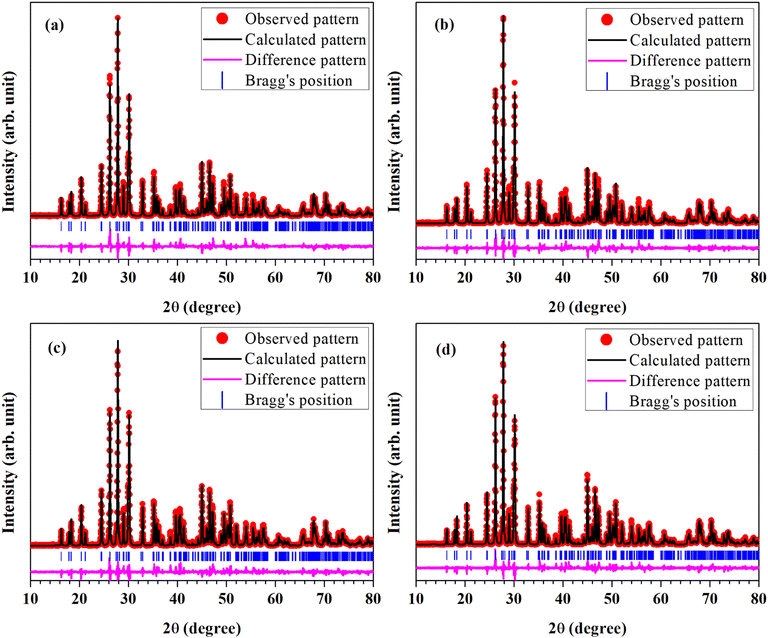 | ||
| Fig. 2 Rietveld fits of XRD patterns for Eu3+ and/or Cr3+ co-doped LaVO4 phosphors: (a) LaVO4:1Eu3+, (b) LaVO4:1Eu3+:0.01Cr3+, (c) LaVO4:1Eu3+:0.05Cr3+ and (d) LaVO4:1Eu3+:0.1Cr3+ phosphors. | ||
The obtained values of goodness of fit (χ2), lattice parameters (a, b, c, α, β and γ) and the unit cell volume (V) for all the doped and co-doped phosphor samples are given in Table 1. It has been observed that the value of unit cell volume decreases as the concentrations of Cr3+ ions are enhanced. Reduction in the unit cell volume of the Cr3+ doped LaVO4:1Eu3+ phosphors may be due to the smaller ionic radius of Cr3+ ion (0.615 Å) as compared to the ionic radius of La3+ ion (1.216 Å) and Eu3+ ion (1.120 Å).34 The Cr3+ ion would prefer to go at the La-site to maintain the charge balance in the LaVO4 phosphor.
| Compound | Lattice parameters (α = γ = 90°) | Unit cell volume V (Å3) | χ2 | |||
|---|---|---|---|---|---|---|
| a (Å) | b (Å) | c (Å) | β (°) | |||
| LaVO4:1Eu3+ | 7.0388(2) | 7.2771(2) | 6.7200(2) | 104.831(2) | 332.75(2) | 1.90 |
| LaVO4:1Eu3+:0.01Cr3+ | 7.0393(1) | 7.2766(1) | 6.7194(1) | 104.837(2) | 332.71(1) | 1.76 |
| LaVO4:1Eu3+:0.05Cr3+ | 7.0389(2) | 7.2762(2) | 6.7195(2) | 104.839(2) | 332.67(2) | 1.78 |
| LaVO4:1Eu3+:0.1Cr3+ | 7.0390(2) | 7.2760(2) | 6.7191(2) | 104.837(2) | 332.65(2) | 1.63 |
3.2. Microstructural analysis
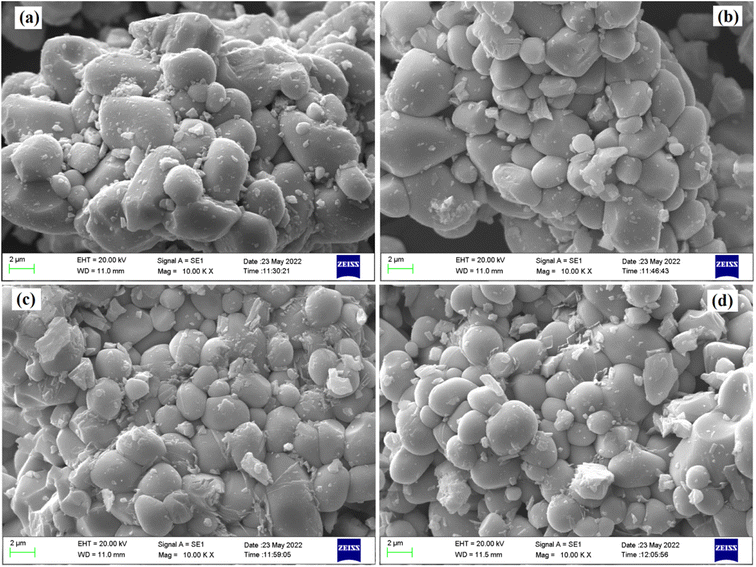
The microstructure of all the phosphor samples has been studied with the help of scanning electron microscopy (SEM) images, at a magnification of 10 K× and a scale of 2 μm. Fig. 3a–d displays SEM micrographs for the LaVO4:1Eu3+, LaVO4:1Eu3+:0.01Cr3+, LaVO4:1Eu3+:0.05Cr3+ and LaVO4:1Eu3+:0.1Cr3+ phosphor powder samples, respectively. The SEM images of the samples reveal that the particles size of the phosphor samples decreases as the doping concentration of the Cr3+ ions is increased. The particles of these phosphors are somewhat aggregated and most of the particles are spherical in shape (see Fig. 3). The particles size of the phosphor samples in general lies in the sub-micron to micron range; however, the average particles size in the present case is in the micron range. Thus, the average particles size of the phosphor samples has been calculated using ImageJ software. The mean value of the particles size was found to be 4.05, 3.47, 3.18 and 2.89 μm for the LaVO4:1Eu3+, LaVO4:1Eu3+:0.01Cr3+, LaVO4:1Eu3+:0.05Cr3+ and LaVO4:1Eu3+:0.1Cr3+ phosphors, respectively. This clearly shows that the particles size reduces on doping/co-doping of Eu3+ and Cr3+ ions.3.3. Compositional analysis
Qualitative compositional analyses of the LaVO4:1Eu3+, LaVO4:1Eu3+:0.01Cr3+, LaVO4:1Eu3+:0.05Cr3+ and LaVO4:1Eu3+:0.1Cr3+ phosphor samples have been carried out by monitoring energy dispersive X-ray spectroscopy (EDS) spectra of the phosphor samples at the time during the SEM micrographs measurements. The EDS spectra of the LaVO4:1Eu3+, LaVO4:1Eu3+:0.01Cr3+, LaVO4:1Eu3+:0.05Cr3+ and LaVO4:1Eu3+:0.1Cr3+ phosphors are presented in Fig. 4a–d, respectively. The occurrence of the characteristic peaks corresponding to the component atoms, i.e., La, Eu/Cr, V and O in the EDS spectra exhibits the presence of the component elements. As the EDS method is not suitable for the quantitative analysis of the light elements only qualitative analysis was performed.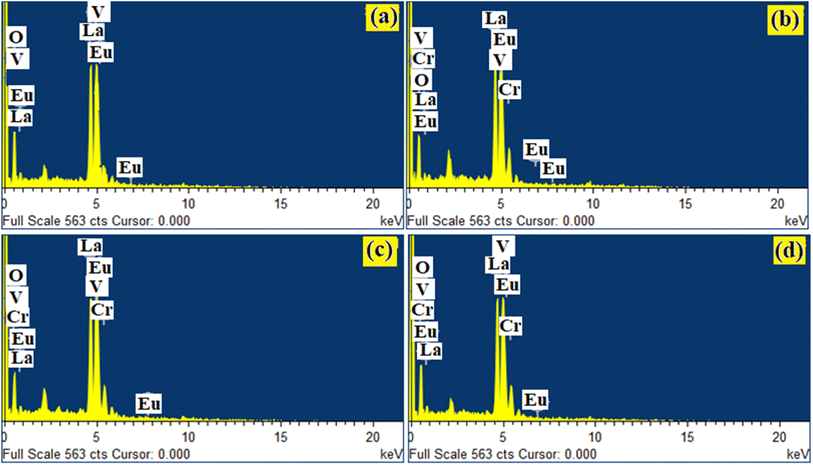 | ||
| Fig. 4 EDS spectra for Eu3+ and Eu3+ + Cr3+ co-doped LaVO4 phosphors i.e. (a) LaVO4:1Eu3+, (b) LaVO4:1Eu3+:0.01Cr3+, (c) LaVO4:1Eu3+:0.05Cr3+ and (d) LaVO4:1Eu3+:0.1Cr3+ phosphors. | ||
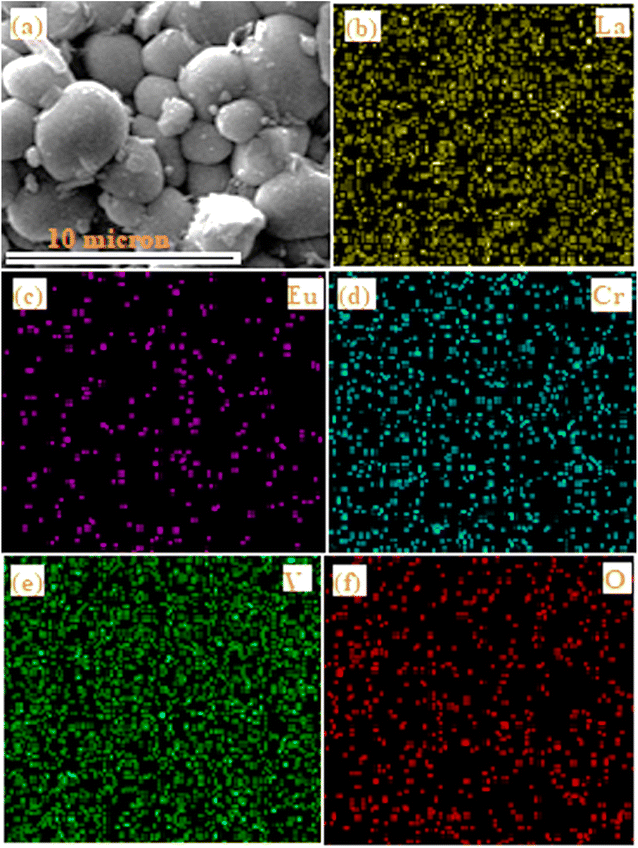
Fig. 5 displays the selected area used for elemental mapping for the elements La, Eu, Cr, V and O present in the LaVO4:1Eu3+:0.1Cr3+ phosphor. The elemental mapping clearly demonstrates the homogeneous distribution of the elements (i.e., La, Eu, Cr, V and O) present in the phosphor sample.
3.4. Optical measurements
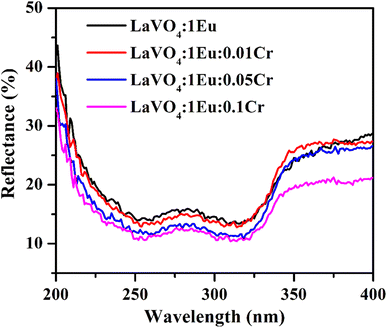 | ||
| Fig. 7 The UV-vis absorption spectra of LaVO4:1Eu3+, LaVO4:1Eu3+:0.01Cr3+, LaVO4:1Eu3+:0.05Cr3+ and LaVO4:1Eu3+:0.1Cr3+ phosphor samples. | ||
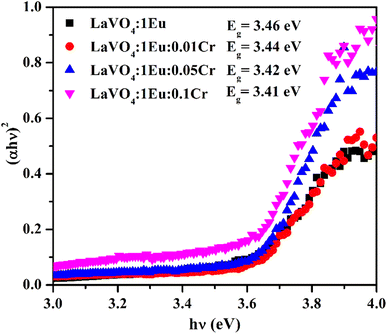
We have also monitored the absorption spectra of the samples in Kubelka–Munk (KM) mode to determine the optical band gap of LaVO4 and its dependence on different doping concentrations of Cr3+ ions. The Kubelka–Munk (KM) function is given as:39–42
 | (i) |
 | (ii) |
This relation is also called as Wood and Tauc formula (41) where Eg, hν and B specify the optical band gap, energy of incident photon and the band tailoring parameter, respectively. The value of m is taken  supposing the case to be of direct optical band gap.39–42 Therefore,
 | (iii) |
or
 | (iv) |
 , then (αhν)2 = (hν − Eg)
A graph between [αhν]2 versus hν also called as Wood and Tauc plot for different phosphor samples are shown in Fig. 8. The intercepts of the tangents on the curves on X-axis directly give the band gap. The band gap values for different concentrations of Cr3+ ions are given in the figure. This clearly shows that the optical band gap decreases with the increase in the concentration of Cr3+ ion, which is due to metallic nature of phosphor samples.43,44
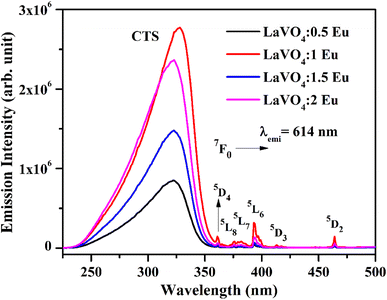 | ||
| Fig. 9 Photoluminescence excitation (PLE) spectra of LaVO4:xEu3+ (where x = 0.5, 1.0, 1.5, 2.0 mol%) phosphors monitored at λemi = 614 nm. | ||
We have monitored the photoluminescence (PL) emission spectra of LaVO4:xEu3+ (where x = 0.5, 1.0, 1.5 and 2.0 mol% Eu3+) exciting at 316 and 393 nm wavelengths in the range 500–800 nm. In all the cases, we have observed intense bands in between 520-700 nm regions due to 5D0 → 7FJ transitions.11–23,32,33 The intensity of emission bands on excitation with CTB wavelength is nearly 10 times larger than on excitation with discrete bands of Eu3+ ion i.e. at 393 nm. The photoluminescence emission spectra on excitation with these wavelengths are shown in Fig. 10a and b.
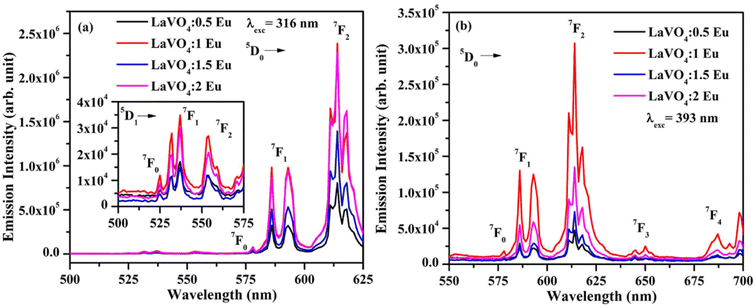 | ||
| Fig. 10 Photoluminescence (PL) emission spectra of LaVO4:xEu3+ phosphors on excitation with (a) 316 nm and (b) 393 nm (where x = 0.5, 1.0, 1.5, 2.0 mol%). | ||
As mentioned earlier, the bands observed between 570–700 nm are due to 5D0 → 7FJ transitions of Eu3+ ion in which the band at 614 nm due to 5D0 → 7F2 transition is very intense. The other observed bands are due to 5D0 → 7F0 (579 nm), 5D0 → 7F1 (582 and 591 nm), 5D0 → 7F3 (644 nm) and 5D0 → 7F4 (700 nm) transitions.11–23,32,33,45,46 The intensity of the bands follows the 7F2 > 7F1 > 7F4 > 7F3 > 7F0 trends. Though the excitation wavelengths (316 and 393 nm) populate high lying levels of Eu3+ ion; however, due to closeness of the energy levels, the excited Eu3+ ions relax rapidly to low lying 5D1 and 5D0 excited states. It is due to this reason that the observed emission bands are arising from these two lower lying levels. The weak emission bands in the green region are due to 5D1 → 7F0 (525 nm), 5D1 → 7F1 (537 and 531 nm) and 5D1 → 7F2 (565 nm) transitions, which are reported only in few host materials.46,47 The emission bands from 5D1 level is observed only on excitation with 316 nm wavelength.
The 5D0 → 7F2 transition occurs due to change in electric dipole moment. Its intensity depends on the external conditions. However, the 5D0 → 7F1 transition is magnetic dipole allowed transition and it is independent of the local environment round the Eu3+ ions. The 5D0 → 7F3 has an electric and magnetic dipole mixed character. On the other hand, 5D0 → 7F4 is forced electric dipole transition. Thus, the electric dipole allowed transitions have larger intensity compared to the magnetic dipole allowed transitions.11–23,32,33 Actually, the doping of Eu3+ ion in the LaVO4 host replaces La3+ ion and forms EuO9 instead of LaO9 in the case of monoclinic structure of LaVO4 host. The EuO9 in LaVO4 host forms a highly asymmetric structure, which is the basic reason for large PL intensity.
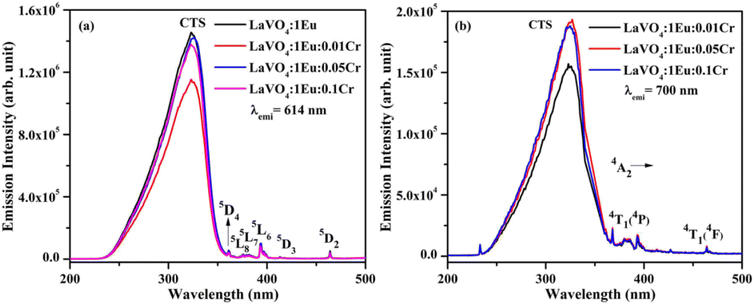 | ||
| Fig. 11 Photoluminescence excitation (PLE) spectra of LaVO4:1Eu3+:yCr3+ (where y = 0, 0.01, 0.05, 0.1 mol%) phosphors monitored at λemi = (a) 614 nm and (b) 700 nm. | ||
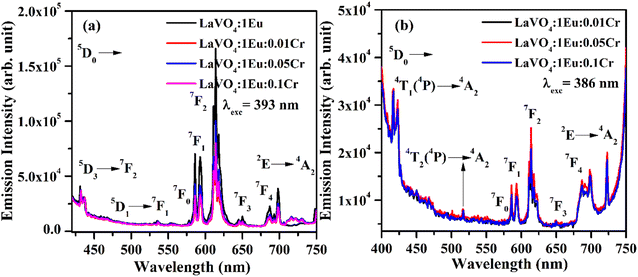
The PL spectra of LaVO4:1Eu3+, LaVO4:1Eu3+:0.01Cr3+, LaVO4:1Eu3+:0.05Cr3+ and LaVO4:1Eu3+:0.1Cr3+ phosphor samples were monitored on excitation with 393 and 386 nm and they are shown in Fig. 12a and b. The PL spectra of these phosphor samples in the range of 420–750 nm show similar emission bands on excitation with 393 nm (see Fig. 10b). However, some additional emission bands are observed at 431 and 536 nm, which are assigned to arise due to 5D3 → 7F2 and 5D1 → 7F1 transitions of Eu3+ ion, respectively. The emission intensity of Cr3+ doped LaVO4:1Eu3+ phosphor is slightly reduced on excitation with these wavelengths. It is also clear from Fig. 12a that the pure LaVO4:1Eu3+ phosphor does not contain any emission band due to Cr3+ ion. When Cr3+ ion is doped in the LaVO4:1Eu3+ phosphor; an additional broad emission band is observed in the range of 700–735 nm, which occurs due to 2E → 4A2 transition of Cr3+ ion.34,38 This additional band alongwith the other emission bands are clearly observed by exciting the phosphor samples at 386 nm in the range of 400–750 nm. In this case, the PL spectra contain additional broad emission bands at 417, 518 and (700 and 725 nm) clearly due to Cr3+ ion with weak PL intensity (see Fig. 12b) and they are assigned to arise due to 4T1(4P) → 4A2, 4T2(4P) → 4A2 and 2E → 4A2 transitions of Cr3+ ion, respectively.34,38
The LaVO4:1Eu3+ phosphor gives poor PL intensity due to the reason that 386 nm wavelength also excites the Eu3+ ion weakly. However, the PL intensity of 614 nm band is relatively larger than that of 700 nm band. The increasing concentration of Cr3+ ion reduces the PL intensity of Eu3+ as well as Cr3+ emission bands. This is due to energy transfer from Eu3+ to Cr3+ ions. Actually, the energy level 4T2(4F) of Cr3+ ion lies in the red region at 15![[thin space (1/6-em)]](https://www.rsc.org/images/entities/char_2009.gif) 773 cm−1 while that of 4T1(4F) lies in the green region at 17
773 cm−1 while that of 4T1(4F) lies in the green region at 17![[thin space (1/6-em)]](https://www.rsc.org/images/entities/char_2009.gif) 211 cm−1. On the other hand, the 5D0 level of Eu3+ ion is found to lie at 17
211 cm−1. On the other hand, the 5D0 level of Eu3+ ion is found to lie at 17![[thin space (1/6-em)]](https://www.rsc.org/images/entities/char_2009.gif) 267 cm−1. The 4T1(4F) level of Cr3+ ion lies close but slightly below to the 5D0 level of Eu3+ ion. On excitation of Eu3+ ion, a small amount of energy is transferred to Cr3+ ion, which decreases the PL intensity of Eu3+ ion.47,48 This clearly shows that the Cr3+ ion works as intensity quencher even for smaller concentration of Cr3+ ion. This can be well reflected in the lifetime measurements as the lifetime of 5D0 level of 5D0 → 7F2 transition at 614 nm is expected to decrease with the concentration of Cr3+ ion.
267 cm−1. The 4T1(4F) level of Cr3+ ion lies close but slightly below to the 5D0 level of Eu3+ ion. On excitation of Eu3+ ion, a small amount of energy is transferred to Cr3+ ion, which decreases the PL intensity of Eu3+ ion.47,48 This clearly shows that the Cr3+ ion works as intensity quencher even for smaller concentration of Cr3+ ion. This can be well reflected in the lifetime measurements as the lifetime of 5D0 level of 5D0 → 7F2 transition at 614 nm is expected to decrease with the concentration of Cr3+ ion.
 | (v) |
 | (vi) |
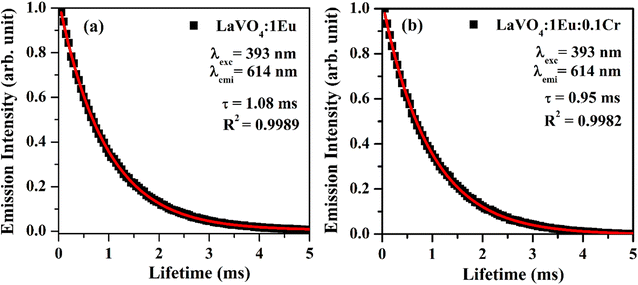 | ||
| Fig. 13 Fluorescence decay curves of (a) LaVO4:1Eu3+ and (b) LaVO4:1Eu3+:0.1Cr3+ phosphor samples for 5D0 → 7F2 transition on excitation with 393 nm. | ||
As is clear from the Fig. 13, the double exponential fitting reproduced the decay curves in a better way. The average lifetime was calculated using the following relation:34
 | (vii) |
We have measured the lifetime of 5D0 level of Eu3+ in the case of LaVO4:1Eu3+ and LaVO4:1Eu3+:0.1Cr3+ phosphor samples. It was found that the lifetime of the 5D0 level decreases with the addition of Cr3+ ion. This also supports the energy transfer from Eu3+ to Cr3+ ions,48 which quenches the PL intensity of the phosphor.
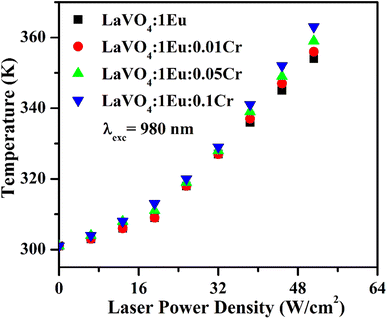
The heat generated in the phosphor samples at different power densities of 980 nm is shown in Fig. 14. In the case of pure LaVO4 phosphor, the temperature generated is 336 K at 64 W cm−2 power density.34 This value is increased to 354 K at 51.2 W cm−2 in the case of LaVO4:1Eu3+ phosphor. Above 51.2 W cm−2, the phosphor sample starts burning. The heat generated is increased further via Cr3+ doping and it increases with the increase of concentration of Cr3+ ion. We have measured the heat generated in the LaVO4:1Eu3+, LaVO4:1Eu3+:0.01Cr3+, LaVO4:1Eu3+:0.05Cr3+ and LaVO4:1Eu3+:0.1Cr3+ phosphor samples on excitation at different power densities. The heat generated in the samples also depends on the NIR radiation absorbed by the samples. Since the Eu3+ and Cr3+ ions absorb the NIR radiation it may also be contributing to the heat generation. The brown color of these phosphor samples is an additional feature for generating large heat. A higher heat is generated in the colored phosphor samples, which is due to excitation of thermal phonons.
4. Conclusions
The Eu3+, Cr3+ doped and co-doped LaVO4 phosphors were synthesized by high temperature solid-state reaction method. The powder XRD patterns of phosphors are of crystalline nature. The particles of phosphor samples are spherical with their size in the sub-micron to micron range. The La, Eu, Cr, V and O elements are present in the Eu3+, Cr3+ co-doped LaVO4 phosphor. The FTIR spectra show the absorption bands due to La–O and V–O groups. The optical band gap of phosphor decreases on increasing concentration of Cr3+ ion. The Eu3+ doped LaVO4 phosphor was excited at 393 and 316 nm wavelengths, which gives intense red color at 614 nm due to 5D0 → 7F2 transition of Eu3+ ion. When the Cr3+ ion is doped in the Eu3+:LaVO4 phosphor; the emission intensity of phosphor is found to decrease due to energy transfer from Eu3+ to Cr3+ ions. The lifetime of 5D0 level of the Eu3+ ion also decreases in the Eu3+, Cr3+ co-doped LaVO4 phosphor due to energy transfer. The Eu3+, Cr3+ doped/co-doped LaVO4 phosphors also produces heat under 980 nm excitations. Therefore, the Eu3+, Cr3+ co-doped LaVO4 phosphor may be used for LEDs and heat generating devices.Conflicts of interest
There are no conflicts of interest to declare.References
- J. C. G. Bünzli, On the design of highly luminescent lanthanide complexes, Coord. Chem. Rev., 2015, 293–294, 19–47 CrossRef.
- R. Cao, W. Shao, Y. Zhao, T. Chen, H. Ao, S. Guo, P. Liu and T. Fan, Orange-red-emitting CaTi4(PO4)6:Eu3+ phosphor for white LEDs: synthesis and luminescence properties, Appl. Phys. A, 2020, 126, 267 CrossRef CAS.
- Y. R. Parauha, R. S. Yadav and S. J. Dhoble, Enhanced photoluminescence via doping of phosphate, sulphate and vanadate ions in Eu3+ doped La2(MoO4)3 downconversion phosphors for white LEDs, Opt. Laser Technol., 2020, 124, 105974 CrossRef CAS.
- S. P. Tiwari, S. K. Maurya, R. S. Yadav, A. Kumar, V. Kumar, M. F. Joubert and H. C. Swart, Future prospects of fluoride based upconversion nanoparticles for emerging applications in biomedical and energy harvesting, J. Vacuum Sci. Technol. B, 2018, 36, 060801 CrossRef.
- B. K. Gupta, D. Haranath, S. Saini, V. N. Singh and V. Shanker, Synthesis and characterization of ultra-fine Y2O3:Eu3+ nanophosphors for luminescent security ink applications, Nanotechnol, 2010, 21, 055607 CrossRef.
- R. S. Yadav, S. J. Dhoble and S. B. Rai, Enhanced photoluminescence in Tm3+, Yb3+, Mg2+ tri-doped ZnWO4 phosphor: Three photon upconversion, laser induced optical heating and temperature sensing, Sens. Actuat. B: Chem., 2018, 273, 1425–1434 CrossRef CAS.
- G. S. Maciel, A. Biswas and P. N. Prasad, Infrared-to-visible Eu3+ energy upconversion due to cooperative energy transfer from Yb3+ ion pair in a sol-gel processed multi-component silica glass, Opt. Commun., 2000, 178, 65–69 CrossRef CAS.
- T. H. Maiman, Stimulated Optical Radiation in Ruby, Nature, 1960, 187, 493–494 CrossRef.
- A. Haque, M. S. H. Faizi, J. A. Rather and M. S. Khan, Next generation NIR fluorophores for tumor imaging and fluorescence-guided surgery, Bioorg. Med. Chem., 2017, 25, 2017–2034 CrossRef CAS.
- S. A. Hildenbrand and R. Weissleder, Near-infrared fluorescence: application to in vivo molecular imaging, Curr. Opin. Chem. Biol., 2010, 14, 71–79 CrossRef.
- S. W. Park, H. K. Yang, J. W. Chung, B. K. Moon, B. C. Choi and J. H. Jeong, Enhanced red emission in LaVO4:Eu3+ phosphor by Li+ doping, J. Korean Phys. Soc., 2010, 57, 1764–1768 CrossRef CAS.
- C. K. Chang and T. M. Chen, Sr3B2O6:Ce3+:Eu3+: A potential single-phased white-emitting borate phosphor for ultraviolet light-emitting diodes, Appl. Phys. Lett., 2007, 91, 81902 CrossRef.
- R. S. Yadav and S. B. Rai, Structural analysis and enhanced photoluminescence via host sensitization from a lanthanide doped BiVO4 nano-phosphor, J. Phys. Chem. Solids, 2017, 110, 211–217 CrossRef CAS.
- M. Dalal, V. B. Taxak, S. Chahar, J. Dalal, A. Khatkar and S. P. Khatkar, Judd-Ofelt and structural analysis of color tunable BaY2ZnO5:Eu3+ nanocrystals for single-phased white LEDs, J. Alloys Compd., 2016, 686, 366 CrossRef CAS.
- S. Yadav, D. Kumar, R. S. Yadav, S. B. Rai and A. K. Singh, Structural and wavelength dependent optical properties of La1-xEuxCoO3 perovskite phosphor, Ceram. Int., 2022, 48, 30754–30766 CrossRef CAS.
- Z. Zhang, J. Shi, J. Tan, X. Wang and M. Gong, Morphology-controllable synthesis of tetragonal LaVO4:Eu3+ nanostructures, CrystEngComm, 2010, 12, 1079–1085 RSC.
- R. V. Deun, M. D’hooge, A. Savic, I. Driessche, K. V. Hecke and A. M. Kaczmarek, Influence of Y3+, Gd3+ and Lu3+ co-doping on the phase and luminescence properties of monoclinic Eu3+: LaVO4 particles, Dalton Trans., 2015, 44, 18418 RSC.
- R. S. Yadav, Y. Dwivedi and S. B. Rai, Structural and optical properties of Eu3+, Sm3+ co-doped La(OH)3 nano-crystalline red emitting phosphor, Spectrochim. Acta, Part A, 2014, 132, 599–603 CrossRef CAS.
- A. Szczeszak, T. Grzyb, Z. Śniadecki, N. Andrzejewska, S. Lis, M. Matczak, G. Nowaczyk, S. Jurga and B. Idzikowski, Structural, Spectroscopic, and magnetic properties of Eu3+ doped GdVO4 nanocrystals synthesized by hydrothermal method, Inorg. Chem., 2014, 53, 12243–12252 CrossRef CAS PubMed.
- K. Wang, Y. Liu, G. Tan, D. Liu, S. Ma and M. Zhao, Structure, luminescence and energy transfer of LiLa(MoO4)2:Dy3+, Eu3+ crystal, J. Lumin., 2018, 197, 354–359 CrossRef CAS.
- W. Xie, J. Feng, X. Liu, L. Yan, H. Guo, Y. Dai, Y. Xie, H. S. Jang and J. Lin, Multi-color luminescence evolution of SrGdAlO4:Ln3+ (Ln3+ = Eu3+ and/or Tb3+) nanocrystalline phosphors via a sol-gel process, J. Alloys Compd., 2018, 753, 781–790 CrossRef CAS.
- A. R. Kadam, R. S. Yadav, G. C. Mishra and S. J. Dhoble, Effect of singly, doubly and triply ionized ions on downconversion photoluminescence in Eu3+ doped Na2Sr2Al2PO4Cl9 phosphor: A comparative study, Ceram. Int., 2020, 46, 3264–3274 CrossRef CAS.
- G. Zhu, Z. Li, C. Wang, F. Zhou, Y. Shi, Y. Wen and J. Xin, Crystal structure and characteristic luminescence properties investigation of novel red-emitting phosphor Na3MgZr(PO4)3:Eu3+ for white light-emitting diodes, J. Mater. Sci.: Mater. Electron., 2018, 28, 2216 CrossRef.
- Z. Chen, W. Zheng, P. Huang, D. T. Tu, S. Y. Zhou, M. D. Huang and X. Y. Chen, Lanthanide-doped luminescent nano-bioprobes for the detection of tumor markers, J. Nanoscale, 2015, 7, 4274–4290 RSC.
- J. W. Stouwdam, M. Raudsepp and F. C. J. M. Van Veggel, Colloidal nanoparticles of Ln3+ - doped LaVO4, energy transfer to visible and near-infrared-emitting lanthanide ions, Langmuir, 2005, 21, 7003–7008 CrossRef CAS.
- K. Qiu, J. Li, J. Li, X. Lu, Y. Gong and J. Li, Luminescence property of Ca3(VO4)2:Eu3+ dependence on molar ratio of Ca/V and solution combustion synthesis temperature, J. Mater. Sci., 2010, 45, 5456–5462 CrossRef CAS.
- J. Ma, Q. Wu and Y. Ding, Selective synthesis of monoclinic and tetragonal phase LaVO4 nanorods via oxides-hydrothermal route, J. Nanopart. Res., 2008, 10, 775–786 CrossRef CAS.
- R. Okram, N. Yaiphaba, R. S. Ningthoujam and N. R. Singh, Is higher ratio of monoclinic to tetragonal in LaVO4 a better luminescence host? Redispersion and polymer film formation, Inorg. Chem., 2014, 53, 7204–7213 CrossRef CAS PubMed.
- R. Marikumar and S. Vaidyanathan, Systematic investigation of Eu3+ activated Na2Ln4(MoO4)7 [Ln3+ = La3+, Gd3+ and Y3+] narrow band red emitting phosphors for hybrid white LEDs and plant growth, New J. Chem., 2020, 44, 14823–14836 RSC.
- P. Singh, R. S. Yadav and S. B. Rai, Enhanced photoluminescence in a Eu3+ doped CaTiO3 perovskite phosphor via incorporation of alkali ions for white LEDs, J. Phys. Chem. Solids, 2021, 151, 109916 CrossRef CAS.
- Y. F. Wu, Y. T. Nien, Y. J. Wang and I. G. Chen, Enhancement of photoluminescence and color purity of CaTiO3:Eu phosphor by Li doping, J. Am. Ceram. Soc., 2012, 95, 1360–1366 CrossRef CAS.
- E. Rai, R. S. Yadav, D. Kumar, A. K. Singh, V. J. Fulari and S. B. Rai, Influence of Bi3+ ion on structural, optical, dielectric and magnetic properties of Eu3+ doped LaVO4 phosphor, Spectrochim. Acta, Part A, 2020, 243, 118787 CrossRef CAS.
- E. Rai, R. S. Yadav, D. Kumar, A. K. Singh, V. J. Fulari and S. B. Rai, Improved photoluminescence in Eu3+ doped LaVO4 phosphor via co-doping of Li+/Ca2+ ions, Lumin, 2022, 241, 118519 CrossRef CAS.
- E. Rai, R. S. Yadav, D. Kumar, A. K. Singh, V. Fullari and S. B. Rai, Structural and photoluminescence properties of Cr3+ doped LaVO4 phosphor, Solid State Sci., 2022, 129, 106904 CrossRef CAS.
- Z. Pan, Y. Y. Lu and F. Liu, Sunlight-activated long-persistent luminescence in the near-infrared from Cr3+-doped zinc galogermanates, Nat. Mater., 2012, 11, 58–63 CrossRef CAS PubMed.
- K. DeArmond and L. S. Forster, Electronic transitions in chromium (III) complexes-II: emission spectra and π-delocalization parameters, Spectrochim. Acta, Part A, 1963, 19, 1403–1406 CrossRef CAS.
- D. Chen, Y. Chen, H. Lu and Z. Ji, A bifunctional Cr/Yb/Tm:Ca3Ga2Ge3O12 Phosphor with near-infrared long-lasting phosphorescence and upconversion luminescence, Inorg. Chem., 2014, 53, 8638–8645 CrossRef CAS PubMed.
- L. Li, Y. Yu, G. Wang, H. Zhang and Z. Lin, Crystal growth, spectroscopic properties and energy levels of Cr3+:Li2Mg2(WO4)3 a candidate for broadband laser application, RSC Adv., 2014, 4, 37041–37046 RSC.
- R. S. Yadav, D. Kumar, A. K. Singh, E. Rai and S. B. Rai, Effect of Bi3+ ion on upconversion-based induced optical heating and temperature sensing characteristics in the Er3+/Yb3+ co-doped La2O3 nano-phosphor, RSC Adv., 2018, 8, 34699–34711 RSC.
- R. S. Yadav, Energy transfer induced color tunable photoluminescence in Tb3+/Sm3+ co-doped Y2O3 nano-phosphor for warm white LEDs, J. Alloys Compd., 2023, 931, 167579 CrossRef CAS.
- D. L. Wood and J. Tauc, Weak absorption tails in amorphous semiconductors, Phys. Rev. B, 1972, 5, 3144–3151 CrossRef.
- Monika, R. S. Yadav, A. Bahadur and S. B. Rai, Near-infrared light excited highly pure green upconversion photoluminescence and intrinsic optical bistability sensing in a Ho3+/Yb3+ co-doped ZnGa2O4 Phosphor through Li+ doping, J. Phys. Chem. C, 2020, 124(18), 10117–10128 CrossRef CAS.
- R. S. Yadav, Monika, E. Rai, L. P. Purohit and S. B. Rai, Realizing enhanced downconversion photoluminescence and high color purity in Dy3+ doped MgTiO3 phosphor in presence of Li+ ion, J. Lumin., 2020, 217, 116810 CrossRef CAS.
- Monika, R. S. Yadav, A. Rai and S. B. Rai, NIR light guided enhanced photoluminescence and temperature sensing in Ho3+/Yb3+/Bi3+ co-doped ZnGa2O4 phosphor, Sci. Rep., 2021, 11, 4148 CrossRef CAS.
- C. S. Vandana and B. H. Rudramadevi, The effect of Mg2+ concentration on structural and luminescent properties of CaTiO3: Eu3+ phosphor, Ferroelect, 2018, 524, 168–180 CrossRef CAS.
- F. Li, X. Liu and T. He, Solid state synthesis of CaTiO3:Dy3+/Eu3+ phosphors towards white light emission, Chem. Phys. Lett., 2017, 78, 686 Search PubMed.
- A. J. S. Silva, P. A. M. Nascimento, I. S. da Carvalho, W. S. Silveira and M. V. dos Santos Rezende, Mechanisms and dynamics of energy transfer sensitization in the Eu3+, Cr3+ and Fe3+ ions in the LiAl5O8 phosphors, Opt. Mater., 2022, 128, 112420 CrossRef CAS.
- L.-M. Shao, J.-Q. Zhao, Z.-G. Xia and X.-P. Jing, Photoluminescence and energy transfer of Eu2+, Cr3+ co-doped MgSrAl10O17, J. Electrochem. Soc., 2011, 158, J300–J304 CrossRef CAS.
| This journal is © The Royal Society of Chemistry 2023 |

