 Open Access Article
A facile synthesis of highly efficient In2S3 photocatalysts for the removal of cationic dyes with size-dependent photocatalysis†
Chaofan Zheng‡
a,
Ziyao Wang‡a,
Jialong Yuana,
Qingfeng Xua,
Haixin Lia,
Xiaoyi Lua,
Jiangang Gao*ab and
Wenjin Yue *ab
*ab
aSchool of Chemical and Environmental Engineering, Anhui Polytechnic University, Wuhu, 241000, P.R. China. E-mail: gaojiangang@ahpu.edu.cn
bAnhui Laboratory of Clean Energy Materials and Chemistry for Sustainable Conversion of Natural Resources, Wuhu, 241000, P.R. China. E-mail: yuewenjin_79@163.com
First published on 31st January 2023
Abstract
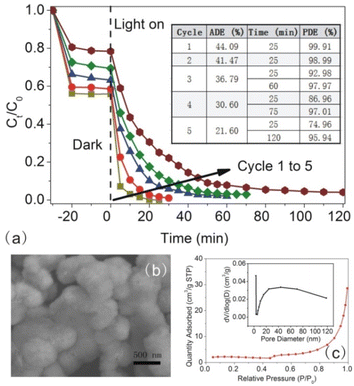
In this study, a 3D thornball-like hierarchical β-In2S3, displaying extremely rapid photodegradation of cationic dyes, was synthesized by a facile method. The formation of a uniform thornball-like structure depended on the microwave reaction method and citric acid as the pH regulator. The size of In2S3 was easily adjusted by changing the microwave irradiation time from 5 min to 15 min. The morphology, structure, composition, energy level, charge separation, and surface properties of different-sized In2S3 were characterized. The results showed that In2S3 synthesized in 10 min (In2S3-10) displayed optimal interface property for the electron–hole separation, maximum hydrophilia with most surface negative charges for the surface adsorption, contributing to the complete photodegradation of rhodamine B (RhB) in just 25 minutes of visible light illumination. The photodegradation path of RhB was speculated with four possible paths, including the processes of de-ethylation, open-ring of xanthene, and rupture of carbon–carbon bonds up to the decomposition into small molecules. Finally, the reusability of In2S3-10 was tested, obtaining nearly 96% photodegradation efficiency after sequential 5 cycles.
1 Introduction
Recently, air and water pollution are major environmental problems threatening human health. The most ideal and feasible strategy to solve the problem is semiconductor photocatalytic technology. Common semiconductor photocatalysts such as TiO2, CdS, ZnS have been studied previously.1 However, these photocatalysts either do not have the high efficiency as TiO2 or2 do not have high stability as CdS and ZnS.3,4 Therefore, it is important to synthesize practical photocatalysts for application in photocatalytic technology. Normally, the synthesis strategy involves structural and compositional optimization because the photocatalysis is strongly dependent on crystal morphologies and structural features at the nanometer level.5Indium sulphide is a nontoxic III–VI group semiconductor, as the most stable crystal phase, β-In2S3 displays the narrow bandgap of 1.9–2.3 eV.6 Many inherent vacancies are conducive to forming the transition defect zones in β-In2S3, contributing to the excellent light-harvesting ability in visible light range.7 Ordinary nano-photocatalysts with large specific surface areas have numerous surface active sites; however, the easy agglomeration results in considerable surface active sites being ineffective.8 Micro/nano hierarchical photocatalysts can retain the advantages of nano-photocatalysts by avoiding agglomeration effectively, for example, their large interface area not only affords abundant active sites for better contact of pollutant with catalyst but also contribute to the high separation of electron–hole pairs.5 Previous reports have confirmed that the application of 3D ZnO in the photodegradation of methyl orange displayed higher performance than ZnO fragments.9 Therefore, it is suggested that micro/nano hierarchical In2S3 has special advantages in the photocatalysis. Previously, micro/nano hierarchical In2S3 has been prepared by a solvothermal method10–15 or a hot injection method.16,17 However, the solvothermal reaction requires high temperature as 150–195 °C and a long reaction time of 2–30 h, and the hot injection method demands complicated reagents or surfactant (glycerinum, myristic acid, and octadecene) to react under an inert gas atmosphere at high temperature.
Based on the direct coupling of microwave energy with a reactant, the microwave irradiation method presents a very fast reaction rate in material synthesis.18 The extremely fierce reaction driven by microwave energy contributed to the advantageous three-dimensional growth of the product.19 Thus, products tend to aggregate into hierarchical clusters with more uniform size distribution and more complete crystal morphology. By changing the reaction parameters, such as temperature, time, or microwave power, the size and morphology can be adjusted easily to obtain the controllable preparation of the photocatalysts with excellent surface properties for high photocatalysis. Previously, preparation of In2S3 nanoflowers by PVP-assisted microwave irradiation method,19 dandelion flower-like In2S3 by the microwave solvothermal method20 and dendrites-type In2S3 by the microwave irradiation method under nitrogen atmosphere21 have been reported. In these reactions, long-chained surfactants, high reaction temperature, or complicated process are needed, resulting in the following disadvantages inevitably. (1) The surfactant covers the surface of In2S3 to generate the charge transfer obstacle between the photocatalysts and organic pollutes; (2) high reaction temperature and the complicated process lead to increased environmental contamination and synthesis cost. Therefore, how to obtain desired 3D micro/nano hierarchical In2S3 by a facile method requires further exploration.
In this work, we put forward a facile microwave strategy to synthesize surfactant-free thornball-like hierarchical In2S3. All reagents are nontoxic with deionized water as the solvent, and the reaction is achievable as fast as 5 min at the low temperature of 90 °C. Furthermore, different-sized In2S3 were synthesized easily by adjusting the microwave reaction time, which was applied in the photodegradation of rhodamine B (RhB) to obtain size-dependent photocatalysis. Mid-sized In2S3 (In2S3-10) displayed excellent photocatalysis, which was much better than that previously reported In2S3 using a similar structure,22–26 confirming its potential application in the treatment of environmental pollutants. The corresponding explanation was given based on the synergistic effect from the surface adsorption of dye molecules followed by the oxygenolysis of active specifies.
2 Experimental
2.1 Chemicals
Indium chloride tetrahydrate (InCl3·4H2O, AR), thioacetamide (TAA, AR), citric acid (CA, AR), oxalic acid (AR), ethanol (AR), rhodamine B (RhB, AR), crystal violet (CV, AR), malachite green (MG, BS), methyl orange (MO, Ind), congo red (CR, Ind), acid red (AR, Ind), isopropanol (IPA, AR), triethanolamine (TEOA, AR) and benzoquinone (BQ, AR) were purchased from the Sinopharm Chemical Reagent Co, Ltd.2.2 Synthesis of In2S3 micro/nanoparticles
60 mL mixed solution containing InCl3·4H2O (0.025 mol L−1) and TAA (0.1 mol L−1) was adjusted to pH = 2.0 by CA. Then, the mixed solution was transferred to an XH-MC-1 microwave synthesis reactor to react at 90 °C, 200 W for 5, 10, and 15 min. After the reaction was completed, the products were centrifuged at 10![[thin space (1/6-em)]](https://www.rsc.org/images/entities/char_2009.gif) 000 rpm for 10 min followed by washing and drying to obtain yellow powders, named In2S3-5, In2S3-10, and In2S3-15. As a comparison, the synthesis conditions of In2S3-10 were changed as follows: (1) chemical bath deposition (CBD) was used instead of the microwave method; (2) no pH regulator was used; (3) oxalic acid instead of CA was used as a pH regulator.
000 rpm for 10 min followed by washing and drying to obtain yellow powders, named In2S3-5, In2S3-10, and In2S3-15. As a comparison, the synthesis conditions of In2S3-10 were changed as follows: (1) chemical bath deposition (CBD) was used instead of the microwave method; (2) no pH regulator was used; (3) oxalic acid instead of CA was used as a pH regulator.
2.3 Photocatalysis experiments
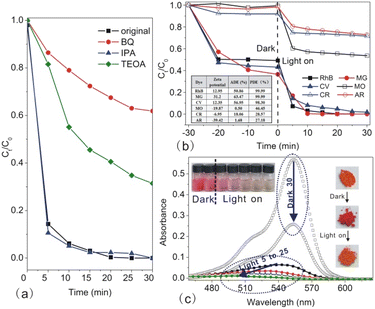
In2S3-5, In2S3-10, and In2S3-15 were used to carry out the photocatalysis experiments (S1 in the ESI†). To detect the active species in the photodegradation of RhB with In2S3-10, IPA (1 mM), TEOA (1 mM), and BQ (1 mM) were used as the scavengers for ˙OH, h+, and ˙O2−, respectively, by adding them in the system. The reusability of In2S3-10 was tested using the equivalent photocatalyst in every experiment.2.4 Characterization
The morphology of products was studied by scanning electron microscopy (FEI Sirion 200) and transmission electron microscopy (JEOL-2010). The crystal phase was measured using an X-ray diffractometer (MXP18AHF) with monochromated CuKα radiation (λ = 1.54056 Å). The optical measurements were performed by UV-vis diffused reflectance spectroscopy (UV 2550 spectrophotometer) and fluorescence spectra (an F-4500 spectrofluorometer) with an excitation wavelength of 218 nm. The photoelectrochemical measurements including cyclic voltammetry (C–V), linear sweep voltammetry (LSV), transient photocurrent-time (I–t) curves, and electrochemical impedance spectroscopy (EIS) were studied using a CHI-660C electrochemical workstation (S2 in the ESI†). The specific surface areas were measured on the NOVA 2000e instrument with Brunauer–Emmett–Teller (BET) method, and the pore-size distribution was estimated using the Barrett–Joyner–Halenda (BJH) method. The measurement of zeta potential was performed on Brookhaven 90 plus zeta potential analyser. The water contact angles were measured with a Kino SL250 contact angle meter (USA Kino Industry Co. Ltd). FT-IR spectra were recorded on a Nicolet Magna-IRTM 750 spectrometer. The photodegradation products were identified by liquid chromatography-mass spectrometry (Shimadzu LCMS-8030) with a mass scanning range of 50–450 m/z, similar to that reported in our previous paper.27,283 Results and discussion
3.1 Influence of synthetic condition on the morphology of In2S3
Fig. 1 shows the influence of the reaction method and the category of pH regulator. Fig. 1a and b show SEM images of In2S3 synthesized using CBD and the microwave method, respectively. With the CBD method, two morphologies of In2S3 including thornball-like structure with the size of 1–1.5 μm and irregular aggregated particles (as shown in a white dotted line) generated, however, the microwave method resulted in the formation of 500–600 nm sized uniform thornball-like structures. Furthermore, we changed the pH regulator, compared to that with CA as a pH regulator (Fig. 1b), extremely small-sized spherical nanoparticles were formed without the pH regulator (Fig. 1c), however, the oxalic acid regulator led to the formation of a flower-like structure with the size of 1 μm. Obviously, the microwave method contributed to the generation of monomorphic morphology, CA promoted the production of thornball-like structures. The formation of thornball-like In2S3 was possibly based on the followings. Firstly, In3+ coordinated with CA to form the In-CA compound. With the hydrolysis of TAA to release H2S, the In-CA compound was attacked by H2S to produce the In2S3 crystal nuclei followed by the oriented growth into nanoflakes. After more and more nanoflakes were formed, they tended to aggregate into hierarchical clusters as the microwave reaction promoted to three-dimensional growth of the products.19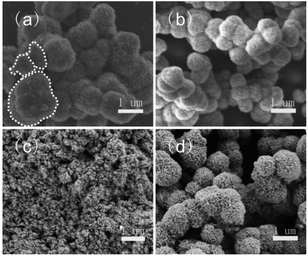 | ||
| Fig. 1 SEM images of In2S3 synthesized using different reaction methods as CBD (a) and microwave method (b–d), and different pH regulators, such s as CA (a and b), none (c), and oxalic acid (d). | ||
3.2 Characterization
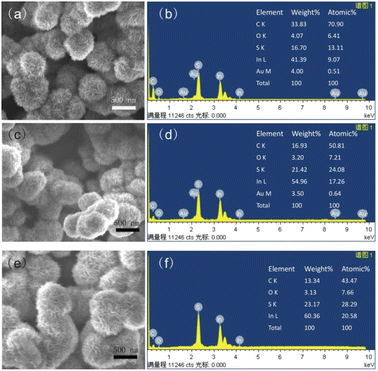 | ||
| Fig. 2 SEM (a) and EDS (b) of In2S3-5, SEM (c) and EDS (d) of In2S3-10, SEM (e) and EDS (f) of In2S3-15. | ||
The phase structure of the products was characterized from powder XRD (Fig. 3a). The diffraction peaks at 2θ = 27.4°, 33.2°, 43.6° and 47.7° matched with (109), (0012), (1015) and (2212) crystal planes of tetragonal β-In2S3 (a = b = 7.619 A, c = 32.329 A, JCPDS PCPDFWIN #25-0390), respectively.7,19 With the reaction time prolonging, the full-width half maximum (FWHM) of (2212) peak decreased (FWHM = 2.5°, 2.2° and 1.5° for In2S3-5, In2S3-10, and In2S3-15, respectively), implying that the average size of In2S3 increased. Additionally, the appearance of the sharper peaks in large-sized In2S3 indicated better crystallinity of the products.
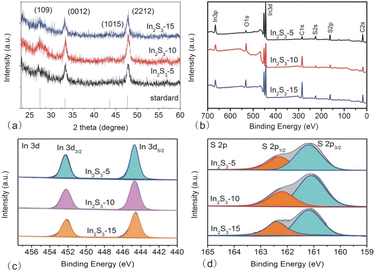 | ||
| Fig. 3 XRD (a), XPS survey (b), In spectrum (c), and S spectrum (d) of In2S3-5, In2S3-10, and In2S3-15. | ||
To characterize the product composition more accurately, XPS spectra were obtained. The survey spectrum displayed the existence of In, S, C, and O elements in three In2S3 samples (Fig. 3b). The oxygen peak originated from the adsorption of O2 or H2O molecules in the atmosphere onto the samples, while the carbon peak was due to the residual CA molecules and CO2 from the atmosphere.29 To obtain information on the valence states and binding energy, In and S spectra were collected. There were two peaks located at 445 eV and 452 eV in In 3d spectrum (shown in Fig. 3c), which corresponded to In 3d5/2 and In 3d3/2, respectively. The spin–orbit separation of In was 7 eV, indicating that In was present in the form of In(III). In the S 2p spectrum, two peaks at 161 eV and 162 eV related to S 2p3/2 and S 2p1/2 could be seen (shown in Fig. 3d). The spin–orbit separation of 1 eV suggested that S existed as S2− in the In2S3.22
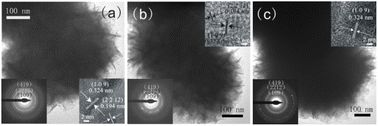
Fig. 4 shows TEM images of three In2S3. In2S3-5 displayed a 400–500 nm spherical structure assembled by 10–20 nm nanoflakes. The nanoflakes interleaved to form thornball-like structures with irregular edges (Fig. 4a). In2S3-10 presented similar morphology to In2S3-5 except for the increased size to 600–700 nm (Fig. 4b), and the size of In2S3-15 further increased to 700–800 nm (Fig. 4c). Obviously, as the reaction time increased, the size of the as-synthesized In2S3 increased largely. HRTEM images showed the interplanar spacing of 0.324 (or 0.323) nm and 0.194 nm corresponding to (109) and (2212) planes of β-In2S3. The polycrystalline rings, as indicated in SAED, resulted from (109), (2212), and (419) planes of tetragonal β-In2S3.
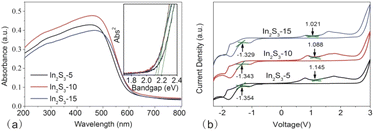 | ||
| Fig. 5 UV-vis DRS (a) and C–V curve (b) of In2S3-5, In2S3-10, and In2S3-15, the inset to (a) is the spectrum, which shows the determination of bandgap by the direct bandgap method. | ||
| sample | In2S3-5 | In2S3-10 | In2S3-15 |
|---|---|---|---|
| a Note: Eox and Ered represent the onset potential of the oxidation peak and reduction peak in C–V curves. | |||
| Eg−O (V) | 2.20 | 2.15 | 2.12 |
| EVB−cal (eV) | 1.30 | 1.28 | 1.26 |
| ECB−cal (eV) | −0.90 | −0.88 | −0.86 |
| Eox (V) | 0.651 | 0.647 | 0.602 |
| EVB−CV (eV) | 1.304 | 1.300 | 1.255 |
| Ered (V) | −1.402 | −1.364 | −1.345 |
| ECB−CV (eV) | −0.749 | −0.711 | −0.692 |
| Eg−E (V) | 2.053 | 2.011 | 1.947 |
C–V measurement is an effective method to obtain the energy level of nanoparticles.28,29 Based on the quantitative correlation between the band edge potential with the onset potential of the oxidation and reduction peaks (S3 in the ESI†), we obtained the ionization potential (IP) and the electron affinity (EA). From Fig. 5b, Eox negatively shifted gradually from In2S3-5 to In2S3-15, resulting in decreased IP, however, Eox positively shifted gradually for increased EA. With the size of In2S3 increasing, the electrochemical bandgap (Eg−E = IP − EA) decreased gradually.
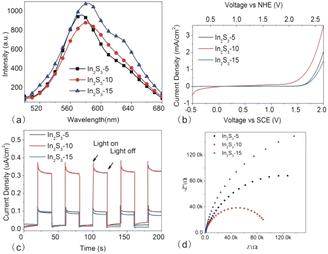
The photoelectrochemical measurements are useful to probe electron–hole separation. Fig. 6b showed LSV curves of In2S3 particles. The increase in the current density of In2S3-10 was significantly higher than that of In2S3-5 and In2S3-15, indicating that In2S3-10 had a faster transfer rate of the photogenerated electrons. Moreover, we compared the onset potential of three samples, which represented the position of the Fermi level.33 In2S3-10 with the low onset potential suggested the low potential for the photoanode to integrate with the photocathode, contributing to the efficient separation of the photogenerated carriers.
Fig. 6c shows the transient I–t curves of different-sized In2S3. Generally, strong photocurrent response under illumination implies high separation efficiency of the charge carrier. Among the three samples, In2S3-10 exhibited the highest photocurrent density, which was about three times that of the other two samples, indicating that the material was highly efficient in separating the photogenerated electron–hole pairs. It was noted that the photocurrent of three samples came back rapidly to zero once the light was switched off. Good reproducibility of the photocurrent suggested the rapid photoresponse and recovery properties of the as-synthesized photocatalysts.
EIS was performed to evaluate the charge transfer resistance of In2S3-5, In2S3-10, and In2S3-15 (as shown in Fig. 6d). The diameter of the semicircle (or arc) in the Nyquist plots at high frequency provided the information on the charge transfer, typically, small diameter represented the low charge transfer resistance (Rct).35 Obviously, In2S3-10 displayed the lowest Rct in three samples, indicating the fastest charge transfer rate from the photocatalyst to the photoelectrode,36 which was beneficial to the electron–hole separation.
 | ||
| Fig. 7 Nitrogen adsorption–desorption curves of In2S3-5 (a), In2S3-10 (b), and In2S3-15 (c) (the insets show the pore size distribution curves). | ||
Besides the specific surface areas, the groups adsorbed on the surface of catalysts which impact the hydrophilicity and surface charge also influence the catalysis. FT-IR spectra were recorded to probe the surface groups of the three samples (as shown in Fig. 8a). The peak at 806 cm−1 corresponding to the In–S vibration peak39,40, and that at 476 cm−1 corresponding to the In–O vibration peak41,42 were observed in all three samples. The presence of In–O vibration originated from the interaction of In3+ with the oxygen-containing surface functional groups in CA molecules.43 Compared to In2S3-5 and In2S3-15, In2S3-10 displayed stronger peaks of ν(O–H) at 3425 cm−1, 1627 cm−1 and ν(In–O–C) at 1078 cm−1,24 respectively, indicating that –OH groups were the main adsorbed surface groups. The presence of –OH groups from CA molecules confirmed that the generation of In2S3 was originated from the decompostion of In-CA compound.
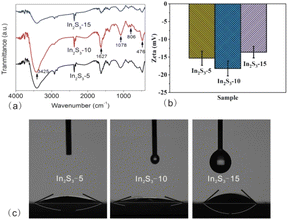 | ||
| Fig. 8 FT-IR spectra (a), zeta potential (b), and water contact angle measurements (c) of In2S3-5, In2S3-10, and In2S3-15. | ||
Next, zeta potential, which is deemed as an indicator for the surface charge of the solid particles was measured. Zeta potential values of In2S3-5, In2S3-10 and In2S3-15 were −15.32, −18.25 and −13.63 mV, respectively (as shown in Fig. 8b). The negative charge taken on the surface was related to the adsorption of –OH groups on the surface. In2S3-10 had the most negative charges on its surface, indicating that lots of –OH groups were adsorbed. Finally, surface hydrophilicity of different-sized In2S3 samples were quantified from water contact angle measurements. Fig. 8c shows the contact angles of In2S3-5, In2S3-10 and In2S3-15 to be 24.85°, 14.38° and 42.39°, respectively. Obviously, three In2S3 presented hydrophilicity, in particular, In2S3-10 presented the maximum hydrophilicity, which was connected with more adsorbed –OH groups based on the complementary effects of the specific surface area and crystallinity.
3.3 Photocatalysis
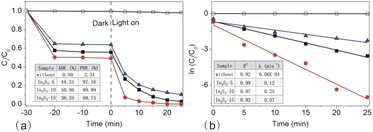
Next, we measured the photodegradation of RhB during the photoreaction (Fig. 9b). It was approximately fitted with the liner equation of ln (Ct/C0) = −kt and the obtained R2 value was over 0.9, suggesting that the photodegradation reaction meets the pseudo-first-order kinetics as a function of the time. From the equation, the k value was obtained easily. With the size of In2S3 increasing, the k value increased first and then decreased largely. In2S3-10 showed the maximum k value up to 0.25 min−1, probably, the fastest rate in the photodegradation of RhB.
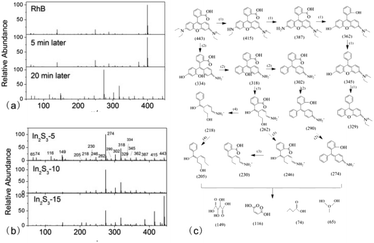
Next, we speculated several possible photodegradation path from the RhB matrix to small molecular products. (1) Firstly, RhB experienced a series of de-ethylation reactions, such as from m/z = 443 to m/z = 415, 387.29 Next, the intermediates were attacked by ˙OH, followed by the removal of –NH2 and the addition of –OH (from m/z = 387 to m/z = 362), then the gradual removal of –OH (from m/z = 362 to m/z = 345, 329). (2) ˙OH attacked the xanthene ring, followed by the ring opening, the removal of –N(C2H5)2, and the addition of –OH (m/z = 443 to m/z = 334),44 then the removal of –OH (m/z = 334 to 318, 302). Next, the carboxyl groups were removed partially from the xanthene ring after the loss of all ethyl groups (m/z = 302 to m/z = 290), followed by the removal of –OH (m/z = 290 to m/z = 274). (3) The intermediate product at m/z = 318 experienced a ring-opening reaction and the rupture of carbon–carbon bonds (m/z = 318 to m/z = 262),44 followed by the gradual removal of –OH groups (from m/z = 262 to m/z = 246, 230). (4) The intermediate at m/z = 262 removed the –COOH groups (m/z = 262 to m/z = 218) directly,44 followed by the removal of –NH2+ (m/z = 218 to m/z = 205). Finally, all of the obtained residues further decomposed to small molecules (m/z = 149, m/z = 116, m/z = 74, m/z = 65) through the ring-opening reactions.29,45–47 According to the above results, we speculated the possible path of RhB photodegradation (as shown in Fig. 10c).
The active site is one more factor influencing the photocatalysis reaction, which is connected to interfacial adsorption. Next, we carried out the photodegradation of different dye molecules with In2S3-10 as the photocatalyst (as shown in Fig. 11b). Clearly, In2S3-10 displayed excellent photodegradation of cationic dyes such as RhB, MG, and CV. However, it showed poor photodegradation of anionic dyes such as MO, CR, and AR. It is especially noteworthy that In2S3 displayed high ADE for three cationic dyes, therefore, the excellent photodegradation was reasonably attributed to the adsorption of –OH groups on the surface of In2S3-10 for the increased hydrophilicity and surface negative charges to afford more reaction active sites. High ADE resulted in high substrate concentration for efficient decomposition of the adsorbed molecules.
Finally, we observed the colour change of the photocatalyst and substrate before and after the illumination. In the dark, the significantly darker colour of In2S3-10 confirmed that RhB was adsorbed on its surface. After turning on the light, In2S3-10 changed back to its original colour, indicating that the absorbed RhB on the surface of photocatalysts decomposed completely (as shown in the inset to Fig. 11c on the right). At the same time, RhB faded slightly in the dark, however, it turned colourless quickly after turning on the light (as shown in the inset in Fig. 11c on the left). The change in the absorption spectrum also clearly demonstrated the same results (Fig. 11c). Keeping it in the dark for initial 30 min, the peak intensity decreased without shifting of the peak position. However, after illumination for 5 min to 25 min, peak intensity decreased significantly with the gradual hypsochromic shifting of the peak position from 554 nm to 498 nm, which was caused by the step-by-step N-deethylation of RhB,53 implying that RhB matrix was decomposed by In2S3.
4 Conclusions
A facile synthesis method for different-sized thornball-like In2S3 with controllable photocatalysis was reported. Three In2S3 samples within the pore size of 400–800 nm were synthesized rapidly by one-pot microwave irradiation method at low temperature in an aqueous solution. Different-sized tetragonal β-In2S3 assembled by nanoflakes displayed obviously different charge separation abilities and surface properties, resulting in various photodegradation rates of RhB. In2S3-10 showed maximum electron–hole separation efficiency and surface attraction, contributing to the complete photodegradation of RhB in just 25 min of illumination, which was possibly the fastest rate as far as we know. The extremely rapid photodegradation was attributed to the strong adsorption of dye molecules on the In2S3 surface followed by its highly effective decomposition on the substrate. MS results showed that small molecules generated after RhB experienced the process of de-ethylation, ring-opening of xanthene, and rupture of carbon–carbon bonds. Additionally, In2S3-10 displayed comparable reusability only by prolonging the illumination time.Author contributions
Chaofan Zheng: methodology, investigation; Ziyao Wang: writing-the original draft; Jialong Yuan and Xiaoyi Lu: formal analysis; Qingfeng Xu and Haixin Li: validation; Jiangang Gao: reviewing and editing; Wenjin Yue: conceptualization, supervision, funding acquisition.Conflicts of interest
There are no conflicts to declare.Acknowledgements
This work was supported by Universities' Scientific Research Projects in Anhui Province (KJ2021A0498), Anhui Laboratory of Clean Energy Materials and Chemistry for Sustainable Conversion of Natural Resources (LCECSC-02), and the National Undergraduate Innovation Entrepreneurship Project in Local University (20221036306).Notes and references
- Y. Yuan, R.-t. Guo, L.-f. Hong, X.-y. Ji, Z.-d. Lin, Z.-s. Li and W.-g. Pan, Mater. Today Energy, 2021, 21, 100829 CrossRef CAS.
- J. Arun, S. Nachiappan, G. Rangarajan, R. P. Alagappan, K. P. Gopinath and E. Lichtfouse, Environ. Chem. Lett., 2022, 1 Search PubMed.
- K. Yang, Z. Yang, C. Zhang, Y. Gu, J. Wei, Z. Li, C. Ma, X. Yang, K. Song, Y. Li, Q. Fang and J. Zhou, Chem. Eng. J., 2021, 418, 129344 CrossRef CAS.
- P. Li and T. He, J. Mater. Chem. A, 2021, 9, 23364 RSC.
- X. Li, J. Yu and M. Jaroniec, Chem. Soc. Rev., 2016, 45, 2603 RSC.
- J. Zhang, H. Wang, X. Yuan, G. Zeng, W. Tu and S. Wang, J. Photoch. Photobio. C, 2019, 38, 1 CrossRef CAS.
- W. Gao, W. Liu, Y. Leng, X. Wang, X. Wang, B. Hu, D. Yu, Y. Sang and H. Liu, Appl. Catal., B, 2015, 176–177, 83 CrossRef CAS.
- N. Yahya, F. Aziz, N. A. Jamaludin, M. A. Mutalib, A. F. Ismail, W. N. W. Salleh, J. Jaafar, N. Yusof and N. A. Ludin, J. Environ. Chem. Eng., 2018, 6, 7411 CrossRef CAS.
- L. Qi, H. Li and L. Dong, Mater. Lett., 2013, 107, 354 CrossRef CAS.
- A. K. Nayak, S. Lee, Y. Sohn and D. Pradhan, CrystEngComm, 2014, 16, 8064 RSC.
- C. Wei, W. Guo, J. Yang, H. Fan, J. Zhang and W. Zheng, RSC Adv., 2014, 4, 50456 RSC.
- T. Li, S. Zhang, S. Meng, X. Ye, X. Fu and S. Chen, RSC Adv., 2017, 7, 6457 RSC.
- L. Liu, W. Xiang, J. Zhong, X. Yang, X. Liang, H. Liu and W. Cai, J. Alloys Compd., 2010, 493, 309 CrossRef CAS.
- R. Amutha, S. Akilandeswari, B. Ahmmad, M. Muruganandham and M. Sillanpaa, J. Nanosci. Nanotechnol., 2010, 10, 8438 CrossRef CAS PubMed.
- S. Rengaraj, S. Venkataraj, C.-w. Tai, Y. Kim, E. Repo and M. Sillanpää, Langmuir, 2011, 27, 5534 CrossRef CAS PubMed.
- X. Sheng, L. Wang, G. Chen and D. Yang, J. Nanomater., 2011, 2011, 280216 Search PubMed.
- B. Xue, F. Xu, B. Wang and A. Dong, CrystEngComm, 2016, 18, 250 RSC.
- P. L. Saldanha, V. Lesnyak and L. Manna, Nano Today, 2017, 12, 46 CrossRef CAS.
- Z. Pang, M. Zhang, L. Huang, R. Wen, J. Lu, Y. Zhao, A. Wei, L. Tao, D. Luo, J. Liu, Y. Yang, Y. Xiao and Z. Xiao, Mater. Lett., 2018, 210, 66 CrossRef CAS.
- S. D. Naik, T. C. Jagadale, S. K. Apte, R. S. Sonawane, M. V. Kulkarni, S. I. Patil, S. B. Ogale and B. B. Kale, Chem. Phys. Lett., 2008, 452, 301 CrossRef CAS.
- C. R. Patra, S. Patra, A. Gabashvili, Y. Mastai, Y. Koltypin, A. Gedanken, V. Palchik and M. A. Slifkin, J. Nanosci. Nanotechnol., 2006, 6, 845 CrossRef CAS PubMed.
- Z. Wu, X. Yuan, G. Zeng, L. Jiang, H. Zhong, Y. Xie, H. Wang, X. Chen and H. Wang, Appl. Catal., B, 2018, 225, 8 CrossRef CAS.
- S. Yang, C. Y. Xu, B. Y. Zhang, L. Yang, S. P. Hu and L. Zhen, J. Colloid Interface Sci., 2017, 491, 230 CrossRef CAS PubMed.
- L. Chen, G. Yang, X. Wei, H. Xu and S. Jin, J. Alloys Compd., 2022, 895, 162589 CrossRef CAS.
- W. Wang, W. Zhu and L. Zhang, Res. Chem. Intermed., 2009, 35, 761 CrossRef CAS.
- S. Alhammadi, B. G. Mun, S. Gedi, V. R. Minnam Reddy, A. M. Rabie, M. S. Sayed, J.-J. Shim, H. Park and W. K. Kim, J. Mol. Liq., 2021, 344, 117649 CrossRef CAS.
- Q. Xu, C. Zheng, Z. Wang, Z. Zhang, X. Su, B. Sun, G. Nie and W. Yue, J. Mater. Sci., 2022, 57, 7531 CrossRef CAS.
- Q. Xu, Z. Wang, H. Yang, Y. Xiang, G. Nie and W. Yue, J. Alloys Compd., 2022, 904, 163966 CrossRef CAS.
- W. Yue, Z. Wang, J. Gong, Z. Wang and Y. Dong, Mater. Sci. Semicond. Process., 2021, 126, 105671 CrossRef CAS.
- P. Makula, M. Pacia and W. Macyk, J. Phys. Chem. Lett., 2018, 9, 6814 CrossRef CAS PubMed.
- H. Zhong, S. S. Lo, T. Mirkovic, Y. Li, Y. Ding, Y. Li and G. D. Scholes, ACS Nano, 2010, 4, 5253 CrossRef CAS PubMed.
- J. Xu, C. Liu, J. Niu and M. Chen, Sep. Purif. Technol., 2020, 230, 115861 CrossRef CAS.
- Q. Wang, J. Huang, H. Sun, K.-Q. Zhang and Y. Lai, Nanoscale, 2017, 9, 16046 RSC.
- J. Chang and E. R. Waclawik, RSC Adv., 2014, 4, 23505 RSC.
- S. B. Kokane, R. Sasikala, D. M. Phase and S. D. Sartale, J. Mater. Sci., 2017, 52, 7077 CrossRef CAS.
- R. He, K. Xue, J. Wang, T. Yang, R. Sun, L. Wang, X. Yu, U. Omeoga, W. Wang, T. Yang, Y. Hu and S. Pi, J. Mater. Sci., 2019, 54, 14690 CrossRef CAS.
- J. Chen, W. Liu and W. Gao, Appl. Surf. Sci., 2016, 368 Search PubMed.
- L.-Y. Chen, Z.-D. Zhang and W.-Z. Wang, J. Phys. Chem. C, 2008, 112, 4117 CrossRef CAS.
- J. Parhizkar and M. R. M. Shafiee, Nanochem. Res., 2020, 5, 168 CAS.
- N. M. Huang, J. Nanomater., 2011, 2011, 815709 Search PubMed.
- X. Yuan, L. Jiang, J. Liang, Y. Pan, J. Zhang, H. Wang, L. Leng, Z. Wu, R. Guan and G. Zeng, Chem. Eng. J., 2019, 356, 371 CrossRef CAS.
- C. Chen, D. Chen, X. Jiao and C. Wang, Chem. Commun., 2006, 4632 RSC.
- P. Berki, Z. Németh, B. Réti, O. Berkesi, A. Magrez, V. Aroutiounian, L. Forró and K. Hernadi, Carbon, 2013, 60, 266 CrossRef CAS.
- J. Wu, N. Qin, E. Lin, B. Yuan, Z. Kang and D. Bao, Nanoscale, 2019, 11, 21128 RSC.
- Y. A. B. Neolaka, Z. S. Ngara, Y. Lawa, J. N. Naat, D. Prasetyo Benu, A. Chetouani, H. Elmsellem, H. Darmokoesoemo and H. Septya Kusuma, J. Environ. Chem. Eng., 2019, 7, 103482 CrossRef CAS.
- M. Rakibuddin, S. Gazi and R. Ananthakrishnan, Catal. Commun., 2015, 58, 53 CrossRef CAS.
- S. Vigneshwaran, C. M. Park and S. Meenakshi, Sep. Purif. Technol., 2021, 258, 118003 CrossRef CAS.
- A. Das, M. K. Adak, N. Mahata and B. Biswas, J. Mol. Liq., 2021, 338, 116479 CrossRef CAS.
- V. H. Nguyen, L. A. Phan Thi, P. S. Chandana, H. T. Do, T. H. Pham, T. Lee, T. D. Nguyen, C. Le Phuoc and P. T. Huong, Chemosphere, 2021, 276 Search PubMed.
- T. D. Munusamy, C. S. Yee and M. M. R. Khan, Adv. Powder Technol., 2020, 31, 2921 CrossRef CAS.
- H. Wang, Z. Ye, C. Liu, J. Li, M. Zhou, Q. Guan, P. Lv, P. Huo and Y. Yan, Appl. Surf. Sci., 2015, 353, 391 CrossRef CAS.
- A. Ajmal, I. Majeed, R. N. Malik, H. Idriss and M. A. Nadeem, RSC Adv., 2014, 4, 37003 RSC.
- J. Zhuang, W. Dai, Q. Tian, Z. Li, L. Xie, J. Wang, P. Liu, X. Shi and D. Wang, Langmuir, 2010, 26, 9686 CrossRef CAS PubMed.
- S. Ge, L. Cai, D. Li, W. Fa, Y. Zhang and Z. Zheng, J. Nanopart. Res., 2015, 17, 488 CrossRef.
Footnotes |
| † Electronic supplementary information (ESI) available. The details on Photocatalysis experiments (S1), Electrochemical measurements (S2) and Calculation of band edge potential based on empirical equation and C–V measurement (S3). See DOI: https://doi.org/10.1039/d2ra07108h |
| ‡ These authors contributed equally to this work. |
| This journal is © The Royal Society of Chemistry 2023 |

