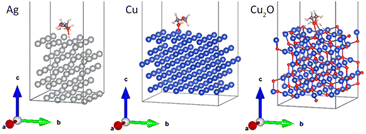
 Open Access Article
Plasmonic Ag/Cu/PEG nanofluids prepared when solids meet liquids in the gas phase†
Kateryna
Biliak
 a,
Daniil
Nikitin
 a,
Suren
Ali-Ogly
 a,
Mariia
Protsak
 a,
Pavel
Pleskunov
 a,
Marco
Tosca
 ab,
Anastasiya
Sergievskaya
 c,
David
Cornil
 d,
Jérôme
Cornil
 d,
Stephanos
Konstantinidis
 c,
Tereza
Košutová
 e,
Zulfiya
Černochová
 f,
Petr
Štěpánek
 f,
Jan
Hanuš
 a,
Jaroslav
Kousal
 a,
Lenka
Hanyková
 a,
Ivan
Krakovský
a and
Andrei
Choukourov
 *a
*a
aDepartment of Macromolecular Physics, Faculty of Mathematics and Physics, Charles University, V Holešovičkách 2, 180 00, Prague, Czech Republic. E-mail: choukourov@kmf.troja.mff.cuni.cz
bELI-Beamlines Centre, Institute of Physics, Czech Academy of Sciences, Dolni Brezany, Czech Republic
cPlasma-Surface Interaction Chemistry (ChIPS), University of Mons, Place du Parc 20, 7000 Mons, Belgium
dLaboratory for Chemistry of Novel Materials, University of Mons, Place du Parc 23, B-7000 Mons, Belgium
eDepartment of Condensed Matter Physics, Faculty of Mathematics and Physics, Charles University, Ke Karlovu 5, 121 16, Prague, Czech Republic
fInstitute of Macromolecular Chemistry, Czech Academy of Sciences, Heyrovského nám. 2, 162 06, Prague, Czech Republic
First published on 22nd December 2022
Abstract
Since the time of Faraday's experiments, the optical response of plasmonic nanofluids has been tailored by the shape, size, concentration, and material of nanoparticles (NPs), or by mixing different types of NPs. To date, water-based liquids have been the most extensively investigated host media, while polymers, such as poly(ethylene glycol) (PEG), have frequently been added to introduce repulsive steric interactions and protect NPs from agglomeration. Here, we introduce an inverse system of non-aqueous nanofluids, in which Ag and Cu NPs are dispersed in PEG (400 g mol−1), with no solvents or chemicals involved. Our single-step approach comprises the synthesis of metal NPs in the gas phase using sputtering-based gas aggregation cluster sources, gas flow transport of NPs, and their deposition (optionally simultaneous) on the PEG surface. Using computational fluid dynamics simulations, we show that NPs diffuse into PEG at an average velocity of the diffusion front of the order of μm s−1, which is sufficient for efficient loading of the entire polymer bulk. We synthesize yellow Ag/PEG, green Cu/PEG, and blue Ag/Cu/PEG nanofluids, in which the color is given by the position of the plasmon resonance. NPs are prone to partial agglomeration and sedimentation, with a slower kinetics for Cu. Density functional theory calculations combined with UV-vis data and zeta-potential measurements prove that the surface oxidation to Cu2O and stronger electrostatic repulsion are responsible for the higher stability of Cu NPs. Adopting the De Gennes formalism, we estimate that PEG molecules adsorb on the NP surface in mushroom coordination, with the thickness of the adsorbed layer L < 1.4 nm, grafting density σ < 0.20, and the average distance between the grafted chains D > 0.8 nm. Such values provide sufficient steric barriers to retard, but not completely prevent, agglomeration. Overall, our approach offers an excellent platform for fundamental research on non-aqueous nanofluids, with metal–polymer and metal–metal interactions unperturbed by the presence of solvents or chemical residues.
Introduction
Plasmonic nanofluids (colloidal solutions of NPs exhibiting localized surface plasmon resonance, LSPR, in the visible range) have been among the most commonly investigated colloidal systems for a long time. The area of research on light interacting with fluidized NPs is still attracting considerable attention, not least because of the beautiful colors that can be obtained, covering the entire rainbow range, but also because of the numerous possible applications of such nanofluids, including biomedicine, direct solar light harvesting, heat transfer, etc. Many years ago, Faraday, who investigated gold nanofluids, was perhaps the first to suggest that ‘a mere variation in the size of its particles gave rise to a variety of resultant colours’.1 Today, we know that the shape, the concentration, and the optoelectronic properties of the material of NPs and host liquids also define the optical response.Historically, plasmonic metals (Au, Ag, and Cu) and water solutions were investigated most frequently, and different approaches were developed to load or create these NPs in the host liquid, often comprising multiple wet chemistry pathways.2 Another option emerged, rather unexpectedly, in the surface science and thin-film deposition community, when conventional low-pressure evaporation or sputtering was used to deposit metals on the surface of vacuum-compatible liquids.3,4 The formation of finely dispersed metal NPs was observed, which gave an impetus to the development of this method.5–12 A downside of the methodology is that only liquids with low equilibrium vapor pressure can be used; on the other hand, the method is beneficial in avoiding multiple chemical protocols and purification steps, providing a platform for ultra-pure metal/host medium interaction unmediated by the presence of linkers or chemical residues. Recently, more complex systems have been proposed that combine two or several metals to produce alloy nanofluids such as Ag–Au,13–17 Pt–Au,18–20 Pd–Au,21,22 Au–Cu,12,23,24 Ag–Pt,9 Cu–Pt,25 Ru–Au, Ru–Cu, Ru–Au–Cu,12 and CoCrCuFeNi (high entropy alloy).11
In 2021, our group pioneered an approach for the preparation of single metal/polymer nanofluids (Cu/PEG) using a sputtering-based gas aggregation cluster source (GAS).26 In this method, the metal is sputtered by using a dc magnetron in a separate vacuum chamber under increased pressure of a cold inert gas (Ar) to produce NPs in the gas phase.27,28 The NPs can be extracted by gas flow to an additional vacuum chamber where a liquid substrate is located. Thus, the process of NP formation and growth is decoupled from the process of embedding the NPs into liquid. Only two components are present in the nanofluid in the end: metal NPs and the host liquid, offering an excellent opportunity for fundamental research, unbiased by the presence of additional chemicals or impurities.
NPs of virtually any metal can be produced and loaded into the host liquid using this approach. In the present work, we decided to investigate plasmonic single-metal Ag/PEG, Cu/PEG, and binary Ag/Cu/PEG nanofluids because the LSPRs of Ag and Cu are very distant and offer a tool for tuning the optical response of such nanofluids. This peculiarity has been widely recognized in the wet chemistry and biochemistry community that has dealt with aqueous solutions and investigated the tunable plasmonic properties of Ag and Cu NP mixtures, and nanoalloyed AgCu NPs.29–31 Routinely, PEG has been used as a capping agent to reduce the NP agglomeration. However, the combination of Ag and Cu seems to have been overlooked by the sputtering community that has dealt with non-aqueous systems, often using PEG as a host liquid. We upgraded our system to allow for independent and simultaneous deposition of beams of Ag and Cu NPs into PEG, and set our goal to obtain deeper insight into the collective diffusion of NPs into the host medium, their mutual interaction (if any), interaction with PEG molecules, and the plasmonic response of such nanofluids.
Experimental
Preparation of nanofluids
For the production of Ag and Cu nanofluids, a special configuration of the experimental setup was designed (Fig. 1). The apparatus consists of two gas aggregation cluster sources (GASs) attached to a main deposition chamber. Both GASs have identical construction and are inclined at an angle of 45 degrees with respect to the horizontal plane. The GAS consists of a cylindrical chamber of 10 cm in diameter with water-cooled walls and is equipped with a 3-inch planar magnetron. Ag (99.99% purity) and Cu (99.99% purity) targets with a thickness of 3 mm were used. A gas inlet for introducing Ar (Linde, purity 99.996%) is located behind the magnetron. The GAS ends with an orifice of 2 mm in diameter. The distance from the magnetron target to the orifice is set at 135 mm, whereas the distance from the orifice to the substrate is 300 mm. The entire system is pumped by rotary and diffusion pumps to a base pressure of 2 × 10⁻³ Pa in the main deposition chamber. The size distribution and flux of NPs can be controlled by the discharge current and Ar pressure/flow in the GAS. Table 1 shows the experimental parameters that were used to prepare Ag and Cu NPs of different mean sizes, and the SEM images of these NPs are shown in Fig. 1. High-resolution TEM images and XRD patterns can be seen in Fig. S1 and S2 of the ESI.†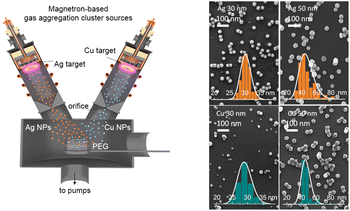 | ||
| Fig. 1 Left: scheme of the experimental setup for simultaneous deposition of Cu and Ag NPs into PEG using two independent gas aggregation cluster sources. Right: SEM images of Ag and Cu NPs deposited with different mean sizes on Si substrates. Insets show the size distributions. The deposition parameters are given in Table 1. | ||
| Metal NPs, mean size | dc, mA | Ar pressure, Pa | Ar flow, sccm |
|---|---|---|---|
| Ag, 30 nm | 170 | 30 | 2.6 |
| Ag, 50 nm | 350 | 100 | 13.0 |
| Cu, 30 nm | 350 | 40 | 2.5 |
| Cu, 50 nm | 500 | 70 | 5.0 |
Polyethylene glycol (PEG, 400 g mol−1, Sigma-Aldrich) was used as a host liquid for the deposition. A 2 mL volume of PEG was loaded into a 5 cm diameter Petri dish, and the dish was introduced into a loadlock chamber, which was pumped to a base pressure of 5 Pa by a rotary pump. After the preliminary pumping, the Petri dish was introduced into the main deposition chamber in the working position at the intersection of the GAS axes. With such geometry, the deposition spot of NPs completely covers the surface of the liquid in the Petri dish. The concentration of metal NPs in the nanofluid can be tuned by the deposition time.26 In this work, single and bimetal nanofluids with a total metal concentration of 50 μg mL−1 were prepared and analyzed. After preparation, the samples were ultrasonicated in an ultrasonic bath for 15 min and then stored in air under ambient conditions.
Characterization of nanofluids
Scanning electron microscopy (JSM-7200F, Jeol) was employed for investigation of morphology and size distribution of NPs. For this purpose, the NPs were deposited on silicon substrates. The SEM acceleration voltage was set at 20 kV, with a probe current of 6 × 10⁻¹⁰ A.Small-angle X-ray scattering (Xenocs Xeuss 2.0) measurements were carried out to characterize the NPs directly in PEG. The instrument utilizes a Cu X-ray source (Kα radiation at λ = 0.154189 nm). A 0.1 mL aliquot of the nanofluid was placed in a borosilicate glass capillary, and SAXS measurements were performed without any further manipulation with the sample. For the analysis of the scattering curves, the Irena package was used.32 The fitting was performed using a model of diluted spheres.
Optical properties of the nanofluids were studied using a UV-vis spectrophotometer (Hitachi U-2900) in the 325–1100 nm range. Poly(methyl methacrylate) cuvettes with an optical path of 10 mm were used. The cuvette filled with PEG without NPs was used as a reference.
Zeta potential of Ag and Cu NPs in PEG was measured without any prior dilution or filtration of the samples using electrophoretic light scattering (Zetasizer NanoZS ZEN3600, Malvern Instruments, UK). In this method, particles move under an external electric field and their mobility is determined from the Doppler shift of the frequency of scattered light. A universal dip cell with closely spaced parallel electrodes was used to account for the lower dielectric constant (14.1) and higher viscosity (90 cSt) of PEG as compared to aqueous solutions. The automatic number of runs was limited to 100 runs, and the zeta potential was calculated using a Huckel approximation.
Calculations and simulations
Computational fluid dynamics (CFD) for simulation of the Brownian motion
CFD is a numerical method based on solving Navier–Stokes (N–S) equations for fluid dynamics and was used here to model the movement of spherical metal NPs in PEG (CFD, Siemens STAR CCM+ 16.06.008 R8, double precision). The modeling was performed with or without taking the Brownian motion into account. For the latter case, the Brownian force was modelled in the form of eqn (1):33 | (1) |
 | (2) |
Here, v is the kinematic viscosity of PEG, ρPEG and ρNP are the mass densities of PEG and the metal NP (assumed to be equal to that of the bulk metal), kB is the Boltzmann constant, TPEG is the temperature of PEG, dNP is the diameter of the NP, and Cc is the Cunningham correction factor calculated using eqn (3):
 | (3) |
 | (4) |
The simulations were performed using a Lagrangian approach for a single NP placed in three-dimensional PEG or for collective diffusion of numerous NPs placed in two-dimensional PEG. Ideal isolated NPs were subject to Brownian and gravitational forces, and no interactions between them were taken into account. A transient two-way coupled simulation was chosen to solve the N–S and particle motion equations with a time-dependent approach, which allows one to follow real-time changes in the position of the NPs as well as changes in the fluid flow, if these occur. The time step of the simulation was set at Δt = 10−5 s. For the PEG fluid, a laminar flow regime was assumed, since NPs are not expected to create turbulence in the fluid domain due to their small size.
Simulations of Mie scattering
The UV-vis spectra of the Ag/PEG and Cu/PEG nanofluids were simulated using the Mie theory formalism for homogeneous spheres as implemented in the MiePlot v4.6.21 software.35 The spectra of core/shell Cu/Cu2O NPs in PEG were simulated using a coated sphere model of the same software based on the algorithms reported in ref. 36 and 37. The complex refractive index data for different wavelengths were taken from the following sources: Ag and Cu (ref. 38), Cu2O (ref. 39), and PEG40. The lognormal size distribution of the NPs was taken into account. The standard deviation of 20% of the median NP radius was chosen, which is close to the experimentally obtained data.Density functional theory for calculation of interaction energy
Density functional theory (DFT)-based total energy calculations were performed to rationalize the stability of the colloidal solutions of Ag and Cu NPs in PEG. The approach described below is based on some of our previous studies.10,20,24,41–43 DFT calculations were carried out with periodic boundary conditions, as implemented in the SIESTA 4.1 code.44 The exchange-correlation functional is described within the general gradient approximation using the Perdew–Burke–Ernzerhof (PBE) functional.45 A double-ζ polarized numerical atomic basis set is adopted for the valence electrons, whereas core electrons are described with Troullier–Martins pseudopotentials.46 A mesh cutoff of 250 Ry and a Monkhorst–Pack grid of (2 × 2 × 1) k-points were used during the relaxation of the interface. These parameters were increased to 400 Ry and (4 × 4 × 1) for estimating the interaction energy. The van der Waals interactions were taken into account by using the Grimme D2 dispersion corrections.47In the first approximation, the NP surfaces were considered as flat metal surfaces. For the sake of computational facility, a simplified version of PEG was used by shortening it to an ethylene glycol (EG) molecule, HO–CH2–CH2–OH. A similar simplification has been done by Deng et al. for calculations of interaction energies between PEG-600 and Pt/Au alloy NPs.20 To figure out whether the length of the molecule affects the binding with metal surfaces, calculations were also done for a longer chain, i.e., diethylene glycol (DEG).
The model molecule was first fully relaxed in the isolated state using a large unit cell of (30 × 30 × 30) Å3 to avoid intermolecular interactions. The interaction of PEG with the Ag(111), Cu(111) and Cu2O(111) surfaces, representing stable surfaces of silver, copper and copper monoxide, respectively, was modelled by approaching the neutral simplified PEG molecule close to the surface of the slab made of five layers. The geometry relaxation was performed using the conjugated gradient formalism with a 0.04 eV Å−1 convergence criterion on the atomic forces. Only the molecule and the top two layers over the five layers were allowed to relax. The interaction energy was calculated on the final relaxed geometry using eqn (5):
| Eint = Esurf/PEG − EPEG − Esurf | (5) |
The charges and effective bond orders have been computed from the DFT-computed charge density using the DDEC/6 charge partition formalism.46,48 To evaluate the binding of the simplified PEG molecule to the surface, we defined the total bond order (total BO) as the sum of the bond order of all EG and DEG atoms with any of the surface atoms. The details about the model surfaces are provided in Table 2.
| Material | Crystal structure | Surface lattice parameters | |
|---|---|---|---|
| A | b | ||
| a For this particular system, we selected the stoichiometric non-polar oxygen-terminated surface, (111):O, which has been reported to be the most stable surface.68 | |||
| Ag | fcc, a = 4.09 Å | 11.55 Å | 10.00 Å |
| Cu | fcc, a = 3.73 Å | 10.55 Å | 13.70 Å |
| Cu2Oa | Simple cubic, a = 4.45 Å | 12.58 Å | 10.89 Å |
Simulations of the XPS spectra
Simulations of the XPS spectra of Cu/PEG nanofluids were performed using the NIST database for the simulation of electron spectra for surface analysis software (SESSA, version 2.2.0).49 The sample was modelled as half-submerged core-shell spheres on top of a flat semi-infinite surface. The core consists of Cu or Cu2O, whereas the shell and the surface are modelled as a hypothetical material with the elemental content of C2H4O (the monomer unit of PEG), a density of 1128 kg m−3 (density of PEG400) and an inelastic mean free path of electrons (IMFP) that was calculated as suggested in ref. 50 for organic compounds: IMFP = 49/ρEk2 + 0.11Ek0.5 = 3.4 nm. Here, Ek is the electron kinetic energy and ρ is the density of PEG400.The NPs of 30 nm diameter were regularly distributed over the surface with a period of 240 nm. The XPS spectra were simulated for the different thicknesses of the PEG shell. The ratio of intensities of the C 1s and Cu 2p3/2 lines was compared to that of the XPS spectra previously measured directly on the Cu/PEG nanofluid using an enviro-ESCA.26
Results and discussion
Simulations of the NP mobility
Our method of preparation of nanofluids consists of several stages joined in a single process. It involves: (1) sputtering of a metal target; (2) nucleation and growth of NPs in the gas phase; (3) transport of NPs by the gas flow; (4) deposition of NPs on the liquid surface; (5) their penetration through the vacuum/liquid interface and diffusion into the bulk of the liquid. Although not very extensively, stages 1–4 have already been studied, both experimentally27,28,51 and theoretically.52 Stage 5 has been investigated to an even lesser extent due to technical challenges associated with in situ analysis of liquids under vacuum. Much easier is the ex situ analysis when the nanofluid has already been removed from the deposition chamber, and such an analysis constitutes the primary body of this article. However, we find it instructive to show in the beginning the results of CFD simulations performed to study stage 5 at least from a theoretical perspective.As was shown earlier, metal NPs exit the GAS at velocities in the range of tens of m s−1 and thus deposit on substrates in a soft-landing regime, for which the kinetic energy is not sufficient to induce any change in the NP morphology and structure.51 On solid substrates, the NPs accumulate and build up a mesoporous deposit. However, if liquid PEG is used as a substrate, no coating is observed on the liquid surface, as NPs penetrate the bulk even without stirring.
CFD simulations were used to determine how fast the NPs lose kinetic energy when moving in a viscous medium. Single Cu NPs of different sizes were placed below the PEG/vacuum interface with different initial velocities, and their retardation time and penetration depth were modelled (Fig. 2). The initial velocities were chosen in the range of 101–102 m s−1. The energetic barrier required to overcome the surface tension was ignored and, therefore, such velocities are upper-bounding limits. Even for the largest 80 nm NP with the highest initial velocity of 150 m s−1, the velocity drops to zero in a very short time of 10−10 s and the penetration depth reaches only 3 nm. For more plausible smaller and less kinetic NPs, the retardation is even faster, while the penetration depth is smaller. Thus, the kinetic energy of NPs is not sufficient for their penetration into PEG. NPs should become almost immediately immobilized after depositing on the liquid surface unless there exists another mechanism for NP mixing with PEG.
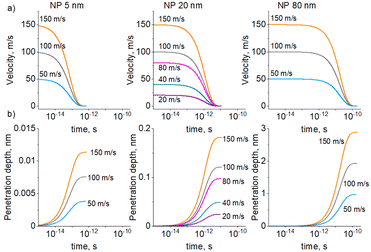 | ||
| Fig. 2 CFD simulation of a single 5, 20, or 80 nm Cu NP retarding from the initial velocity to zero when moving in PEG: (a) NP velocity; (b) NP penetration depth. | ||
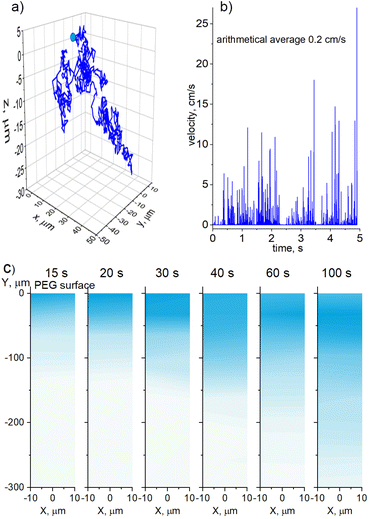
The CFD simulations were also performed in 3D for a single 20 nm Cu NP of spherical shape moving in PEG under the influence of Brownian motion. The NP was placed in the position (0, 0, 0) with an initial velocity of 0 m s−1 and its time-dependent trajectory was simulated. Fig. 3a shows the entire path that the NP travels in 5 seconds, giving the absolute value of the start-to-end vector to be 42 μm. An average velocity of approximately 8 μm s−1 or 0.5 mm min−1 can be obtained from these data as a rough estimate for the penetration depth. Considering a typical deposition time of tens of minutes, it is highly probable that NPs effectively mix with PEG because of the Brownian motion during deposition. Interestingly, instantaneous velocity can reach tens of cm s−1 with an arithmetical average of 0.2 cm s−1, as shown in Fig. 3b. Thus, the NP Brownian motion is efficient even in a highly viscous medium such as liquid PEG.
Further CFD simulations were performed in 2D but for collective diffusion of Cu NPs in PEG. A semi-infinite medium was created with the physical properties corresponding to PEG400, and the surface plane was set at a position of Y = 0 μm. The NPs were randomly generated immediately below the surface within a horizontal interval of −10 μm < X < 10 μm. The rate of NP generation corresponded to a flux of 7 × 10¹¹ NPs per m2s, at which they deposited in the experiments onto the PEG surface. The NPs were not allowed to cross the surface plane, although they were allowed to move freely in any other direction without sticking to each other. Fig. 3c shows the snapshots of the diffusion medium taken at different time intervals after the start of the simulations. Instead of showing discrete individual NPs, which are of a much smaller scale than the simulated medium, we opt for a 2D Kernel density plot as implemented in the OriginPro software. The algorithm calculates the probability density function based on a finite sample of data. As a result, the position of each NP is smoothed from a single point to a proximity region, which is colorized. The intensity of the color is directly correlated with the concentration of NPs.
The simulations show that NPs penetrate the bulk PEG with a smooth diffusion front with a propagation velocity of about 300 μm/100 s (3 μm s−1), which is smaller but of the same order of magnitude as in the case of the single-NP diffusion. What is noticeable here is that the region of the highest NP concentration is not static, but it also propagates downward, although at a smaller velocity. In the early stages, the highest concentration seems to be immediately below the surface where the NPs are generated. However, in the late stages, the subsurface region becomes less concentrated, whereas the highest concentration region shifts downward. For example, it is located at 30 μm for the 100 s snapshot, which makes the propagation velocity to be about 300 nm s−1. This is a rather surprising result, because it points to the existence of two characteristic time scales for the NP diffusion, which are one order of magnitude different. We attribute the fast time scale to the diffusion of individual NPs and the slow time scale to the collective diffusion of NPs, which, despite being non-interactive, behave as a macroscopic ensemble.
It is also interesting that our earlier in-liquid TEM analysis did not reveal a significant Brownian motion of Cu NPs in PEG.26 Such seemingly contradictory results point to the importance of nanoconfinement effects in metal NP-loaded nanofluids. The mentioned TEM measurements were performed on a 200 nm nanofluid channel confined between SiN membranes. In the vicinity of rigid surfaces, PEG forms adsorbed layers with substantially constrained segmental dynamics and, as a result, with significantly prolonged relaxation times and increased viscosity.53 We will address the issue of the adsorbed PEG layer later in the text; for now, it can be suggested that nanofluid analysis in ultrathin channels may not be necessarily accurate for the description of the NP dynamics in the bulk.
Dynamics of LSPR
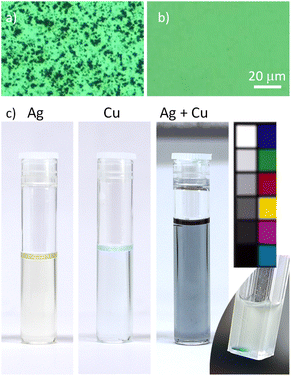
Freshly prepared Ag, Cu, and Ag/Cu nanofluids appear opaque and dark grey due to the presence of NP agglomerates. These may reach a micrometer-scale size and can be easily observed using an optical microscope. Ultrasonication in a low-power ultrasonic bath helps in destroying the agglomerates but only partially. A more powerful 100 W ultrasonic homogenization leads to a complete disappearance of the agglomerates, at least in the view field of the optical microscope (Fig. 4a and b).The nanofluids remain opaque and greyish; however, they now exhibit a color shade depending on the metal. The opaqueness subsides with time, the nanofluids become translucent, and the color becomes more pronounced: yellow for Ag, light green for Cu, and bluish for Ag/Cu, as shown in Fig. 4c. At the same time, dark deposits accumulate at the bottom of the vials, evidencing that agglomeration still occurs. For scientific curiosity, we also show in Fig. 4c the ‘unsuccessful’ binary sample, in which Ag and Cu NPs were not distributed homogeneously within the solvent volume but, for a still unknown reason, created a local region of higher concentration. This region exhibits a distinct and fascinatingly intensive blue color, the origin of which requires further investigation.
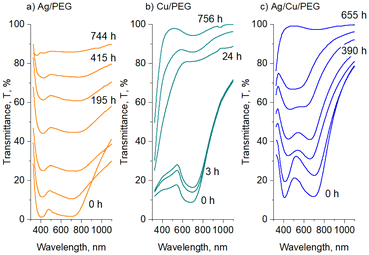
Apparently, the color of the Ag, Cu and Ag/Cu nanofluids is associated with localized surface plasmon resonance (LSPR), a phenomenon that has been investigated for almost two centuries in these metals.1 For a deeper insight, UV-vis spectra were acquired immediately after the sample preparation and mild ultrasonication, and their time evolution was followed. Fig. 5a–c show such spectra for 30 nm Ag and Cu NPs deposited into PEG as single or bimetal nanofluids (50 nm NPs are not shown for simplicity).
The Ag nanofluid shows two transmittance minima at ∼400 and 700 nm, which are often related to different modes of multipolar LSPR.54 In spherical NPs much smaller than the irradiation wavelength, the electric field is considered to be uniform, so that only dipole LSPR is effective, and a spectrum has only one transmittance minimum. In larger NPs, higher plasmonic modes can be excited, producing simultaneously dipole and quadrupole LSPR. These modes manifest themselves as double transmittance minima at higher and lower wavelengths, respectively. Alternatively, higher modes can be excited via the plasmonic coupling between two or more neighboring NPs, provided that the gap between them is narrow, as is the case for NP agglomerates.55 Since our experimental equipment does not produce Ag NPs larger than 80 nm, we claim here (providing some evidence later) that it is the agglomerates of smaller NPs that are responsible for the double transmittance minima observed in the spectrum. The minimum at 400 nm can arise from the dipole LSPR of small NPs and higher modes of the larger agglomerates, whereas the minimum at 700 nm originates from the dipole mode of the agglomerates.
The Cu nanofluid shows a broad LSPR at ∼700 nm without a signal from the second transmittance minimum. The band belongs to the dipole plasmonic mode of small NPs, and we may only guess by analogy with Ag NPs that the contribution from the higher modes of larger agglomerates might be present here as well. Interestingly, if Ag and Cu NPs are deposited simultaneously, they produce nanofluids with bimodal optical transmittance similar but not identical to that of the Ag/PEG nanofluid. Unfortunately, the second transmittance minimum of Ag overlaps with the transmittance minimum of Cu, and it is impossible to distinguish the individual contributions of the two metals to this band. A hint, rather curious than rigorous, of a predominant contribution of Cu can be found again in Fig. 4c, where the binary Ag/Cu nanofluids show a bluish color, which is closer to the green color of Cu/PEG and more distant from the yellow color of Ag/PEG. Later, we will provide a closer inspection and additional data to investigate the issue of Ag and Cu interactions in the binary nanofluids.
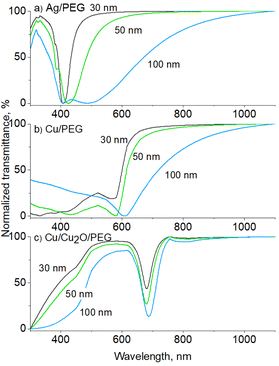
The transmittance UV-vis spectra were also simulated using a MiePlot software for Ag and Cu NPs in PEG, using lognormal distribution and a standard deviation of 20% corresponding to the NPs deposited on Si. For 30 nm Ag NPs (Fig. 6a), only the dipole LSPR is obtained positioned at 409 nm, which matches very well the experimentally measured value. The position red shifts with increasing mean size, but for the 100 nm Ag NPs, a double minimum appears in the transmittance curve, corresponding to the dipole and quadrupole LSPR. The results are in line with our observations that Ag NPs become strongly coagulated when in PEG, and the mild ultrasonic treatment is not capable of eliminating the agglomerates.
Simulated 30 nm Cu NPs show the LSPR at 575 nm (Fig. 6b), which also red shifts with the mean size but remains far below the experimentally measured value of ∼700 nm. The discrepancy can be explained by the oxidation effects that occur on the Cu NP surface. Previous studies have shown that oxidation of Cu NPs to Cu2O NPs leads to the disappearance of Cu LSPR at 575 nm and the development of a broad band at >700 nm,56–59 which can be attributed to phonon-assisted recombination of excitons in Cu2O.60 The assumption is further supported by a simple consideration of the solution color. The red color of Cu NP solutions has frequently been reported to change to green due to oxidation to Cu2O.56,59 Thus, the green color of the Cu nanofluids obtained in our work points to oxidation.
Our earlier studies showed that Cu NPs do not oxidize due to the interaction with oxygen in polyethers;53 therefore, the oxidation may be driven by the presence of oxygen and/or water molecules in the solvent. Although O2 and H2O can hardly be expected to remain in PEG during deposition under vacuum, they can be easily absorbed by PEG when samples are handled in air. Indeed, our complementary NMR measurements detected the presence of 3.5 wt% of H2O in PEG stored in ambient air. Hence, water as well as dissolved O2 molecules could be the factors leading to Cu oxidation. Since previous in-liquid environmental XPS studies did not detect the formation of CuO,26 the oxidation is limited to Cu2O alone. To demonstrate this, UV-vis transmittance spectra were simulated for polydisperse (standard deviation is 20%) core/shell Cu/Cu2O NPs in PEG (Fig. 6c). The radius of the Cu core was chosen to be equal to the thickness of the Cu2O shell. The simulation results agree well with the experimentally measured curves, as they show that the LSPR band shifts from 575 to 680 nm only by conversion of a part of Cu to Cu2O.
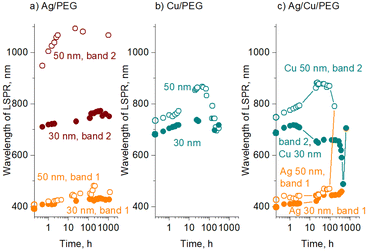
For all three types of the nanofluids prepared, the sedimentation of larger agglomerates manifests itself as an overall increase in optical transmittance over time. Furthermore, the positions of the transmittance minima also change, as shown in Fig. 7 for Ag, Cu, and Ag/Cu nanofluids. As expected, larger 50 nm Ag and Cu NPs show LSPR at wavelengths larger than their 30 nm counterparts.
For Ag nanofluids, four data sets are shown, corresponding to two transmittance minima and two mean sizes of 30 and 50 nm (Fig. 7a). In all the cases, the LSPR red shifts with time. If the first transmittance minimum at ∼400 nm (band 1) was contributed only by the dipole LSPR of small NPs, its position would stay constant, as we do not expect their size distribution to change (see also the in-liquid SAXS results below). Therefore, the red shift of band 1 is caused by the influence of the quadrupole mode of larger agglomerates. The agglomerates increase in size with time, giving rise to a red shift of both dipole (band 2) and quadrupole (band 1) modes.
In contrast to Ag, Cu nanofluids show a single transmittance minimum but with a more complex evolution of its position (Fig. 7b). The LSPR red shifts in the early stage, but then it passes through a maximum, returning to an initial value, and even further toward the lower wavelengths. The effect is more pronounced for 50 nm Cu NPs, although 30 nm NPs also follow this trend in the early stages. This interesting behavior is probably caused by the counterbalancing phenomena of oxidation and agglomeration. Along the same line of thought and assuming that the transmittance minimum is given by a combination of the dipole mode of small NPs and quadrupole modes of their agglomerates, the initial red shift of LSPR might be due to agglomerates increasing in size and shifting their quadrupole plasmonic mode. This shift is undoubtedly accompanied by the partial conversion of Cu to Cu2O, which should even enhance the red shift. At a certain moment, the oxidation stops or at least becomes slower, which corresponds to the maximum values of the LSPR position. The following blue shift is not entirely clear and should be interpreted with caution. One possible explanation for this decrease might be that higher-than-quadrupole LSPR modes may become operative in large agglomerates. If present, these modes should be visible at shorter wavelengths by definition.
Fig. 7c shows the evolution of the positions of the two transmittance minima for binary Ag/Cu/PEG nanofluids. Remarkably, the trends observed for Ag and Cu NPs in the binary nanofluid closely follow those of the single-metal solutions. This is particularly notable for the behavior of the second band, which passes through a maximum in an exact manner as is observed for the LSPR of Cu/PEG. Such a resemblance argues in favor of our hypothesis that the second transmittance minimum in the binary nanofluid is dominated by the plasmonic effects of Cu/Cu2O, perhaps only with a minor contribution from Ag. Another interesting aspect that emerges from the analysis of the binary nanofluid is that, in the late stage, the LSPRs of Ag and Cu shift in opposite directions toward each other. As a consequence, they merge into a single broad band and become indistinguishable.
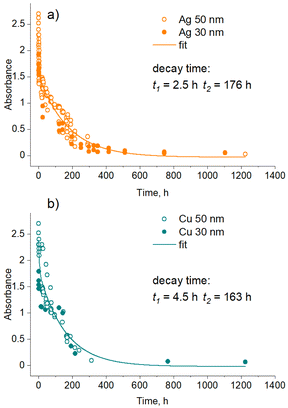
Further analysis investigated the kinetics of the sedimentation of NPs and showed that it depends on the type of metal. Fig. 8 shows the time dependence of the optical absorbance in the LSPR position for single-metal Ag (band 1) and Cu nanofluids. Although 30 and 50 nm NPs should experience different gravities, no significant differences were found between them in UV-vis spectra. Assuming that the optical absorbance is proportional to the metal concentration (Beer–Lambert law), we may consider that these dependences represent the time evolution of the metal concentration. A single exponential decay function was found to fit the data well in the early regime but failed at a later stage. Satisfactory fits were obtained using a double exponential decay function. Thus, the sedimentation of Ag and Cu NPs is characterized by two regimes with different characteristic times. A downside of the methodology used is that the LSPR bands are contributed by dipole and quadrupole modes of differently sized particles, and it is impossible to distinguish between the small NPs and their agglomerates. In this sense, the characteristic times obtained are rather apparent values of more complex sedimentation processes.
Interestingly, in the early regime, Ag NPs sediment faster than Cu NPs, as evidenced by a shorter characteristic time (t1 = 2.5 h for Ag vs. t1 = 4.5 h for Cu). We attribute this regime to the agglomeration-dominated mechanism, in which NPs stick to each other, forming heavy agglomerates at the micrometer scale that sink relatively fast. Ag NPs seem to be more prone to the agglomeration showing faster sedimentation, whereas Cu NPs exhibit less efficient sticking.
In the late regime, no significant differences were found between Ag and Cu, both showing close sedimentation kinetics. Here, the concentration of NPs is too low, and so is the probability of their contact with each other. In this case, the stability of the solution is governed by the gravitational settling of small NPs that is perturbed by the Brownian motion. We also note that this UV-vis methodological analysis might not be fully representative of the real picture because it may have concealed two different diffusion kinetics of small NPs as determined by CFD simulations. Thus, the real sedimentation kinetics might be even more complex and cover at least three different characteristic time scales.
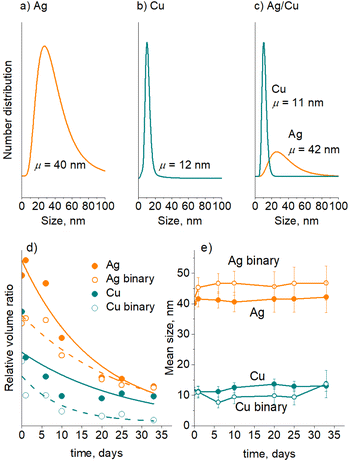
A separate series of experiments were performed on Ag/PEG, Cu/PEG, and Ag/Cu/PEG nanofluids using in-liquid SAXS. For these measurements, the experimental parameters for sputtering of Cu were changed to produce NPs of smaller size to distinguish them from larger Ag NPs in the binary nanofluid. Fig. 9a–c show the number-weighted size distribution of the NPs as obtained by fitting the scattering curves with a model of spherical particles obeying a lognormal size distribution. The Ag and Cu size distributions have mean values of 40 nm and 12 nm, respectively. Interestingly, fitting of the scattering curve of the binary nanofluid with two log-normal functions gives two distributions with mean sizes of 42 nm and 11 nm, which allows us to attribute them to Ag and Cu NPs. It should also be noted that the SAXS instrument used in this work is sensitive to nano-objects of less than 90 nm size. Therefore, larger agglomerates are excluded from this analysis.
Three nanofluids were left in the capillaries, and their SAXS curves were acquired regularly at the same spot in the middle of the capillary for about a month. Fig. 9d–e show the evolution of the relative volume ratio and the mean size of the NPs with storage time. Note that the SAXS measurements were performed with large time intervals and hence the early agglomeration-dominated regime was skipped in this case. As expected, the relative volume ratio occupied by the NPs decreases with time, which reflects the decrease in the NP concentration as a result of their gravitational settling; however, the NP mean size remains markedly constant. These findings also support our earlier assumption that small Ag and Cu NPs remain in solution with the initial size distributions, and the red shift of the short-wavelength LSPR bands is given by the quadrupole mode of larger agglomerates. In the binary nanofluid, interestingly, Ag and Cu NPs retain their mean sizes in a manner similar to that of the single metal nanofluids, which is also in line with the UV-vis spectrometry data and indicates that mutual Ag–Cu interactions are not effective.
Taken together, the UV-vis and SAXS results suggest that Ag is more prone to agglomeration than Cu. What is also striking here is that Ag NPs appear to be unaffected by Cu NPs and vice versa. The trend found here is consistent with previous theoretical findings showing that the interaction between 3d and 4d metals is not effective because of weak relativistic phenomena in the electronic shells of the latter.61 In Ag, for example, relativistic shrinking of inner s-orbitals is not strong, which results in stronger binding energies of outer 4d electrons. These remain misaligned with the energetic levels of 3d electrons of Cu, substantially diminishing the 4d Ag–3d Cu bonding.
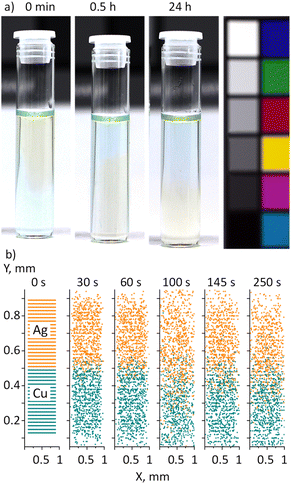
The following experiment was performed to investigate the interaction between Ag and Cu NPs in PEG from a different perspective (Fig. 10a). A 1.5 mL aliquot of green Cu nanofluid was placed at the bottom of a vial, and then 1.5 mL of yellow Ag nanofluid was carefully added on top, avoiding mixing. Thus, the resultant fluid consisted of a green Cu bottom and a yellow Ag top. No notable mixing was found between the two liquids if they were kept intact. Instead, the Ag nanofluid started penetrating to the bottom, displacing the Cu nanofluid to the top. After half an hour, an inverse color arrangement with a yellow Ag bottom and a green Cu top was observed, which stayed preserved for at least 24 hours.
Taking into account the higher bulk density of Ag (10![[thin space (1/6-em)]](https://www.rsc.org/images/entities/char_2009.gif) 490 kg m−3) compared to that of Cu (8960 kg m−3), the observed swap of nanofluids strongly resembles the buoyancy-driven flow of two immiscible liquids,62 which occurs due to Rayleigh–Taylor instability of their interface.63,64 If the liquid on top is denser, the interfacial equilibrium is unstable, and a small disturbance results in the heavier liquid starting to flow downward, displacing the lighter liquid upward. In the end, a new interface is formed such that the lighter liquid is on top and the heavier liquid is at the bottom. In contrast to the initial state, the new interface is stable because any small perturbation leads to an increase in potential energy.
490 kg m−3) compared to that of Cu (8960 kg m−3), the observed swap of nanofluids strongly resembles the buoyancy-driven flow of two immiscible liquids,62 which occurs due to Rayleigh–Taylor instability of their interface.63,64 If the liquid on top is denser, the interfacial equilibrium is unstable, and a small disturbance results in the heavier liquid starting to flow downward, displacing the lighter liquid upward. In the end, a new interface is formed such that the lighter liquid is on top and the heavier liquid is at the bottom. In contrast to the initial state, the new interface is stable because any small perturbation leads to an increase in potential energy.
What is surprising here is that the Ag and Cu nanofluids share the same host liquid and hence should be entirely miscible. One would then expect that the Brownian motion should force Ag and Cu NPs to mix with each other, probably showing a vertical compositional gradient due to the higher gravitational instability of Ag NPs. We performed 2D CFD simulations of the NP motion in the vicinity of the interface between Ag/PEG and Cu/PEG nanofluids (Fig. 10b). A 1 × 1 mm fluid PEG domain was created and two sets of 20 nm spherical NPs were added. Each set contained 40 × 20 evenly distributed NPs, with Ag and Cu NPs occupying the upper and lower halves of the PEG domain. Symmetrical boundary conditions without walls were chosen so that NPs could escape the domain when they reach its boundary. Hence, the model represents an unconfined local region in the proximity of the interface between the two nanofluids. The simulations demonstrate that NPs undergo the Brownian motion, blurring the initially sharp interface after some time. Nevertheless, even after 250 seconds, the two half-domains remain distinct and predominantly filled with the single-type NPs. No indication of gravitational exchange between the Ag and Cu nanofluids can be observed. Hence, other effects should be responsible for the experimentally observed swapping of nanofluids without mixing.
The phenomenon might be due to a very small density contrast between the two nanofluids. Because the metal concentration is low and the difference in density between Ag and Cu is not very high, the Atwood number should be extremely low. Given the experimental data, the Atwood number is calculated to be At = (ρAgNF - ρCuNF)/(ρAgNF + ρCuNF) = 4 × 10⁻⁷, where ρAgNF and ρCuNF are densities of the Ag/PEG and Cu/PEG nanofluids. Previous experiments showed that the interpenetration of two miscible liquids with a small density contrast may proceed with a limited diffusion profile between them.65 In this case, stable counterflows of the two liquids appear with sharp non-intermixing boundaries. Hence, our results might indicate that an ineffective interaction between Ag and Cu, together with a very small density contrast between the Ag and Cu nanofluids, may be responsible for the buoyant-driven swapping of these nanofluids without mixing.
Interfacial interactions of NPs with PEG
DFT calculations were performed to explain the kinetic differences between the agglomeration of Ag and Cu NPs. As discussed above, the green color of the Cu/PEG nanofluids and the red shift of their LSPR point to partial oxidation of Cu that leads to the formation of the Cu2O shell around the NPs. Therefore, DFT calculations were performed not only for the Ag(111) and Cu(111) metal surfaces, but also for Cu2O(111). The long molecule of PEG400 was approximated by a smaller molecule of ethylene glycol (HO–CH2–CH2–OH). The relaxed interface geometries on Ag(111), Cu(111), and Cu2O(111) are shown in Fig. 11, whereas Table 3 summarizes the results of the calculations. The numbers suggest that there are no significant differences between Ag and Cu. The slightly higher interaction energy, the total bond order, and the charge on the EG molecule obtained for Cu may point to a somewhat higher stability of Cu in PEG but this cannot explain the significant difference in the early agglomeration kinetics. However, a striking difference was found for Cu2O: here, a substantially stronger interaction energy was obtained, which corresponds to almost twice the value for Ag and Cu. The total bond order and the charge on the molecule are also substantially higher in this case. Thus, the Cu2O surface exhibits stronger affinity for EG and consequently stronger resistance to agglomeration as compared to Ag and Cu.| Parameter | EG–Ag(111) | EG–Cu(111) | EG–Cu2O(111) |
|---|---|---|---|
| E int, eV | −1.67 | −1.73 | −3.19 |
| Total BO | 1.08 | 1.16 | 1.53 |
| Charge on the molecule, |e| | 0.139 | 0.177 | 0.245 |
Although the EG molecule resembles PEG in terms of the end groups, it does not have the characteristic ether structure. To obtain a closer analogy, diethylene glycol (HO–CH2–CH2–O–CH2–CH2–OH) was chosen as the shortest homologue of PEG. In this case, the length of the model molecule allowed us to investigate the monodentate (left column of Fig. 12) and bidentate (right column of Fig. 12) coordination of DEG to the Ag(111), Cu(111), and Cu2O(111) surfaces. The results of the calculations are given in Table 4.
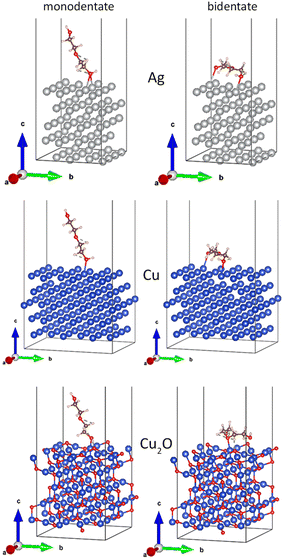 | ||
| Fig. 12 Relaxed interface geometries of DEG onto the Ag(111), Cu(111), and Cu2O(111) surfaces. Left column: monodentate configuration and the right column: bidentate configuration. | ||
| Parameter | DEG–Ag(111) | DEG–Cu(111) | DEG–Cu2O(111) | |||
|---|---|---|---|---|---|---|
| mono | bi | mono | bi | Mono | bi | |
| E int, eV | −1.14 | −2.46 | −1.23 | −2.71 | −2.45 | −3.58 |
| Total BO | 0.68 | 1.61 | 0.62 | 1.82 | 1.03 | 1.79 |
| Charge on the molecule, |e| | 0.126 | 0.198 | 0.226 | 0.316 | 0.199 | 0.296 |
Similar to EG, the interaction energy of DEG increases in the sequence of Ag < Cu ≪ Cu2O for both mono- and bidentate orientation. Interestingly, the total charge on the molecule changes in a different manner and yields an order Ag < Cu ≈ Cu2O, unveiling the fact that the incorporation of oxygen does not significantly affect the strength with which copper affects the distribution of the electronic density in DEG. Since the bond order and charge are even slightly higher for Cu compared to Cu2O in the bidentate geometry, whereas the interaction energy is much larger for Cu2O, there should be an additional interaction component, which might be attributed to the electrostatic interactions between the charge distribution in DEG and in Cu2O.
These findings are intriguingly in line with our complementary measurements of zeta potential that were performed directly on the nanofluids. Ag and Cu NPs were found to exhibit electrokinetic phenomena when in PEG, resulting in ζ = −35 ± 4 mV for Ag and ζ = −44 ± 6 mV for Cu. The formation of an interfacial double layer is well documented for Ag, Cu, and Cu2O NPs in aqueous solutions, and it is commonly attributed to protonation/hydroxylation of the surface in contact with dissociative water. For NPs in polymer melts, the existence of the double layer is not that obvious because dissociation has been poorly studied in such systems. Nevertheless, our experiments unambiguously demonstrate the electrokinetic response of Ag and Cu NPs in PEG and our DFT calculations suggest that PEG acquires a negative charge upon interaction with the metal or metal oxide surface due to the redistribution of the electronic density and not necessarily due to the dissociation. The larger charge of DEG on Cu/Cu2O than on Ag agrees well with the more negative zeta potential measured on Cu NPs in PEG. Altogether, the data collected reinforce our argument that the interactions between Cu2O and PEG are stronger than those for Ag/PEG and Cu/PEG, so that the colloidal stability of oxidized Cu dispersions is higher.
Considering the difference between the monodentate and bidentate coordination of DEG, the interaction energy is found to be stronger in the latter case, evidencing that the side-on orientation is more energetically favorable than the end-on orientation. Our previous experiments with Cu NPs and higher molar mass poly(ethylene oxide) revealed that polyethers form an adsorbed layer in the vicinity of the NP surface, with a thickness of less than 10 nm.53 It can be expected that shorter PEG chains create an adsorbed layer of an even smaller thickness. To evaluate this thickness, we choose the following line of argument. The upper limit of the thickness is when macromolecules attach to the NP surface with one end and fully stretch, creating a densely packed polymer brush (Fig. 13a). If n is the number of monomers per polymer chain (n = 9 for PEG400) and a is the length of one monomer (a = 0.35 nm for PEG),66 macromolecules stretch to a maximum length of L = 3.2 nm.
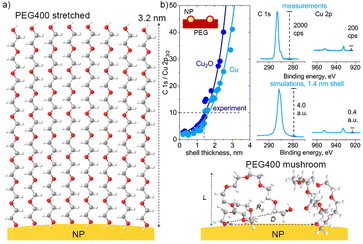 | ||
| Fig. 13 (a) Two types of PEG400 configuration on the NP surface: high-density brush and low-density mushroom arrangements; (b) SESSA simulations of XPS C 1s and Cu 2p spectra with different thicknesses of the PEG shell over Cu or Cu2O NPs; the simulations are compared with the XPS spectra measured on the Cu/PEG nanofluid using an enviro-ESCA.26 | ||
Another conformation that PEG can acquire is the mushroom arrangement, when the grafting density is small, and the macromolecular size is determined by the Flory radius (for polymer solutions) or by the characteristic size of an ideal chain R0 = an1/2 (for polymer melts). In the latter case, which is the focus of our study, the attached chains coexist with mobile chains (of the same chemical composition and length) that do not stick to the NP surface. The ratio between the two is determined by the grafting density σ, which is also related to the average distance D between the grafted chains. De Gennes developed the mathematical formalism describing this situation and found the following relationships:67
| D = aσ−1/2 | (6) |
| L = naσ1/2 | (7) |
In this notation, σ is a dimensionless parameter ranging from zero for no PEG attachment to 1 for complete coverage of all anchoring sites on the surface. If one determines any of these parameters (L, D, or σ), the other two can be easily calculated.
We attempted to estimate the thickness of the adsorbed layer using the results of our earlier in-liquid XPS measurements of the Cu/PEG nanofluid26 and comparing them with the results of the simulations using the SESSA code (Fig. 13b). For simulations, a model surface consisting of 30 nm Cu NPs and PEG was created. The NPs were distributed over a semi-infinite PEG layer with a period of 240 nm, which corresponds to the mean size between the NPs estimated from the earlier acquired in-liquid TEM images.26 The NPs were also submerged in PEG to a depth of their radius. The upper NP hemispheres were covered with PEG shells of variable thickness. In real Cu/PEG nanofluids, NPs undergo the Brownian motion, continuously entering and leaving the subsurface layers detectable by XPS and establishing an equilibrium concentration. Given the simulation design, the minimal shell thickness should correspond to the thickness of the adsorbed PEG layer (or be zero if there is no adsorbed layer and only bare Cu NPs protrude beyond the surface).
Fig. 13b shows that the ratio of intensities of the simulated C 1s and Cu 2p3/2 spectra is dependent on the thickness of the shell for NPs made of Cu and Cu2O. Both materials reveal the same dependences, although Cu2O gives slightly higher values of C 1s/Cu 2p3/2. Even without the shell, the C1s signal strongly dominates over the Cu 2p3/2 signal, reflecting the fact that the largest surface area in between the NPs consists of PEG. With increasing shell thickness, the Cu 2p3/2 signal becomes even more attenuated and disappears almost completely at L > 4.0 nm. Importantly, in the limiting case of the adsorbed layer consisting of fully stretched PEG brushes with L = 3.2 nm, the simulated C 1s/Cu 2p3/2 should be approximately 50; however, the spectrum of the real nanofluid shows C 1s/Cu 2p3/2 = 10, indicating that Cu must be closer to the surface. Therefore, the formation of extended brushes around the NPs is highly unlikely.
To obtain a simulated XPS spectrum very similar to that measured experimentally, a smaller shell thickness must be chosen, and Fig. 13b shows such a spectrum for L = 1.4 nm. In real nanofluids, NPs are submerged below the liquid surface rather than protruding above it, and therefore the equal C 1s/Cu 2p3/2 ratio should be reached at an even smaller thickness of the adsorbed layer. Recognizing that the results obtained must be interpreted with caution because this and several other simplifications were assumed, we may use L = 1.4 nm as a rough and upper estimate of the thickness of the adsorbed PEG shell. In this case, according to eqn (6) and (7), σ = 0.20 or smaller and D = 0.8 nm or larger. With these numbers, we estimate that the number of PEG chains adhering per 30 nm Cu NP is smaller than N = 1800. Because Ag interacts with PEG weakly, we may expect L, σ, and N to be smaller, and D to be larger in its case.
Table 5 summarizes the most important size parameters of PEG chains adsorbed on Cu NPs and provides crossover values of σ between different grafting regimes according to the De Gennes theory. Given these numbers, we conclude that PEG chains adsorb onto NPs in a low-density or intermediate regime, with the thickness of the adsorbed layer very close to the characteristic size of an ideal chain (random coil) R0 = 1.0 nm. Some chains may experience overlapping; however, the interactions between them are still negligible. Mobile PEG chains may also come into contact with the NP surface that is not occupied by the adhering chains, but they do not have an impact on the chain conformation either.
| Adsorbed PEG layer | |||
|---|---|---|---|
| a Here, p is the polymerization degree of the mobile chains. In our case, p = n = 9. | |||
| R 0 = 1.0 nm | L < 1.4 nm | D > 0.8 nm | σ < 0.20 |
| De Gennes theory | ||
|---|---|---|
| Chain conformation | Condition | PEG400 on Cu |
| Low-density limit; the thickness of the grafted layer is given by R0 = 1.0 nm | σ < 1/n | σ < 0.11 |
| Intermediate domain; the grafted chains start overlapping but without significant interaction; the chains are still ideal, L ≈ R0 | 1/n < σ < pn−3/2a | 0.11 < σ < 0.33 |
| Onset of stretching and expulsion of mobile chains L >> R0 | σ > pn−3/2 | σ > 0.33 |
The small thickness of the adsorbed layer might be a reason for the limited early-stage colloidal stability observed in such nanofluids. Attractive van der Waals forces between the NPs may not be effectively screened by the adhering chains, whereas mobile chains may be expelled, exposing the bare NP surface for metal–metal interactions. Entropic barriers are also low for chains with a small R0 and, obviously, they are insufficient to prevent agglomeration either. Future studies should aim to increase the grafting density of PEG to a value of σ > 0.33 so that the onset of macromolecular stretching is achieved. In this case, enhanced colloidal stability can be expected.
Conclusions
We show that two sputtering-based gas aggregation cluster sources can be used in tandem for the synthesis of Ag and Cu NPs with their subsequent loading into a vacuum-compatible liquid of PEG400. Such nanofluids are characterized by the presence of only dispersed metals and the base liquid, without the involvement of other solvents, chemical residues, or by-products. The size distribution and concentration of NPs can be tuned by parameters of sputtering and the deposition time.NPs deposit on the PEG surface in the soft-landing regime and lose their kinetic energy almost immediately. Nevertheless, they do not form a deposit on the liquid surface, but effectively diffuse into the bulk. CFD simulations estimate the velocity of the propagating front to be of the order of several μm s−1. Such a velocity is sufficient for loading the entire volume of the polymer without additional stirring.
Single-metal Ag/PEG and Cu/PEG nanofluids and binary Ag/Cu/PEG nanofluids have been successfully produced. Immediately after preparation, partial agglomeration of NPs and sedimentation of larger agglomerates occur, with Ag showing faster sedimentation kinetics than Cu. UV-vis measurements detected LSPR bands, which are at the expected positions for Ag NPs but are significantly red-shifted for Cu NPs. Simulations of Mie scattering and DFT calculations prove that the observed shift is given by the oxidation of Cu to Cu2O. The interaction energy between Cu2O and the model DEG molecule is substantially higher than that in the case of Ag and Cu, making the oxidized Cu NPs more stable. Considering the total bond order and charge on the DEG molecule, which are approximately equal for Cu and Cu2O, we suggest that the electrostatic interactions between DEG and Cu2O should play a role in the stabilization of NPs. Indeed, electrophoretic light scattering measurements revealed that the zeta potential of oxidized Cu NPs is more negative (−44 mV) than that of Ag NPs (−35 mV) in PEG.
After sedimentation of larger agglomerates, colorized nanofluids are obtained: yellow for Ag/PEG, green for Cu/PEG, and blue for Ag/Cu/PEG. When yellow Ag/PEG is gently added on top of green Cu/PEG, the liquids swap in half an hour, so that the yellow liquid resides at the bottom and the green liquid is pushed to the top. The CFD simulations reveal that the inter-diffusion of Ag and Cu NPs into PEG is limited, at least at the time scale of several minutes, although the interface between the two liquids becomes blurred. Thus, viscous PEG prevents Ag and Cu NPs from significant intermixing. The effect resembles the behavior of counterflows of two miscible liquids, in which a small density contrast prevents their interpenetration; however, it remains unclear what is the driving force for the Ag/PEG and Cu/PEG nanofluid exchange in their static state.
Taking advantage of the mathematical formalism of the De Gennes theory, we assess the adsorption of PEG molecules on the surface of the NPs. With the support of the previous experiments, the calculations show that PEG molecules attach in the mushroom configuration with the thickness of the adsorbed layer being less than 1.4 nm, the grafting density being less than 0.20, and the average distance between the grafted chains being larger than 0.8 nm. In such a low-density regime, the rest of the surface remains in dynamic contact with non-adherent PEG molecules, and steric barriers reduce agglomeration, but do not allow to completely avoid it.
In summary, we have devised an innovative method that allows for the direct loading of different NPs into vacuum-compatible liquids, without the use of complex synthetic pathways. Because the synthesis of NPs is decoupled from their embedding into the base liquid, the dispersed phase is not limited to metals, but nanofluids of inorganic compounds, polymers, or hybrid materials could potentially be prepared, providing the foundation for fundamental research on interfacial interactions unbiased by the presence of solvents or chemical residues.
Author contributions
The manuscript was written through contributions of all authors. All authors have given approval to the final version of the manuscript.Conflicts of interest
There are no conflicts to declare.Acknowledgements
This work was supported by the Czech Science Foundation via the grant GACR 21-12828S. Kateryna Biliak acknowledges the support from the Charles University via the student grant GAUK 298722. Students S. A.-O. and M. P. acknowledge the support from the Charles University via the grant SVV 260 579-2022. The DFT calculations were supported by the Consortium des Équipements de Calcul Intensif (CÉCI), funded by the Fonds National de la Recherche Scientifique (F. R. S.-FNRS) under Grant No. 2.5020.11. J.C. and S.K. are FNRS research fellows.References
- M. Faraday, Philos. Trans. R. Soc. London, 1857, 147, 145–181 CrossRef.
- O. Z. Sharaf, R. A. Taylor and E. Abu-Nada, Phys. Rep., 2020, 867, 1–84 CrossRef CAS.
- S. Yatsuya, K. Mihama and R. Uyeda, Jpn. J. Appl. Phys., 1974, 13, 749–750 CrossRef CAS.
- G. Ye, Q. Zhang, C. Feng, H. Ge and Z. Jiao, Phys. Rev. B: Condens. Matter Mater. Phys., 1996, 54, 14754–14757 CrossRef CAS PubMed.
- H. Wender, L. F. de Oliveira, A. F. Feil, E. Lissner, P. Migowski, M. R. Meneghetti, S. R. Teixeira and J. Dupont, Chem. Commun., 2010, 46, 7019 RSC.
- M. Staszek, J. Siegel, S. Rimpelová, O. Lyutakov and V. Švorčík, Mater. Lett., 2015, 158, 351–354 CrossRef CAS.
- M. M. De Luna, P. Karandikar and M. Gupta, ACS Appl. Nano Mater., 2018, 1, 6575–6579 CrossRef CAS.
- S. Suzuki, A. Morimoto, S. Kuwabata and T. Torimoto, Jpn. J. Appl. Phys., 2021, 60, SAAC01-1–SAAC01-8 CrossRef.
- M. Zhu, M. T. Nguyen, Y. R. Chau, L. Deng and T. Yonezawa, Langmuir, 2021, 37, 6096–6105 CrossRef CAS PubMed.
- A. Sergievskaya, A. O'Reilly, A. Chauvin, J. Veselý, A. Panepinto, J. De Winter, D. Cornil, J. Cornil and S. Konstantinidis, Colloids Surf., A, 2021, 615, 126286 CrossRef CAS.
- A. Dvurečenskij, A. Cigáň, P. Lobotka, G. Radnóczi, M. Škrátek, J. Benyó, E. Kováčová, M. Majerová and J. Maňka, J. Alloys Compd., 2022, 896, 163089 CrossRef.
- M. Meischein, A. Garzón-Manjón, T. Hammerschmidt, B. Xiao, S. Zhang, L. Abdellaoui, C. Scheu and A. Ludwig, Nanoscale Adv., 2022, 4, 3855–3869 RSC.
- K. Okazaki, T. Kiyama, K. Hirahara, N. Tanaka, S. Kuwabata and T. Torimoto, Chem. Commun., 2008, 691–693 RSC.
- T. Suzuki, K. Okazaki, T. Kiyama, S. Kuwabata and T. Torimoto, Electrochemistry, 2009, 77, 636–638 CrossRef CAS.
- M. T. Nguyen, T. Yonezawa, Y. Wang and T. Tokunaga, Mater. Lett., 2016, 171, 75–78 CrossRef CAS.
- Y. Ishida, R. D. Corpuz and T. Yonezawa, Acc. Chem. Res., 2017, 50, 2986–2995 CrossRef CAS PubMed.
- R. D. Corpuz, Y. Ishida, M. T. Nguyen and T. Yonezawa, Langmuir, 2017, 33, 9144–9150 CrossRef CAS PubMed.
- S. Suzuki, T. Suzuki, Y. Tomita, M. Hirano, K. Okazaki, S. Kuwabata and T. Torimoto, CrystEngComm, 2012, 14, 4922 RSC.
- D. Sugioka, T. Kameyama, S. Kuwabata, T. Yamamoto and T. Torimoto, ACS Appl. Mater. Interfaces, 2016, 8, 10874–10883 CrossRef CAS PubMed.
- L. Deng, M. T. Nguyen, J. Shi, Y. R. Chau, T. Tokunaga, M. Kudo, S. Matsumura, N. Hashimoto and T. Yonezawa, Langmuir, 2020, 36, 3004–3015 CrossRef CAS PubMed.
- C. H. Liu, J. Liu, Y. Y. Zhou, X. L. Cai, Y. Lu, X. Gao and S. D. Wang, Carbon N. Y., 2015, 94, 295–300 CrossRef CAS.
- C.-H. Liu, R.-H. Liu, Q.-J. Sun, J.-B. Chang, X. Gao, Y. Liu, S.-T. Lee, Z.-H. Kang and S.-D. Wang, Nanoscale, 2015, 7, 6356–6362 RSC.
- D. König, K. Richter, A. Siegel, A.-V. Mudring and A. Ludwig, Adv. Funct. Mater., 2014, 24, 2049–2056 CrossRef.
- A. Chauvin, A. Sergievskaya, A.-A. El Mel, A. Fucikova, C. Antunes Corrêa, J. Vesely, E. Duverger-Nédellec, D. Cornil, J. Cornil, P.-Y. Tessier, M. Dopita and S. Konstantinidis, Nanotechnology, 2020, 31, 455303 CrossRef CAS PubMed.
- L. Deng, M. T. Nguyen, S. Mei, T. Tokunaga, M. Kudo, S. Matsumura and T. Yonezawa, Langmuir, 2019, 35, 8418–8427 CAS.
- A. Choukourov, D. Nikitin, P. Pleskunov, R. Tafiichuk, K. Biliak, M. Protsak, K. Kishenina, J. Hanuš, M. Dopita, M. Cieslar, T. Popelář, L. Ondič and M. Varga, J. Mol. Liq., 2021, 336, 116319 CrossRef CAS.
- J. Kousal, A. Shelemin, M. Schwartzkopf, O. Polonskyi, J. Hanuš, P. Solař, M. Vaidulych, D. Nikitin, P. Pleskunov, Z. Krtouš, T. Strunskus, F. Faupel, S. V. Roth, H. Biederman and A. Choukourov, Nanoscale, 2018, 10, 18275–18281 RSC.
- A. Shelemin, P. Pleskunov, J. Kousal, J. Drewes, J. Hanuš, S. Ali-Ogly, D. Nikitin, P. Solař, J. Kratochvíl, M. Vaidulych, M. Schwartzkopf, O. Kylián, O. Polonskyi, T. Strunskus, F. Faupel, S. V Roth, H. Biederman and A. Choukourov, Part. Part. Syst. Charact., 2020, 37, 1900436 CrossRef CAS.
- M. K. Singh, P. Manda, A. K. Singh and R. K. Mandal, AIP Adv., 2015, 5, 107108 CrossRef.
- R. Robinson, V. Krause, S. Wang, S. Yan, G. Shang, J. Gordon, S. Tycko and C.-J. Zhong, Langmuir, 2022, 38, 5633–5644 CrossRef CAS PubMed.
- M. Hosny, M. Fawzy and A. S. Eltaweil, J. Environ. Manage., 2022, 316, 115238 CrossRef CAS PubMed.
- J. Ilavsky and P. R. Jemian, J. Appl. Crystallogr., 2009, 42, 347–353 CrossRef CAS.
- A. Li and G. Ahmadi, Aerosol Sci. Technol., 1992, 16, 209–226 CrossRef CAS.
- G. Marsaglia and T. A. Bray, SIAM Rev., 1964, 6, 260–264 CrossRef.
- P. Laven, MiePlot version 4.6, http://www.philiplaven.com/mieplot.htm Search PubMed.
- P. Laven and J. A. Lock, J. Opt. Soc. Am. A, 2012, 29, 1498 CrossRef PubMed.
- J. A. Lock and P. Laven, J. Opt. Soc. Am. A, 2012, 29, 1489 CrossRef PubMed.
- P. B. Johnson and R. W. Christy, Phys. Rev. B: Condens. Matter Mater. Phys., 1972, 6, 4370–4379 CrossRef CAS.
- C. Malerba, F. Biccari, C. Leonor Azanza Ricardo, M. D'Incau, P. Scardi and A. Mittiga, Sol. Energy Mater. Sol. Cells, 2011, 95, 2848–2854 CrossRef CAS.
- D. Shah, T. Roychowdhury, J. N. Hilfiker and M. R. Linford, Surf. Sci. Spectra, 2020, 27, 016001 CrossRef CAS.
- X. Carette, B. Debièvre, D. Cornil, J. Cornil, P. Leclère, B. Maes, N. Gautier, E. Gautron, A.-A. El Mel, J.-M. Raquez and S. Konstantinidis, J. Phys. Chem. C, 2018, 122, 26605–26612 CrossRef CAS.
- A. Chauvin, A. Sergievskaya, A. Fucikova, C. A. Corrêa, J. Vesely, J. Cornil, D. Cornil, M. Dopita and S. Konstantinidis, Nanoscale Adv., 2021, 3, 4780–4789 RSC.
- A. Sergievskaya, A. O’Reilly, H. Alem, J. De Winter, D. Cornil, J. Cornil and S. Konstantinidis, Front. Nanotechnol., 2021, 3, 710612 CrossRef.
- E. Artacho, E. Anglada, O. Diéguez, J. D. Gale, A. García, J. Junquera, R. M. Martin, P. Ordejón, J. M. Pruneda, D. Sánchez-Portal and J. M. Soler, J. Phys.: Condens. Matter, 2008, 20, 064208 CrossRef PubMed.
- J. P. Perdew, K. Burke and Y. Wang, Phys. Rev. B: Condens. Matter Mater. Phys., 1996, 54, 16533–16539 CrossRef CAS PubMed.
- T. A. Manz and N. G. Limas, RSC Adv., 2016, 6, 47771–47801 RSC.
- S. Grimme, J. Comput. Chem., 2006, 27, 1787–1799 CrossRef CAS PubMed.
- T. A. Manz, RSC Adv., 2017, 7, 45552–45581 RSC.
- NIST, Simulation of Electron Spectra for Surface Analysis (SESSA, version 2.2.0) Search PubMed.
- M. P. Seah and W. A. Dench, Surf. Interface Anal., 1979, 1, 2–11 CrossRef CAS.
- P. Solař, J. Kousal, J. Hanuš, K. Škorvánková, A. Kuzminova and O. Kylián, Sci. Rep., 2021, 11, 6415 CrossRef PubMed.
- B. M. Smirnov, I. Shyjumon and R. Hippler, Phys. Rev. E, 2007, 75, 066402 CrossRef PubMed.
- D. Nikitin, S. Madkour, P. Pleskunov, R. Tafiichuk, A. Shelemin, J. Hanuš, I. Gordeev, E. Sysolyatina, A. Lavrikova, S. Ermolaeva, V. Titov, A. Schönhals and A. Choukourov, Soft Matter, 2019, 15, 2884–2896 RSC.
- K. L. Kelly, E. Coronado, L. L. Zhao and G. C. Schatz, J. Phys. Chem. B, 2003, 107, 668–677 CrossRef CAS.
- M.-M. Jiang, H.-Y. Chen, B.-H. Li, K.-W. Liu, C.-X. Shan and D.-Z. Shen, J. Mater. Chem. C, 2014, 2, 56–63 RSC.
- K. P. Rice, E. J. Walker, M. P. Stoykovich and A. E. Saunders, J. Phys. Chem. C, 2011, 115, 1793–1799 CrossRef CAS.
- K. P. Rice, A. S. Paterson and M. P. Stoykovich, Part. Part. Syst. Charact., 2015, 32, 373–380 CrossRef CAS.
- O. Peña-Rodríguez and U. Pal, J. Opt. Soc. Am. B, 2011, 28, 2735 CrossRef.
- S. D. Pike, E. R. White, A. Regoutz, N. Sammy, D. J. Payne, C. K. Williams and M. S. P. Shaffer, ACS Nano, 2017, 11, 2714–2723 CrossRef CAS PubMed.
- D. W. Snoke, A. J. Shields and M. Cardona, Phys. Rev. B: Condens. Matter Mater. Phys., 1992, 45, 11693–11697 CrossRef CAS PubMed.
- L. G. Wang and A. Zunger, Phys. Rev. B: Condens. Matter Mater. Phys., 2003, 67, 092103 CrossRef.
- P. R. Redapangu, T. G. Kidan and K. Berhane, J. Appl. Fluid Mech., 2021, 14, 601–613 Search PubMed.
- L. Rayleigh, Proc. London Math. Soc., 1882, 1–14, 170–177 CrossRef.
- G. I. Taylor, Proc. Math. Phys. Eng. Sci., 1950, 201, 192–196 Search PubMed.
- M. Debacq, V. Fanguet, J. P. Hulin, D. Salin and B. Perrin, Phys. Fluids, 2001, 13, 3097–3100 CrossRef CAS.
- J. L. Perry, K. G. Reuter, M. P. Kai, K. P. Herlihy, S. W. Jones, J. C. Luft, M. Napier, J. E. Bear and J. M. DeSimone, Nano Lett., 2012, 12, 5304–5310 CrossRef CAS PubMed.
- P. G. de Gennes, Macromolecules, 1980, 13, 1069–1075 CrossRef CAS.
- A. K. Mishra, A. Roldan and N. H. de Leeuw, J. Chem. Phys., 2016, 145, 044709 CrossRef PubMed.
Footnote |
| † Electronic supplementary information (ESI) available. See DOI: https://doi.org/10.1039/d2na00785a |
| This journal is © The Royal Society of Chemistry 2023 |

