
 Open Access Article
 This Open Access Article is licensed under a Creative Commons Attribution-Non Commercial 3.0 Unported Licence
Molecular dynamics simulation of solidification epitaxial growth in a nanoscale molten pool
Lan
Zhan
 a,
Ninghui
Li
b and
Xiangge
Qin
*a
a,
Ninghui
Li
b and
Xiangge
Qin
*a
aSchool of Materials Science and Engineering, Jiamusi University, 258th Xuefu Street, Xiangyang District, HeiLongJiang 154007, PR China. E-mail: qinxiangge@jmsu.edu.cn
bSChool of Life Sciences, Iamusi University, 258th Xuefu Street, Xiangyang District, HeiLongJiang 154007, PR China
First published on 6th January 2023
Abstract
In the hot working process, the liquid metal part formed by the heat source on the workpiece is known as molten pool. Since the solidification process of the molten pool determines the mechanical properties of the structure after hot working, the molten pool solidification under the condition of rapid solidification has attracted the attention of researchers. In thisstudy, to understand the influence of the microstructure and morphology of the base metal on the solidification of the molten pool, a simulation system of epitaxial growth during the solidification of the molten pool is established based on molecular dynamics (MD), and the details of the epitaxial growth of the molten pool solidification are dynamically monitored. The results show that the nano molten pool produces two atomic layers of pre-melting on the base metal before solidification, and then, the molten pool continues to grow with the exposed and ordered atoms of the base metal as the nuclei. The transformation process of the final obtained solidification morphology is consistent with the results observed by in situ TEM experiments. These phenomena reveal the mutual guidance between the molten pool and the base metal during the solidification of the molten pool as well as the genetic effect of the parent metal on the crystallization of the molten pool. In addition, the crystal growth of molten pool solidification follows the growth pattern of directional solidification, from equiaxed to columnar, but the average grain size of each zone is smaller than that of directional solidification. Even the nucleation rate and dislocation density are an order of magnitude higher than in directional solidification. Therefore, the simulation results lay a foundation for the in-depth study of the molten pool solidification process at the atomic scale.
1. Introduction
In recent years, emerging technologies such as additive manufacturing, 3D printing, and pulsed laser melting have accelerated the cooling rate of the processing process due to the high concentration of heat source energy density, and the temperature gradient in the molten pool (i.e., the liquid metal part with a certain geometric shape formed on the workpiece under the effect of the heat source) far exceeds the temperature gradient of directional solidification. The large temperature gradient reduces the supercooling of the composition at the front of the growing grains, particularly for the tiny molten pool, resulting in an increase in the tendency of the structure to form columnar grains in the molten pool.1 This will significantly reduce the mechanical properties of the material, thus increasing the sensitivity to hot cracks and thermal deformation.2–4According to reports, the pulsed laser melting metal film under in situ transmission electron microscopy (TEM) has an extreme solidification process with a solidification front velocity in the range of 1–100 m s−1.5,6 To better understand and establish the process of molten pool solidification, direct experimental observations of the dynamics related to the solidification front will be desirable and instructive. Researchers have begun to extensively utilize in situ transmission electron microscopy to study the evolution of the microstructure during the rapid solidification of the molten pool.7–10 McKeown et al.7,10–13 have done a lot of work in the in situ observation of the rapid solidification of Al–Cu alloys. In situ TEM with high spatial and temporal resolution, pulsed laser melting of hypoeutectic Al–Cu alloy thin film was performed, and the kinetic image of the rapid solidification process was recorded at the same time. In situ TEM observation showed the transformation of equiaxed crystals to columnar crystals at the edge of the hypoeutectic Al–Cu alloy thin film melt pool, and it was found that a band-like structure was formed at a larger solidification front rate. Subsequently, combining dynamic TEM and phase mapping, they determined the deviation between the composition of the Al–Cu alloy phase and the predicted equilibrium value, as well as the unique orientation relationship between the solidification transformation products. These orientation relationships allow the formation of a coherent interface with low interface free energy, thereby inhibiting the growth of crystal grains in the columnar growth region. In the study of the rapid solidification of Al-4 at% Cu alloy films, McKeown et al.11 used PED-assisted ACOM to conduct TEM and scanning TEM (STEM) studies on the microstructure of the molten pool. Fig. 1 displays the transformation of the microstructure from the small equiaxed crystals in the substrate material area to the columnar crystals in the center of the molten pool. Zone 2 represents a narrow transition zone, from the crystal growth in the partially melted HAZ (zone 1) to the directional solidification of zone 3a. The crystal growth changes from the equiaxed crystal growth to columnar crystal growth. Zone 3b with a ribbon morphology is the central area of the rapidly solidified Al-4 at% Cu microstructure.
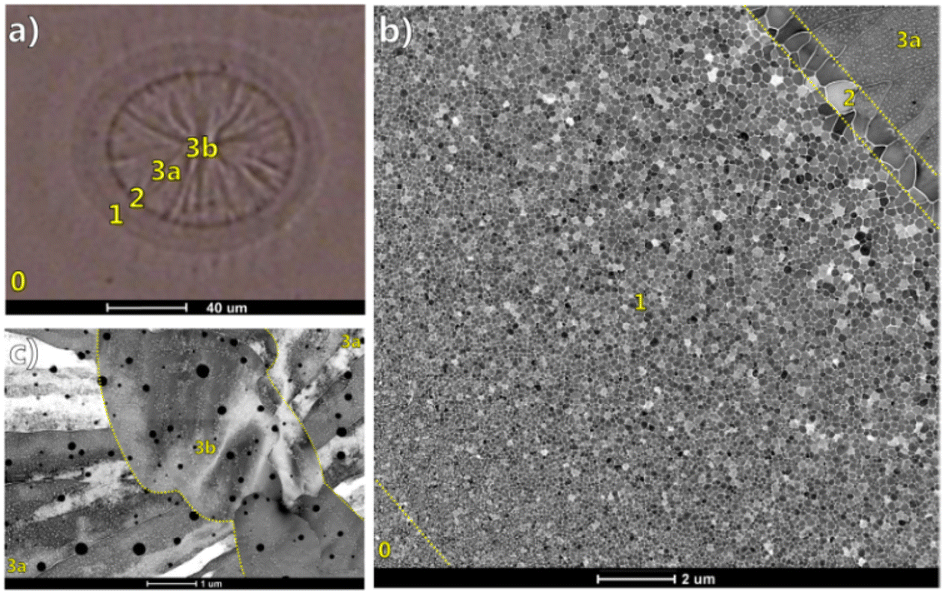 | ||
| Fig. 1 Optical micrograph of the laser-induced Al-4 at% Cu alloy thin film molten pool.11 (a) Regional markers of different morphologies of the solidified structure, (b) STEM annular dark field (ADF) images of four regions with different morphologies, (c) grain morphology of the region divided by 3b. | ||
However, it is extremely challenging for the in situ imaging of microscopic experiments and the characterization of microstructure evolution and solidification front morphology due to the ultrahigh speed of solid–liquid transition during the solidification of the molten pool. In addition, in situ experiments are still unable to capture the nucleation process of solidification, and the nucleation information determines the evolution and morphology of the microstructure. Since it is impossible to observe the nucleation process of the rapid solidification of the molten pool through experimental methods, it is the best choice to adopt an atomic-scale simulation method to clarify each stage of the process. Molecular dynamics (MD) simulation has a large number of research results in the research of homogeneous nucleation process, and the MD simulation research of the rapid directional solidification process has gradually increased. At present, due to the complexity of molten pool solidification, the MD simulation of molten pool solidification has been simplified to a rapid directional solidification model to predict the evolution of the microstructure.14–19 For example, Mahata et al.16 reproduced the directional solidification process of Al-11 at% Cu alloys, and discussed the influence of the orientation of the solidification structure on the mechanical properties of such alloys in their research. Bahramyan et al.19 utilized MD to study the nucleation process and the microstructure of the solidification of the TWIP stainless steel bath during the laser powder bed fusion (LPBF) process. However, if only a simple model of directional solidification is adopted to study the molten pool or the additive manufacturing process, the effect of the base metal on the epitaxial growth of the molten pool will be ignored.
For this reason, in this work, combining the characteristics of molten pool solidification, a rapid directional solidification model of molten pool solidification epitaxial growth is established. The MD simulation reveals the crystallization characteristics of the epitaxial growth process of the Al-4 at% Cu alloy molten pool and compares the solidification structure morphology of the Al–Cu alloy thin film molten pool using in situ TEM with short-pulse laser melting to verify the accuracy of the model. In addition, three directional solidification simulation systems with different temperature gradients are established, and the simulation results are compared with those of the molten pool solidification model.
2. Simulation details
The embedded atomic potential developed by Cai and Ye20 is employed to describe the interatomic interaction between Al–Cu. This potential can predict the characteristics of the solidification process with respect to temperature changes because it can capture the lattice constant (a0), cohesive energy (Ec), elastic constant (C11, C12, C44), phase transition energy difference (Efcc − Ebcc, Efcc − Ehcp), vacancy formation energy (Evf), etc. The specific fitting results and experimental data are displayed in Table 1. More importantly, it is presented that the comparison between the simulated data and experimental data of Al and Cu is satisfactory in the literature.20 Currently, in MD simulations, this embedded atomic potential has been adopted to accurately predict the intermetallic compound and interface diffusion of annealed Al–Cu alloys.17,21,22 Moreover, we also utilized this potential function to reveal the homogeneous nucleation process of the Al-4 at% Cu alloy.23| Properties | Al/experiments | Al/EAM MD | Cu/experiments | Cu/EAM MD |
|---|---|---|---|---|
| a 0 (Å) | 4.05 | 4.05 | 3.615 | 3.615 |
| E c (eV) | 3.36 | 3.32 | 3.54 | 3.52 |
| C11 (erg cm−3) | 1.14 | 0.9 | 1.7 | 1.68 |
| C12 (erg cm−3) | 0.619 | 0.702 | 1.225 | 1.263 |
| C44 (erg cm−3) | 0.316 | 0.33 | 0.758 | 0.752 |
| E fcc − Ebcc (eV) | 0.1 | 0.0168 | 0.04 | 0.022 |
| E fcc − Ehcp (eV) | 0.05 | 0.0003 | 0.006 | 0.0012 |
| E v f (eV) | 0.75 | 0.73 | 1.30 | 1.31 |
Fig. 2(a) displays a molten pool formed using a high-energy density laser beam to melt metal or metal powder. Fig. 2(b) displays an elliptical molten pool formed by a short pulse laser melting a metal thin, and the molten pool is solidified at a high cooling rate. It should be noted that the simulation of the solidification and the heat transfer process in the welding or additive manufacturing process is very complicated, and the solidification of the molten pool occurs by the epitaxial growth of the base metal structure. Here, one-dimensional directional solidification is studied to understand the details of epitaxial growth. To study the one-dimensional rapid solidification process from the transition zone to the atomic scale, a large simulation box with a size of about 30 nm e of about 30 nm ifa0 ransia0 ransia0, a0 is the lattice constant of Al is created in area A, as shown in Fig. 3(a). In this large-scale simulation system, Al atoms with a face-centered cubic structure are created, and 4% Cu is randomly distributed, containing a total of 1.13 million atoms (orange represents Al atoms, blue represents Cu atoms), and the x direction is set as the direction of molten pool solidification.
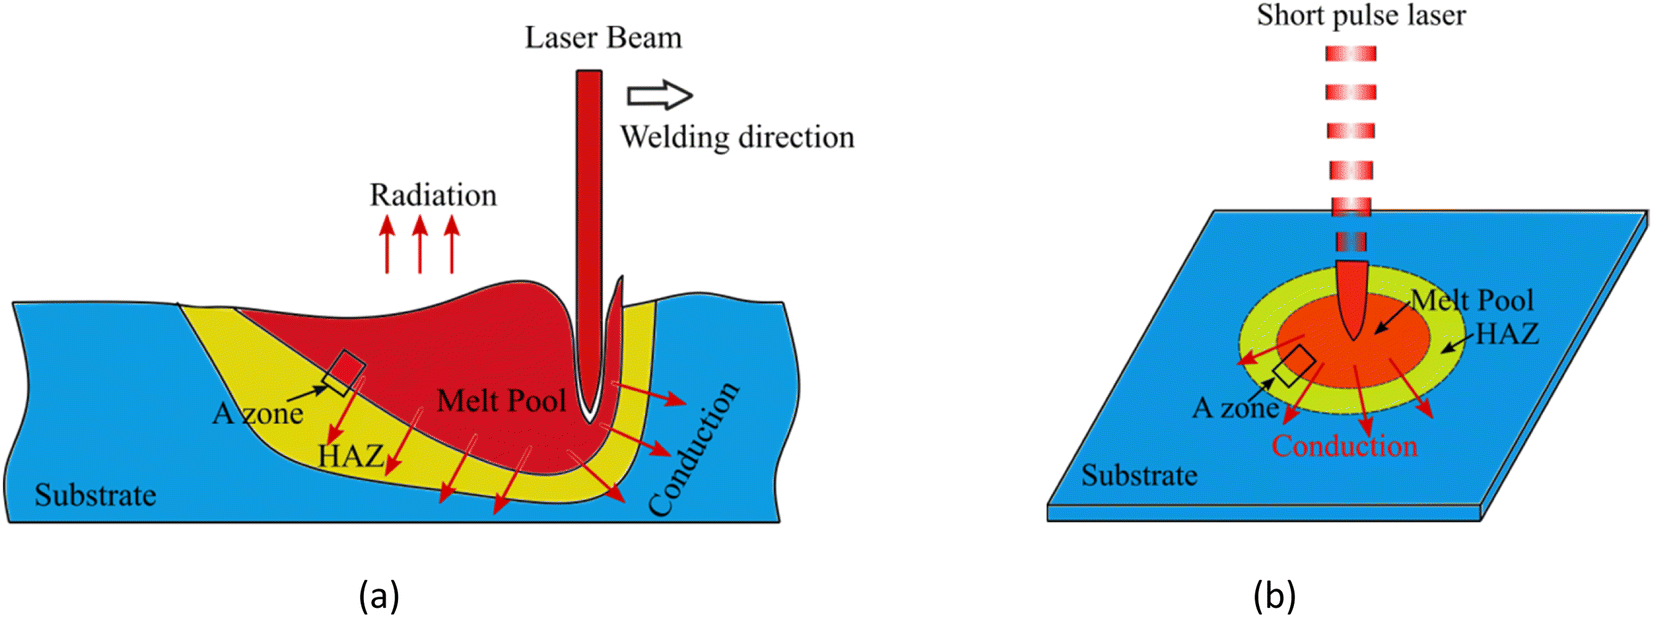 | ||
| Fig. 2 Schematic diagram of laser welding molten pool. (a) Laser beam welding molten pool morphology. (b) Weld pool morphology of metal film melted by short pulse laser. | ||
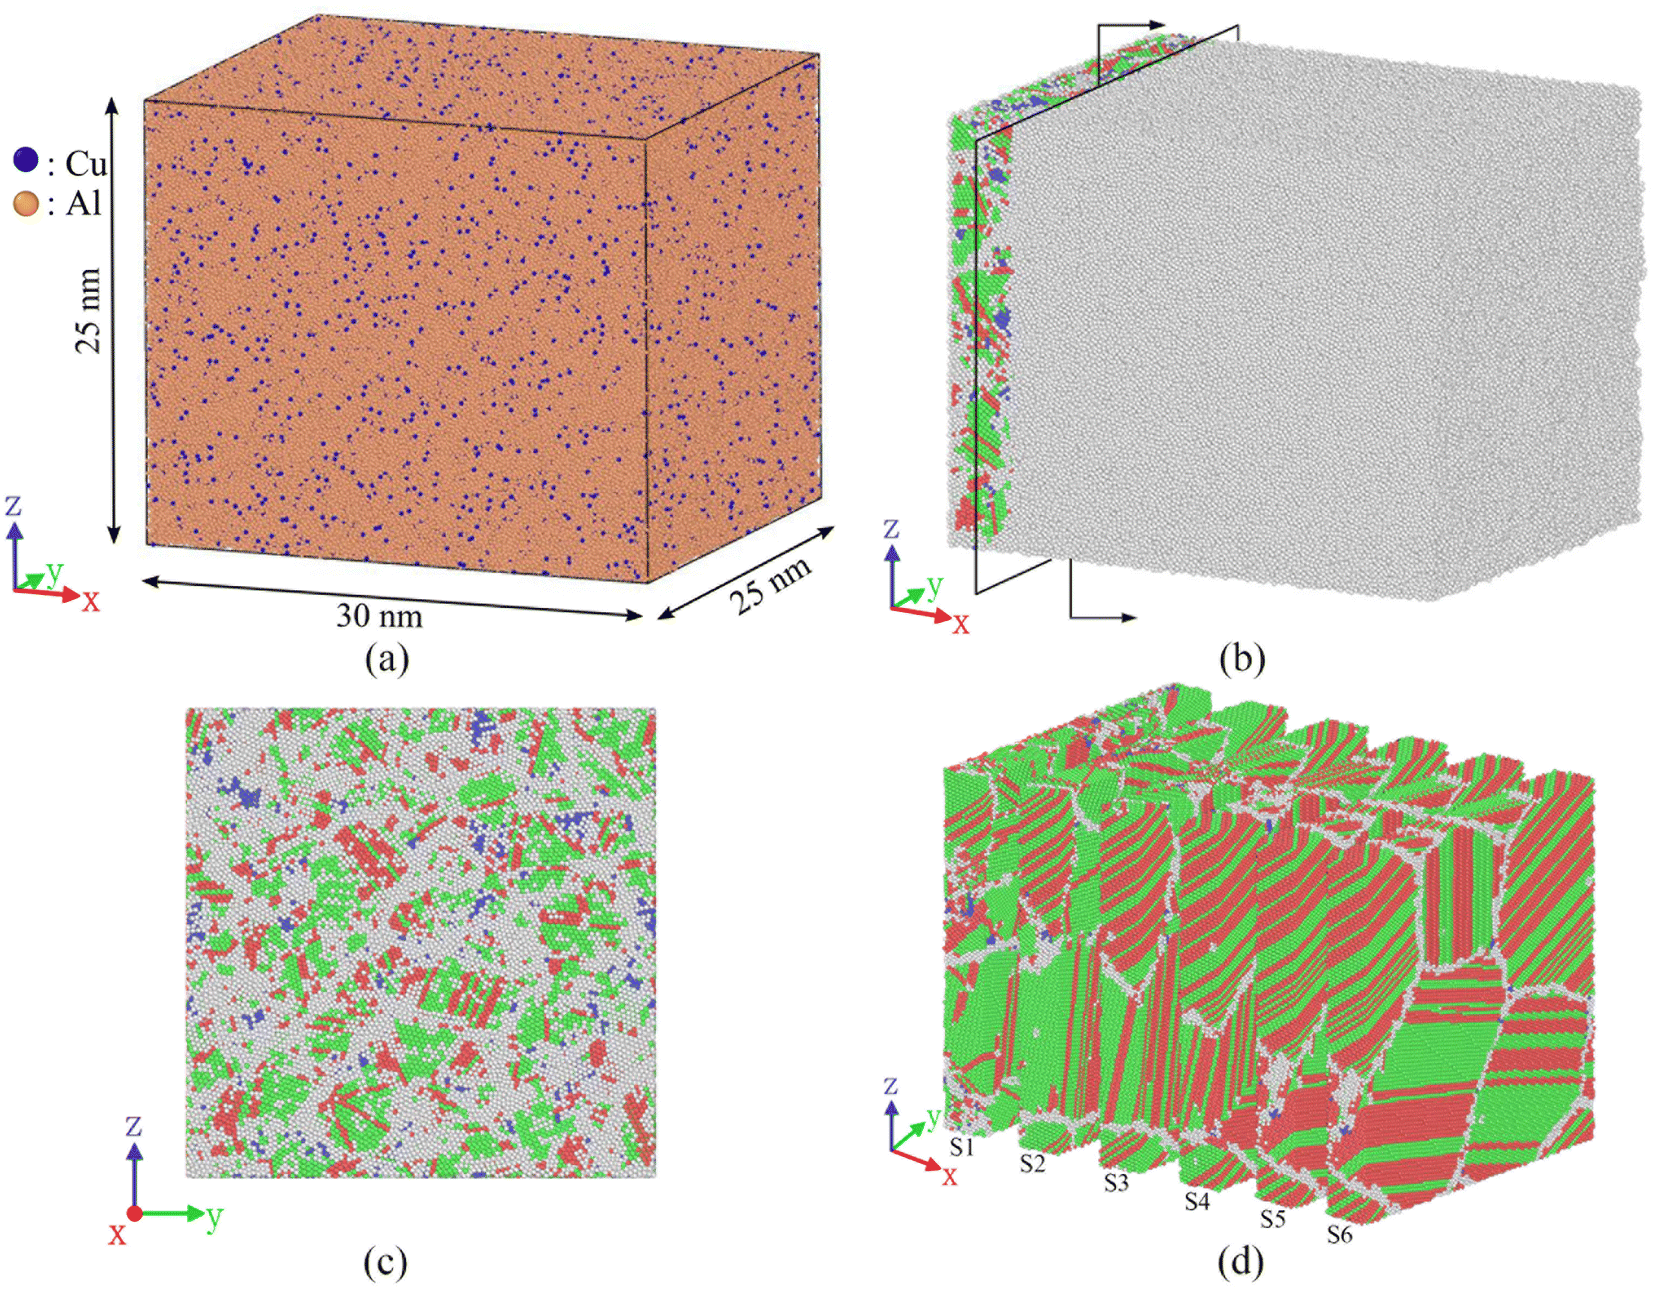 | ||
| Fig. 3 Solidification model of Al-4 at% Cu alloy molten pool (white atoms represent melt atoms or grain boundary atoms, green represents FCC, blue represents BCC, red represents HCP). (a) Simulation box size of molten pool solidification, (b) initial simulation conditions of molten pool solidification, melt on the right and substrate on the left, (c) interface between substrate and melt in (b) and (d) partition of the molten pool in (b). | ||
The MD simulation of the solidification of the Al-4 at% Cu alloy molten pool are completed by the large atomic/molecular mass parallel simulator (LAMMPS).24 To make the simulation box enter the melting stage, it is heated to 1300 K and relaxed by 150 ps so that all the crystal structures become liquid, and the time step is 1 fs. Temperature and pressure are controlled by Nose–Hoover thermostat and Parrinello-Rahman barostat.25 In the melt preparation process, periodic boundary conditions are employed in all three directions. Subsequently, the prepared melt is cooled to 300 K at a rate of 0.5 K ps−1 to obtain the substrate material structure and maintained at 300 K for 200 ps. Then, the substrate material is divided into two areas, as shown in Fig. 3(b), where white represents amorphous atoms, green represents face centered cubic (FCC), blue represents body centered cubic (BCC), and red represents hexagonal close-packed (HCP). The left area (4 nm) is the substrate material that is not melted during the welding process, and the right area is the molten pool. Therefore, it is necessary to heat the right area to 1000 K and maintain 100 ps to melt the right area. Then, the right area is not controlled by temperature to simulate the solidification of the molten pool, and the initial solid–liquid interface is shown in Fig. 3(c). Moreover, the molten pool is divided into six regions, as shown in Fig. 3(d), for a more detailed observation of the solidification process. During the solidification process, the boundary conditions of the solidification direction are set to be non-periodic.
The solidification process of the molten pool is monitored by an open visualization tool (OVITO).26 Polyhedral template matching (PTM)27 is employed to identify the local crystal structure of the atoms. Grain Segmentation (GS) and Dislocation Analysis (DXA)28 carry out grain count statistics and identification and analysis of stacking faults, twin boundaries, and dislocations.
3. Results and discussion
3.1. Structural morphology of molten pool solidification
Fig. 4 shows the solidification of two-dimensional PTM and three-dimensional GS at 0 ps, 100 ps, 200 ps, and 500 ps. The dotted line in the figure is the initial solid–liquid interface. It can be discovered that the simulation results are consistent with the characteristics of molten pool solidification. The solidification of the entire area has been basically completed at 500 ps in Fig. 4, which indicates that the solidification rate of the molten pool is very fast, and the cooling rate for monitoring the solidification of the molten pool is 0.36 K ps−1. | ||
| Fig. 4 Two-dimensional microstructure and three-dimensional grain distribution of molten pool solidification at different moments (white atoms represent melt atoms or grain boundary atoms, green represents FCC, blue represents BCC, red represents HCP, the dotted line represents the initial solid–liquid interface, each color of the colored atoms represents a crystal grain in GS-3D). | ||
From the two-dimensional PTM structure diagram and the three-dimensional GS grain diagram, it is determined that the crystallization process of molten pool solidification is consistent with rapid directional solidification, and coarse columnar crystals are formed in the direction of the temperature gradient. In addition, the epitaxially grown crystal grains are observed at the position where it meets the base metal. The average growth rate of columnar crystals at various positions in the molten pool is 43.9 m s−1, which is one order of magnitude higher than the growth rate (over 1 m s−111) of columnar crystals during the solidification of the Al-4 at% Cu molten pool melted by a short pulse laser.
3.2 Nucleation and growth of molten pool solidification
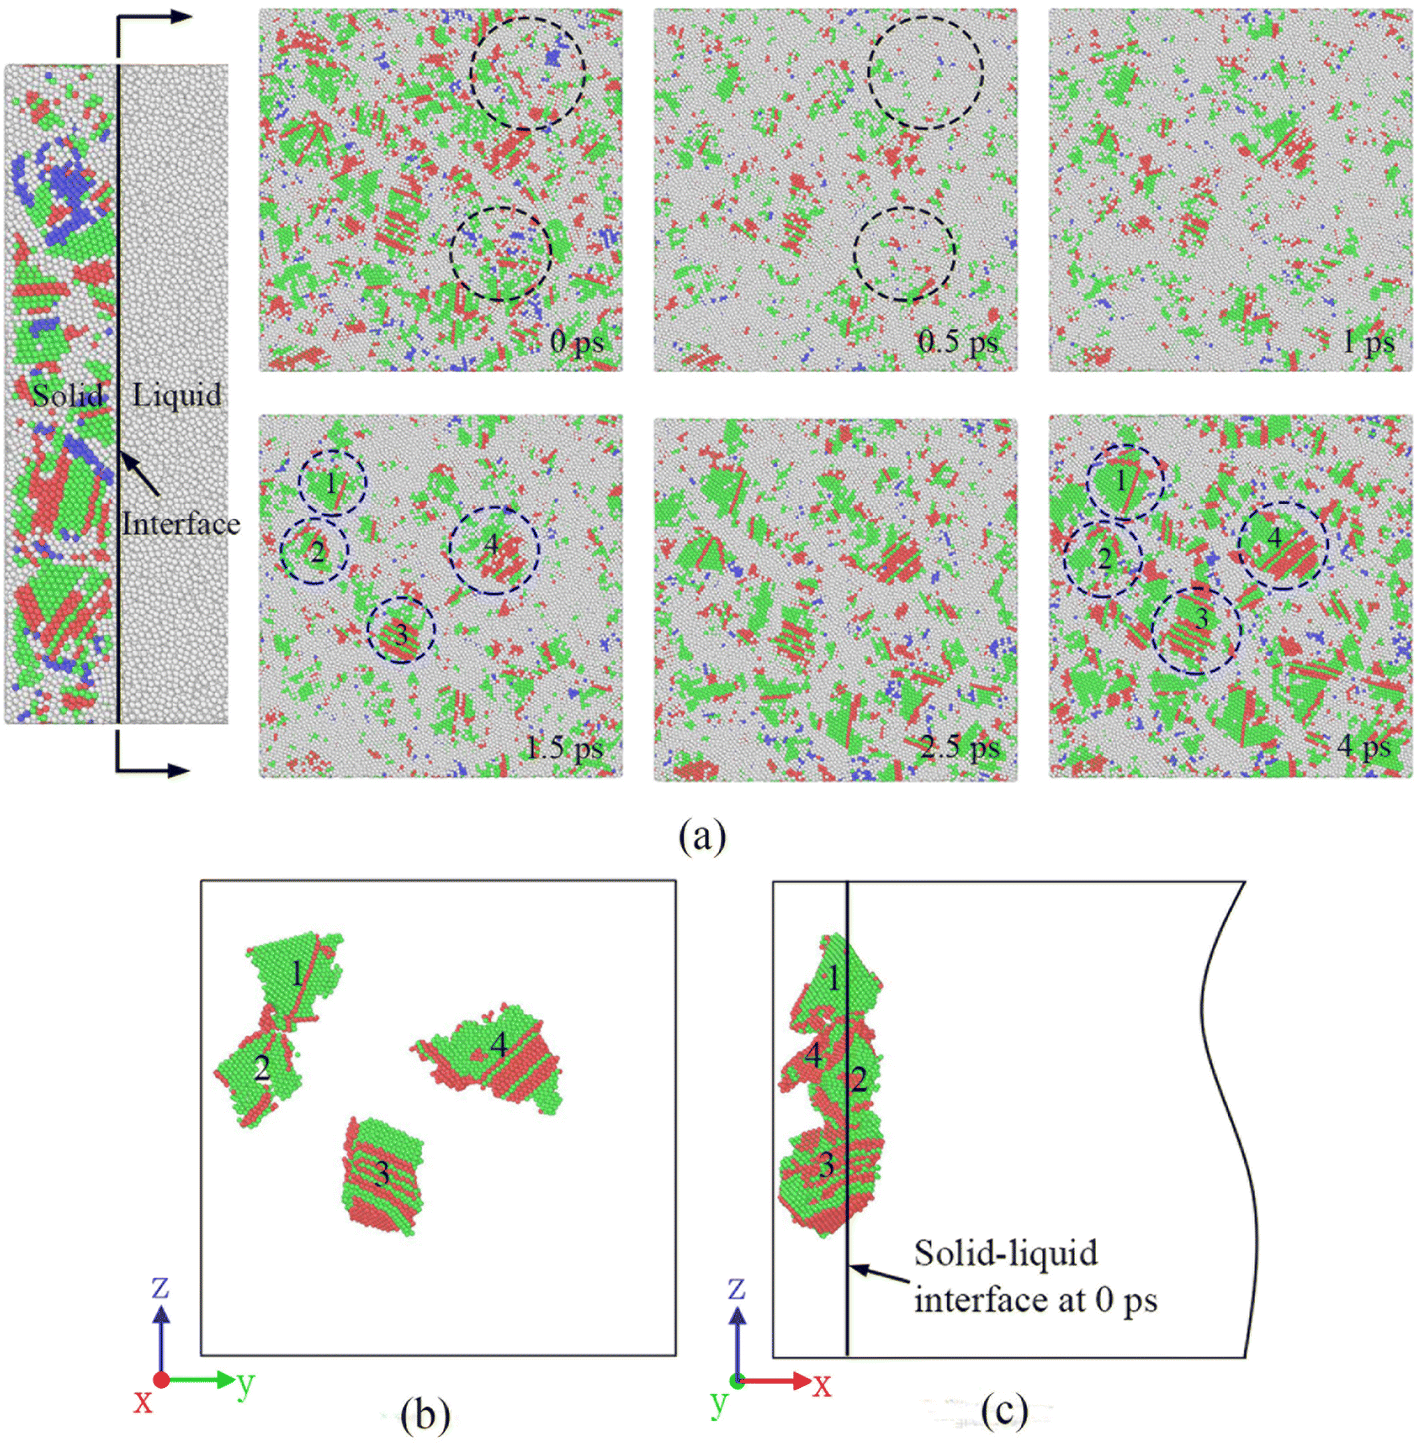 | ||
| Fig. 5 Pre-melting behavior before solidification of the molten pool (white atoms represent melt atoms or grain boundary atoms, green represents FCC, blue represents BCC, red represents HCP). (a) Pre-melting behavior before solidification of the molten pool. (b) Grain morphology observed from the direction (100) and (c) grain morphology observed from the direction (010). | ||
The epitaxial growth of the four crystal grains in Fig. 5(b) is continued to be observed. Fig. 5(b) and (c) are respectively viewed along two angles from the vertical solidification direction and along the solidification direction. The black line in Fig. 5(c) is the initial interface between the base metal and the molten pool. It was found that when the solidification progressed for 10 ps, the four crystal grains had extended into the molten pool along their original orientation, which proved that the initial stage of solidification of the molten pool was realized by the exposed ordered atoms in the substrate material growing into the molten pool, i.e., epitaxial growth. In addition, since epitaxial growth does not require re-nucleation, the grain growth rate is very fast.
Fig. 6(a) shows the solidification microstructure at the edge of the molten pool obtained when the solidification lasts for 2000 ps. It can be clearly seen that crystal growth is completed in the molten pool through heterogeneous nucleation, and the microstructure morphology transforms from equiaxed crystal to slender columnar crystal. Through the in situ TEM study of the Al-4 at% Cu alloy film melted by a short laser pulse,29 the process of microstructure morphology transformation of epitaxial growth of the molten pool was also observed, as shown in Fig. 6(b). Although our simulation size is different from that of the experiment, using the boundary conditions consistent with the solidification of the experimental molten pool, we obtained the results consistent with the experimental morphology transformation. To some extent, it is proved that the MD model of epitaxial growth of the molten pool can effectively reveal the process of heterogeneous nucleation and grain growth of the nano molten pool. However, although the experimental results verify the simulation results on the transformation of the micromorphology, they are not completely consistent on the scale. In future research, if the computational ability allows, we will expand the size of the molten pool model, further verify the experimental results, and obtain the MD model of rapid solidification of the molten pool at the micron scale.
 | ||
| Fig. 6 Comparison of the simulated solidification microstructure of the molten pool with that in the published in situ TEM experiment of the Al-4 at% Cu alloy. (a) 2000 ps, Al-4 at% Cu alloy molten pool simulated microstructure morphology (each color of the colored atoms represents a crystal grain). (b) TEM inverse polar figure map of the Al-4 at% Cu alloy additive manufacturing the molten pool microstructure.29 | ||
 | ||
| Fig. 7 Nucleation of the crystal nuclei during molten pool solidification. (a) The change in the number of grains in the solidification process of the molten pool with the solidification time. (b) Nucleation rate of molten pool solidification and directional solidification. | ||
In addition, after the liquid phase is completely transformed into the solid phase, the number of crystal grains do not decrease until 2000 ps, and there is no phenomenon of crystal grain merging. At 2000 ps, the maximum number of grains is 123, which is less than that of directional solidification, mainly because the molten pool solidification crystallization is limited by the number of embryos provided by the substrate material. However, the time required for the molten pool to reach the maximum number of grains from solidification is shorter than that of directional solidification. It can be seen from Fig. 7(b) that the nucleation rate of the molten pool can reach 1.17nal35 s−1 m−3, while directional solidification (400 K–700 K) has a nucleation rate of 3.1 nu34 s−1 m−3. Moreover, the homogenous nucleation of a system of the same volume cooled from 1000 K to 300 K at a cooling rate of 0.5 K ps−1 is monitored and the nucleation rate is 2.64 ma34 s−1 m−3. In summary, the nucleation rate of molten pool solidification is almost one order of magnitude larger than that of directional solidification and homogeneous nucleation.
 | ||
| Fig. 8 Changes in the grain size of the substrate material during solidification (each color of the colored atoms represents a crystal grain). | ||
From the beginning of solidification to the end of solidification, the grain size of the base metal increased from 2.6 nm to 4.265 nm under the influence of the temperature of the molten pool. The grains grew by 64% during the entire solidification process. The substrate material at the junction of the molten pool in actual welding is also called the heat-affected zone, and the substrate material in the corresponding simulation is actually the coarse-grained zone in the heat-affected zone during welding. These characteristics are consistent with the actual experimental results.
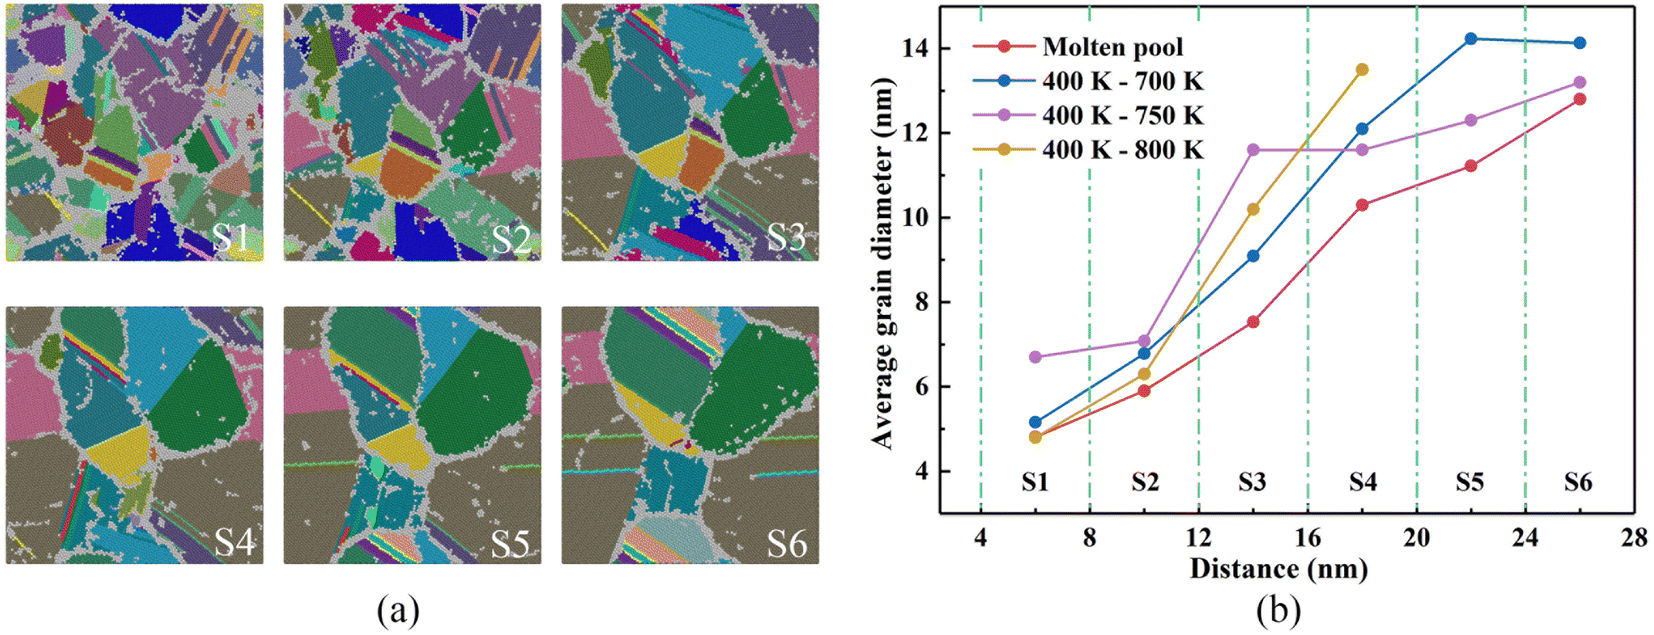 | ||
| Fig. 9 Each zone of the molten pool. (a) The microstructure in the vertical solidification direction (each color of the colored atoms represents a crystal grain). (b)The average diameter of grains in each zone of molten pool and directional solidification. | ||
3.3 Temperature distribution during the solidification of the molten pool
Fig. 10(a) shows the temperature trends of the six zones of the free melt of the simulated system checked every 2 ps over time. Observing Fig. 10(a), although the six zones are all reduced from 1000 K to 300 K, the change process of each zone is obviously different. In the S1 zone where the substrate material is connected, the heat conduction in the S1 zone is the fastest due to the low temperature of the substrate material. Therefore, the temperature first drops from 1000 K to 600 K instantaneously, and then drops to 400 K at a very fast rate. However, the temperature change from 400 K to 300 K slows down. This is because the temperature of the molten pool far away from the substrate material is higher than that of the S1 zone. The farther away from the base metal, the slower the temperature drops (such as S6 zone), and the S1 zone continuously receives heat from the molten pool so that the S1 zone is always at a temperature above room temperature. As the distance between the molten pool area and the base metal continues to increase, the cooling curve gradually slows down, and finally the temperature in all areas of the molten pool drops to room temperature at about 1100 ps.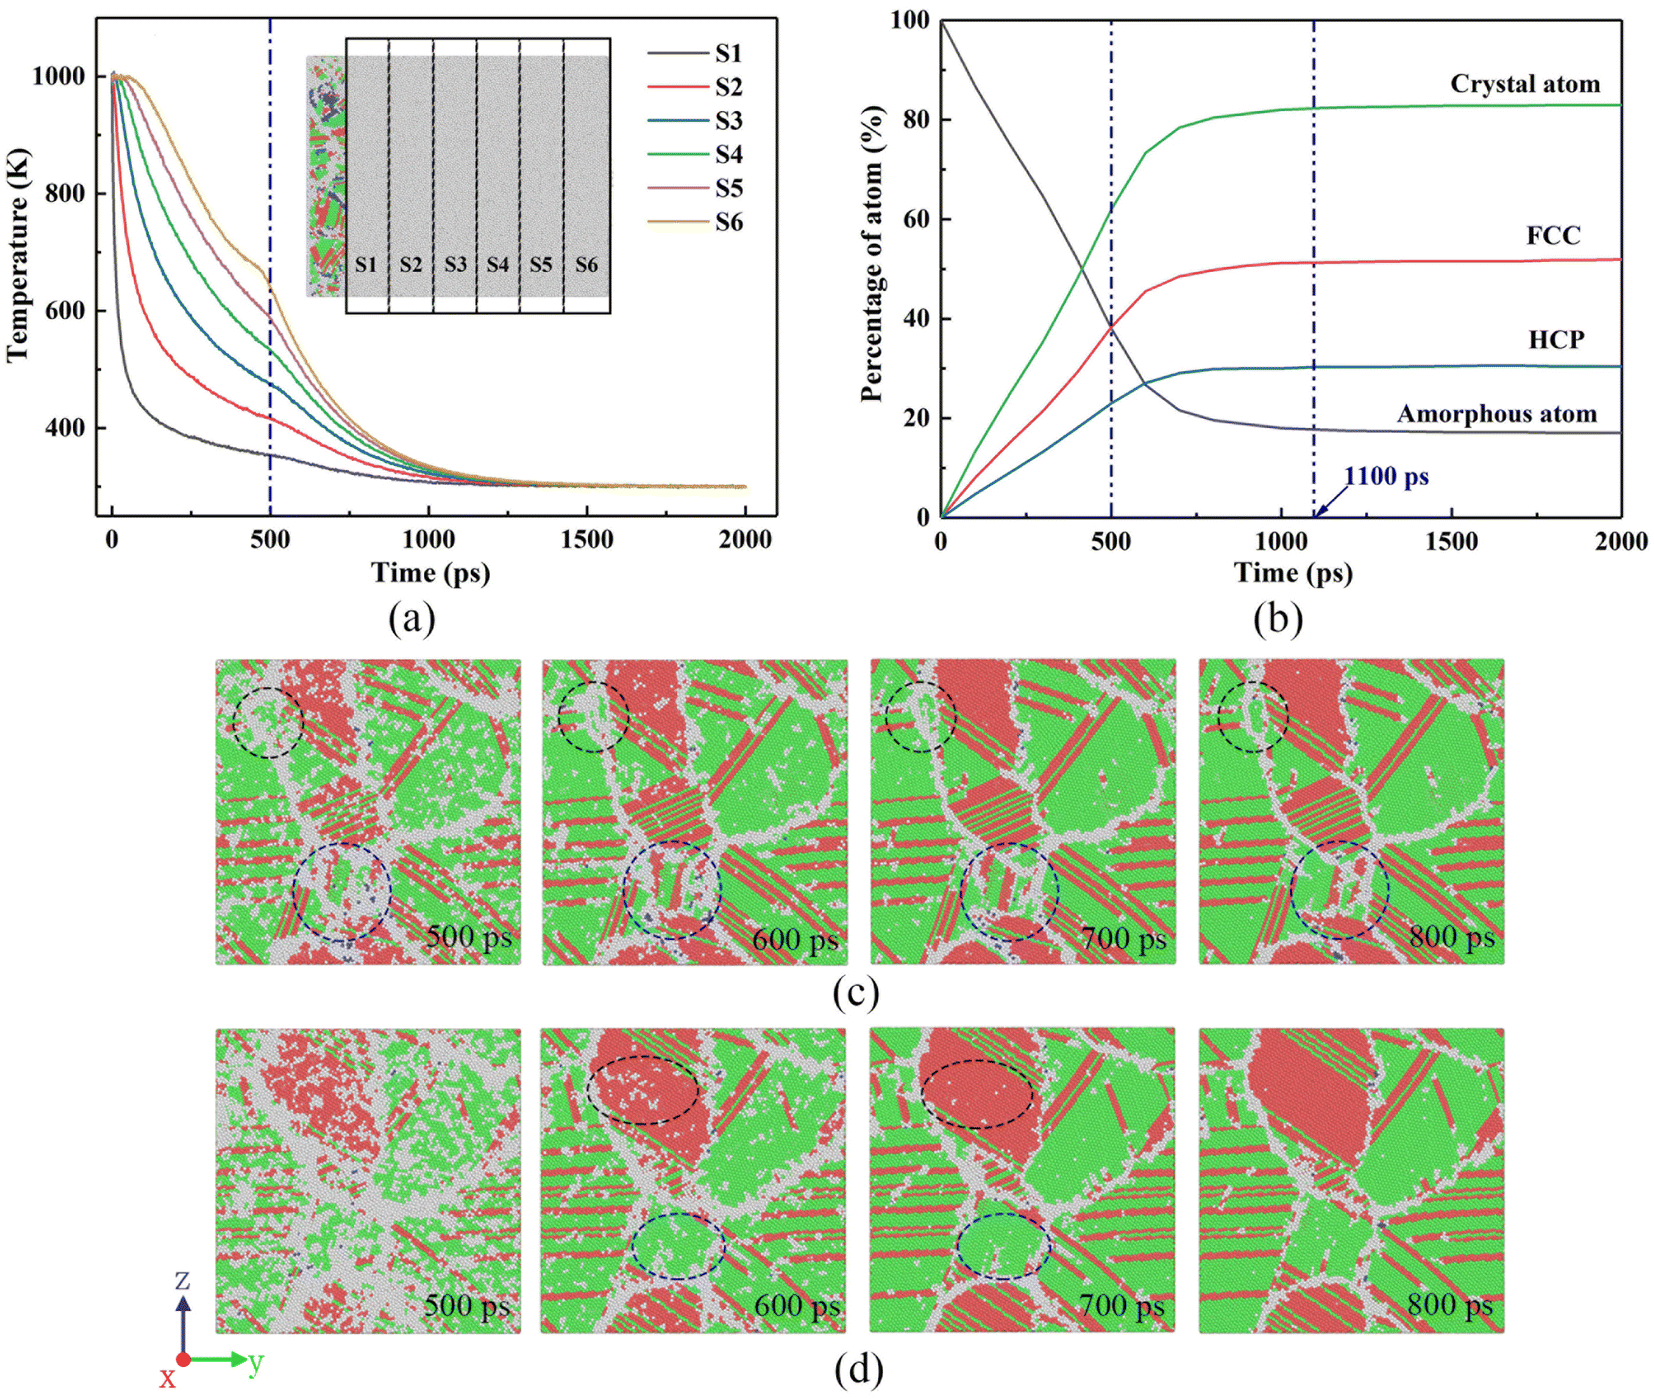 | ||
| Fig. 10 The evolution of the microstructure of the rapid solidification of the molten pool (white atoms represent melt atoms or grain boundary atoms, green represents FCC, blue represents BCC, red represents HCP). (a) Temperature distribution in each zone of the melt. (b) The change in the crystal atomic percentage with time during the solidification of the molten pool (the crystal atoms here are the sum of FCC, BCC, and HCP atoms, amorphous atoms are disordered atoms (i.e., melt atoms and grain boundary atoms)). (c) The transformation process of the disordered atoms to crystal atoms of the S5 zone. (d) The transformation process of the disordered atoms to crystal atoms of the S6 zone. | ||
To understand the degree of liquid–solid transformation during the solidification of the molten pool, the change in the crystal atoms with solidification time is shown in Fig. 10(b), and the crystal atom transformations in the S5 and S6 areas are observed through Fig. 10(c) and (d). Obviously, starting from the solidification of the molten pool, the crystal atoms increase rapidly, indicating that the liquid phase changes rapidly to the solid phase. At 500 ps, the atomic percentage reached 62%, and it remains unchanged after 1100 ps when the crystal atomic percentage reaches the maximum (82.9%). The FCC and BCC structures also have the same trend.
In Fig. 10(c) and (d), the morphology of the vertical solidification direction of the S5 and S6 regions at different moments shows that the white disordered atoms transform to ordered atoms from 500 ps to 800 ps. These disordered atoms are the result of some atoms that have not had time to transform due to the fact that the solidification rate is too fast. In addition, the highest temperature of the S5 and S6 zones at 500 ps reaches about 600 K, and the microstructure still has a certain transformation ability at this time. At 600 ps, it was found that the disordered atoms in the areas marked with black and blue circles and ellipses in the microstructure of the S5 and S6 zones were significantly reduced. It can also be seen from Fig. 10(b) that the atomic percentage of the crystal increases by 11.3% from 500 ps to 600 ps. At 700 ps, the disordered atoms in the S5 and S6 zones are basically transformed into crystal atoms. When it reaches 800 ps, the atoms in the microstructure are arranged neatly, and there are almost no disordered atoms in the crystal grains. According to the crystal atomic percentage curve, the crystal atoms reached 80.4% at 800 ps, indicating that the disordered atoms have basically completed the crystallization process.
3.4 Defects in the solidification of the molten pool
Since the solidification rate of the molten pool is very fast, a large number of defects are formed during the solidification process. It can be seen from the data in Fig. 11 that the dislocation density of molten pool solidification is as high as 3.38 def013 cm−2, which is three times the dislocation density of directional solidification. Among them, Shockley dislocations (green lines) account for 70–80% of the total dislocations and are the main defects in the solidification process. Therefore, such a high dislocation density will make it possible for the mechanical properties of the nanoscale weld to have ultrahigh strength. From the dislocation distribution in Fig. 11, it is discovered that there are many dislocation lines along the direction of solidification of the molten pool. A large number of dislocation lines are distributed in the grain boundaries and grains of columnar crystals formed along the solidification direction, which is completely different from the dislocation distribution of columnar crystal regions in directional solidification. There are almost no dislocation lines in the directionally solidified columnar crystal region.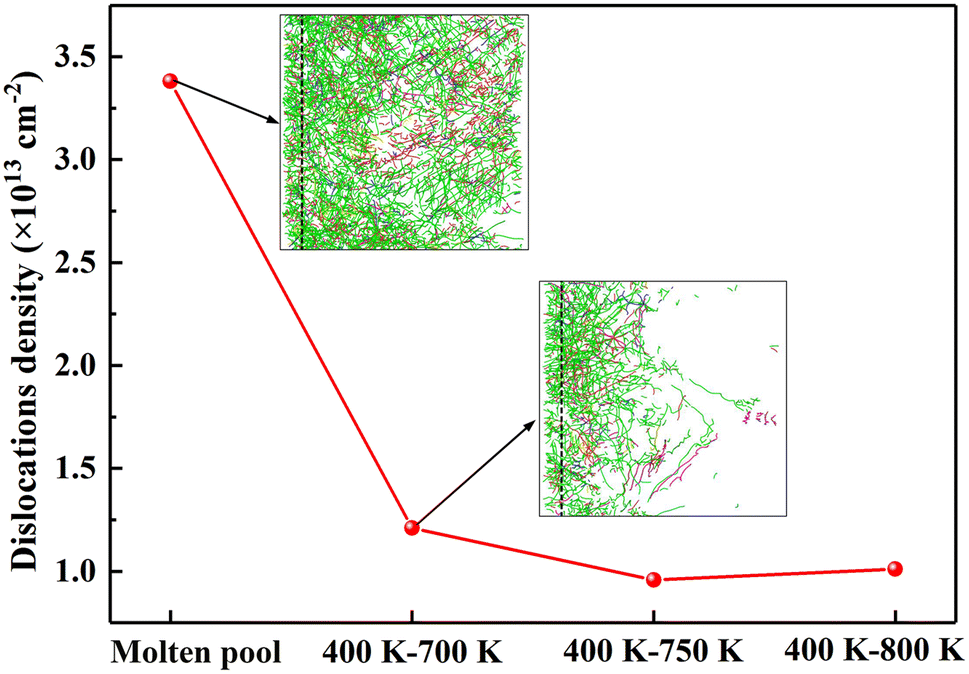 | ||
| Fig. 11 Dislocation density of molten pool solidification and directional solidification. | ||
To understand the dislocation distribution in detail, the dislocation distribution in the vertical solidification direction of each zone was intercepted and listed in Fig. 12. The comparison results of the dislocation distribution in each zone indicate that the S1 and S2 zones with equiaxed crystals have the most dislocation lines, in particular, the S1 zone has many intragranular dislocations, such as the A zone in the red ellipse, and the dislocation lines are entangled. Two dislocation entanglement points are discovered in the enlarged A zone, indicating that the dislocation lines in all directions pass through this point, and most of them are Shockley incomplete dislocations, with only one pink 1/6 < 110> Stair-rod dislocation and two yellow 1/3 < 001> Hirth dislocations. The size of the initial grains in the S3 zone increases significantly, and the source of dislocation lines is determined by the interface grid, which is mainly distributed in the grain boundaries. Moreover, starting from the S3 zone, the dislocation lines in the crystal grains decrease. However, there are also some long dislocation lines that appear in the crystal grains, such as the B zone in the red box. The dislocation lines are located at the edge of the stacking fault. This is also the characteristic of incomplete dislocations. Therefore, this long intragranular dislocations are caused by stacking faults. As the distance from the substrate material increases, the diameter of the columnar crystal cross-section increases, and the dislocation lines within the grain gradually decrease. But there are still a large number of dislocations distributed at the grain boundaries, making it completely different from directional solidification. The main reason is that the solidification rate of the molten pool is too fast; thus, many interface defects appear at the grain boundaries, and the columnar crystal temperature in the high temperature zone of directional solidification is still relatively high, with certain thermal vibrations, which can eliminate the defects caused by rapid solidification.
 | ||
| Fig. 12 The distribution situation of dislocations in each zone of the molten pool. (a) S1 zone, (b) S2 zone, (c) S3 zone, (d) S4 zone, (e) S5 zone, (f) S6 zone. It is clear that most of the dislocation lines are Shockley dislocations (green), and they are mainly distributed in the grain boundary in the center of the molten pool. | ||
When examining crystal defects, quintuple twins formed by cocrystallization at the interface of the base metal and the molten pool were found. The nucleation and layer-by-layer growth processes were observed in the quintuplet crystalline region, and the formation process of the quintuple twins are shown in Fig. 13. Fig. 13(a) illustrates that at 40 ps, the grains in the parent metal grow from the parent metal through the solid–liquid interface into the molten pool and form HCP boundaries on both sides of the FCC structure. Fig. 13(b) shows the formation of stable Twin Boundary (TB)1 and TB2 at 56 ps. Then at about 100 ps, Fig. 13(c) shows the formation of TB3 and TB4 in a clockwise order. At 200 ps, Fig. 13(d) shows that a corner composed of FCC atoms is also formed on the right side of TB1 and passes through. After 100 ps, the HCP boundary was grown on the edge of the formed FCC atoms, i.e., TB5 was formed, as shown in Fig. 13(e).
 | ||
| Fig. 13 The formation sequence of five-fold twins during the epitaxial growth of the molten pool is displayed in (a–f) (white atoms represent melt atoms or grain boundary atoms, green represents FCC, blue represents BCC, red represents HCP). (a) 40 ps, (b) 56 ps, (c) 100 ps, (d) 200 ps, (e) 300 ps, (f) 500 ps. | ||
After another 200 ps, the disordered atoms between TB4 and TB5 are transformed into ordered atoms, i.e., the corner of the last quintuple twin is formed. Fig. 13(f) reveals the angles of each twin angle of the quintuple twins, and the angles are not uniform, and the diagonal angles are close. This is mainly due to the fast solidification rate of the molten pool; thus, the angle along the solidification direction is small, for example, a 45the angles are not uniform, and the diagonal angles are close. This is mainly due to the fast solidification rate of the molten poolprocess of the quintuple twins rting from angle of the crystal nucleus formed by the cocrystallization of the diagonal base metal, and on the other hand, it is still affected by the solidification direction and the fast solidification rate.
4. Summary and future outlook
In this study, MD is utilized to establish a more accurate epitaxial growth model of molten pool solidification, which realistically reproduced the process from molten pool nucleation to grain growth. The premelting effect of the molten pool on the base metal before solidification and the genetic effect of the base metal on the crystallization of the molten pool are revealed. The following conclusions are drawn from the simulation results.(1) Before the solidification of the molten pool, the nano molten pool will melt the two atomic layers at the solid–liquid interface. The solidification process of the molten pool is completed by the continuous growth of the ordered atoms of the parent metal grains exposed in the molten pool as the crystal nuclei. In addition, the same microstructure transformation occurred in the epitaxial growth process as the rapid solidification of the thin film molten pool in the in situ TEM experiment, i.e., from equiaxed crystal to columnar crystal. This will be of guiding significance in the study of rapid solidification of other metal molten pools.
(2) The nucleation rate of molten pool solidification reaches 1.17uid35 s−1 m−3, which is one order of magnitude higher than that of directional solidification and homogeneous nucleation under the same model system. However, the average grain size of each zone is smaller than that of directional solidification. Moreover, after solidification, the dislocation density of the molten pool is also much larger than that of directional solidification, and there are a large number of dislocations at the grain boundaries of the elongated columnar grains, which is completely different from directional solidification.
(3) During the rapid solidification of the Al–Cu alloy molten pool, quintuple twins were found at the initial stage of solidification. Affected by the solidification direction and solidification speed, the growth mode of quintuple twins is no longer sequentially layer-by-layer growth, and the angle of each layer of twins is not uniform, which is consistent with the formation process of quintuple twins obtained by directional solidification.
In addition, the MD model of rapid solidification epitaxial growth in molten pool established in this paper possesses certain applicability. Theoretically, it can be applied to the rapid solidification process of any pure metal and its alloy in the molten pool under the action of high energy density heat source. To some extent, it makes up for the difficulty in observing the epitaxial growth of molten pool. However, because the MD simulation needs to provide material parameters through the interatomic interaction potential of the material, the materials that can be simulated are limited. Therefore, in the future, we will aim to establish and improve the potential of more materials through first principles for more valuable research results.
Author contributions
Conceptualization, L. Z. and XG. Q.; methodology, L. Z.; software, L. Z.; validation, L. Z. and NH. L.; formal analysis, L. Z. and XG. Q.; investigation, L. Z. and NH. L.; resources, XG. Q.; data curation, L. Z.; writing – original draft preparation,L. Z.; writing – review and editing, L. Z. and XG. Q.; visualization, L. Z. and NH. L.; supervision, XG. Q.; project administration, L. Z. and XG. Q.; funding acquisition, L. Z. All authors have read and agreed to the published version of the manuscript.Conflicts of interest
There are no conflicts to declare.Acknowledgements
The authors acknowledge Funded by University Nursing Program for Young Scholars with Creative Talents in Heilongjiang Province of China (UNPYSCT-2018116),the basic scientific research business expense scientific research project of Heilongjiang Provincial Universities of China(2020-KYYWF-0235) and Jiamusi University Doctoral Special Research Fund Project (JMSUBZ2021-02).References
- Y. J. Lcesd, Jiamusi University Doctora, Acta. Mater., 2008, 56, 4022–4027 CrossRef.
- T. S. Srivatsan and T. S. Sudarshan, Rapid Solidification Technology: an Engineering Guide, Lancaster, PA: Technomic Publishing ( 1993) Search PubMed.
- P. A. Kobryn and S. L. Semiatin, J. Mater. Process. Technol., 2003, 135(2–3), 330–339 CrossRef CAS.
- B. A. Szost, S. Terzi, F. Martina, D. Boisselier, A. Prytuliak, T. Pirling, M. Hofmann and D. J. Jarvis, Mater. Des., 2016, 89, 559–567 CrossRef CAS.
- R. Zhong, A. Kulovits, J. M. K. Wiezorek and J. P. Leonard, Appl. Surf. Sci., 2009, 256, 105–111 CrossRef CAS.
- A. Kulovits, R. Zhong, J. M. K. Wiezorek and J. P. Leonard, Thin Solid Films, 2009, 517, 3629–3634 CrossRef CAS.
- J. T. McKeown, A. K. Kulovits, C. Liu, K. W. Zweiacker, B. W. Reed, T. LaGrange, J. M. Wiezorek and G. H. Campbell, Acta Mater., 2014, 65, 56–68 CrossRef CAS.
- T. LaGrange, B. W. Reed and D. J. Masiel, MRS Bull., 2015, 40(1), 22–28 CrossRef CAS.
- A. Kulovits, J. M. K. Wiezorek, T. LaGrange, B. W. Reed and G. H. Campbell, Philos. Mag. Lett., 2011, 91, 287–296 CrossRef CAS.
- K. W. Zweiacker, J. McKeown, C. Liu, T. LaGrange, B. W. Reed, G. H. Campbell and J. Wiezorek, J. Appl. Phys., 2016, 120(5), 055106 CrossRef.
- K. W. Zweiacker, C. Liu, M. A. Gordillo, J. T. McKeown, G. H. Campbell and J. M. K. Wiezorek, Acta Mater., 2018, 145, 71–83 CrossRef CAS.
- K. W. Zweiacker, C. Liu, J. T. McKeown, T. LaGrange, B. W. Reed, G. H. Campbell and J. Wiezorek, Microsc. Microanal., 2014, 20, 1662–1663 CrossRef.
- J. T. McKeown, K. W. Zweiacker, C. Liu, D. R. Coughlin, A. J. Clarke, J. K. Baldwin, J. W. Gibbs, J. D. Roehling, S. D. Imhoff, P. J. Gibbs, D. Tourret, J. M. K. Wiezorek and G. H. Campbell, JOM, 2016, 68(3), 985–999 CrossRef CAS.
- D. Zhanga and S. Chaudhuri, Comput. Mater. Sci., 2019, 160, 222–232 CrossRef.
- R. G. Yu, Q. M. Lai, H. Wang and Y. Q. Wu, J. Shanghai Univ., 2020, 26(2), 216–226 Search PubMed.
- A. Mahata and M. A. Zaeem, J. Cryst. Growth, 2019, 527, 125255 CrossRef CAS.
- N. T. Brown, E. Martinez and J. Qu, Acta Mater., 2017, 129, 83–90 CrossRef CAS.
- Z. Zhao, J. Liu, A. K. Soh and C. Tang, Modell. Simul. Mater. Sci. Eng., 2019, 27(7), 075012 CrossRef CAS.
- M. Bahramyan, R. T. Mousavian, J. G. Carton and D. Brabazon, Mater. Sci. Eng., A, 2021, 812, 140999 CrossRef CAS.
- J. Cai and Y. Y. Ye, Phys. Rev. B: Condens. Matter Mater. Phys., 1996, 54, 8398–8410 CrossRef CAS PubMed.
- C. Li, D. X. Li, X. M. Tao, H. M. Chen and Y. F. Ouyang, Modell. Simul. Mater. Sci. Eng., 2014, 22, 065013 CrossRef CAS.
- A. Mao, J. P. Zhang, S. C. Yao, A. Q. Wang, W. Y. Wang, L. Yan, C. Qiao, J. P. Xie and Y. Jia, Results Phys., 2020, 16, 102998 CrossRef.
- L. Zhan, M. Z. Wu and X. G. Qin, R. Soc. Open Sci., 2021, 8, 210501 CrossRef CAS PubMed.
- S. Plimpton, J. Comput. Phys., 1995, 117, 1ys.1 CrossRef.
- M. Parrinello and A. Rahman, J. Appl. Phys., 1981, 52(12), 7182–7190 CrossRef CAS.
- A. Stukowski, Modell. Simul. Mater. Sci. Eng., 2009, 18, 015012 CrossRef.
- P. M. Larsen and S. Schmidt, Modell. Simul. Mater. Sci. Eng., 2016, 24, 055007 CrossRef.
- A. Stukowski and K. Albe, Modell. Simul. Mater. Sci. Eng., 2010, 18, 2131–2145 Search PubMed.
- T. Pinomaa, J. McKeown, J. Wiezorek, N. Provatas, A. Laukkanen and T. Suhonen, J. Cryst. Growth, 2019, 532, 125418 CrossRef.
| This journal is © The Royal Society of Chemistry 2023 |