 Open Access Article
Ionic conductivity and disorder in calcium and barium nitrogen hydrogen phases†
Gavin J.
Irvine
 * and
John T. S.
Irvine
 *
*
School of Chemistry, University of St Andrews, St Andrews, KY16 9ST, UK. E-mail: gji4@st-andrews.ac.uk; jtsi@st-andrews.ac.uk; Tel: +44 (0)7 4532 28686
First published on 7th July 2023
Abstract
Nitrogen–hydrogen based alkali and alkaline earth metal compounds have recently received a substantial amount of attention as co-catalysts for heterogeneous mild condition ammonia synthesis (MCAS). The incorporation of these materials has been shown to result in positive reaction orders with respect to H2, solving the issue of hydrogen poisoning, e.g., the occupation of the majority of transition metal (TM) active sites by H-adatoms due to the significantly faster kinetics of H2 dissociation as compared to N2. The mechanism that underlies this is thought to be the incorporation (sinking) of H-adatoms from the surface of TMs to the bulk of the N–H phases. Thus, the slower kinetics of N2 dissociation no longer inhibit ammonia synthesis, and improvements in the kinetics dissociation for TM can be realised without consideration for which specific gases are affected (e.g., the circumventing of scaling relations). The ability to transport H-adatoms from the surface of TM is therefore of fundamental importance to the properties of the N–H co-catalyst implying that the conductivity of these species towards H and N ions, and NHx species, is of utmost importance. As such, we investigate two N–H systems that can be prepared by reacting the respective hydrides with nitrogen resulting in nitride–hydride and imide forms for Ca and Ba, respectively. These have both been previously shown to promote ammonia synthesis and here we investigate their conductive properties, and discuss these systems in the context of activity and stability of the total system with specific focus on the rise of secondary anion species, and the presence of barium in the system.
1 Introduction
Nitrogen–hydrogen (N–H) co-catalysts for mild-condition ammonia synthesis (MCAS, 0.1 mPa, <300 °C) have recently been explored. A large number of materials have been investigated, including, nitride–hydrides (N3−–H−),1–4 imides (NH2−),4–7 and amides (NH2−).3,8 N–H materials are theorised to act as atomic sinks for adatoms absorbed on the TM surfaces,1,5–7 freeing up active sites for further dissociation of gaseous species and breaking the scaling relations9 that have hindered advancements in MCAS for several decades. Scaling relations referring to the phenomenon were improvements in the kinetics of one step associated with a process that gives proportional improvement to another competing step. In the case of MCAS, the preferential dissociation of H2 on TM surfaces is well known and leads to a negative reaction order with H2. Improvements in the kinetics of N2 dissociation equally benefited hydrogen dissociation, thus the issue with hydrogen poisoning remains. The removal of H-adatoms from the active sites is paramount, implying that a good support material should show good ionic conductivity for species involved in ammonia synthesis: H−, N3−, H+, NHx, and e−.Further research has suggested that N–H materials also directly participate in the ammonia synthesis steps rather than just acting as a sink for adatoms:1,10 isotopically labelled nitrogen and hydrogen experiments were conducted that showed that hydrogen atoms from the N–H support lattice were incorporated into the resulting NH3(g) molecules, while N atoms were not. In the case of LiH and BaH2, research from the Chen research group has shown that lattice N-species can also participate in the synthesis step, as evidenced by the recovery of the hydride species from the imide during chemical looping processes.6,7
N–H species are also thought to affect the activity and stability of the TM metals through anchoring. Work by Inoue et al., showed that bonding between N-species in the N–H support, in this case Ca(NH2)2, and surface Ru particles, prevented the conglomeration of the TM catalysts over time.8 The introduction of Ba was found to improve the stability of the system, without a substantial change in activity. Abe et al. found much the same for the Ru–Ca2NH system.2 A follow up paper from the Hosono group found that altering the synthesis route of the Ba–Ca(NH2)2 system leads to substantial activity gains attributed to a “core–shell” structure.3
As noted by Gao et al., the identity of the alkaline earth metal cation can dramatically affect the performance of the system.6 For example, CaNH is known to be a poor catalyst for ammonia production,1 while BaNH has been successfully used.6 In a recent paper, we showed that the presence of the imide species in a predominately nitride–hydride system (actual stoichiometry of Ca2N0.8H0.8(NH)0.4) resulted in the loss of symmetry associated with the nitride–hydride, as well as poor ionic conductivity, as compared to a system without.11 We introduced the nomenclature of α- and β- to denote solid solutions and the pure system, respectively. The observation of poor activity and ionic conductivity of calcium systems containing the imide is potentially of significant importance; implying a link between the two properties. In this paper, we show that the emergence of the imide in a β-Ca2NH (e.g. the conversion of the β- to the α-) is correlated with worsening electrical performance of the system. Previously published work by Inoue et al. noticed that systems of pure Ca(NH2)2 lost activity over the course of several hours of ammonia synthesis.8 A close look at their XRD patterns shows that these phases began to form shoulders that are telltale signs of the formation of a solid solution.4,11 Interestingly, the presence of barium in the system prevented the deterioration of performance over time as observed in the pure Ca(NH2)2 systems, and the XRD patterns do not show the asymmetric broadening observed in systems without barium.3,8 The presence of barium has also been shown to improve the performance and stability of CaH2 supported systems.12
The evolution of solid solutions was a known phenomenon for the application of N–H compounds in solid state storage.13–15 Generally, these mixed phases were called ‘quasi-imide’ since they tended to take the cubic structures of the pure imide structures.15 The stoichiometry of the materials could vary widely (see for example a recent paper by Makepeace et al.4), creating issues for repeatability. This created serious debate about the decomposition pathway of Li2NH.13–16 More recently, these N–H solid solutions have been re-envisioned as potential candidates for ammonia synthesis catalysis.4
In this paper we explore the ionic conductivity properties of Ca2NH from the precursor Ca2N (subnitride). The properties of Ca2N have been explored previously, with Kitano et al. using it as their precursor for the formation of Ca2NH.1,17,18
In the second part of this paper, we look at the electrical properties of BaNH(D) formed from BaH(D)2 when the latter was exposed to N2 at 650 °C. Combined diffraction and electrochemical impedance spectroscopy (EIS) data allow for an estimation of the ionic conductivity of the BaND phase at 650 °C. Additionally, analysis of the peak shifting prior to the emergence of BaND provides evidence for the conduction mechanism of the high temperature barium hydride phase.19
Finally, we draw some general conclusions about the relationship between ionic conductivity of different N–H phases, the performance of ammonia synthesis systems, and the presence of secondary anionic species.
2 Experimental
Ca2N was made from α-Ca3N2 (Alfa Aesar) by heating the granules/pressed pellets in a sealed reactor to 1000 °C under flowing dry Ar for 20 h. The pellets were then painted with Pd paste and dried in a glove box for 10 min at 100 °C. The pellets were measured for thickness as well as the area of the electrodes and then loaded into a conductivity rig and heated under flowing Ar with a mixture of N2 and H2 depending on the experiment. EIS data were collected on the pellets using a Solartron 1280c in a two point configuration under a perturbation voltage of 40 mV and a frequency range of 100 kHz to 1 Hz. X-ray diffraction (XRD) patterns of the precursor and post-experiment samples were collected on a Panalytical Empyrean diffractometer using Cu-Kα radiation. Post-experiment samples were ground using a mortar and pestle in a glovebox. The samples were protected from the atmosphere using Kapton films.BaD2 samples were made by exposing Ba metal in a sealed reactor to flowing 5% D2 in Ar at 700 °C for 8 h. The samples were then ground and pressed in 25 mm pellets to an approximate thickness of 3 mm. The pressed pellets were then sintered at 800 °C in 5% D2 in Ar for 2 h. These pellets were painted with Pd electrodes and dried at 100 °C for 10 min in a glovebox. The pellets were then transferred to ISIS Neutron and Muon Source in sealed containers and loaded into the St Andrews in situ cell (see Irvine et al.19). The in situ cell allowed for the simultaneous collection of EIS data (using an IVIUMSTAT). The cell was loaded into a Polaris diffractometer20 and heated under flowing 5% D2 in Ar gas to 650 °C. Neutron powder diffraction (NPD) patterns and EIS spectra were collected every 2 min during the exposure of the system to 5/5/90 cm3 min−1 of N2/D2/Ar over the course of 8 h.
EIS spectra were modelled using equivalent circuits which consist of a resistor in series with units of parallel capacitors and resistors (CR unit). Generally, the series resistor (Rs) was the element of interest as the timescales of bulk diffusion fell outside of the range of frequencies available to the spectrometer. The geometric capacitance of the high frequency CR unit was typically associated with grain boundary response or electrode-surface processes,21 implying the Rs was associated with bulk diffusion in the former case, and bulk and grain boundary response in the latter. In the second case, the grain boundary contribution was assumed to be relatively small compared to the bulk due to the typically large activation energies of the grain boundary processes.21 The conductivity (σ) is defined as:
 | (1) |
 | (2) |
3 Results and discussion
3.1 Calcium nitride–hydride
After synthesis, Ca2N phase formation was confirmed using X-ray diffraction (Fig. 1a). The XRD pattern showed a 90% pure phase with 10% oxide phase (CaO, Fm![[3 with combining macron]](https://www.rsc.org/images/entities/char_0033_0304.gif) m, a = 4.84 Å). The phase agreed well with results published by Gregory et al.,17 with lattice parameters of a = b = 3.627 Å, and c = 19.105 Å (compared with 3.623 Å and 19.102 Å, respectively). Ca2N is a rhombohedral structure (space group R
m, a = 4.84 Å). The phase agreed well with results published by Gregory et al.,17 with lattice parameters of a = b = 3.627 Å, and c = 19.105 Å (compared with 3.623 Å and 19.102 Å, respectively). Ca2N is a rhombohedral structure (space group R![[3 with combining macron]](https://www.rsc.org/images/entities/char_0033_0304.gif) m) with alternating layers of trapped electrons (e−) and nitride ions (N3−) – see Fig. 2. These materials are known as ‘subnitrides’ and are electrides meaning that localised electrons exist as anionic species.17 Interestingly, these compounds have a very similar structure to the nitride–hydride phases formed by barium and strontium metals with the electride layer replaced with hydride ions (H−).23,24 Recently, we showed calcium nitride–hydride likely forms in the super-rock-salt structure (Fd
m) with alternating layers of trapped electrons (e−) and nitride ions (N3−) – see Fig. 2. These materials are known as ‘subnitrides’ and are electrides meaning that localised electrons exist as anionic species.17 Interestingly, these compounds have a very similar structure to the nitride–hydride phases formed by barium and strontium metals with the electride layer replaced with hydride ions (H−).23,24 Recently, we showed calcium nitride–hydride likely forms in the super-rock-salt structure (Fd![[3 with combining macron]](https://www.rsc.org/images/entities/char_0033_0304.gif) m) – essentially the rock-salt structure with a slightly distorted FCC Ca2+ and ordered octahedral positions split between N3− and H− based on the d (diamond glide plane) symmetry.11
m) – essentially the rock-salt structure with a slightly distorted FCC Ca2+ and ordered octahedral positions split between N3− and H− based on the d (diamond glide plane) symmetry.11
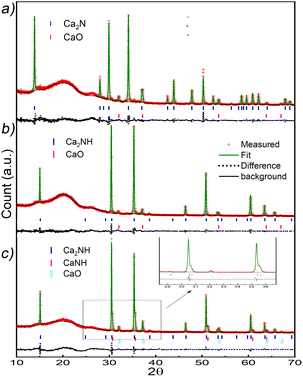 | ||
| Fig. 1 XRD patterns for the Ca2N and the Ca2NH formed from it. (a) Ca2N post synthesis XRD pattern. The pattern matches well with the structure published by Gregory et al.17 The weight fractions are 0.90 and 0.10 for Ca2N and CaO, respectively. (b) XRD pattern of the resulting system from Ca2N exposed to 5% H2 in flowing Ar at 700 °C for 8 h. The pattern was collected at room temperature and shows a 93% Ca2NH phase with the remainder being CaO. (c) XRD pattern and refinement for Ca2N doped with H2 at temperatures above 600 °C. Refinement shows a distinct shoulder associated with the presence of a solid solution.4,11 | ||
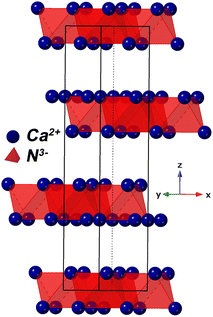 | ||
| Fig. 2 Crystal model of Ca2N showing Ca–N octahedrals. Electrons are thought to exist between the layers.17 | ||
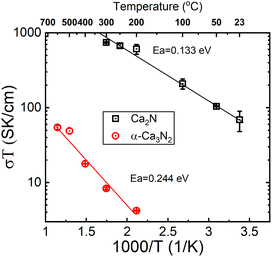
A pellet of Ca2N was tested for conductivity using a gas tight conductivity rig under flowing Ar and the results are shown in Fig. 3. The results of these tests strongly suggest that Ca2N is a semiconductor. Very similar behaviour is also observable from the precursor α-Ca3N2.11 By removing a quarter of the nitride ions from α-Ca3N2, the performance of the system increases dramatically; the activation energy is nearly halved (from 224 meV to 133 meV), and the conductivity increases 100× (from 0.0145 S cm−1 to 1.30 S cm−1 at 300 °C). As shown in Fig. 2 the structure of Ca2N is made up of layers of face sharing Ca–N octahedrals separated by layers of electrons. The high conductivity measured in the system is likely the result of these layers of electrons.17
As Kitano et al. showed, this phase can be converted into a nitride–hydride phase by exposing the sample to H2.1Fig. 1b shows the XRD pattern of the resulting phase after exposing Ca2N to 5% H2 gas in Ar at 700 °C for 8 h. Rietveld refinement of the structure showed the pattern to be 93% Ca2NH with a = 10.138 Å comparing well with the structure published by Brice et al., and 7% CaO (χ2 = 1.944, see Table 1). This lattice parameter is close to the β-Ca2NH formed from CaH2 of a = 10.135 Å.11 Verbraeken et al. have previously suggested that Ca2NH might be better modelled using the R![[3 with combining macron]](https://www.rsc.org/images/entities/char_0033_0304.gif) m space group.25 Our fit of the room temperature XRD pattern using the R
m space group.25 Our fit of the room temperature XRD pattern using the R![[3 with combining macron]](https://www.rsc.org/images/entities/char_0033_0304.gif) m space group, returned values of a = 3.5844 Å and c = 17.5596 Å with χ2 = 2.072 (see Table 1). The goodness-of-fit (χ2) is slightly worse than the Fd
m space group, returned values of a = 3.5844 Å and c = 17.5596 Å with χ2 = 2.072 (see Table 1). The goodness-of-fit (χ2) is slightly worse than the Fd![[3 with combining macron]](https://www.rsc.org/images/entities/char_0033_0304.gif) m fit, but not enough to definitively dismiss the possibility that the structure forms in the R
m fit, but not enough to definitively dismiss the possibility that the structure forms in the R![[3 with combining macron]](https://www.rsc.org/images/entities/char_0033_0304.gif) m.
m.
a The number in parentheses denotes the two experiments discussed in the text: 1 being the pure Ca2NH compound formed at 700 °C in 5% H2 in Ar. The resulting compound was fit using both the R![[3 with combining macron]](https://www.rsc.org/images/entities/char_0033_0304.gif) m and Fd m and Fd![[3 with combining macron]](https://www.rsc.org/images/entities/char_0033_0304.gif) m space groups with no apparent difference in fit quality; 2 denotes the resulting compound from an experiment where Ca2N was exposed to H2 at varying temperatures while EIS data was collected.
b This species is of mixed character and it is unclear what its true stoichiometry is. This fact is reflected in the N site occupancy. m space groups with no apparent difference in fit quality; 2 denotes the resulting compound from an experiment where Ca2N was exposed to H2 at varying temperatures while EIS data was collected.
b This species is of mixed character and it is unclear what its true stoichiometry is. This fact is reflected in the N site occupancy.
|
|||||
|---|---|---|---|---|---|
| Phase | Ca2N | Ca2NH (1) | Ca2NH (1) | Ca2NH (2) | CaNHb |
| Space group |
R![[3 with combining macron]](https://www.rsc.org/images/entities/char_0033_0304.gif) m m |
R![[3 with combining macron]](https://www.rsc.org/images/entities/char_0033_0304.gif) m m |
Fd![[3 with combining macron]](https://www.rsc.org/images/entities/char_0033_0304.gif) m m |
Fd![[3 with combining macron]](https://www.rsc.org/images/entities/char_0033_0304.gif) m m |
Fm![[3 with combining macron]](https://www.rsc.org/images/entities/char_0033_0304.gif) m m |
| a (Å) | 3.62729(10) | 3.58440(8) | 10.13818(19) | 10.14373(23) | 5.0443(4) |
| c (Å) | 19.1047(8) | 17.5596(9) | — | — | — |
| V(Å)3 | 217.689(13) | 195.379(11) | 1042.030(34) | 1043.74(4) | 128.351(18) |
| Ca (0 0 x) | Ca (0 0 x) | Ca (0 0 x) | Ca (x x x) | Ca (x x x) | Ca(0 0 0) |
| x | 0.26787(8) | 0.24034(8) | 0.25996(7) | 0.26091(10) | — |
| Uisox100 (Å2) | 0 | 1.44(7) | 1.60(6) | 0 | 2.5 |

|

|

|

|

|
|
| Occupancy | 1 | 1 | 1 | 1 | 0.8567 |
| Uiso | 0 | 0 | 0 | 0 | 2.5 |
| χ 2 | 3.452 | 2.063 | 1.944 | 6.098 | — |
| R p | 0.0678 | 0.0473 | 0.0461 | 0.084 | — |
| R w p | 0.0889 | 0.0649 | 0.0631 | 0.1059 | — |
| Secondary phase | 10% Cao | 5% CaO | 5% CaO | 9% Cao & 27% CaNH | |
Next, electrochemical impedance spectroscopy (EIS) was conducted on pellets of Ca2N exposed to H2. Fig. 4 shows the conductivity measured as a function of time exposed to flowing (100 cm3 min−1) 5% H2 gas in Ar at 600 °C. As shown in Fig. 4, the conductivity of the Ca2N system is initially really high, but after only a few minutes it plummets by two orders of magnitude before increasing to approximately 1.4 × 10⁻² S cm−1, placing the system in the fast ion conducting category. Interestingly, the conductivity measured for this system is about 6× lower than the conductivity measured for the β-Ca2NH system from CaH2 (0.08 S cm−1). The measured difference may be a result of the presence of the CaH2 in the β-Ca2NH system. Alternatively, the difference may be the result of the formation of Ca2NH in the R![[3 with combining macron]](https://www.rsc.org/images/entities/char_0033_0304.gif) m space group following along from Ca2N.
m space group following along from Ca2N.
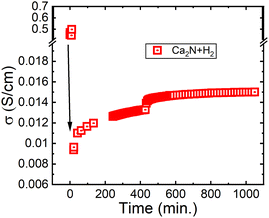 | ||
| Fig. 4 EIS calculated conductivity from Ca2N exposed to 5% H2 in Ar at 600 °C. The initial conductivity is for the Ca2N phase, while the resulting conductivity is from Ca2NH as shown by the post experiment XRD pattern 1 (see Fig. 1b). | ||
After two days, the pellet conductivity dropped by 20% and the resistance associated with a surface layer (likely the electrode with a capacitance between 10−7 to 10−9 F) had more than doubled (see Fig. 5). Upon heating the system to 650 °C and 700 °C, the electrode resistance decreased as expected for a mass transport phenomenon, however, the Rs (bulk conductivity) continued to degrade. The sample was then cooled back to 600 °C, where the conductivity measured 7 × 10⁻³ S cm−1, nearly half the value measured before heating. Thus, it seems that high temperatures (>600 °C) are correlated with decreasing performance of the system. The system was then cooled to 100 °C, then heated back up to 600 °C in 100 °C increments to measure σ(T). Although, Relectrode showed continued growth, the measured conductivity was 8 × 10⁻³ S cm−1 at 600 °C, implying that the ionic conductivity of the bulk was unaffected by lower temperatures.
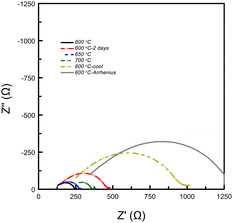 | ||
| Fig. 5 EIS data collected on a Ca2N pellet exposed to H2 gas at varying temperatures. Data is in chronological order. The data shows that the arc associated with a surface layer (10−9 to 10−7 F21) doubles after two days at 600 °C. The grey spectrum shows the data collected at 600 °C used for the conductivity log plot (see Fig. 6). | ||
The σ(T) is shown in a log plot in Fig. 6. Capacitance values were calculated for high frequency response using equivalent circuits for the 400 and 500 °C data and returned values of 8.9 × 10⁻¹⁰ and 1.9 × 10⁻⁹ F, respectively. These values fall comfortably within the grain boundary response values,21 implying that the change in the trend is not a result in change from a bulk to grain boundary measurement due to the increase in temperature. However, the decrease in resistance associated with the grain boundary is notable; decreasing by an order of magnitude from 3.67 × 10⁴ to 1.01 × 10³ Ω. In a previous paper, we showed that β-Ca2NH likely conducts ions via a vacancy mediated diffusion pathway.11 Although Ba2NH is not easily formed by direct reaction, it has been reported as growing from the vapour phase,23 the conductivity vs. temperature published previously by Altorfer et al. matches well with our results on Ca2NH.26 They noted a change in the trend in ionic conductivity starting at 250 °C. Interestingly, low temperature (30 K) NPD data refinement by the authors showed that the intrinsic vacancy concentration (15%) remained, implying that the sudden increase in conductivity was not related to the populating of the secondary site. Brice et al. also seem to suggest that Ca2NH has an intrinsic vacancy concentration at RT.27 Therefore, the reason for the sudden change in conductivity for these two systems at elevated temperatures is not clear as the thermally induced occupation of a secondary site, opening up the main site for diffusion, is a compelling explanation.
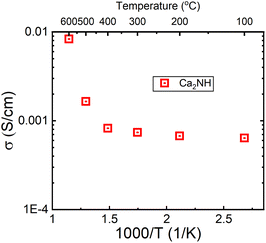 | ||
| Fig. 6 Log of conductivity plot for the Ca2NH system. A large jump in conductivity is observed between 400 and 500 °C. A similar jump was observed in the H− conductor Ba2NH by Altorfer et al.26 | ||
A post-experiment XRD pattern was taken and analysed (see Fig. 1c). Some of the nitride–hydride peaks have asymmetric broadening toward larger 2θ values. The shoulder peaks are indicative of a secondary anionic species.4,11 Refinement gave a ratio 75![[thin space (1/6-em)]](https://www.rsc.org/images/entities/char_2009.gif) :
:![[thin space (1/6-em)]](https://www.rsc.org/images/entities/char_2009.gif) 25 between the main peak and the shoulder (with a 9% CaO phase). The shoulder was modelled using a nitrogen deficient octahedral site (0.8567 occupancy) implying the phase was a mixed nitride–hydride, imide species similar to α-Ca2NH. The lattice parameter of this phase reflects its mixed nature with a = 5.045 Å, smaller than the value given by Sichla et al. for CaNH of 5.143 Å, and smaller than the equivalent value for the nitride–hydride phase of 5.065 Å (10.13 Å divided by 2). However, unlike α-Ca2NH from α-Ca3N2, the Ca2NH phase retained its peak associated with the Fd
25 between the main peak and the shoulder (with a 9% CaO phase). The shoulder was modelled using a nitrogen deficient octahedral site (0.8567 occupancy) implying the phase was a mixed nitride–hydride, imide species similar to α-Ca2NH. The lattice parameter of this phase reflects its mixed nature with a = 5.045 Å, smaller than the value given by Sichla et al. for CaNH of 5.143 Å, and smaller than the equivalent value for the nitride–hydride phase of 5.065 Å (10.13 Å divided by 2). However, unlike α-Ca2NH from α-Ca3N2, the Ca2NH phase retained its peak associated with the Fd![[3 with combining macron]](https://www.rsc.org/images/entities/char_0033_0304.gif) m ordering (2θ = 15.1°). Furthermore, α-Ca2NH had a shoulder at lower 2θ with a lattice parameter of 5.112 Å. A previous experiment on β-Ca2NH from CaH2 also displayed these shoulder peaks (Fig. S1 and S2†). In that experiment, a large growth in Rp (electrode response, C = 10−8 F)21 was noted when the sample was heated above 650 °C. Although the Rs was not significantly affected, the large gain in Relectrode was irreversible. This dramatic increase in Relectrode is potentially related to anchoring effects explored by Abe et al.:2 the formation of even a small amount of imide at the interface between the bulk and electrode could lead to poor charge transfer processes and the decrease in electrode performance.
m ordering (2θ = 15.1°). Furthermore, α-Ca2NH had a shoulder at lower 2θ with a lattice parameter of 5.112 Å. A previous experiment on β-Ca2NH from CaH2 also displayed these shoulder peaks (Fig. S1 and S2†). In that experiment, a large growth in Rp (electrode response, C = 10−8 F)21 was noted when the sample was heated above 650 °C. Although the Rs was not significantly affected, the large gain in Relectrode was irreversible. This dramatic increase in Relectrode is potentially related to anchoring effects explored by Abe et al.:2 the formation of even a small amount of imide at the interface between the bulk and electrode could lead to poor charge transfer processes and the decrease in electrode performance.
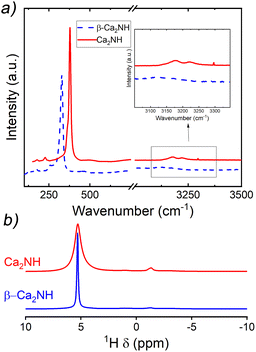
A post experiment Raman spectrum was collected and is shown in Fig. 7a. The spectrum is offset from a spectrum collected on β-Ca2NH formed from CaH2. The major peaks (associated with the nitride–hydride1) centred at 327 cm−1 are almost identical, while the Ca2NH shows some small peaks in the imide/amide region (∼3200 cm−1). Interestingly, the Raman data only shows weak peaks in the imide/amide region, while the XRD analysis gives a shoulder peak concentration of 27% implying the phase is still predominately nitride–hydride in character. Additionally, the shifting of the major peak to lower wavenumbers observed in the α-Ca2NH from α-Ca3N2 is not present in this Ca2NH phase.11 The shifting to lower energy environments is typical of highly disordered phases.
A solid-state-NMR spectrum was collected for the Ca2NH synthesised at 700 °C. This is shown in comparison to a β-Ca2NH from CaH2 in Fig. 7b. Corroborating the results of the Raman spectra, the NMR spectrum of Ca2NH shows a major peak at 5.30 ppm, which is associated with the hydride ion. This peak matches well with the previously found hydride peak for nitride–hydrides of 5.28 ppm. A noticeable difference in broadness is apparent in the two spectra, implying a more disordered structure for Ca2NH from Ca2N as compared to that prepared from CaH2. Importantly, Ca2NH lacks any peaks associated with imide or amide anions (there is a small peak at −1.32 ppm associated with hydroxyl groups formed during sample preparation).
Together the Raman and NMR results show that the composition between Ca2NH and β-Ca2NH are quite similar, with Ca2NH has a slightly static displacement associated with it (broadness in the NMR spectra). This observation is potentially related to the difference in calculated ionic conductivity between the two phases.
Together, we have shown that Ca2NH can be formed from Ca2N, but with a lower overall conductivity of 1.4 × 10⁻² S cm−1 compared with 8 × 10⁻² S cm−1 for β-Ca2NH. The difference is potentially a result of the precursor properties. The presence of CaH2 may aid in the vacancy creation for the β-Ca2NH phase. Alternatively, the R![[3 with combining macron]](https://www.rsc.org/images/entities/char_0033_0304.gif) m structure of the Ca2N precursor may carry over to the Ca2NH phase. This structural difference could result in different thermodynamics for vacancy creation, resulting in different effective charge carrier densities.
m structure of the Ca2N precursor may carry over to the Ca2NH phase. This structural difference could result in different thermodynamics for vacancy creation, resulting in different effective charge carrier densities.
We also noted that the change in performance of the system was associated with the presence of shoulder peaks revealed by the post-experiment XRD data. This reduction in conductivity is in accord with the poor performance observed in the α-Ca2NH. However, there are important differences between this Ca2NH and α-Ca2NH. First, the imide concentration for α-Ca2NH was found to be 20% from NPD refinement, which at first glance matches nicely with the 27% phase fraction for this Ca2NH species. However, careful consideration shows that these two phases are not similar. Firstly, the shoulder on this Ca2NH phase is found at the high 2θ side, while for α-Ca2NH it is found at low 2θ (see Fig. S3†). Furthermore, the α-Ca2NH forms in the rock-salt structure Fm![[3 with combining macron]](https://www.rsc.org/images/entities/char_0033_0304.gif) m, while this Ca2NH diamond glide-plane symmetry. Refinement of XRD pattern in Fig. S3† gives a Ca:N ration of 2
m, while this Ca2NH diamond glide-plane symmetry. Refinement of XRD pattern in Fig. S3† gives a Ca:N ration of 2![[thin space (1/6-em)]](https://www.rsc.org/images/entities/char_2009.gif) :
:![[thin space (1/6-em)]](https://www.rsc.org/images/entities/char_2009.gif) 1.4; significantly deviating from the ideal ratio of 2
1.4; significantly deviating from the ideal ratio of 2![[thin space (1/6-em)]](https://www.rsc.org/images/entities/char_2009.gif) :
:![[thin space (1/6-em)]](https://www.rsc.org/images/entities/char_2009.gif) 1 for Ca2NH. This ratio gives an imide concentration in the main phase of 44% in addition to the presence of the shoulder. Thus, its likely that the true concentration of a secondary imide/amide species in this Ca2NH phase is significantly lower than for α-Ca2NH. This result explains the lack of imide/amide signal in the NMR data, and also implies that even a small concentration of NHx species in the nitride-hydride lattice has a large negative impact on the ionic conductivity of a Ca2NH phase. It is not clear whether further reaction of Ca2NH will produce higher concentration of the imide/amide species. However, the decrease in performance over time suggests that it will. Finally, we noted that the conductivity data vs. temperature matched well with results published previously by Altorfer et al. on Ba2NH.26 These authors hypothesised that the H− conduction in Ba2NH was via a main site hopping mechanism, exactly as we showed in our quasi-elastic neutron scattering study on β-Ca2NH.11
1 for Ca2NH. This ratio gives an imide concentration in the main phase of 44% in addition to the presence of the shoulder. Thus, its likely that the true concentration of a secondary imide/amide species in this Ca2NH phase is significantly lower than for α-Ca2NH. This result explains the lack of imide/amide signal in the NMR data, and also implies that even a small concentration of NHx species in the nitride-hydride lattice has a large negative impact on the ionic conductivity of a Ca2NH phase. It is not clear whether further reaction of Ca2NH will produce higher concentration of the imide/amide species. However, the decrease in performance over time suggests that it will. Finally, we noted that the conductivity data vs. temperature matched well with results published previously by Altorfer et al. on Ba2NH.26 These authors hypothesised that the H− conduction in Ba2NH was via a main site hopping mechanism, exactly as we showed in our quasi-elastic neutron scattering study on β-Ca2NH.11
3.2 Barium imide
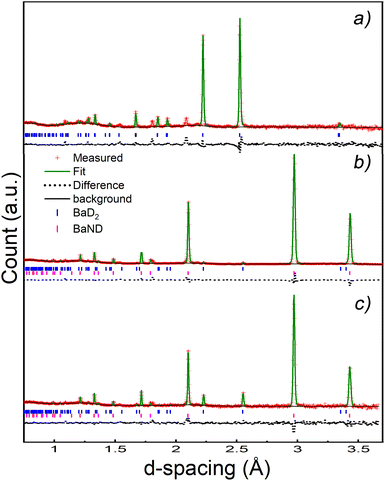
A pellet of BaD2 was doped with N2 at 650 °C on the Polaris diffractometer at ISIS neutron and muon source.20 Simultaneous collection of EIS and diffraction data allowed for the comparison of electrical response with the change in phase fraction over the course of the experiment. In order to quantify the change in phase fraction, first, representative models of the starting phase, barium deuteride, and the resulting phase, barium imide, were produced. In the case of the precursor BaD2, a 12 min predoping pattern was fitted using the model published by Irvine et al.19 The refinement results are available in Table 2 and the fit is shown in Fig. 9a. As noted previously, due to the high covariance of the thermal parameters (U) and the occupancies of the D sites, the occupancies were fixed according to the thermal gravimetric analysis done by Verbraeken et al.28 A noticeable difference in the lattice parameters is seen for the starting phase of this experiment (the volume is ∼1% smaller), as well as the D1 U33 thermal parameter being 1/3 smaller compared to previously published results.19![[thin space (1/6-em)]](https://www.rsc.org/images/entities/char_2009.gif) a
a
| a Three different refinements results are shown: start (BaD2), middle (BaD2 and BaND) and end (BaND). | ||||
|---|---|---|---|---|
| Phase | BaD2 (start) | BaD2 (middle) | BaND (middle) | BaND (end) |
| Space group | P63/mmc | P63/mmc |
Fm![[3 with combining macron]](https://www.rsc.org/images/entities/char_0033_0304.gif) m m |
Fm![[3 with combining macron]](https://www.rsc.org/images/entities/char_0033_0304.gif) m m |
| a (Å) | 4.44362(32) | 4.45167(32) | 5.93710(9) | 5.94083(29) |
| c (Å) | 6.6878(6) | 6.7999(10) | — | — |
| V (Å3) | 114.364(15) | 116.703(21) | 209.278(6) | 209.672(18) |

|

|
Ba (0 0 0) | Ba (0 0 0) | |
| Occupancy | 1 | 1 | 1 | 1 |
| U11 × 100 (Å2) | 2.35 | 2.35 | 5.78(10) | 5.78(10) |
| U33 × 100 (Å2) | 6.26 | 6.26 | — | — |
| U12 × 100 (Å2) | 0 | 0 | 0 | 0 |

|

|
D (x x x) | D (x x x) | |
| x | 0.8269(5) | 0.8269(5) | 0.38367 | 0.38367 |
| Occupancy | 0.4575 | 0.4575 | 0.125 | 0.125 |
| U11 × 100 | 3.39 | 3.39 | 28.6(10) | 28.6(10) |
| U33 × 100 | 9.36 | 9.36 | — | — |
| U12 × 100 | 0 | 0 | 9.7(9) | 9.7(9) |
| D2 (0 0 0) | D2 (0 0 0) |

|

|
|
| Occupancy | 0.915 | 0.915 | 1 | 1 |
| U11 × 100 | 16.08 | 16.08 | 6.03(5) | 6.03(5) |
| U33 × 100 | 4.36 | 4.36 | — | — |
| U12 × 100 | 5.54 | 5.54 | 0 | 0 |
| χ 2 | 2.775 | 0.9779 | — | 16.04 |
| R p | 0.0387 | 0.0758 | — | 0.0292 |
| R w p | 0.0276 | 0.0498 | — | 0.0206 |
In order to calculate the conductivity measured by EIS, the geometric factor was calculated to be 0.179 cm−1 based on the geometry of the electrodes. Interestingly, this calculated G gives a conductivity of just 0.050 S cm−1 for BaD2 at 650 °C, which is significantly smaller than previously reported values.19,28
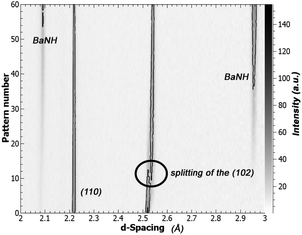
An interesting change was noticed in the BaD2 reflections before the emergence of a secondary phase: the (102) reflection split in two, with a slightly larger d-spacing peak growing over the course of the experiment (see Fig. 8). A similar split was not observed in the (110) reflection. Calculations were made to quantify the change in lattice parameter for the a-axis and c-axis between pattern 1 and pattern 43, and it was found that the c-axis grew by 1.43% while the a-axis expanded by 0.0654%, less than half. The expansion of the lattice before a transformation to the BaND phase implies nitrogen doping into the bulk of BaD2.
In the high temperature BaD2 system, there are two hydride sites. The first site (D1) is on the split 4f site, and has been shown previously to be anistropically distributed in the [001], while the second site (D2) is on the 2a site, and has a spherical distribution (seen both in NPD refinement results, and total scattering reverse Monte Carlo simulations).19 Previously, we showed that the anisotropic displacement of the D1 site is associated with high energy geometric frustration, that leads to concerted migration and superionic conductivity. The expansion of the lattice matching with the anisotropic distribution of the D1 site, implies that the nitrogen species (be it N3− or NH2−) is selectively doping into the D1. This result matches well with the ionic conductivity model predicting a D1 only diffusion mechanism.
A new phase can be seen emerging after 40 min, and becomes clear after 80 min in Fig. 8. This phase was modelled by summing the last 73 patterns of the experiment and refining the result. The results shows that doping BaD2 at 650 °C with N2 produced barium imide (BaNH(D); see Table 2 and Fig. 9b). The crystal model proposed by Sichla et al.24 was used as a staring point. The imide proton was placed on the 32f position with a fixed occupancy giving a stoichiometric compound. The position of the proton was refined as well as the thermal parameter, but again, due to covariance, these two parameters could not be refined simultaneously. The large thermal parameter observed for the 32f position suggests that a lower symmetry site may better represent the positional disorder. Fourier difference maps indicated that a 192 general site could be used. However, it was found that the fitting became unstable when refinement of the coordinates of the 192 site was attempted, likely due to the extremely low occupancy of the site (2.08% of the sites would actually be occupied). The data does indicate that the imide proton is extremely positionally disordered, likely due to rotation of the NH2− species inside the lattice.
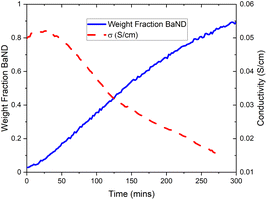
Next, the BaD2 and BaND refinement results were used to model all 240 patterns collected during the experiment. First, manual refinement of the 120th pattern was conducted. These results are shown in Table 2 and Fig. 9c. Next, SEQGSAS refinements were conducted going up and down the sequence from the 120th. Refinement was only conducted on the phase fraction and lattice parameters of the phases. After 8 h, the BaD2 phase had almost completely been converted to BaND (98%). The series resistance value increased from an initial value of 3.59 Ω to a value of 12.55 Ω after 280 min (see Fig. 10). The results show that at 280 min there is an 84% concentration of BaND and a conductivity of 0.0143 S cm−1. Thus, it appears possible that barium imide is an ionic conductor as well. However, the next EIS spectrum showed a dramatic increase in the high frequency response with an Rp = 8.44 × 10⁵ Ω and a capacitance of 3.34 × 10⁻¹² F cm−1, whereas before this dataset, the high frequency response was likely associated with mass transfer at the electrode (10−4 F cm−1). According to Irvine et al., the new pF capacitance value would be too small for a grain boundary effect, suggesting that it is associated with bulk diffusion.21 However, it is not clear why the impedance response of the system would change by several orders of magnitude with a small increase in imide phase fraction (at 282 min the fraction is 87%). Furthermore, there was no noticeable change in the NPD patterns other than the small change in phase fractions. Together, the results suggest that the system reached a percolation threshold.
Therefore, it seems likely that barium imide conducts ions, possibly protons. However, at higher concentrations, there seems to be a dramatic change in behaviour. In conjunction with the results published by Gao et al.,6,7 its likely that it is an ionic conductor. This result agrees with the Ca2NH system; a N–H system that shows good ionic conductivity also has ammonia synthesis activity, and systems that are poor ionic conductors, like CaNH, do not show good activity.
4 Conclusions
β-Ca2NH formed from Ca2N is likely a hydride ion conductor like β-Ca2NH formed from CaH2. However, the measured ionic conductivity for this new β-phase is about 4× lower than that measured previously.11 The difference may be related to the equilibrium formed between β-Ca2NH and CaH2 (roughly 90![[thin space (1/6-em)]](https://www.rsc.org/images/entities/char_2009.gif) :
:![[thin space (1/6-em)]](https://www.rsc.org/images/entities/char_2009.gif) 10) as opposed to the full conversion of Ca2N to β-Ca2NH. Or, the difference may be a result of different anionic species ordering with one Ca2N derived species potentially forming in the R
10) as opposed to the full conversion of Ca2N to β-Ca2NH. Or, the difference may be a result of different anionic species ordering with one Ca2N derived species potentially forming in the R![[3 with combining macron]](https://www.rsc.org/images/entities/char_0033_0304.gif) m space group rather than the Fd
m space group rather than the Fd![[3 with combining macron]](https://www.rsc.org/images/entities/char_0033_0304.gif) m. NMR and Raman results show that the average energy profile of the systems are quite similar, with the exception of static disordering present in the Ca2N derived system, as evidenced by the relative broadness of the NMR peak.
m. NMR and Raman results show that the average energy profile of the systems are quite similar, with the exception of static disordering present in the Ca2N derived system, as evidenced by the relative broadness of the NMR peak.
Furthermore, we show that the β-phase formed from Ca2N could be converted to an α-phase by exposing the system to H2 at temperatures above 650 °C. The formation of the α-phase was characterised by a decrease in the measured bulk ionic conductivity, as well as a dramatic growth in the resistance associated with the electrode response. The growth of the electrode response could be potentially related to the formation of imide species and the mass transfer between them and the Pd electrode. For example, the formation of surface imide species has been shown to affect the agglomeration of TM catalysis.2
Finally, it was shown that the solid solution formed from the β-phase was fundamentally different than that formed directly from α-Ca3N2.11 Specifically, we noted that the solid solution formed from the β-phase had the characteristic broadening towards lower d-spacings, while that from the α-Ca3N2 phase, had broadening towards higher d-spacings. This distinction is important since the equivalent lattice parameter for the nitride–hydride is 5.065 Å,27 while the imide is 5.143 Å,24 meaning that shoulders towards lower d-spacings are likely more nitride–hydride in character, with the opposite true for higher d-spacings. Thus, while the β-phase can and will host secondary anion sites, these sites are lower in concentration than for the α-phase formed from α-Ca3N2. This result perhaps explains why the conductivity measured for the β-phase did not decrease as dramatically as observed previously.
Next, we explored the effects of doping BaD2 with N2 at 650 °C. The NPD data suggests that the N-species is preferentially doped into the D1 site of BaD2, as shown by the anisotropic expansion of the lattice in [001] and the splitting of the (102) reflection.
Next, we noted that as barium imide appeared, the measured conductivity dropped before hitting a nadir of 1/4 the starting value at a phase fraction of 84% BaND. Past this point, a dramatic change in the EIS data showed a new arc appearing with a resistance of 8.44 × 10⁵ Ω and a capacitance of 3.34 × 10⁻¹² F cm−1. The reason for this change is not clear, but it may indicate that the imide system performs poorly as a pure species.
Together, the results show that β-Ca2NH can be made from Ca2N with a good ionic conductivity of 1.4 × 10⁻³ S cm−1. This conductivity potentially plays an important role in promoting ammonia synthesis, as shown by the activity of this species with a Ru catalyst.1
Finally, we showed that the formation of BaND up to a weight percent of 84% only marginally affected the ionic conductivity of the system, while the formation of imide species in a concentration of just 20% (from 0.857 occupancy of N in the CaNH phase, and the 27% weight fraction of that phase) in the β-Ca2NH was shown to decrease the measured conductivity by half. This result may explain why the presence of barium stabilises N–H systems as observed by Inoue, Kitano, and Hattori et al.3,8,12
Conflicts of interest
There are no conflicts to declare.Notes and references
- M. Kitano, Y. Inoue, H. Ishikawa, K. Yamagata, T. Nakao, T. Tada, S. Matsuishi, T. Yokoyama, M. Hara and H. Hosono, Chem. Sci., 2016, 7, 4036–4043 RSC.
- H. Abe, Y. Niwa, M. Kitano, Y. Inoue, M. Sasase, T. Nakao, T. Tada, T. Yokoyama, M. Hara and H. Hosono, J. Phys. Chem. C, 2017, 121, 20900–20904 CrossRef CAS.
- M. Kitano, Y. Inoue, M. Sasase, K. Kishida, Y. Kobayashi, K. Nishiyama, T. Tada, S. Kawamura, T. Yokoyama, M. Hara and H. Hosono, Angew. Chem., Int. Ed., 2018, 57, 2648–2652 CrossRef CAS PubMed.
- J. W. Makepeace, J. M. Brittain, A. Sukhwani Manghnani, C. A. Murray, T. J. Wood and W. I. David, Phys. Chem. Chem. Phys., 2021, 23, 15091–15100 RSC.
- P. Wang, F. Chang, W. Gao, J. Guo, G. Wu, T. He and P. Chen, Nat. Chem., 2017, 9, 64–70 CrossRef CAS PubMed.
- W. Gao, P. Wang, J. Guo, F. Chang, T. He, Q. Wang, G. Wu and P. Chen, ACS Catal., 2017, 7, 3654–3661 CrossRef CAS.
- W. Gao, J. Guo, P. Wang, Q. Wang, F. Chang, Q. Pei, W. Zhang, L. Liu and P. Chen, Nat. Energy, 2018, 3, 1067–1075 CrossRef CAS.
- Y. Inoue, M. Kitano, K. Kishida, H. Abe, Y. Niwa, M. Sasase, Y. Fujita, H. Ishikawa, T. Yokoyama, M. Hara and H. Hosono, ACS Catal., 2016, 6, 7577–7584 CrossRef CAS.
- F. Abild-Pedersen, J. Greeley, F. Studt, J. Rossmeisl, T. R. Munter, P. G. Moses, E. Skúlason, T. Bligaard and J. K. Nørskov, Phys. Rev. Lett., 2007, 99, 4–7 CrossRef PubMed.
- M. Kitano, J. Kujirai, K. Ogasawara, S. Matsuishi, T. Tada, H. Abe, Y. Niwa and H. Hosono, J. Am. Chem. Soc., 2019, 141, 20344–20353 CrossRef CAS PubMed.
- G. J. Irvine, R. I. Smith, M. O. Owen Jones and J. T. Irvine, Nat. Commun., 2023, in press Search PubMed.
- M. Hattori, T. Mori, T. Arai, Y. Inoue, M. Sasase, T. Tada, M. Kitano, T. Yokoyama, M. Hara and H. Hosono, ACS Catal., 2018, 8, 10977–10984 CrossRef CAS.
- P. Chen, Z. Xiong, J. Luo, J. Lin and K. L. Tan, J. Phys. Chem. B, 2003, 107, 10967–10970 CrossRef CAS.
- W. I. David, M. O. Jones, D. H. Gregory, C. M. Jewell, S. R. Johnson, A. Walton and P. P. Edwards, J. Am. Chem. Soc., 2007, 129, 1594–1601 CrossRef CAS PubMed.
- E. Weidner, D. J. Bull, I. L. Shabalin, S. G. Keens, M. T. F. Telling and D. K. Ross, Chem. Phys. Lett., 2007, 444, 76–79 CrossRef CAS.
- G. Miceli, C. S. Cucinotta, M. Bernasconi and M. Parrinello, J. Phys. Chem. C, 2012, 116, 2645 CrossRef CAS.
- D. H. Gregory, A. Bowman, C. F. Baker and D. P. Weston, J. Mater. Chem., 2000, 10, 1635–1641 RSC.
- K. Lee, S. W. Kim, Y. Toda, S. Matsuishi and H. Hosono, Nature, 2013, 494, 336–340 CrossRef CAS PubMed.
- G. J. Irvine, F. Demmel, H. Y. Playford, G. Carins, M. O. Jones and J. T. S. Irvine, Chem. Mater., 2022, 34, 9934–9944 CrossRef CAS.
- S. Hull, R. I. Smith, W. I. David, A. C. Hannon, J. Mayers and R. Cywinski, Phys. B, 1992, 180–181, 1000–1002 CrossRef.
- J. T. S. Irvine, D. C. Sinclair and A. R. West, Adv. Mater., 1990, 2, 132–138 CrossRef CAS.
- B. H. Toby, J. Appl. Crystallogr., 2001, 34, 210–213 CrossRef CAS.
- B. Wegner, R. Essmann, J. Bock, H. Jacobs and P. Fischer, Eur. J. Solid State Inorg. Chem., 1992, 29, 1217–1227 CAS.
- T. Sichla, F. Altorfer, D. Hohlwein, K. Reimann, M. Steube, J. Wrzesinski and H. Jacobs, Z. Anorg. Allg. Chem., 1997, 623, 414–422 CrossRef CAS.
- M. C. Verbraeken, E. Suard and J. T. Irvine, J. Solid State Chem., 2011, 184, 2088–2096 CrossRef CAS.
- F. Altorfer, W. Buhrer, B. Winkler, G. Coddens, R. Essmann and H. Jacobs, Solid State Ionics, 1994, 70–71, 272–277 CrossRef CAS.
- J. F. Brice, J. P. Motte, A. Courtois, J. Protas and J. Aubry, J. Solid State Chem., 1976, 17, 135–142 CrossRef CAS.
- M. C. Verbraeken, C. Cheung, E. Suard and J. T. S. Irvine, Nat. Mater., 2015, 14, 95–100 CrossRef CAS PubMed.
Footnote |
| † Electronic supplementary information (ESI) available. See DOI: https://doi.org/10.1039/d2fd00178k |
| This journal is © The Royal Society of Chemistry 2023 |

