Influence of perhalophenyl groups in the TADF mechanism of diphosphino gold(I) complexes†
Inés
Soldevilla
a,
Aimara
García-Camacho
a,
Rinat T.
Nasibullin
b,
M. Elena
Olmos
 a,
Miguel
Monge
 a,
Dage
Sundholm
 c,
Rashid R.
Valiev
d,
José M.
López-de-Luzuriaga
 *a and
María
Rodríguez-Castillo
 *a
*a
aDepartamento de Química, Centro de Investigación en Síntesis Química (CISQ), Universidad de la Rioja, Complejo Científico Tecnológico, 26004-Logroño, Spain. E-mail: josemaria.lopez@unirioja.es; maria.rodriguez@unirioja.es
bTomsk State University, 36, Lenin Avenue, 634050 Tomsk, Russia
cDepartment of Chemistry, Faculty of Science, University of Helsinki, P.O. Box 55, (A.I. Virtasen aukio 1), FIN-00014, Finland
dResearch School of Chemistry & Applied Biomedical Sciences, National Research Tomsk Polytechnic University, Lenin Avenue 30, Tomsk 634050, Russia
First published on 25th January 2022
Abstract
New perhalophenyl three-coordinated gold(I) complexes using the chelate ligand 1,2-bis(diphenylphosphino)benzene (dppBz) and [AuR(tht)] (R = C6F5 (1), o-C6BrF4 (2), p-C6BrF4 (3), o-C6F4I (4), p-C6F4I (5); tht = tetrahydrothiophene) have been prepared. The crystal structures of compounds 1 and 2 consist of distorted three-coordinated Au(I) complexes displaying different Au–P distances at the same gold atom. The complexes show intense photoluminescent emission in the solid state at room temperature (RT) and at 77 K. The study of the dependence of the emission lifetime with temperature suggests the existence of thermally activated delayed fluorescence (TADF) processes at RT. We have computed the rate constants for intersystem crossing and reverse intersystem crossing of the photophysical processes through first-principle calculations, supporting the experimental observations with very good agreement.
Introduction
During the last two decades light-emitting metal complexes have emerged as a research topic of great interest to obtain fundamental knowledge of new photophysical processes and to challenge practical applications that include electrochemical cells, cell-imaging, luminescent sensors or organic light-emitting diodes (OLEDs).1Particularly, the transfer of this research to OLED technology has received paramount attention due to its introduction in widespread and wearable technology. Nevertheless, efficient OLEDs must fulfill a series of criteria, among which the most important one from a photophysical point of view is the harvesting of most of the available excitons, giving rise to almost 100% quantum yields.2
From a photophysical point of view, a strategy that has allowed this efficiency to be achieved in recent years has been the synthesis of compounds with small energy gaps between the lowest singlet and triplet states and an efficient spin–orbit coupling (SOC), which favors fast intersystem crossing (ISC) from the excited singlet state (S1) to the lowest triplet state (T1).3 The subsequent population of the S1 state through reverse intersystem crossing (RISC) can be achieved in such systems thanks to thermal energies (Kb·T) as low as that associated with room temperature, which leads to a delayed long lived emission from this state that harvests the singlet and triplet excitons. This thermally activated delayed fluorescence (TADF) has also been called the singlet harvesting effect.4
Even so, the harvesting singlet and triplet excitons do not guarantee the effectiveness of a material to be used in OLED applications, since possible undesired reactions of the exited states, such as quenching or photobleaching,4a have to be avoided. Therefore, it is desirable to have a relatively short emission decay time. On the other side, a long-lived T1 state is an important prerequisite that enhances the TADF process by favouring T1 → S1 up-conversion, and thereby avoiding non-radiative decay processes. The molecular structure is also an important parameter because it must be designed in such a way that the molecule needs to possess spatially separated frontier orbitals giving rise to charge transfer excited states with weak exchange interactions and a small energy difference between S1 and T1 (ΔE(S1−T1)) of less than 1000 cm−1. The relativistic effects of heavy-metal containing complexes lead to strong spin–orbit coupling (SOC) and fast ISC,5 resulting in population of the T1 state, which fulfills the rest of the desired criteria. The small ΔE(S1 − T1) facilitates thermal activation and fast RISC from T1 to S1 rendering TADF feasible.
In these charge transfer processes, molecules in the excited state often suffer from significant structural reorganizations that may lead to non-radiative decays to the ground state with concomitant loss of efficiency. The use of sterically hindering or bulky ligands may avoid these structural changes of the excited states and, consequently, can reduce these undesired forms of quenching.
We recently reported a new class of TADF emitters consisting of perhalophenyl three-coordinate 1,2-bis(diphenylphosphino)benzene (dppBz) gold(I) complexes.6 Despite the rigorous TADF demands, a very simple design strategy gives rise to metal complexes with the desired properties.
In this work, we follow our previous strategy to design effective TADF emitters by investigating the role of monosubstituted-perfluorophenyl groups with Br or I in ortho and para positions. The Br and I atoms allow tuning of the charge transfer emissions by controlling the energy of the HOMO orbitals. In addition, bromine, and especially the heavier iodine, are expected to increase the SOC that favours the ISC process. The TADF mechanism is verified by calculating rate constants for nonradiative transitions (ISC and RISC) between the S1 and T1 states and comparing them to experimental data.
Results and discussion
Synthesis and characterization
New gold(I) complexes have been synthetized by reacting the gold(I) precursors [AuR(tht)] (R = C6F5 (1) o-C6BrF4 (2), p-C6BrF4 (3), o-C6F4I (4), p-C6F4I (5); tht = tetrahydrothiophene) with 1,2-bis(diphenylphosphino)benzene (dppBz) in a 1![[thin space (1/6-em)]](https://www.rsc.org/images/entities/char_2009.gif) :
:![[thin space (1/6-em)]](https://www.rsc.org/images/entities/char_2009.gif) 1 molar ratio and with dichloromethane as the solvent (Scheme 1). The mixtures were stirred for 30 minutes. Evaporation of the solvent under vacuum and the addition of n-hexane led to the precipitation of the new complexes [AuR(dppBz)] ((R = C6F5 (1) o-C6BrF4 (2), p-C6BrF4 (3), o-C6F4I (4), p-C6F4I (5)) as yellow solids. In the case of complexes 3 and 4, molecules of CH2Cl2 are detected as the crystallization solvent leading to stoichiometries of [Au(p-C6BrF4)(dppBz)]·0.5CH2Cl2 (3) and [Au(o-C6F4I)(dppBz)]·CH2Cl2 (4). The synthesis of [Au(C6F5)(dppBz)] (1) and its characterization has previously been reported;6 therefore, it is not described in detail here, but it is briefly discussed for comparative purposes, and its crystal structure is also included (vide infra). Spectroscopic and analytical data for complexes 2–5 agree with the proposed stoichiometries. The IR spectra for the four complexes show absorption bands due to the presence of the [AuI–R] fragments located at ν = 814, 1075, 1588, 1615 cm−1 (2); 801, 1097, 1570, 1585 cm−1 (3); 807, 1081, 1587, 1610 cm−1 (4); and 843, 1096, 1584, 1640 cm−1 (5). The absorption bands associated with the dppBz ligand are detected in the 543–479 cm−1 range (see the ESI†).
1 molar ratio and with dichloromethane as the solvent (Scheme 1). The mixtures were stirred for 30 minutes. Evaporation of the solvent under vacuum and the addition of n-hexane led to the precipitation of the new complexes [AuR(dppBz)] ((R = C6F5 (1) o-C6BrF4 (2), p-C6BrF4 (3), o-C6F4I (4), p-C6F4I (5)) as yellow solids. In the case of complexes 3 and 4, molecules of CH2Cl2 are detected as the crystallization solvent leading to stoichiometries of [Au(p-C6BrF4)(dppBz)]·0.5CH2Cl2 (3) and [Au(o-C6F4I)(dppBz)]·CH2Cl2 (4). The synthesis of [Au(C6F5)(dppBz)] (1) and its characterization has previously been reported;6 therefore, it is not described in detail here, but it is briefly discussed for comparative purposes, and its crystal structure is also included (vide infra). Spectroscopic and analytical data for complexes 2–5 agree with the proposed stoichiometries. The IR spectra for the four complexes show absorption bands due to the presence of the [AuI–R] fragments located at ν = 814, 1075, 1588, 1615 cm−1 (2); 801, 1097, 1570, 1585 cm−1 (3); 807, 1081, 1587, 1610 cm−1 (4); and 843, 1096, 1584, 1640 cm−1 (5). The absorption bands associated with the dppBz ligand are detected in the 543–479 cm−1 range (see the ESI†).
In the 1H NMR spectra of complexes 2–5, measured in toluene-d8, the aromatic protons of the dppBz ligand are observed in the 7.49–6.92 ppm range. A mixture of species is detected when 31P{1H} and 19F NMR spectra are collected in the same solvent.
In previous studies of solutions of diphosphino–gold(I) complexes, neutral three-coordinated gold(I) complexes [AuX(P–P)], (X = Cl, perhalophenyl group) were found to co-exist with the bis(chelating) cationic species [Au(P–P)2]+.6–8 In this work the neutral [AuR(dppBz)] and the ionic [Au(dppBz)2][AuR2] (R = o-C6BrF4 (2), p-C6BrF4 (3), o-C6F4I (4), p-C6F4I (5)) are confirmed through 19F NMR measurements. Thus, two groups of signals appear (see the ESI†), among which the most intense ones correspond to the neutral gold(I) complexes at −113.47 (m, 1F, F1), −127.27 (m, 1F, F4), −157.50 (m, 1F, F2), −158.58 (m, 1F, F3) ppm (2); −112.63 (m, 2F, F1), −135.13 (m, 2F, F2) ppm (3); −113.05 (m, 1F, F1), −113.92 (m, 1F, F4), −156.65 (m, 1F, F2), −158.53 (m, 1F, F3) ppm (4); −112.32 (m, 2F, F1), −122.79 (m, 2F, F2) ppm (5). Their 31P{1H} NMR spectra display broad signals at 14.56 (2), 15.69 (3), 13.71 (4) and 15.72 ppm (5), which agrees with a rapid fluxional oscillation of the perhalophenylgold(I) groups between the two P nuclei in solution, as previously reported by us.6
In order to verify the thermal stability of the complexes TGA spectra were collected in a 24–600 °C temperature range (see Fig. S17, ESI†). In all cases, the products show great thermal stability with decomposition temperatures of about 270 °C with a limit of 320 °C for complex 5. In the case of complexes 3 and 4 a small drop of weight of ca. 5 and 8%, respectively in the range of 76–93 °C is observed, which is assigned to a loss of CH2Cl2 molecules that crystalize with the complexes as it is also observed in the elemental analyses and in the 1H NMR spectrum (see the ESI†).
The determination of the crystal structures of compounds 1 and 2 (see below) shows the expected asymmetric coordination of the dppBz ligand in the solid state. The 31P{1H} NMR spectra of 2–5 also show the presence of a certain amount of the bis(chelating) cationic species [Au(dppBz)2]+ in solution since they all display a sharp singlet at about 21 ppm (see the ESI†).
Crystal structures
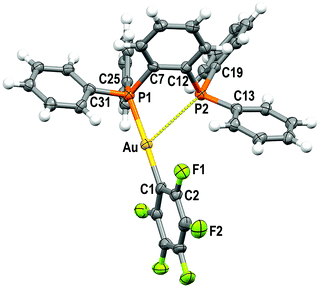
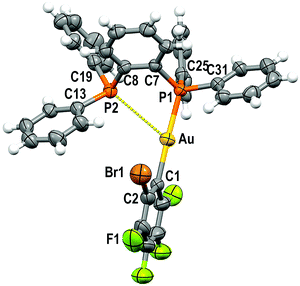
Single crystals of 1 and 2 were grown by slow evaporation of a saturated solution of these complexes in cyclohexane and used to determine the crystal structures of [Au(C6F5)(dppBz)] (1) (Fig. 1) and [Au(o-C6BrF4)(dppBz)] (2) (Fig. 2) through X-ray diffraction studies.Both complexes crystallize in the P![[1 with combining macron]](https://www.rsc.org/images/entities/char_0031_0304.gif) space group of the triclinic system, and their molecular structures consist of discrete [Au(R)(dppBz)] (R = C6F5 (1), o-C6BrF4 (2)) molecules. In each molecule, the gold centre is bonded to the Cipso atom of a perhalophenyl group [Au–C = 2.038(5) (1) and 2.084(6) Å (2)] and to a phosphorus atom of the dppBz ligand [Au–P = 2.2774(14) (1) and 2.2794(14) Å (2)], and maintains a weak Au⋯P contact with the second phosphorus of the diphosphine [Au–P = 3.3461(14) (1) and 3.4398(16) Å (2)]. Therefore, taking into account these dissimilar Au–P distances as well as the asymmetrical C–Au–P angles [175.42(17) and 117.28(16)° for (1) and 177.16(16) and 118.29(16)° for (2)], the environment of the gold(I) centres could be better described as distorted T-shaped more than as trigonal planar. Similar derivatives with C6Cl5 or C6Cl2F3 as aryl ligands at gold have been described as tricoordinated gold(I) complexes, in which the gold(I) centre is asymmetrically bonded to both phosphorus of the diphosphine ligand, although in those compounds this asymmetry was not so evident.6 Nevertheless, the narrow P–Au–P angle [65.36° in 1 and 64.29° in 2] is somehow imposed by the rigidity of the bidentate ligand, and in the previously reported complexes it is also too narrow [77.63(4)° in the dichlorotrifluorophenyl derivative and 79.53(8)° in the pentachlorophenyl one] for a trigonal planar geometry.6
space group of the triclinic system, and their molecular structures consist of discrete [Au(R)(dppBz)] (R = C6F5 (1), o-C6BrF4 (2)) molecules. In each molecule, the gold centre is bonded to the Cipso atom of a perhalophenyl group [Au–C = 2.038(5) (1) and 2.084(6) Å (2)] and to a phosphorus atom of the dppBz ligand [Au–P = 2.2774(14) (1) and 2.2794(14) Å (2)], and maintains a weak Au⋯P contact with the second phosphorus of the diphosphine [Au–P = 3.3461(14) (1) and 3.4398(16) Å (2)]. Therefore, taking into account these dissimilar Au–P distances as well as the asymmetrical C–Au–P angles [175.42(17) and 117.28(16)° for (1) and 177.16(16) and 118.29(16)° for (2)], the environment of the gold(I) centres could be better described as distorted T-shaped more than as trigonal planar. Similar derivatives with C6Cl5 or C6Cl2F3 as aryl ligands at gold have been described as tricoordinated gold(I) complexes, in which the gold(I) centre is asymmetrically bonded to both phosphorus of the diphosphine ligand, although in those compounds this asymmetry was not so evident.6 Nevertheless, the narrow P–Au–P angle [65.36° in 1 and 64.29° in 2] is somehow imposed by the rigidity of the bidentate ligand, and in the previously reported complexes it is also too narrow [77.63(4)° in the dichlorotrifluorophenyl derivative and 79.53(8)° in the pentachlorophenyl one] for a trigonal planar geometry.6
The coordination of the gold centre does not cause a significant distortion of the ligand, since the distance between the phosphorus atoms is 3.165 Å in the free dppBz molecule9 and 3.167 Å in complex 1, and only a slight lengthening to 3.197 Å is observed in 2.
Finally, the disposition of the aromatic rings in 1 and 2 does not allow any intramolecular π⋯π interaction, which differs from what is observed for [AuR(dppBz)] (R = C6Cl5, C6Cl2F3).6 However, growth promoted by C–H⋯F hydrogen bonds and F⋯F contacts of 2.8772(2) Å in 1 or by C–H⋯Br and C–H⋯F hydrogen bonds in 2 gives rise to polymers in the form of double chains (Fig. S30, S31 and Tables S2, S3, ESI†).
Photophysical properties at room temperature and at 77 K
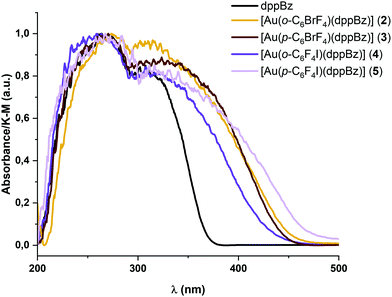
The absorption spectra in the solid state of complexes 2–5 are shown in Fig. 3. They exhibit intense and similar featureless absorption bands between 200 and 450 nm involving the absorption related to the metal precursors (see Table 1 and the ESI†) and the free dppBz ligand. The high-energy absorption bands between 200 and 380 nm could be assigned to the π → π*, or n → π* intra-ligand transitions of the diphosphine ligand; or transitions involving the perhalophenyl rings and the metal centre.6| Absorbancea (nm) | λ em (nm) RT/77 K | τ (μs) RT/77 K | Φ | k r (s−1) | k nr (s−1) | |
|---|---|---|---|---|---|---|
| a Diffuse reflectance solid state measurements. b Room temperature. | ||||||
| 1 | 288, 332 | 560/575 | 10.3/35.5 | 0.29 | 28.16 × 10³ | 68.93 × 10³ |
| 2 | 273, 314 | 566/590 | 22.6/70.9 | 0.13 | 5.70 × 10³ | 39.51 × 10³ |
| 3 | 267, 330 | 590/590 | 9.9/32.8 | 0.37 | 37.52 × 10³ | 63.34 × 10³ |
| 4 | 260, 321 | 616/616 | 9.6/37.4 | 0.04 | 4.36 × 10³ | 99.46 × 10³ |
| 5 | 271, 339 | 595/595 | 9.4/34.4 | 0.08 | 8.70 × 10³ | 97.42 × 10³ |
The band edges for the new diphosphine–gold complexes 2–5 appear at lower energies than those for the metal precursors and the free dppBz ligand, giving rise to new absorption regions between 380 and 450 nm, which may be related to charge transfer transitions involving the perhalophenylgold(I) fragments and the phosphine ligand. These absorption bands are directly related to the emissive properties of similar molecular systems bearing F and/or Cl substituted perhalophenyl ligands.6
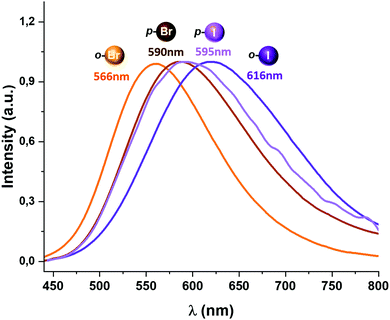
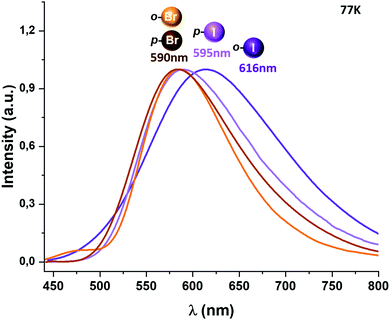
All complexes described in this study display luminescent emissions when they are irradiated with UV-vis light. An emission band at 566 (Φ = 0.13) (2), 590 (Φ = 0.37) (3), 616 (Φ = 0.04) (4) and 595 nm (Φ = 0.08) (5) is observed when the complexes are excited in the 350–420 nm range (Fig. 4).
Complexes 2 and 3, bearing bromine substituents in the perhalophenyl ligands, emit at a higher energy than complexes 4 and 5, containing the C6F4I group. Thus, it seems to be a connection between the nature of the halogen substituents in the perhalophenyl rings and the emission energies; when substituents in the perhalophenyl ligand are more electronegative, the photo-emissive charge transfer transition from the gold(I) centre to the dppBz ligand occurs at a higher energy. This agrees with the highest emission energy described for complex 1 (560 nm),6 confirming the following sequence for the emission energies according to the perhalophenyl group bonded to the gold(I) centre: C6F5 > C6BrF4 > C6F4I. In all cases, the emission lifetimes at room temperature are in the microsecond range with values of 10.3 (1),6 22.6 (2), 9.9 (3), 9.6 (4) and 9.4 μs (5) (see Table 1 and Fig. S40–S43, ESI†)
When the temperature is lowered to 77 K, the emission bands are red-shifted for complexes 1 and 2, leading to a new emission maximum at 575 and 590 nm, respectively, while for complexes 3–5 the emissions observed at 77 K remain at almost the same energy (Fig. 5 and the ESI†). A considerable increase in the emission lifetimes is observed at low temperature, reaching values of 35.5 (1),6 70.9 (2), 32.8 (3), 37.4 (4) and 34.4 μs (5).
The reported emission lifetimes for complexes 2–5 at RT and 77 K are of the same order to those previously reported for other diphosphine gold(I) complexes displaying a TADF behaviour at RT.6,10
Thermally activated delayed fluorescence studies
Due to the photo-emissive behaviour observed for complexes 2–5 and our previous results,6 we decided to study whether these complexes exhibit thermally activated delayed fluorescent emissions.To verify whether TADF takes place in complexes 2–5, their emission spectra and the emission lifetimes were collected in a temperature range from 77 to 338 K in steps of 20 K (Fig. 6–8). In all cases, the emission spectra show a gradual increase in the intensity as well as longer emission lifetimes as the temperature is lowered (Fig. 6 and Fig. S36–S39, ESI†). The emission decay was fitted at each temperature to an exponential function. The profiles obtained for the emission decay lifetimes as a function of the temperature indicate that there is a T1–S1 equilibrium implying that the emission decay time τav can be expressed using a Boltzmann-type equation:10,11
 | (1) |
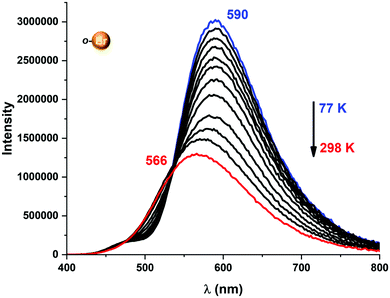 | ||
| Fig. 6 Temperature-dependent change in emission energies and intensities for complex 2 in the 77–298 K range. | ||
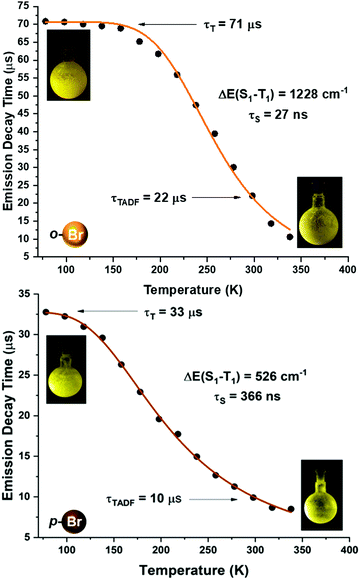 | ||
| Fig. 7 Emission decay times of [Au(o-C6BrF4)(dppBz)] (2) (top) and [Au(p-C6BrF4)(dppBz)] (3) (bottom) versus temperature. The solid lines represent a fit of eqn (1) to the experimental data. | ||
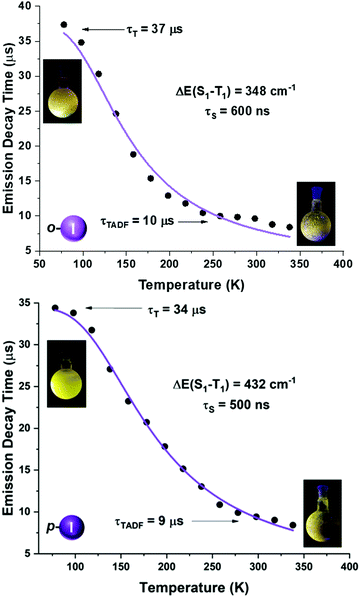 | ||
| Fig. 8 Emission decay times of [Au(o-C6F4I)(dppBz)] (4) (top) and [Au(p-C6F4I)(dppBz)] (5) (bottom) versus temperature. The solid lines represent a fit of eqn (1) to the experimental data. | ||
We tried to estimate ΔE(S1 − T1) experimentally from the difference in the peak emission wavelengths measured at 300 and 77 K, considering the almost TADF or the almost phosphorescence mechanisms, respectively.10 In fact, this is possible just for complexes 1 and 2, which are the only ones that display a significant red-shifted emission after cooling to 77 K, yielding values of 466 (1)6 and 719 cm−1 (2), that follow the same tendency as the fitted ones. In the case of complexes 3–5, they do not show instrumental detectable shifts when varying the temperature (Fig. 4 and 5). The accuracy of the obtained ΔE(S1 − T1) is very high when fitting eqn (1) to the measured decay times at different temperatures enabling determination of energy separations that are far below the attainable spectral resolution.12
A more detailed study of the temperature dependence of the decay time in complex [Au(o-C6BrF4)(dppBz)] (2) (Fig. 7) shows that between 77 K and about 160 K, the decay time is almost constant with τ ≈ 71 μs (plateau). Therefore, a T1 → S0 phosphorescence process is assigned to be responsible for the emission measured in this temperature range. However, a further temperature increase provokes a steep decrease in the decay time as a consequence of a growing involvement of the higher lying S1 singlet state in the electronic transition to the ground state S0. The S1 state is thermally activated from the lower lying T1 state. A similar assumption could be made for complex [Au(p-C6BrF4)(dppBz)] (3), but in this case, the TADF phenomenon appears at a lower temperature, since the plateau is reached between 77 and 100 K (Fig. 7). The same study has been carried out for complexes [Au(o-C6F4I)(dppBz)] (4) and [Au(p-C6F4I)(dppBz)] (5) (Fig. 8), which display smaller calculated ΔE(S1 − T1) values than complexes 1–3. Compound 5 displays a very similar behaviour compared to that of complex 3. From 77 K to about 100 K the decay time remains constant (plateau) with τT ≈ 34 μs. With further temperature increase the decay time decreases to τ(300K) ≈ 9 μs. Finally, according to the experimental data obtained for the emission decay times in the 77–338 K range and the fitting of eqn (1), complex 4 exhibits a very small ΔE(S1 − T1) value of 348 cm−1. Fig. 8 shows a representation of the emission decay times vs. temperature for 4 and 5. In the case of complex 4, the decay time does not become constant at low temperature and the corresponding plateau is not observed as for complexes 2, 3 and 5, suggesting that this behaviour would be reached at even lower temperatures. Nevertheless, this type of measurement at temperatures <77 K is challenging and we cannot currently perform them in our laboratory or in most other research laboratories preventing us for confirming this assumption. Our conclusion for complex 4 may not be definitive since Yersin et al.12 pointed out that decay-time data may be misinterpreted when ΔE(S1 − T1) is very small and the study is limited to temperatures between 300 and 77 K, especially when an evident plateau at low temperature is not clearly observed. Thus, the results showed and discussed in this paper are related to the data obtained in the temperature range of 77–338 K. The study of the emission decay lifetimes for complexes 2–5 and the fitting functions in this temperature range suggests that the room temperature emissions of the solid-state materials arise from thermally activated delayed fluorescence (TADF) processes. Nevertheless, one should remember that the emission at ambient temperature frequently does often not represent only TADF, but also contains some phosphorescence (T1 →S0) decay.
The TADF and the phosphorescent relative emission intensity contributions at a certain temperature can be estimated according to eqn (2)13 assuming that the population of S1 and T1 states follows a Boltzmann distribution:
 | (2) |
Eqn (2) can be simplified under the assumption of equal photoluminescence quantum yields for the phosphorescence and the TADF (Φ(S1) = Φ(T1)) processes4d,14
 | (3) |
 | (4) |
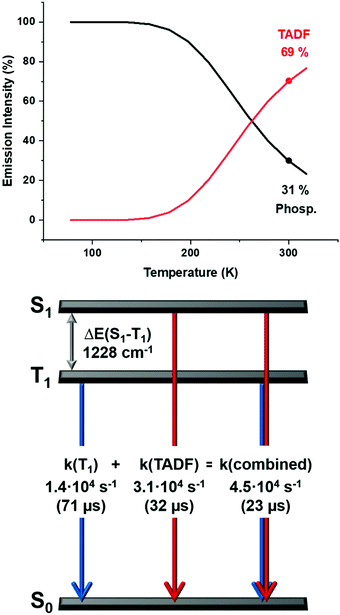 | ||
| Fig. 9 Top: The emission intensities for complex 2 stemming from the singlet state S1 (delayed fluorescence), and the triplet state T1 (phoshorescence) as a function of the temperature according to eqn (3) and (4); bottom: a schematic energy level diagram and decay times of complex 2 in powder. | ||
Therefore, even at room temperature, the contribution to the intensity from the T1 state remains for all the complexes, although with a smaller contribution. Due to the fast equilibrium between the S1 and T1 states only an averaged emission decay time from both decay paths, S1 → S0 and T1 → S0 can be measured.
Contributions from the TADF and phosphorescence decay paths at 300 K can also be estimated by comparing the rates of the individual processes using14–16
| k(combined) = k(TADF) + k(T1) | (5) |
Thus, at ambient temperature, the emission arises dominantly (≈70%) from the lowest excited singlet S1 state as TADF, which is assisted by phosphorescence (≈30%) from the triplet state T1 showing similar values for all the complexes (Fig. 9 and Fig. S46–S49, ESI†).
Computational studies
Density functional theory (DFT) and time-dependent DFT (TD-DFT) calculations were carried out to study the emissive properties of the complexes.17–20 We optimised the molecular structures of the isolated molecules of complexes 2–5 in the gas phase in the ground state (S0) as well as in the lowest triplet excited state (T1). The calculated model systems indicate important modifications in the coordination environment of the gold centres for the S0 and T1 states (Fig. 10 and Figs. S50, S51, Tables S4, S5, ESI†). In the excited state, the metal atoms are symmetrically coordinated to both phosphorus atoms with Au–P bond lengths in the range of 2.38–2.54 Å, which are in contrast to the distances of 2.31 and 3.08 Å obtained for the model systems in the ground state S0. The calculated distances for the S0 structures are very similar to those determined from the crystal data of complex 2 (2.28–3.44 Å) (Fig. 2).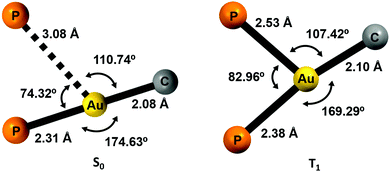 | ||
| Fig. 10 Computed coordination environment for the gold(I) center for complex 2 in the ground state S0 (left) and in the first triplet excited state T1 (right). | ||
The structural changes are also reflected in the P–Au–P and P–Au–C angles. In the T1 state, the coordination environment of the gold atom is close to a trigonal planar geometry, whereas in the S0 state, the geometry is better described as a distorted T-shaped disposition.
In order to confirm the charge-transfer nature responsible for the luminescent emissions observed for these complexes, we computed the frontier orbitals (HOMO and LUMO) as well as the excited-state transition densities for complexes 2–5. In all cases, the S1 state is formed from the S0 state by a formal electronic transition from the highest occupied molecular orbital (HOMO) to the lowest unoccupied molecular orbital (LUMO) with a weight of 0.7 (2), 0.71 (3), 0.73 (4), and 0.71 (5) (HOMO → LUMO). The HOMO is mainly located on Au–P with a small contribution of the perhalophenyl ring bonded to the gold(I) atom. The LUMO is located on the phenylene moiety of the dppBz ligand (Fig. 11 and Fig. S53–S55, ESI†). The calculated transition density suggests that two main parts of the molecule are involved in the electronic transfer. The electron density moves from the gold centre and the dppBz, mainly from the phosphorus further of the metal atom, (red area) to the dppBz ligand, mainly to the bridging phenyl group (green area). Nevertheless, there is also a minor contribution of the perhalophenyl group, specially from the Cipso of the ring, and for complexes 2 and 4 also the halogen in the ortho position, Br (2) or I (4), are involved in this electronic density migration as seen in Fig. 12.
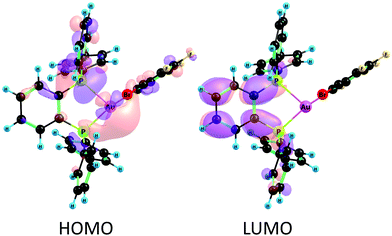 | ||
| Fig. 11 Frontier molecular orbitals HOMO and LUMO calculated at the CASSCF level of theory for complex 2. | ||
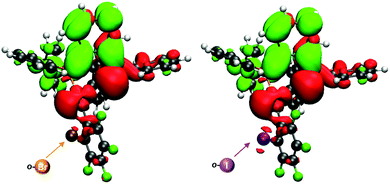 | ||
| Fig. 12 Transition densities for 2 (left) and 4 (right). The electron density is transferred from the red areas to the green ones. | ||
The energy difference between the lowest singlet state (S1) and (T1) (ΔE(S1 − T1) in cm−1) were calculated at the DFT/TD-DFT level using the molecular structure of the T1 state. Spin–orbit coupling (SOC) matrix elements (〈S1|HSO|T1〉 in cm−1), rate constants for intersystem crossing (kISC(S1 → T1)) and the rate constants for reversed intersystem crossing (kRISC(T1 → S1)) were also calculated.21–23 We also carried out calculations of 〈S1|HSO|T1〉 and ΔE(S1 − T1) at the multireference ab initio level of theory using the XMC-QDPT2/CASSCF(4,4)/def2-TZVP method.24–27
The molecular structures optimized at the DFT level were used in the ab initio calculations. The calculated rate constants and energy differences are compared to the experimental data in Table 2.
| Complex | ΔE(S1−T1) (cm−1) (eV) | SOCa (cm−1) | k ISC (s−1) (S1 → T1) | k RISC (s−1) (T1 → S1) | |
|---|---|---|---|---|---|
| a Spin–orbit coupling matrix element (〈S1|HSO|T1〉 in cm−1). b ΔE(S1−T1) calculated at the XMC-QDPT2 level and expressed in cm−1. c 〈S1|HSO|T1〉 calculated at the CASSCF(4,4) level using excitation energies calculated at the XMC-QDPT2 level. | |||||
| 2 | Calc. value | (1572) 1.95 × 10⁻¹ | 6.6 | 1 × 10¹⁰ | 6 × 10⁶ |
| Exp. value | (1228) 1.52 × 10⁻¹ | 2 × 10¹⁰ | 5 × 10⁷ | ||
| 3 | Calc. value | (736) 9.12 × 10⁻² | 5.9 | 2 × 10¹⁰ | 7 × 10⁸ |
| Exp. value | (526) 6.52 × 10⁻² | 3 × 10¹⁰ | 2 × 10⁹ | ||
| 4 | Calc. value | (1614) 2.00 × 10⁻¹ | 7.1 | 1 × 10¹⁰ | 6 × 10⁶ |
| 1000b | 1.5c | ||||
| Exp. value | (348) 4.31 × 10⁻² | 5 × 10¹⁰ | 9 × 10⁹ | ||
| 5 | Calc. value | (769) 9.53 × 10⁻² | 5.9 | 2 × 10¹⁰ | 6 × 10⁸ |
| Exp. value | (432) 5.36 × 10⁻² | 3 × 10¹⁰ | 4 × 10⁹ | ||
The calculations of ΔE(S1 − T1) for complexes 2–5 in the gas phase yielded different values depending on the position of the Br or I substituent. For ortho-substituted Br (2) and I (4), we obtained ΔE(S1 − T1) values of 1572 and 1614 cm−1, respectively. For para-substituted Br (3) and I (5) complexes, we obtained ΔE(S1 − T1) values of 736 and 769 cm−1, respectively. TADF occurs when the ΔE(S1 − T1) energy gap is about 1000 cm−1,28–31 suggesting that TADF may occur. The calculations yielded rate constants for RISC (kRISC(T1 → S1)) of 6 × 10⁶ s−1 (2) and (4) and of 7 × 10⁸ s−1 (3) and 6 × 10⁸ s−1 (5). The computed SOC matrix elements of 6.6 (2), 5.9 (3), 7.1 (4) and 5.9 cm−1 (5) show that the presence of bromine (2) or iodine (4) in the ortho-position of the perhalophenyl ligand bonded to gold(I) leads to larger values.
The SOC matrix element calculated at the CASSCF level agrees well with the one calculated using TD-DFT, suggesting that TD-DFT can be employed in SOC calculations on this class of molecules.
Our previous study on complex 1 showed that the calculated de-excitation energies of the S1 and T1 states are underestimated,6 since the molecular structure of an isolated molecule can freely relax, while in the solid state the crystal packing prevents large structural changes. The calculated kRISC(T1 → S1), kISC(S1 → T1) and kISC(T1 → S0) rate constants are accurate when the experimental de-excitation energies of the T1 and S1 states are combined with the calculated SOC matrix elements. The SOC matrix element between the T1 and S0 states (〈T1|HSO|S0〉) cannot presently be calculated at the TD-DFT level. We therefore calculated 〈T1|HSO|S0〉 for complexes 2–5 at the XMC-QDPT2/CASSCF(4,4)/def2-TZVP level. The calculated 〈T1|HSO|S0〉 values of 46.8 (2), 59.5 (3), 56.5 (4), and 60.2 cm−1 (5) lead to kISC(T1 → S0) rate constants of 1 × 10⁴ (2), 4 × 10⁵ (3), 1 × 10⁴ (4), and 3 × 10⁵ s−1 (5) when using the calculated excitation energy of the T1 state. Since the calculated de-excitation energy is underestimated, the ISC process from the T1 to the S0 state is even slower.
Experimental
General considerations
The starting materials [AuR(tht)] (R = C6F5, o-C6BrF4, p-C6BrF4, o-C6F4I, p-C6F4I) were prepared according to known literature procedures (see the ESI† for details).32 The ligand 1,2-bis(diphenylphosphino)benzene was obtained from Sigma-Aldrich and used as received. All solvents used for the synthesis of the new compounds were obtained from commercial sources and were used without further purification.Instrumentation
Infrared spectra were recorded in the 2000–500 cm−1 range using a PerkinElmer FT-IR Spectrum Two with an ATR accessory. Simultaneous thermogravimetric and differential thermal analysis (TG_DTA) data were obtained using a Setaram TG-DTA 92-16.18 thermal analyzer. The sample was placed in an open platinum crucible and heated, under nitrogen flow N2, from room temperature to 600 °C at a heating rate of 10 °C min−1; an empty crucible was used as the reference. The ESI-MS spectra were obtained using a Bruker MicroTOF-Q spectrometer with an ESI ionization source. The 31P{1H}, 19F and 1H NMR experiments were recorded with a Bruker ARX 300 in toluene-d8. Chemical shifts are quoted relative to H3PO4 (31P, external), CFCl3 (19F, external) and SiMe4 (1H, external). Diffuse reflectance UV-vis spectra of pressed powder samples diluted with KBr were recorded using a Shimadzu UV-3600 spectrophotometer (with a Harrick Praying Mantis accessory) and recalculated following the Kubelka–Munk function. Excitation and emission spectra in the solid state as well as lifetime measurements were recorded using an Edinburgh FLS 1000 fluorescence spectrometer. Quantum yields were measured in the solid state using a Hamamatsu Quantaurus-QY C11347-11 integrating sphere with excitation at 400 nm (2, 3) and 375 nm (4, 5).Synthesis and characterization
Complexes [AuR(dppBz)] (R = o-C6BrF4 (2), p-C6BrF4 (3), o-C6F4I (4), and p-C6F4I (5)): to a dichloromethane solution (20 mL) of [Au(o-C6BrF4)(tht)] (0.200 g, 0.390 mmol) (2), [Au(p-C6BrF4)(tht)] (0.200 g, 0.390 mmol) (3), [Au(o-C6F4I)(tht)] (0.200 g, 0.357 mmol) (4) or [Au(p-C6F4I)(tht)] (0.200 g, 0.357 mmol) (5) was added 1,2-bis(diphenylphosphino)benzene (dppBz) (0.174 g, 0.390 mmol (2, 3) or (0.159 g, 0.357 mmol (4, 5) in a 1![[thin space (1/6-em)]](https://www.rsc.org/images/entities/char_2009.gif) :
:![[thin space (1/6-em)]](https://www.rsc.org/images/entities/char_2009.gif) 1 molar ratio. After 30 min of stirring at room temperature, the solvent was evaporated under vacuum to ca. 5 mL. Finally, the addition of n-hexane (15 mL) led to precipitation of products 2 (0.258 g, 0.296 mmol), 3 (0.234 g, 0.256 mmol), 4 (0.281 g, 0.274 mmol) and 5 (0.263 g, 0.286 mmol) all of them as yellow solids. Yield: 69% (2), 66% (3), 77% (4) and 80% (5).
1 molar ratio. After 30 min of stirring at room temperature, the solvent was evaporated under vacuum to ca. 5 mL. Finally, the addition of n-hexane (15 mL) led to precipitation of products 2 (0.258 g, 0.296 mmol), 3 (0.234 g, 0.256 mmol), 4 (0.281 g, 0.274 mmol) and 5 (0.263 g, 0.286 mmol) all of them as yellow solids. Yield: 69% (2), 66% (3), 77% (4) and 80% (5).
Computational details
The molecular structures of the lowest excited triplet state (T1) and the ground state (S0) were optimized at the density functional theory (DFT) level using the B3LYP functional and def2-TZVP basis sets.17–20,26 The 60 core electrons of Au were replaced with an effective core potential (ECP).33 The spin–orbit coupling (SOC) matrix elements 〈S1|HSO|T1〉 between the first excited singlet state (S1) and the lowest triplet state (T1) as well as between T1 and the ground state (S0) were calculated at the complete-active-space self-consistent-field (CASSCF) level using the GAMESS-US program for all compounds.34,35 Excitation energies were calculated at the extended multiconfiguration quasi-degenerate perturbation theory at the second order (XMC-QDPT2) level.24 The XMC-QDPT2 calculations and the geometry optimization were performed using Firefly software.27 The state-averaged CASSCF wave function was constructed from the four lowest electronic states obtained in a CASSCF(4,4) calculation using an active space that consisted of four electrons in four molecular orbitals (MOs). The excitation energies were calculated at the TD-DFT level of theory.20 The SOC calculation was carried out using the one-electronic Pauli–Breit operator and with the effective nuclear charge for each atom using the MOLSOC program.21,22 We used an external script to FIREFLY as a new interface of the MOLSOC program. The kISC and kRISC rate constants were calculated using the method described in ref. 19.Crystallography
The crystals were mounted in inert oil on a MiteGen MicroMount and transferred to the cold nitrogen stream of a Bruker APEX-II CCD diffractometer, equipped with an Oxford Instruments low-temperature controller system (Mo Kα = 0.71073 Å, graphite monochromator). Data were collected in ω- and φ-scan modes. Absorption effects were treated by semiempirical corrections based on multiple scans. The structure was solved with the XT structure solution program using intrinsic phasing and refined on F02 with SHELXL-97.36 All non-hydrogen atoms were treated anisotropically, and all hydrogen atoms were included as riding bodies. CCDC 2083326 & 2083327 contain the supplementary crystallographic data for this paper.†Conclusions
The new diphosphine perhalophenyl gold(I) complexes reported in this work constitute a purposefully designed set of compounds for studies of the TADF phenomenon. A detailed photophysical study of these complexes revealed that the observed emission at room temperature (RT) stems from combined TADF (∼70%) and phosphorescence (∼30%). The luminescent emissions in the solid state at RT can be tuned by changing the electronegativity of the halogen atoms in the perhalophenyl rings, leading to a red-shifted emission when less electronegative substituents, such as iodine, are used. The difference in the emission energies is more evident for the ortho substituted derivatives (2 and 4). The excited-state transition densities computed for complexes 2–5 show that there is a small contribution from the ortho-substituted halide in complexes 2 (Br) and 4 (I), but none for the para-substituted halide in complexes 3 and 5. This agrees with the fact that an ortho substituted perfluorophenyl ligand puts the halide in closer proximity to the gold centre than the para-substituted analogue, leading to a more pronounced influence in the energy of the HOMO. Both, the ortho and the para-substituted perfluorophenyl ligands are significantly separated from the position of the LUMO. Thus, the electronegativity of the halide is probably stabilizing the HOMO of the ortho substituted ligands, by providing an electronegative atom in the proximity of the corresponding electron density. Therefore, a correlation between the electronegativity and stabilization of the HOMO is expected, which is also observed experimentally. Indeed, first-principles computational analysis allows studies of the additional heavy-atom SOC contribution provided by the Br or I atoms in the perhalophenyl group. The strong SOC effect is also induced by gold(I) atoms. The presence of Br and I in the ortho-position of the perhalophenyl ligands gives rise to an increase in the SOC by a factor of 2. The small ΔE(S1 − T1) value obtained for the studied complexes together with the large kRISC(T1 → S1) and the small kISC(T1 → S0) rate constants computed at the XMC-QDPT2/CASSCF level of theory fully agree with the experimentally obtained results that the TADF process dominates over phosphorescence at RT. In summary, this and future ligand variations will allow tuning of the TADF emissive properties of gold(I) complexes covering the entire range of the visible spectrum.Author contributions
All the authors contributed to the paper in a similar manner.Conflicts of interest
There are no conflicts to declare.Acknowledgements
We thank the Grant PID2019-104379RB-C22 funded by MCIN/AEI/10.13039/501100011033 and by “ERDF A way of making Europe”. Inés Soldevilla thanks the University of La Rioja for a FPI grant. The Academy of Finland supported this work through projects 314821 and 325369. CSC, the Finnish IT Centre for Science and the Finnish Grid and Cloud Infrastructure (persistent identifier urn:nbn:fi:research-infras-2016072533) are acknowledged for computer time. Rashid Valiev thanks the Ministry of Education and Science of the Russian Federation Program No. 075-03-2021-287/6.References
- (a) C. Bizzarri, E. Spuling, D. M. Knoll and S. Bräse, Coord. Chem. Rev., 2018, 373, 49–82 CrossRef CAS; (b) M. P. Coogan and V. Fernández-Moreira, Chem. Commun., 2014, 50, 384–399 RSC; (c) E. Baggaley, J. A. Weinstein and J. A. G. Williams, Coord. Chem. Rev., 2012, 256, 1762–1785 CrossRef CAS; (d) D.-L. Ma, H.-Z. He, K.-H. Leung, D. S.-H. Chan and C.-H. Leung, Angew. Chem., Int. Ed., 2013, 52, 7666–7682 CrossRef CAS PubMed; (e) R. D. Costa, E. Ortí, H. J. Bolink, F. Monti, G. Accorsi, N. Armaroli, R. Li, F.-F. Xu, Z.-L. Gong and Y.-W. Zhong, Inorg. Chem. Front., 2020, 7, 3258–3281 RSC.
- (a) Highly efficient OLEDs with phosphorescent materials, ed. H. Yersin, Wiley-VCH, Weinheim, 2008; Search PubMed; (b) A. Zampetti, A. Minotto and F. Cacialli, Adv. Funct. Mater., 2019, 29, 1807623 CrossRef; (c) Q.-C. Zhang, H. Xiao, X. Zhang, L.-J. Xu and Z.-N. Chen, Coord. Chem. Rev., 2019, 378, 121–133 CrossRef CAS.
- Highly efficient OLEDs: materials based on thermally activated delayed fluorescence, ed. H. Yersin, Wiley-VCH, Weinheim, 2019 Search PubMed.
- (a) H. Yersin, A. F. Rausch, R. Czerwieniec, T. Hofbeck and T. Fischer, Coord. Chem. Rev., 2011, 255, 2622–2652 CrossRef CAS; (b) L. Bergmann, D. M. Zink, S. Bräse, T. Baumann and D. Volz, Top. Curr. Chem., 2016, 374, 22 CrossRef PubMed; (c) D. Volz, Y. Chen, M. Wallesch, R. Liu, C. Fléchon, D. M. Zink, J. Friedichs, H. Flügge, R. Steininger, J. Göttlicher, C. Heske, L. Weinhardt, S. Bräse, F. So and T. Baumann, Adv. Mater., 2015, 27, 2538–2543 CrossRef CAS PubMed; (d) T. Hofbeck, U. Monkowius and H. Yersin, J. Am. Chem. Soc., 2015, 137, 399–404 CrossRef CAS PubMed; (e) M. J. Leiti, V. A. Krylova, P. I. Djurovich, M. E. Thompson and H. Yersin, J. Am. Chem. Soc., 2014, 136, 16032–16038 CrossRef PubMed.
- (a) H. V. R. Dias, H.-J. Kim, H.-L. Lu, K. Rajeshwar, N. R. de Tacconi, A. Derecskei-Kovacs and D. S. Marynick, Organometallics, 1996, 15, 2994–3003 CrossRef CAS; (b) H. V. R. Dias, H.-L. Lu, H.-J. Kim, S. A. Polach, T. K. H. H. Goh, R. G. Browning and C. J. Lovely, Organometallics, 2002, 21, 1466–1473 CrossRef CAS.
- J. M. López-de-Luzuriaga, M. Monge, M. E. Olmos, M. Rodríguez-Castillo, I. Soldevilla, D. Sundholm and R. R. Valiev, Inorg. Chem., 2020, 59, 14236–14244 CrossRef PubMed.
- J. M. López-de-Luzuriaga, M. Monge, M. E. Olmos, M. Rodríguez-Castillo and I. Soldevilla, J. Organomet. Chem., 2020, 913, 121198 CrossRef.
- A. Pintado-Alba, H. de la Riva, M. Nieuwhuyzen, D. Bautista, P. R. Raithby, H. A. Sparkes, S. J. Teat, J. M. López-de-Luzuriaga and M. C. Lagunas, Dalton Trans., 2004, 3459–3467 RSC.
- W. Levason, G. Reid and M. Webster, Acta Crystallogr., Sect. C: Cryst. Struct. Commun., 2006, 62, o438–o440 CrossRef PubMed.
- M. Osawa, M. A. Aino, T. Nagakura, M. Hoshino, Y. Tanaka and M. Akita, Dalton Trans., 2018, 47, 8229–8239 RSC.
- R. Czerwieniec and H. Yersin, Inorg. Chem., 2015, 54, 4322–4327 CrossRef CAS PubMed.
- H. Yersin, R. Czerwieniec, M. Z. Shafikov and A. F. Suleymanova, ChemPhysChem, 2017, 18, 3508–3535 CrossRef CAS PubMed.
- M. J. Leitl, F.-R. Küchle, H. A. Mayer, L. Wesemann and H. Yersin, J. Phys. Chem. A, 2013, 117, 11823–11836 CrossRef CAS PubMed.
- A. Schinabeck, N. Rau, M. Klein, J. Sundermeyer and H. Yersin, Dalton Trans., 2018, 47, 17067–17076 RSC.
- J. Toigo, G. Farias, C. A. M. Salla, L. G. T. A. Duarte, A. J. Bortoluzzi, T. D. Z. Atvars, B. de Souza and I. H. Bechtold, Eur. J. Inorg. Chem., 2021, 3177–3184 CrossRef CAS.
- A. Y. Baranov, A. S. Berezin, D. G. Samsonenko, A. S. Mazur, P. M. Tolstoy, V. F. Plyusnin, I. E. Kolesnikov and A. V. Artem’ev, Dalton Trans., 2020, 49, 3155–3163 RSC.
- A. D. Becke, Phys. Rev. A: At., Mol., Opt. Phys., 1988, 38, 3098–3100 CrossRef CAS PubMed.
- A. D. Becke, J. Chem. Phys., 1993, 98, 5648–5652 CrossRef CAS.
- C. Lee, W. Yang and R. G. Parr, Phys. Rev. B: Condens. Matter Mater. Phys., 1988, 37, 785–789 CrossRef CAS PubMed.
- M. E. Casida and M. Huix-Rotllant, Annu. Rev. Phys. Chem., 2012, 63, 287–323 CrossRef CAS PubMed.
- X. Gao, S. Bai, D. Fazzi, T. Niehaus, M. Barbatti and W. Thiel, J. Chem. Theory Comput., 2017, 13, 515–524 CrossRef CAS PubMed.
- S. G. Chiodo and M. Leopoldini, Comput. Phys. Commun., 2014, 185, 676–683 CrossRef CAS.
- R. R. Valiev, V. N. Cherepanov, G. V. Baryshnikov and D. Sundholm, Phys. Chem. Chem. Phys., 2018, 20, 6121–6133 RSC.
- A. A. Granovsky, J. Chem. Phys., 2011, 134, 214113 CrossRef PubMed.
- P. Siegbahn, A. Heiberg, B. Roos and B. Levy, Phys. Scr., 1980, 21, 323–327 CrossRef CAS.
- F. Weigend and R. Ahlrichs, Phys. Chem. Chem. Phys., 2005, 7, 3297–3305 RSC.
- A. A. Granovsky. A. V. Bochenkova and J. W. Kress, Firely software: Version 8.2.0, Moscow State University, Chemistry Department, 2016 Search PubMed.
- C. J. Chiang, A. Kimyonok, M. K. Etherington, G. C. Griffiths, V. Jankus, F. Turksoy and A. P. Monkman, Adv. Funct. Mater., 2013, 23, 739–746 CrossRef CAS.
- T. J. Penfold, F. B. Dias and A. P. Monkman, Chem. Commun., 2018, 54, 3926–3935 RSC.
- R. M. Gadirov, R. R. Valiev, L. G. Samsonova, K. M. Degtyarenko, N. V. Izmailova, A. V. Odod, S. S. Krasnikova, I. K. Yakushchenko and T. N. Kopylova, Chem. Phys. Lett., 2019, 717, 53–58 CrossRef CAS.
- R. R. Valiev, B. F. Minaev, R. M. Gadirov, E. N. Nikonova, T. A. Solodova, S. Y. Nikonov, M. B. Bushuev and T. N. Kopylova, Russ. Phys. J., 2016, 58, 1205–1211 CrossRef CAS.
- R. Uson, A. Laguna and J. Vicente, J. Organomet. Chem., 1977, 131, 471–475 CrossRef CAS.
- D. Andrae, U. Haeussermann, M. Dolg, H. Stoll and H. Preuss, Theor. Chim. Acta, 1990, 77, 123–141 CrossRef CAS.
- M. W. Schmidt, K. K. Baldridge, J. A. Boatz, S. T. Elbert, M. S. Gordon, J. H. Jensen, S. Koseki, N. Matsunaga, K. A. Nguyen, S. Su, T. L. Windus, M. Dupuis and J. A. Montgomery, J. Comput. Chem., 1993, 14, 1347–1363 CrossRef CAS.
- M. S. Gordon and M. W. Schmidt, Advances in electronic structure theory: GAMESS a decade later, in Theory and Applications of Computational Chemistry: the first forty years ed. C. E. Dykstra, G. Frenking, K. S. Kim and G. E. Scuseria, Elsevier, Amsterdam, 2005, pp. 1167–1189 Search PubMed.
- G. M. Sheldrick SHELXL-97, Program for Crystal Structure Refinement, University of Göttingen, Göttingen, Germany, 1997 Search PubMed.
Footnote |
| † Electronic supplementary information (ESI) available: Characterization, photophysical and computational data. CCDC 2083326 and 2083327. For ESI and crystallographic data in CIF or other electronic format see DOI: 10.1039/d1tc04905d |
| This journal is © The Royal Society of Chemistry 2022 |


