 Open Access Article
Preparation of sodium silicate/red mud-based ZSM-5 with glucose as a second template for catalytic cracking of waste plastics into useful chemicals†
Xiaofeng Wanga,
Fuwei Lia,
Asad Ali a,
Hengshuo Gua,
Hongbing Fua,
Zhixia Li
 *a and
Hongfei Linb
aSchool of Chemistry and Chemical Engineering, Guangxi University, Nanning, 530004, People's Republic of China. E-mail: zhixiali@gxu.edu.cn; Tel: +86-771-3233718
bGuangxi Bossco Environmental Protection Technology Co., Ltd, Nanning, 530007, People's Republic of China
First published on 10th August 2022
Abstract
ZSM-5 was economically synthesized with red mud (RM) and industrial sodium silicate (ISS) in a tetrapropylammonium bromide (TPABr)–glucose dual-template system. The roles of glucose, Fe and Ca in RM on the formation of ZSM-5 were investigated. The catalytic performances of the resultant ZSM-5 were tested by cracking waste plastics. It was found that the formation of ZSM-5 was attributed to a synergistic effect between TPABr and glucose. The addition of glucose decreased the pH value in the crystallization solution and thus promoted the crystallization effect. Glucose acted as a hard template to generate mesopores. Fe atoms were partly distributed in the framework and partly adsorbed in the pores of ZSM-5, and helped to generate more Lewis acid sites. Ca atoms were mainly adsorbed in the pores of ZSM-5, and showed an inhibitory effect on the formation of zeolites. The synthesized ZSM-5 showed a weakly acidic and mesoporous structure and achieved an enhanced effect on producing gaseous products (gas yield: 85.3%), especially light olefins (C![[double bond, length as m-dash]](https://www.rsc.org/images/entities/char_e001.gif) 2–4) (selectivity: 77.1%) from cracking of low density polyethylene at 500 °C. The long-term cracking experiment showed that the synthesized ZSM-5 is superior in converting waste plastics to light olefins (ethylene and propene) than the commercial ZSM-5.
2–4) (selectivity: 77.1%) from cracking of low density polyethylene at 500 °C. The long-term cracking experiment showed that the synthesized ZSM-5 is superior in converting waste plastics to light olefins (ethylene and propene) than the commercial ZSM-5.
1. Introduction
Global plastic production has been increasing annually due to population expansion and industrial development, and has reached 400 million tonnes in 2020. About 50% of plastics are intended to be used only once and are known as single-use plastics (SUPs).1 Due to the non-biodegradability, most SUP waste such as packaging bags and water bottles are disposed of in landfills2 or incinerated.3 However, landfilling occupies a lot of land and space, while burning waste releases many pollutants that affect people living near these incinerators. Furthermore, these methods lead to the loss of valuable resources. Recent research shows that the thermal cracking technique is a promising method to effectively reuse and recycle plastic waste since it can transfer plastics into valuable products such as fuels and chemicals while minimizing the volume of plastic waste and decreasing CO2 emission.4 Moreover, the product selectivity can be further improved by using a catalyst in the thermal cracking process.5ZSM-5 is the most widely used catalyst in the catalytic cracking process because of its unique shape-selective catalytic ability and better hydrothermal stability. ZSM-5 is commonly manufactured with pure raw materials, e.g. sodium aluminate, aluminium oxide and aluminium nitrate as the aluminium sources, and silica sol, ethyl orthosilicate and sodium silicate as the silicon sources.6 Moreover, the extensive use of organic structure directing agent lead to the rise in the production cost. New synthetic routes of ZSM-5 have been developed using cheaper raw materials such as kaolin,7 coal gangue,8 diatomite,9 red mud10 and slag11 and inexpensive structure directing agents (e.g. activated carbon, glucose, cellulose etc.) to reduce the production cost.
Red mud (RM) is a solid waste produced from the alumina refining of bauxite ore. The annual worldwide output of RM has been estimated to reach more than 120 million tons.12 The major issues with the disposal of RM are the high alkalinity (with pH of 10–13) and its very fine grain size (<10 μm). RM particles are too fine and easily fly away with the slight breeze, and thus easily cause air pollution. Some of the soluble compounds in RM, such as sodium hydroxide, iron and aluminium hydroxide can dissolve with rainwater and pollute the land and rivers. RM accumulation has threatened the ecological environment and people's health. Numerous attempts have been tried to find a suitable application for RM. For instance, many techniques including acid leaching, solid-state carbo-thermic reduction, magnetic and fluidized bed separation, alkali fusion–acid leaching process have been applied to recover valuable elements such as Fe, Ti and Al from RM.13 However, these processes involve secondary environmental pollution or high energy consumption, consequently restricting their large-scale industrialization application. Other techniques have been developed to utilize RM as construction materials, adsorbent materials,14 catalysts and coagulants.15 This expanded to some extent the utilization of RM. The high content of aluminium in RM suggests that RM is a potential aluminium resource for synthesizing zeolite molecular sieves. The presence of Fe, Ca and Ti in RM could help to generate new acidic or basic active sites in the RM-based zeolites.
Notably, the alkali fusion method can destroy the complex structure of coal fly ash (CFA) and activate CFA, and eventually improve the leaching efficiency of rare earth elements in CFA.16 Alkali fusion is also considered to be the most effective for RM because the excess alkali in RM don't need to be removed out and can be directly used, and the metal components in RM e.g. Fe, Ca and Ti can be conserved, as well as secondary sewage discharge can be avoided.
In the present study, ZSM-5 was economically synthesized with alkali-fused RM and cheap industrial sodium silicate. The inexpensive glucose was used as a mesopore template instead of organic ammonium. The roles of glucose as template on the crystallization reaction and acidity as well as the pore structure of zeolites were investigated via experimental analysis. The effects of Fe and Ca in RM on the structure and acidity of the resultant ZSM-5 were analyzed with the help of density functional theory (DFT) calculation. The catalytic performance was investigated by catalytic cracking of low-density polyethylene (LDPE) and waste plastics. We aim to develop a cost-effective synthesis method of ZSM-5 to promote the utilization of solid wastes e.g. RM and waste plastics.
2. Materials and methods
2.1. Reactants and materials
RM was obtained from Guangxi Tiandong Jinjiang Group. It was dried and ground to less than 100 mesh. Industrial sodium silicate (ISS) was supplied by Guangxi Nanning Chunxu Chemical Company (100 g contains 0.4266 mol SiO2, 0.2922 mol NaOH, 37.3 wt% solid content, modulus at 2.92). Anhydrous glucose (Sinopharm Chemical Reagent Company), iron oxide and calcium oxide (Sinopharm), sodium hydroxide (Guangdong Guanghua Technology Company), and tetrapropylammonium bromide (TPABr, Damas-beta Company) were used as received. Commercial ZSM-5 (Commer-ZSM) with a SiO2/Al2O3 ratio of 27, was supplied from Nankai University Catalyst Factory. LDPE beads with particle size about 2 mm was provided by Shenhua Group. The waste plastic sample was made as follows: the used LDPE food packing bags were cleaned, dried and softened at 180 °C for 5 min, and then cut into 2 mm3 cubes.2.2. Synthesis of zeolites with RM
RM was firstly activated by an alkali fusion method: RM and sodium hydroxide at a mass ratio of 1![[thin space (1/6-em)]](https://www.rsc.org/images/entities/char_2009.gif) :
:![[thin space (1/6-em)]](https://www.rsc.org/images/entities/char_2009.gif) 1 were evenly mixed, then calcined at 550 °C for 5 h. The resultant solid sample was ground into less than 100 mesh after cooling, denoted as AF-RM. According to the results of our recent study,17 ZSM-5 was synthesized at a molar ratio of SiO2
1 were evenly mixed, then calcined at 550 °C for 5 h. The resultant solid sample was ground into less than 100 mesh after cooling, denoted as AF-RM. According to the results of our recent study,17 ZSM-5 was synthesized at a molar ratio of SiO2![[thin space (1/6-em)]](https://www.rsc.org/images/entities/char_2009.gif) :
:![[thin space (1/6-em)]](https://www.rsc.org/images/entities/char_2009.gif) H2O
H2O![[thin space (1/6-em)]](https://www.rsc.org/images/entities/char_2009.gif) :
:![[thin space (1/6-em)]](https://www.rsc.org/images/entities/char_2009.gif) glucose
glucose![[thin space (1/6-em)]](https://www.rsc.org/images/entities/char_2009.gif) :
:![[thin space (1/6-em)]](https://www.rsc.org/images/entities/char_2009.gif) TPABr
TPABr![[thin space (1/6-em)]](https://www.rsc.org/images/entities/char_2009.gif) :
:![[thin space (1/6-em)]](https://www.rsc.org/images/entities/char_2009.gif) Al2O3
Al2O3![[thin space (1/6-em)]](https://www.rsc.org/images/entities/char_2009.gif) :
:![[thin space (1/6-em)]](https://www.rsc.org/images/entities/char_2009.gif) Na2O = 1
Na2O = 1![[thin space (1/6-em)]](https://www.rsc.org/images/entities/char_2009.gif) :
:![[thin space (1/6-em)]](https://www.rsc.org/images/entities/char_2009.gif) 10
10![[thin space (1/6-em)]](https://www.rsc.org/images/entities/char_2009.gif) :
:![[thin space (1/6-em)]](https://www.rsc.org/images/entities/char_2009.gif) 0.2
0.2![[thin space (1/6-em)]](https://www.rsc.org/images/entities/char_2009.gif) :
:![[thin space (1/6-em)]](https://www.rsc.org/images/entities/char_2009.gif) 0.03
0.03![[thin space (1/6-em)]](https://www.rsc.org/images/entities/char_2009.gif) :
:![[thin space (1/6-em)]](https://www.rsc.org/images/entities/char_2009.gif) 0.008
0.008![[thin space (1/6-em)]](https://www.rsc.org/images/entities/char_2009.gif) :
:![[thin space (1/6-em)]](https://www.rsc.org/images/entities/char_2009.gif) 0.5. The detailed process is as follows: 23.4 g ISS, 18 g H2O, 3.6 g glucose, 0.88 g TPABr and 1.5 g AF-RM were mixed, and stirred for 1 h at room temperature, and then transferred into a hydrothermal reaction kettle to crystallize for 24 h at 180 °C. The obtained solid products were filtered out, washed, dried and calcined (550 °C for 5 h). The obtained samples were further ion exchanged twice with 1.0 M NH4Cl solution at 90 °C for 3 h, then calcined again to obtain H-typed ZSM-5, denoted as RM-ZSM.
0.5. The detailed process is as follows: 23.4 g ISS, 18 g H2O, 3.6 g glucose, 0.88 g TPABr and 1.5 g AF-RM were mixed, and stirred for 1 h at room temperature, and then transferred into a hydrothermal reaction kettle to crystallize for 24 h at 180 °C. The obtained solid products were filtered out, washed, dried and calcined (550 °C for 5 h). The obtained samples were further ion exchanged twice with 1.0 M NH4Cl solution at 90 °C for 3 h, then calcined again to obtain H-typed ZSM-5, denoted as RM-ZSM.
The addition amount of glucose in the synthesis mixture varied from 1.8 g, 3.6 g to 5.4 g to reveal the structure-directing effect of glucose on zeolite formation. The obtained samples were recorded as RM-ZSM-1.8, RM-ZSM-3.6 and RM-ZSM-5.4, respectively. As the reference, single-template mediated zeolites (only TPABr or glucose was used) and template-free zeolite (blank) were also prepared, denoted as RM-T, RM-G and RM-B, respectively.
2.3. Preparation of zeolites with pure materials
To clarify the roles of Fe and Ca in RM on the structure and properties of the resultant zeolites, FeCa-free (ZSM-5), Fe-loaded (Fe-ZSM), Ca-loaded (Ca-ZSM) and FeCa-loaded (FeCa-ZSM) zeolites were synthesized with pure raw materials. ZSM-5 was synthesized according to the same procedure as the synthesis of RM-ZSM, except for replacing AF-RM with NaAlO2 and NaOH. Fe-ZSM, Ca-ZSM and FeCa-ZSM were synthesized by adding a certain amount of Fe2O3 and/or CaO into the synthesis process of ZSM-5. The molar ratios of Al, Na, Fe and Ca in these processes were kept consistent with those for the preparation of RM-ZSM.2.4. Characterization of RM and zeolites
The compositions of RM and the obtained zeolites were analyzed by X-ray diffraction (XRD, Rigaku D/MAX 2500) and X-ray fluorescence spectroscopy (XRF, Bruker S4). The surface morphologies were observed on ZEISS Sigma 300 scanning electron microscopy (SEM). The surface elements of the catalyst were analyzed by the EDS technology (Oxford-Instruments ULTIM MAX). N2 adsorption–desorption isotherm was performed at −196 °C, employing the Quanta chrome NOVA 2200e instruments. The pore structure data was obtained using the Brunauer–Emmett–Teller (BET), Barrett–Joyner–Halenda (BJH), and t-plot model.The acidity of zeolites was analyzed by temperature-programmed desorption of NH3 (NH3-TPD), which was performed on an AMI-300Lite chemisorption apparatus. The zeolite sample (100 mg) was loaded and activated at 550 °C in an Ar flow for 0.5 h, then cooled down to 100 °C. A stream of gaseous ammonia (8 vol% in He, 30 mL min−1) was introduced to saturate the sample for 40 min. Then, the sample was flushed with Ar (30 mL min−1) for 40 min. The desorption of NH3 started by heating from 100 °C to 600 °C at a rate of 10 °C min−1 in He stream (20 mL min−1), with a thermal conductivity detector to monitor the desorbed NH3.
Besides, Brønsted acid (B acid) and Lewis acid (L acid) sites on zeolites were measured by in situ pyridine adsorption infrared spectroscopy (Py-IR). The detailed analysis was as follows: zeolites samples were dried at 500 °C under vacuum for 1.5 h and cooled to room temperature in an IR cell. Pyridine adsorption proceeded at ambient temperature for 30 min and was followed by desorption at 150 °C, 250 °C or 350 °C. After cooling to room temperature, IR spectra were collected using an FT-IR spectrometer (Nicolet 380, Thermo Fisher). The concentrations of B acid and L acid sites were calculated from the integral intensities of individual adsorption bands at 1540 cm−1 and 1446 cm−1.18
2.5. DFT calculation method
The density functional theory (DFT) calculation was performed to analyze the distribution and coordination forms of Fe and Ca in zeolites.19 The initial structure of ZSM-5 was obtained from the international zeolite structure database, and the initial cell parameters were a = 20.09, b = 19.73, c = 13.14. Here, 1 × 1 × 2 supercell was used, in which direct channels and cross channels were included, and the Si atoms at T12 were replaced by Al.20 There are 576 atoms in the whole model, and only 77 atoms of Al, Si and O in the straight channel are relaxed.2.6. Catalytic cracking tests
Catalytic cracking experiments were carried out in a fixed-bed quartz tube reactor (inner diameter: 10 mm; length: 400 mm). The synthesized zeolites were tableted, granulated and sieved to obtain 20–40 mesh catalysts. The catalyst (0.5 g) was loaded into reactor, and heated to 500 °C in N2 stream (flow rate: 40 mL min−1). Plastic samples (LDPE or waste plastic) were added to the reactor from the top of the quartz tube with a screw feeder at a rate of 0.02 g min−1 and reacted for 15 min. After cooled at −15 °C, the gaseous product was collected with the drainage method, and liquid product was weighed. Gaseous product was analyzed with gas chromatography (GC) referring to the method described in our previous study.21 Liquid product was analyzed with GC-MS (Thermo Fisher TSQ9000) equipped with an HP-5MS capillary column (50 m × 0.20 mm × 0.33 μm). The amount of coke deposition on catalysts was calculated from weight loss during calcination of the used catalysts at 550 °C for 3 h. Liquid yield (YL), carbon deposition yield (YC), and gas yield (YG) were calculated by the following formulas:| YL = ML/M0 × 100% | (1) |
| YC = MC/M0 × 100% | (2) |
| YG = (M0 − MC − ML)/M0 × 100% | (3) |
3. Results and discussion
3.1. Characterization of the RM-derived zeolites
The elemental compositions of the virginal RM, AF-RM and the synthesized zeolites analyzed by XRF are shown in Table 1. RM mainly contains Fe, Ca, Al, Si and a small quantity of Ti and Na. The alkali fusion process led to a large decrease in the concentrations of all metal elements except for Na. The RM-ZSM contains mainly Si, Fe, Ca, Al and Na, and the real SiO2/Al2O3 mol ratio is 21.9, far lower than the designed value in the starting materials (120). This indicates that a considerable amount of silicon could dissolve in the synthesis solution and fail to enter the zeolite framework.| Na2O | Al2O3 | SiO2 | CaO | TiO2 | Fe2O3 | |
|---|---|---|---|---|---|---|
| RM | 5.3 | 18.5 | 13.0 | 23.8 | 6.1 | 33.3 |
| AF-RM | 63.3 | 5.5 | 4.1 | 8.7 | 2.5 | 15.9 |
| RM-ZSM | 6.6 | 5.6 | 72.0 | 6.1 | 1.5 | 8.2 |
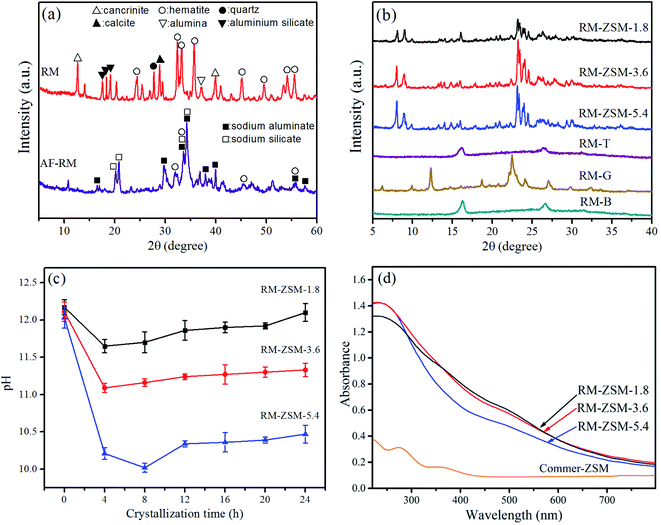
As shown in Fig. 1(a), the virginal RM contains hematite (PDF-33-0664), cancrinite (PDF 46-1332), aluminium silicate (PDF-44-0027) and calcite (PDF-47-1743). AF-RM mainly contains sodium aluminate (PDF-20-1073), sodium silicate (PDF-16-0818), and a small quantity of hematite. Cancrinite, calcite and hematite almost disappear after alkali fusion, indicating that Ca and Fe components could transfer into very small nanoparticles or amorphous particles upon undergoing alkali fusion treatment.
Fig. 1(b) shows the XRD patterns of zeolites from different templates. The characteristic peaks of ZSM-5 (2θ = 7.8, 8.8, 23.2 and 23.8°, PDF-43-0321) are observed in zeolites from TPABr–glucose double templates (RM-ZSM). In single-template mediated and template-free zeolites (RM-T, RM-G, RM-B), only the characteristic peaks of mullite (2θ = 16.3 and 26.5°, PDF-15-0776) are observed.22 This indicates that there is a cooperative action between TPABr and glucose in inducing the formation of ZSM-5. Fig. 1(c) shows the pH changes during the crystallization process of RM-ZSM. The pH decreases rapidly at the first 4 h, and then gradually increases with extending crystallization time. The large pH decline could be attributed to glucose's degradation and isomerization reactions, which release acidic components e.g. lactic acid and glycotic acid.23 The pH decline could cause sodium silicate unstable to transfer into polysilicate, which helps the subsequent crystallization reaction.24,25 Apparently, glucose plays an important role in adjusting the synthesis mixture's pH value and promoting the crystallization reaction.
In order to clarify the roles of glucose, other saccharides including fructose, cellulose, starch, and lactic acid were used to substitute for glucose. The XRD patterns of the resultant zeolites are explicated in Fig. A.1.† As can be seen, ZSM-5 could be obtained by using all substitutes. The difference was that ZSM-5 from glucose and fructose possess higher crystallinity compared to those from cellulose and starch. Due to the complex structure, the degradation rate of cellulose and starch (to release acidic substances) could be slow, which leads to a relatively lower crystallinity of the resultant zeolites.
Fig. 1(d) shows the UV-Vis absorption spectra of RM-ZSM compared to that of Commer-ZSM. Three RM-ZSM show a strong absorbance band at ∼250 nm due to the oxygen-to-iron charge transfer, indicating the Fe species incorporated into the zeolite framework. The weak adsorption at 520 nm implies the existence of FexOy nanoparticles on the external surface of zeolite crystals.26 These FexOy nanoparticles may be so small that no obvious characteristic peaks are observed in the XRD patterns in Fig. 1(b).
3.2. Characterization of zeolites from pure materials
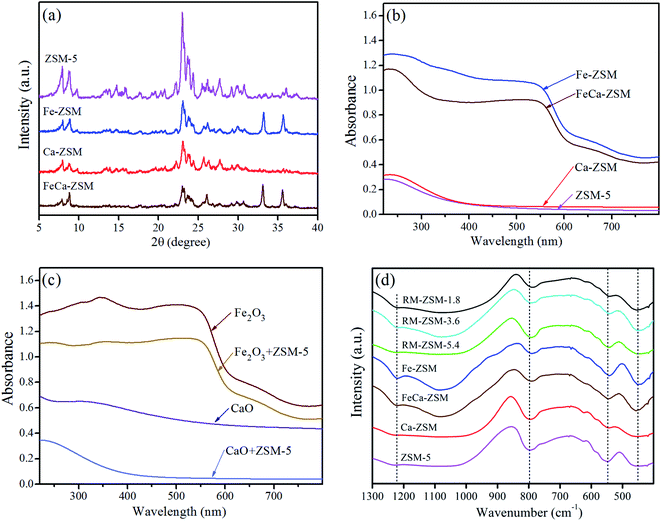
Fig. 2(a) shows the XRD patterns of four zeolites synthesized with pure materials. The characteristic peaks of ZSM-5 are observed in all zeolites and the peak intensities decrease significantly after loading metal oxides, indicating that the addition of metal oxides regardless of Fe2O3 or CaO restrains the crystallization reaction of silicon–aluminium phases. The characteristic peaks of Fe2O3 (2θ = 33.1 and 35.6°) appear in Fe-ZSM and FeCa-ZSM, implying that the introduced Fe2O3 particles could be too large to dissolve in the synthesis mixture.UV-Vis absorption spectra of four zeolites show that Fe-ZSM and FeCa-ZSM generate obvious absorption bands at about 250 nm and 550 nm, which are attributed to the intro-framework and extra-framework Fe species, respectively. The absorption bands at 550 nm are much stronger than that of RM-ZSM (Fig. 1(d)), indicating that the most introduced Fe atoms exist in iron oxide nanoparticles. Comparatively, the Fe atoms in RM can preferably integrate into the formation of the framework of ZSM-5. The Ca-ZSM, ZSM-5 and the mechanical mixture of CaO and ZSM-5 show similar absorption patterns, as seen in Fig. 2(b) and (c), indicating that the introduced Ca atoms hardly enter the framework of ZSM-5.
Fig. 2(d) shows the FT-IR spectra of all zeolites synthesized with RM and pure materials. Absorption peaks at 1220, 790, 545 and 450 cm−1 are observed for all samples, where 1220 cm−1 due to the external stretching vibration of Si–O, 790 cm−1 resulting from the internal stretching vibration of Si–O–T (T represents a metallic element), 545 cm−1 and 450 cm−1 identified to be the characteristic vibrations of the five-membered ring of ZSM-5.27 It is notable that the band at 790 cm−1 for all Fe-containing zeolites slightly shift to a lower wavenumber compared to Fe-free zeolites, which could be attributed to the fact of Fe incorporation into the Si–O–T framework because Fe–O bond length is slightly larger than Al–O.25 These results indicate that isomorphous replacement of Si or Al in the framework of ZSM-5 by Fe (not Ca) probably occurs.
In order to seek the distribution and coordination form of Fe and Ca in zeolites, DFT was used to calculate the energy changes of six possible models: skeleton three coordinated Fe (Fig. 3(a)), skeleton four coordinated Fe (Fig. 3(b)), adsorbed [FeO]+ in the pores (Fig. 3(c)), skeleton three coordinated Ca (Fig. 3(d)), skeleton four coordinated Ca (Fig. 3(e)), adsorbed CaO in the pores (Fig. 3(f)). The total energy and M–O bond lengths for the most stable structure of each model can be calculated through the self-consistent iteration approach of VASP.28 The calculated substitution energy (substitution of one Si atom in ZSM-5 cell by Fe or Ca) and adsorption energy (adsorption of one [FeO]+ or CaO in the pore) are shown in Table 2.
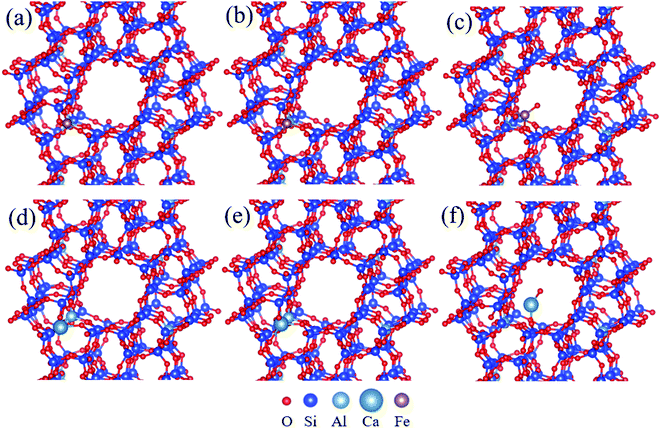 | ||
| Fig. 3 The different positions of Fe and Ca in ZSM-5, (a) skeleton Fe(III), (b) skeleton Fe(IV), (c) adsorbed [FeO]+, (d) skeleton Ca(III), (e) skeleton Ca(IV), (f) adsorbed CaO. | ||
| Models | M–O bond lengtha (Å) | Substitution/adsorption energy (kJ mol−1) | |||
|---|---|---|---|---|---|
| a M–O represents the covalent bond length of Fe–O and Ca–O. | |||||
| Skeleton Fe III | 1.71 | 1.78 | 1.73 | — | −70.52 |
| Skeleton Fe IV | 1.79 | 1.75 | 1.78 | 1.79 | −279.90 |
| Adsorbed [FeO]+ | 1.87 | 1.85 | 1.70 | −188.73 | |
| Skeleton Ca III | 2.59 | 2.74 | 2.21 | — | 16.03 |
| Skeleton Ca IV | 2.38 | 2.24 | 2.17 | 2.32 | 331.27 |
| Adsorbed CaO | 2.22 | 2.04 | — | — | −78.55 |
As can be seen in Table 2, Fe–O bond lengths for two kinds of skeleton coordinated Fe are slightly larger than the average bond length of ZSM-5 (1.7 Å), while Ca–O bond lengths for two kinds of skeleton coordinated Ca are much longer than 1.7 Å. Therefore, Ca atoms could easily lead to the deformation of the framework once they enter the skeleton of ZSM-5. Among three forms of Fe atoms, the substitution energy for skeleton four coordinated Fe is the lowest, suggesting that Fe atoms are more prone to enter into the framework of ZSM-5 via isomorphous replacement. Due to the low substitution and adsorption energy, part of the Fe atoms could exist as skeleton three coordinated Fe and the adsorbed [FeO]+. In contrast, the substitution energies for two kinds of skeleton coordinated Ca are high. Therefore, it is difficult for Ca atoms to enter the skeleton of ZSM-5. The above results indicate that Fe atoms distribute in zeolites in many forms, while Ca atoms are mainly adsorbed in the pores of zeolites.
3.3. Porosity and morphology analysis
The N2 adsorption–desorption isotherms and the pore size distribution of the obtained zeolites are shown in Fig. 4. Compared to Commer-ZSM, RM-ZSM-3.6 and RM-ZSM-5.4 showed an approximately IV-type isotherm with a hysteresis loop at high relative pressure (P/P0 = 0.4–0.9), indicating the presence of mesopores. This result was consistent with our previous study, in which microcrystalline cellulose was used as co-template for synthesizing micro–mesoporous ZSM-5. As seen in Fig. 4(b), Commer-ZSM was mainly composed of pores smaller than 6 nm, and more pores with a diameter > 6 nm were present in the three RM-ZSM samples. As can be seen in Table 3, the BET surface area (SBET) of the three kinds of RM-ZSM are significantly lower than that of Commer-ZSM. The total pore volume (Vtotal), mesopore volume (Vmeso), and the average pore diameter (Daver) gradually increased in the order: RM-ZSM-1.8 < RM-ZSM-3.6 < RM-ZSM-5.4, indicating that glucose acts as hard template to promote the formation of mesopores in zeolites. Glucose dehydrates in alkaline environment to produce carbonaceous species, which serve as the mesopore template.29,30 The presence of mesopores in ZSM-5 is useful for accelerating the diffusion of bulkier molecules (e.g. long chain pyrolysis fragments from plastics) and accessing the active sites on catalysts.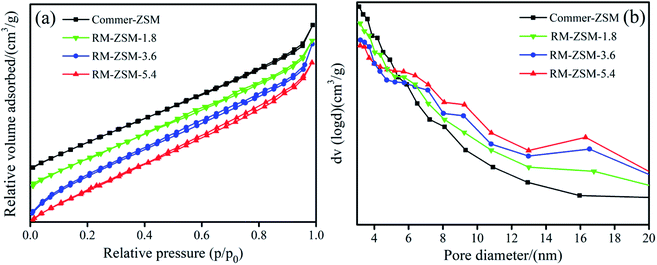 | ||
| Fig. 4 N2 adsorption–desorption isotherms (a) and pore size distribution (b) of ZSM-5 samples from different glucose addition amounts. | ||
| Samples | SBET (m2 g−1) | Vtotal (cm3 g−1) | Vmicro (cm3 g−1) | Vmeso (cm3 g−1) | Vmeso/Vtotal | Daver (nm) |
|---|---|---|---|---|---|---|
| RM-ZSM-1.8 | 254.7 | 0.332 | 0.088 | 0.244 | 0.735 | 4.422 |
| RM-ZSM-3.6 | 355.1 | 0.397 | 0.091 | 0.306 | 0.771 | 4.741 |
| RM-ZSM-5.4 | 314.2 | 0.401 | 0.085 | 0.316 | 0.780 | 5.101 |
| Commer-ZSM | 480.4 | 0.498 | 0.185 | 0.313 | 0.628 | 4.056 |
SEM images in Fig. 5 show that all synthesized zeolites contain cubic crystals and rod-shaped particles. Some floccules and irregular particles adhere to the surface of the large cubic crystals except for the ZSM-5 synthesized with pure materials. The rod-like particles are identified as mullite,22 which is a stable silicoaluminate and easily produced under hydrothermal conditions. Element compositions of the selected areas 1 and 2 (Fig. 5(e)) show that some Fe atoms distribute in the ZSM-5 and mullite; the high Fe concentration of the selected area 3 indicates that a considerable amount of Fe atoms distribute in irregular particles which are maybe the amorphous FexOy particles. The high Ca concentration in the selected areas 4 indicates that the floccules could be CaO agglomeration.31 It is clear that the loading of metal oxides especially CaO leads to the decrease of cubic crystals and the increase of rod-shape and floccules particles, suggesting a negative effect on crystallization reaction. The high Al concentration in the rod-like crystals suggests that the presence of mullite is unfavourable for the synthesis of ZSM-5 with a low SiO2/Al2O3 ratio.
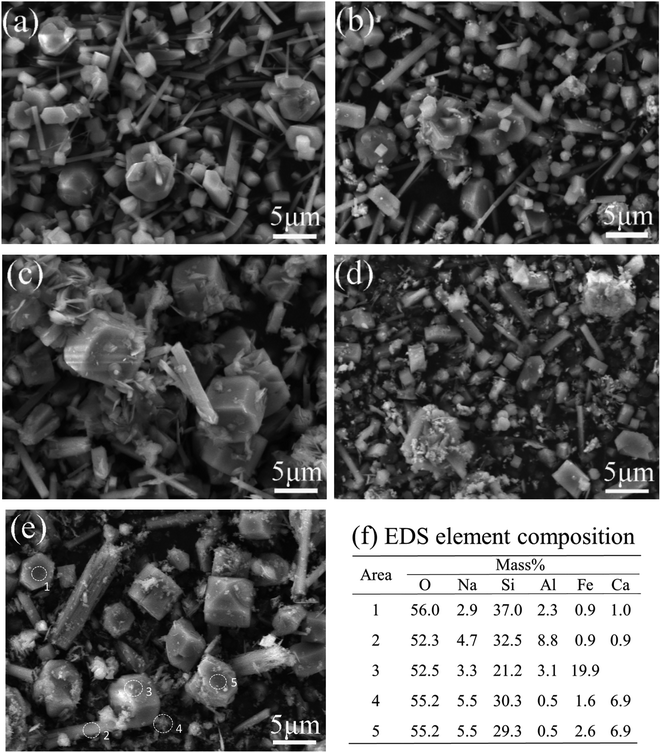 | ||
| Fig. 5 SEM images of different zeolites, (a) ZSM-5, (b) Fe-ZSM, (c) Ca-ZSM, (d) FeCa-ZSM, (e) RM-ZSM, (f) element composition of the selected area in (e) analyzed by EDS. | ||
3.4. Acidity analysis
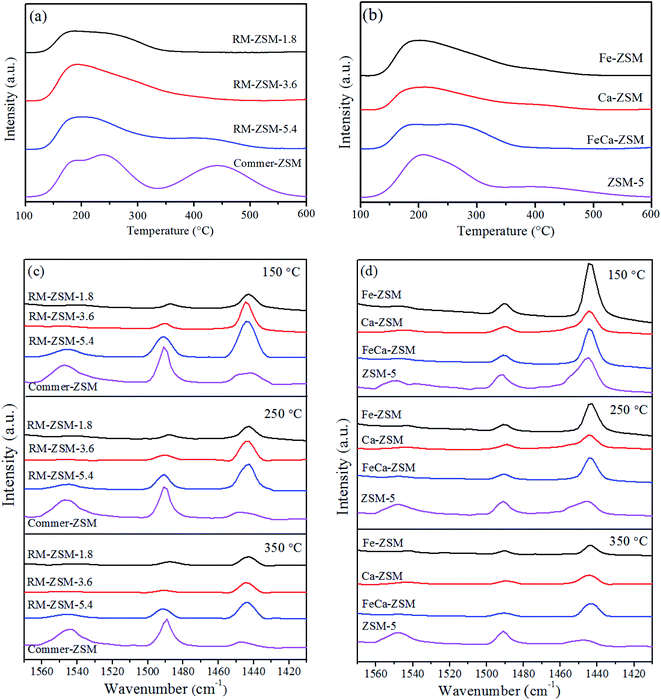
Fig. 6 shows NH3-TPD and Py-IR profiles of the different zeolites. The NH3 desorption peaks in the range of 100–200 °C, 200–350 °C and 350–500 °C are defined as weak, medium, and strong acid, respectively.32 The acid strength distribution was calculated by integrating the three temperature regions' peak area. As shown in Fig. 6(a) and (b), all synthesized ZSM-5 mainly contain weak and medium acid. The total acid amounts of Ca-ZSM and Fe-SZM are lower than that of ZSM-5, indicating that the loading of metal oxides has a hampering effect on the formation of the skeleton of zeolites. FeCa-ZSM shows a broader medium acid range, implying that the incorporation of Fe and Ca adjust the acid strength distribution. The total acid amount increases in the order: RM-ZSM-1.8 < RM-ZSM-3.6 < RM-ZSM-5.4, demonstrating the template role of glucose. In general, the acidity of zeolites derives from the framework aluminium,33 a good template can promote the skeleton formation, thus improving the acidity of zeolites. This is consistent with the result from the XRD analysis. The large pH decline caused from glucose's degradation reactions could contribute to crystallization reaction.Fig. 6(c) and (d) show the Py-IR spectra of the synthesized zeolites. The absorption bands at 1545 cm−1, 1490 cm−1 and 1442 cm−1 can be observed in all zeolites. The band at 1545 cm−1 is ascribed to the B acid sites, mainly caused by proton adsorbed on the framework aluminium (Al–OH–Si), combining pyridine in a PyrH+ form. The band at 1442 cm−1 is attributed to the L acid sites, mainly derived from the isolated AlO+ and metal sites (Feδ+ and Caδ+) on zeolites, being an electron pair acceptor (combining pyridine in a coordination bond form). The band at 1490 cm−1 is attributed to the vibration of the pyridine ring on both B and L acid sites.27 As can be seen in Table 4, the concentrations of L acid sites for all metal-loaded zeolites are much higher than those of B acid sites, and the concentrations of all acid sites substantially decrease with increasing the desorption temperature. This indicates that the synthesized zeolites are L acid-dominant weak-medium acidic materials. Comparatively, the Commer-ZSM and ZSM-5 possess more B acid sites.
| Zeolites | Total acid amount (μmol g−1) | Acid strength distribution (%) | Acid types and concentration (μmol g−1) | B/L | ||
|---|---|---|---|---|---|---|
| B acid | L acid | |||||
| RM-ZSM-1.8 | 384.11 | Weak | 31.99 | 2.01 | 34.7 | 0.05 |
| Medium | 66.02 | 2.63 | 31.0 | 0.08 | ||
| Strong | 1.99 | 1.38 | 18.4 | 0.07 | ||
| RM-ZSM-3.6 | 687.05 | Weak | 28.43 | 4.75 | 40.1 | 0.11 |
| Medium | 62.56 | 2.8 | 38.9 | 0.09 | ||
| Strong | 9.01 | 1.9 | 16.5 | 0.12 | ||
| RM-ZSM-5.4 | 725.16 | Weak | 23.70 | 19.2 | 78.2 | 0.25 |
| Medium | 53.51 | 13.3 | 49.4 | 0.27 | ||
| Strong | 22.79 | 11.0 | 31.6 | 0.35 | ||
| Commer-ZSM | 1218.7 | Weak | 16.83 | 60.7 | 43.9 | 1.38 |
| Medium | 43.75 | 63.5 | 22.2 | 2.86 | ||
| Strong | 39.42 | 61.7 | 12.8 | 4.82 | ||
| Fe-ZSM | 714.68 | Weak | 25.16 | 3.7 | 90.5 | 0.04 |
| Medium | 62.40 | 2.2 | 54.2 | 0.04 | ||
| Strong | 12.45 | 5.0 | 15.2 | 0.33 | ||
| Ca-ZSM | 661.08 | Weak | 14.44 | 8.5 | 47.8 | 0.17 |
| Medium | 68.44 | 9.2 | 34.1 | 0.27 | ||
| Strong | 17.12 | 3.6 | 20.2 | 0.17 | ||
| FeCa-ZSM | 515.91 | Weak | 25.55 | 3.4 | 61.1 | 0.05 |
| Medium | 70.10 | 2.4 | 39.5 | 0.06 | ||
| Strong | 4.35 | 1.4 | 22.0 | 0.06 | ||
| ZSM-5 | 886.08 | Weak | 8.34 | 49.5 | 74.2 | 0.77 |
| Medium | 67.58 | 50.4 | 35.2 | 1.43 | ||
| Strong | 24.08 | 40.1 | 12.1 | 3.32 | ||
In sum, the introduction of Fe and Ca atoms influences the skeleton of zeolites, leading to a decrease in the total acid amounts.34 CaO and Fe2O3 as alkaline metal oxides could partly shield the acidity via chemical adsorption on acid sites. The adsorbed Feδ+ in the pores of zeolites probably contribute to the formation of new L acid sites, consequently leading to the increase of L acid sites in Fe-loaded zeolites. The changes of acidity will dominate the catalytic performance.
3.5. Catalytic performance
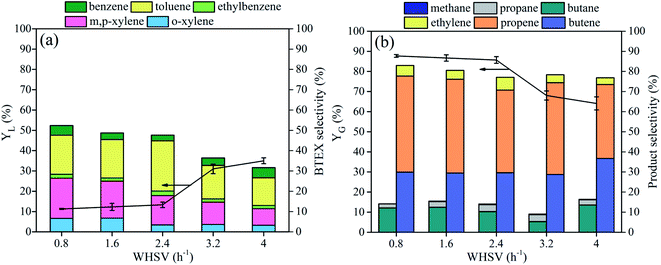
LDPE was chosen as a probe to study the cracking performances of the synthesized zeolites. As can be seen in Table 5, the YL obtained at 500 °C follows the sequence of Commer-ZSM > ZSM-5 > Fe-ZSM > FeCa-ZSM > Ca-ZSM > RM-ZSM-3.6. Liquid products mainly contain aromatic hydrocarbons and alkanes (Table 6). The selectivity to aromatic hydrocarbons follows the sequence of Fe-ZSM (98.9%) > ZSM-5 (97.9%) > Commer-ZSM (97.4%) > FeCa-ZSM (68.5%) > RM-ZSM-3.6 (61.9%) > Ca-ZSM (54.8%). The selectivity to benzene, toluene, ethylbenzene and xylene (BTEX) was further analyzed with GC, and decreased in the order: ZSM-5 (85.7%) > Commer-ZSM (78.8%) > Fe-ZSM (74.1%) > FeCa-ZSM (49.9%) > RM-ZSM-3.6 (47.6%) > Ca-ZSM (23.9%) (Fig. 7(a)).| Catalysts | YL (%) | YC (%) | YG (%) |
|---|---|---|---|
| RM-ZSM-3.6 | 13.3 | 1.4 | 85.3 |
| Commer-ZSM | 31.7 | 1.9 | 66.4 |
| Fe-ZSM | 24.0 | 0.9 | 75.1 |
| Ca-ZSM | 17.6 | 0.4 | 82 |
| FeCa-ZSM | 17.9 | 0.5 | 81.6 |
| ZSM-5 | 28.4 | 1.7 | 69.9 |
| No. | RT (min) | Name of compound | Molecular formula | Catalysts | |||||
|---|---|---|---|---|---|---|---|---|---|
| RM-ZSM-3.6 | Fe-ZSM | Ca-ZSM | FeCa-ZSM | ZSM-5 | Commer-ZSM | ||||
| 1 | 3.05 | Benzene | C6H6 | 2.8 | 3.3 | 2.6 | 4.5 | 2.8 | 5.7 |
| 2 | 5.23 | Toluene | C7H8 | 24.7 | 39.8 | 7.4 | 21.9 | 34.7 | 26.8 |
| 3 | 6.34 | Ethylbenzene | C8H10 | 2.2 | 6.3 | 5.0 | 1.1 | 3.2 | 2.5 |
| 4 | 6.59 | m,p-Xylene | C8H10 | 14.5 | 21.6 | 4.5 | 21.5 | 37.6 | 35.0 |
| 5 | 6.69 | o-Xylene | C8H10 | 3.4 | 3.1 | 4.4 | 0.9 | 7.4 | 8.9 |
| 6 | 7.55 | Nonane | C9H20 | 5.5 | 0.2 | 8.2 | 3.9 | 0.2 | 0.1 |
| 7 | 9.74 | Benzene, 1-ethyl-3-methyl- | C9H12 | 7.3 | 3.9 | 16.8 | 7.8 | 1.4 | 2.3 |
| 8 | 10.84 | Benzene, 1,2,3-trimethyl- | C9H12 | 1.5 | 3.9 | 2.2 | 1.7 | 1.0 | 1.7 |
| 9 | 11.05 | Decane | C10H22 | 4.8 | 0.2 | 7.8 | 3.9 | 0.1 | 0.1 |
| 10 | 12.28 | Indane | C9H10 | 0.7 | 2.0 | 1.9 | 0.9 | 1.2 | 1.6 |
| 11 | 12.88 | Benzene, 1-methyl-2-propyl- | C10H14 | 0.4 | 1.3 | 0.8 | 1.1 | 0.4 | 0.6 |
| 12 | 13.04 | Benzene, 1,2-diethyl- | C10H14 | 2.8 | 1.4 | 5.4 | 2.6 | 0.7 | 1.0 |
| 13 | 14.71 | Undecane | C11H24 | 6.0 | 0.2 | 8.3 | 5.4 | 0.1 | 0.1 |
| 14 | 16.07 | 1H-Indene, 2,3-dihydro-4-methyl- | C12H16 | 0.6 | 1.7 | 1.1 | 0.7 | 1.2 | 1.6 |
| 15 | 17.77 | 1H-Indene, 1-methylene- | C10H8 | 0.1 | 3.3 | 1.3 | 1.1 | 2.1 | 3.6 |
| 16 | 18.29 | Dodecane | C12H26 | 5.8 | 0.1 | 6.7 | 3.8 | 0.0 | 0.1 |
| 17 | 21.63 | Naphthalene, 1-methyl- | C11H10 | 0.4 | 4.8 | 0.8 | 0.7 | 1.1 | 2.2 |
| 18 | 21.72 | Pentadecane | C15H32 | 5.1 | 0.2 | 5.4 | 5.8 | 1.0 | 1.4 |
| 19 | 22.08 | Naphthalene, 2-methyl- | C11H10 | 0.1 | 1.3 | 0.3 | 0.9 | 1.6 | 2.2 |
| 20 | 24.97 | Tetradecane | C14H30 | 4.4 | 0.2 | 3.4 | 4.3 | 0.6 | 0.5 |
| 21 | 25.19 | Naphthalene, 1,7-dimethyl- | C12H12 | 0.1 | 1.3 | 0.3 | 0.9 | 1.4 | 1.7 |
| 22 | 28.04 | Dodecane, 2,6,11-trimethyl- | C12H26 | 3.6 | 0.1 | 3.1 | 2.9 | 0.0 | 0.1 |
| 23 | 30.95 | Hexadecane | C16H32 | 2.8 | 0.1 | 2.3 | 1.5 | 0.0 | 0.1 |
| Alkanes | 38.1 | 1.1 | 45.2 | 31.5 | 2.1 | 2.6 | |||
| Aromatic compounds | 61.9 | 98.9 | 54.8 | 68.5 | 97.9 | 97.4 | |||
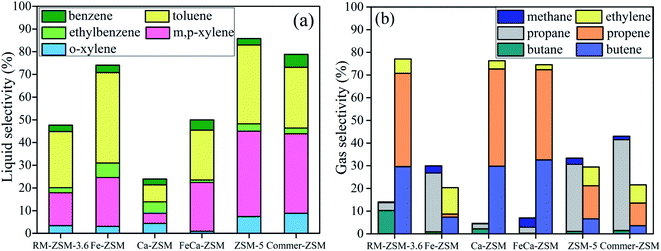 | ||
| Fig. 7 The liquid (a) and gas (b) product selectivity from cracking of LDPE over different zeolites. | ||
Some think that aromatics formation is attributed to the B acid sites in catalysts.35 Others, however, consider that the aromatization reaction needs both L and B acid sites.36,37 B acid sites accelerate the decomposition of polymers to produce long- and short-chain fragments via both the β-cracking and carbonium ions mechanisms, while L acid sites promote the aromatization of cracking fragments by a combination of cyclization, hydrogen transfer and oligomerization processes.38,39 ZSM-5 and Commer-ZSM contained a lot of B acid and L acid sites, especially B acid sites exceeding 50%, which could be suitable for cracking and the subsequent aromatization reactions. The Fe loading could introduce not only a number of L acid sites but also dehydrogenation active sites, consequently improving the aromatization reaction. The Ca loading could significantly shield the acidic sites, consequently decreasing aromatization activity. The presence of more micropores in Commer-ZSM could promote the shape selective catalysis to form monocyclic aromatics.40 The combined effects of the proper acidity and porous structure lead to the improved BTEX selectivity for Fe-ZSM, Commer-ZSM and ZSM-5.
Fig. 7(b) shows the gas product distribution from cracking of HDPE over different zeolites. Ca-ZSM, FeCa-ZSM and RM-ZSM-3.6 achieved a much higher light olefins selectivity (73–76%), which is almost 2.5 times higher than those from Fe-ZSM, Commer-ZSM and ZSM-5 (light olefins selectivity: 20–30%), indicating that these catalysts are suitable for the production of light olefins, especially for propene and butene (the selectivity is about 40% and 30%). The weak acidity of these catalysts helps the proper cracking of polythene to produce short-chain alkanes and alkenes while avoiding the further secondary reactions of these products such as cracking, cyclization and dehydrogenation, consequently leading to the high light olefins selectivity.
The effect of residence time of LDPE on product selectivity was investigated by changing the weight (hourly) space velocity (WHSV). Fig. 8(a) shows that with increasing WHSV, BTEX selectivity decreased gradually, accompanied by an increase in liquid yield. Meanwhile, gas yield and light olefins selectivity decreased slightly. An excessive increase in WHSV indicates a faster feed rate and shorter residence time, which could cause the insufficient cracking reaction of raw materials. As a result, more long-chain hydrocarbons were present in liquid products, consequently decreasing BTEX selectivity and gas yield. However, the light olefins selectivity always remained at about 78% at any WHSV, indicating that RM-ZSM-3.6 is effective in producing light olefins. The optimal WHSV was 0.8–1.6 h−1.
The cracking performance of RM-ZSM-3.6 was compared with those on the original RM and quartz sand (thermal run). As shown in Fig. 9, RM-ZSM-3.6 achieved a lower liquid yield but relatively higher gas yield (85%) and light olefins selectivity (77%). RM only showed a slight effect on generating gas products compared to quartz sand. This finding was consistent with a previous work.41 In another study, ZSM-5 (SiO2/Al2O3 = 50) and RM were tested in pyrolysis of a mixture of plastics with a semi-batch reactor.42 The obtained liquid yield at 500 °C was 39.8 wt% for ZSM-5 and 57 wt% for RM. The BTEX selectivity reached 41% for ZSM-5 and 27.4% for RM. Both ZSM-5 and RM showed a significant aromatization activity. This is very different from our study, may be attributed to the fact that the composition of RM varies with the specific process from which it is obtained.
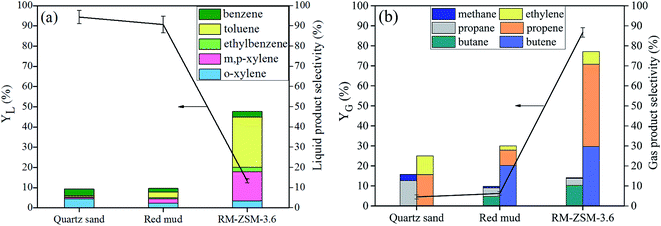 | ||
| Fig. 9 The liquid (a) and gas yield (b) and selectivity from cracking of LDPE over RM-ZSM-3.6 compared to those over original RM and quartz sand. | ||
In addition, the different properties of the used catalysts (SiO2/Al2O3 ratio, acidic properties and porous structure) and the differences on reaction devices could affect the product yield and selectivity. Dai et al. reported an effective method for production of naphtha by catalytic fast pyrolysis of LDPE by the relay catalysis. The selectivity of monoaromatics and C5–C12 alkanes/olefins reached 100% over Al2O3 followed by ZSM-5 relay catalysis at 550 °C.43 In Lee's study, H-ZSM-11 zeolite was used to valorize plastic waste (LDPE) to fuel-range chemicals.44 Compared with non-catalytic pyrolysis, H-ZSM-11 greatly enhanced the pyrolytic gas yield (80% at 500–600 °C), especially the propylene in the pyrolytic gas. This was consistent with our results.
In view of saving energy, the reaction temperature was fixed at 500 °C in this study, which is the lowest temperature to satisfy demand for pyrolysis of polyolefin plastics. In this case, the product selectivity is mainly dependent on the acidic properties of catalysts. From our results, the catalyst with stronger acidity trends to produce more liquid products with aromatics as the predominant components, while the catalyst with weaker acidity trends to produce more gas product with light olefins as the dominant components. Based on the gaseous and liquid products from the present study and the results from current literature,35–39 the cracking and aromatization reactions paths of polythene are proposed as follows: polymer firstly decomposes thermally to produce large hydrocarbons (mainly wax, diesel and gasoline products) via random chain scission reactions (free radicals mechanism), and these large hydrocarbons are then catalytically cracked to short-chain alkanes and alkenes on the B acid sites of the catalysts via the β-scission and carbonium ions mechanisms;35,45 those products can further produce aromatic hydrocarbons on the L acid sites of the catalysts through a series of secondary reactions such as direct cyclization, dehydrogenation of C6+ and oligomerization and cyclization of C4 and C5.35,36 Numerous C1–4 alkanes and alkenes are formed as a by-product.
3.6. Stability of catalysts
The stability of the catalysts was determined by continuously cracking a self-made waste plastic sample at 500 °C for 300 min over RM-ZSM-3.6 and Commer-ZSM. Gaseous and liquid products were collected and analyzed per 15 min. As shown in Fig. 10(a) and (b), RM-ZSM-3.6 achieves a gas yield of about 90%, which begins to decline after 165 min and reaches 70% after 300 min. Meanwhile, Commer-ZSM obtains a gas yield about 80%, which gradually decreases to 70% after 300 min. The light olefins (C![[double bond, length as m-dash]](https://www.rsc.org/images/entities/char_e001.gif) 2–4) selectivity in gaseous products reaches about 70–80% for RM-ZSM-3.6 and 15–20% for Commer-ZSM.
2–4) selectivity in gaseous products reaches about 70–80% for RM-ZSM-3.6 and 15–20% for Commer-ZSM.
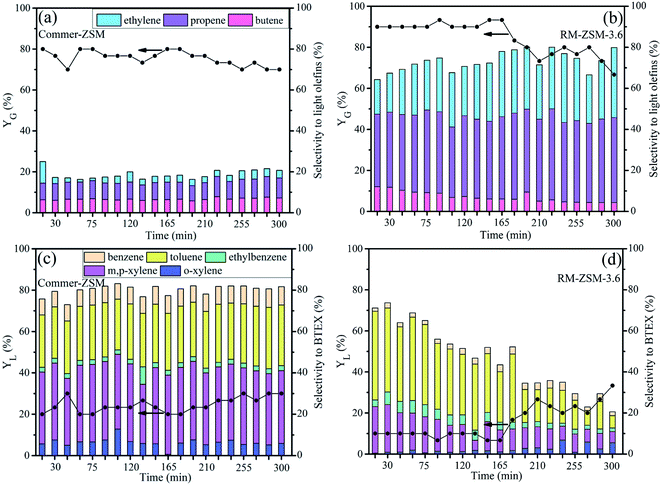 | ||
| Fig. 10 Gaseous and liquid yields and product selectivity from catalytic cracking of waste plastics over Commer-ZSM (a and c) and RM-ZSM-3.6 (b and d). | ||
Fig. 10(c) and (d) show liquid yield and BTEX selectivity from cracking of waste plastics. For Commer-ZSM, the YL maintains at 20∼30%, and BTEX selectivity reaches 80% during whole reaction. For RM-ZSM-3.6, the YL is 10% at the initial stage and then gradually increases up to 30% after 165 min, while BTEX selectivity decreases from 73% to 20.5%. The acid sites on RM-ZSM-3.6 could be covered by coke, which leads to the decrease in cracking and aromatization activity of the catalyst. As a result, the cracking intermediate products could not be further cracked into small molecules and converted into aromatics.
Light olefins and monocyclic aromatic hydrocarbons are important industrial chemicals. Commer-ZSM is demonstrated to be suitable for producing monocyclic aromatics, while RM-ZSM-3.6 is the ideal catalyst for producing gaseous products, especially ethylene and propene. The product selectivity is dependent on the chemical and physical properties of catalysts. Compared to the Commer-ZSM, the stability of RM-ZSM-3.6 should be further improved for long-term application by promoting zeolite's crystallinity and decreasing the impurity in waste plastics.
4. Conclusions
ZSM-5 was hydrothermally synthesized in a TPABr–glucose dual-template system with low-cost RM and industrial sodium silicate as raw materials. Glucose mainly acted as pH regulator and hard template. The pH decline caused by glucose degradation leads to sodium silicate unstable to form the polysilicate, which accelerates the crystallization reaction. Glucose dehydrates in alkaline environment to produce carbon nanoparticles, which could serve as the mesopore template. Fe atoms can distribute in ZSM-5 in many forms (partly in the framework, partly adsorbed in the pores of zeolites), and help to generate L acid sites in zeolites. Ca atoms are mainly adsorbed in the pores of zeolite and show an inhibitory effect on the formation of the framework of zeolites. The presence of Ca and Fe atoms weakened the acidity of resultant zeolites, which eventually enhanced the formation of gaseous products (yield: 85.3%), especially light olefins (selectivity: 77.1%). The long-term cracking experiment indicates that RM-ZSM-3.6 is superior in converting waste plastics to light olefins (ethylene and propene) than the commercial ZSM-5. The present study represents a green chemical process with economic and environmental benefits: (i) transferring solid wastes (RM and waste plastics) into useful materials, and (ii) developing an economic and non-petroleum route for the production of light olefins.Conflicts of interest
There are no conflicts of interest to declare.Acknowledgements
This work was supported by the National Natural Science Foundation of China (22078076), Guangxi Natural Science Foundation (2020GXNSFAA159174) and the Opening Project of National Enterprise Technology Center of Guangxi Bossco Environmental Protection Technology Co., Ltd (GXU-BFY-2020-005). We gratefully acknowledge the support of the high-performance computing platform of Guangxi University for DFT calculation.References
- I. Fahim, O. Mohsen and D. Elkayaly, Polymers, 2021, 13, 1–9 CrossRef PubMed.
- G. M. Cappucci, R. Avolio, C. Carfagna, M. Cocca, G. Gentile, S. Scarpellini, F. Spina, G. Tealdo, M. E. Errico and A. M. Ferrari, Waste Manage., 2020, 118, 68–78 CrossRef CAS PubMed.
- L. Qin, X. Huang, B. Zhao, W. Chen and J. Han, J. Energy Inst., 2020, 93, 1773–1780 CrossRef CAS.
- P. Khongprom, T. Whansungnoen, P. Pienduangsri, W. Wanchan and S. Limtrakul, E3S Web Conf., 2020, 141, 1–6 CrossRef.
- K. Oshima, H. Fujii, K. Morita, M. Hosaka, T. Muroi and S. Satokawa, Ind. Eng. Chem. Res., 2020, 59, 13460–13466 CrossRef CAS.
- Y. J. Wang, J. P. Cao, X. Y. Ren, X. B. Feng, X. Y. Zhao, Y. Huang and X. Y. Wei, Fuel, 2020, 268, 117286 CrossRef CAS.
- D. Hartanto, R. Kurniawati, A. B. Pambudi, W. P. Utomo, W. L. Leaw and H. Nur, Solid State Sci., 2019, 87, 150–154 CrossRef CAS.
- H. Li, R. Cheng, Z. Liu and C. Du, Sci. Total Environ., 2019, 683, 638–647 CrossRef CAS PubMed.
- W. Aguilar-Mamani, G. García, J. Hedlund and J. Mouzon, SpringerPlus, 2014, 3, 292 CrossRef PubMed.
- S. Zhang, C. Zhang, Q. Wang and W. S. Ahn, Ind. Eng. Chem. Res., 2019, 58, 22857–22865 CrossRef CAS.
- P. Zhang, S. Li and P. Guo, Res. Chem. Intermed., 2020, 46, 4091–4098 CrossRef CAS.
- Y. Feng and C. Yang, Adv. Mater. Sci. Eng., 2018, 2018, 8784232 Search PubMed.
- N. Zhang, X. Liu, H. Sun and L. Li, Cem. Concr. Res., 2011, 41, 270–278 CrossRef CAS.
- H. Tehubijuluw, R. Subagyo, M. F. Yulita, R. E. Nugraha, Y. Kusumawati, H. Bahruji, A. A. Jalil, H. Hartati and D. Prasetyoko, Environ. Sci. Pollut. Res., 2021, 28, 37354–37370 CrossRef CAS PubMed.
- S. Kyrii, T. Dontsova, I. Kosogina, I. Astrelin, N. Klymenko and D. Nechyporuk, J. Ecol. Eng., 2020, 21, 34–41 CrossRef.
- Y. Yu, X. Li, X. Zou and X. Zhu, Front. Environ. Sci. Eng., 2014, 8, 54–61 CrossRef CAS.
- X. Wang, H. Fu, H. Gu, T. Gao, Y. Liu, H. Ge and Z. Li, Appl. Chem. Ind., 2022, 11 Search PubMed , in press (in Chinese)..
- T. Fu, Y. Guo, J. Shao, Q. Ma and Z. Li, Microporous Mesoporous Mater., 2021, 320, 111103 CrossRef CAS.
- P. He, Y. Chen, J. Jarvis, S. Meng, L. Liu, X. D. Wen and H. Song, ACS Appl. Mater. Interfaces, 2020, 12, 28273–28287 CrossRef CAS PubMed.
- C. C. Chiu, G. N. Vayssilov, A. Genest, A. Borgna and N. Rösch, J. Comput. Chem., 2014, 35, 809–819 CrossRef CAS PubMed.
- T. Zhao, F. Li, H. Yu, S. Ding, Z. Li, X. Huang, X. Li, X. Wei, Z. Wang and H. Lin, Appl. Catal., A, 2019, 575, 101–110 CrossRef CAS.
- G. Feng, F. Jiang, W. Jiang, J. Liu, Q. Zhang, Q. Wu, Q. Hu and L. Miao, Ceram. Int., 2018, 44, 22904–22910 CrossRef CAS.
- H. Kishida, F. Jin, X. Yan, T. Moriya and H. Enomoto, Carbohydr. Res., 2006, 341, 2619–2623 CrossRef CAS PubMed.
- Y. H. Xu, Y. G. Yang, Y. S. Wang and C. L. Yin, J. Wuhan Univ., Nat. Sci. Ed., 2005, 51, 177–180 CAS in Chinese.
- A. P. Tai, J. Nanjing Univ. Sci. Technol., Nat. Sci., 1963, 1, 1–8 Search PubMed in Chinese.
- Y. Yue, H. Liu, P. Yuan, C. Yu and X. Bao, Sci. Rep., 2015, 5, 1–10 Search PubMed.
- J. Li, P. Miao, Z. Li, T. He, D. Han, J. Wu, Z. Wang and J. Wu, Energy Convers. Manage., 2015, 93, 259–266 CrossRef CAS.
- G. Li, E. A. Pidko, R. A. Van Santen, Z. Feng, C. Li and E. J. M. Hensen, J. Catal., 2011, 284, 194–206 CrossRef CAS.
- D. Nandan, S. K. Saxena and N. Viswanadham, J. Mater. Chem. A, 2014, 2, 1054–1059 RSC.
- R. Feng, X. Wang, J. Lin, Z. Li, K. Hou, X. Yan, X. Hu, Z. Yan and M. J. Rood, Microporous Mesoporous Mater., 2018, 270, 57–66 CrossRef CAS.
- J. Osuntokun, D. C. Onwudiwe and E. E. Ebenso, IET Nanobiotechnol., 2018, 12, 888–894 CrossRef PubMed.
- Q. Che, M. Yang, X. Wang, Q. Yang, L. Rose Williams, H. Yang, J. Zou, K. Zeng, Y. Zhu, Y. Chen and H. Chen, Bioresour. Technol., 2019, 278, 248–254 CrossRef CAS PubMed.
- J. Chen, T. Liang, J. Li, S. Wang, Z. Qin, P. Wang, L. Huang, W. Fan and J. Wang, ACS Catal., 2016, 6, 2299–2313 CrossRef CAS.
- Y. Li, X. Su, A. L. Maximov, X. Bai, Y. Wang, W. Wang, N. V. Kolesnichenko, Z. M. Bukina and W. Wu, Russ. J. Appl. Chem., 2020, 93, 137–148 CrossRef CAS.
- A. Marcilla, M. I. Beltrán and R. Navarro, Appl. Catal., B, 2009, 86, 78–86 CrossRef CAS.
- J. Liu, N. He, W. Zhou, L. Lin, G. Liu, C. Liu, J. Wang, Q. Xin, G. Xiong and H. Guo, Catal. Sci. Technol., 2018, 8, 4018–4029 RSC.
- P. Zhai, J. Zheng, J. Y. Zhang, H. Wang, Y. C. Qin, H. H. Liu and L. J. Song, J. Fuel Chem. Technol., 2021, 49, 1522–1530 CrossRef.
- M. S. Renzini, U. Sedran and L. B. Pierella, J. Anal. Appl. Pyrolysis, 2009, 86, 215–220 CrossRef CAS.
- J. Abbot and F. N. Guerzoni, Appl. Catal., A, 1992, 85, 173–188 CrossRef CAS.
- J. Jae, G. A. Tompsett, A. J. Foster, K. D. Hammond, S. M. Auerbach, R. F. Lobo and G. W. Huber, J. Catal., 2011, 279, 257–268 CrossRef CAS.
- N. Grittner, W. Kaminsky and G. Obst, J. Anal. Appl. Pyrolysis, 1993, 25, 293–299 CrossRef CAS.
- A. López, I. de Marco, B. M. Caballero, M. F. Laresgoiti, A. Adrados and A. Aranzabal, Appl. Catal., B, 2011, 104, 211–219 CrossRef.
- L. Dai, N. Zhou, H. Li, Y. Wang, Y. Liu, K. Cobb, Y. Cheng, H. Lei, P. Chen and R. Ruan, Sci. Total Environ., 2021, 771, 144995 CrossRef CAS PubMed.
- N. Lee, J. Joo, K. Y. A. Lin and J. Lee, Polymers, 2021, 13, 1198 CrossRef CAS PubMed.
- S. L. Wong, N. Ngadi, T. A. T. Abdullah and I. M. Inuwa, Fuel, 2017, 192, 71–82 CrossRef CAS.
Footnote |
| † Electronic supplementary information (ESI) available. See https://doi.org/10.1039/d2ra03541c |
| This journal is © The Royal Society of Chemistry 2022 |

