 Open Access Article
Creative Commons Attribution 3.0 Unported Licence
Rethinking the molecular structures of WVIOx sites dispersed on titania: distinct mono-oxo configurations at 430 °C and temperature-dependent transformations†
Theocharis
Kentri
ab,
Antonios
Trimpalis
a,
Adam
Misa
a,
Eleana
Kordouli
c,
Theodora
Ramantani
a and
Soghomon
Boghosian
 *abd
*abd
aDepartment of Chemical Engineering, University of Patras, Patras, Greece. E-mail: bogosian@chemeng.upatras.gr
bInstitute of Chemical Engineering Sciences, FORTH/ICE-HT, Patras, Greece
cDepartment of Chemistry, University of Patras, Patras, Greece
dSchool of Science and Technology, Hellenic Open University, GR-26335 Patras, Greece
First published on 6th April 2022
Abstract
The structural properties of the (WOx)n phase dispersed on TiO2 (P25, anatase) at surface densities of 0.5–4.5 W nm−2 (i.e. up to approximately a monolayer) were explored by using in situ Raman and FTIR spectroscopy, in situ Raman/18O exchange and Raman spectroscopy in static equilibrium at temperatures of 175–430 °C. Deciphering the temperature and coverage dependence of the spectral features under oxidative dehydration conditions showed that (i) the (WOx)n dispersed phase is heterogeneous at 430 °C consisting of two distinct mono-oxo species: Species-I with C3v-like O![[double bond, length as m-dash]](https://www.rsc.org/images/entities/char_e001.gif) W(–O–)3 configuration (W
W(–O–)3 configuration (W![[double bond, length as m-dash]](https://www.rsc.org/images/entities/char_e001.gif) O mode at 1009–1014 cm−1) and Species-II with C4v-like O
O mode at 1009–1014 cm−1) and Species-II with C4v-like O![[double bond, length as m-dash]](https://www.rsc.org/images/entities/char_e001.gif) W(–O–)4 configuration (W
W(–O–)4 configuration (W![[double bond, length as m-dash]](https://www.rsc.org/images/entities/char_e001.gif) O mode at 1003–1009 cm−1); (ii) the O
O mode at 1003–1009 cm−1); (ii) the O![[double bond, length as m-dash]](https://www.rsc.org/images/entities/char_e001.gif) W(–O–)3 site is formed with first order of priority and its formation ceases after the complete consumption of the most basic hydroxyls that are titrated first, hence is abundant at low coverage (<1.5 W nm−2); (iii) the O
W(–O–)3 site is formed with first order of priority and its formation ceases after the complete consumption of the most basic hydroxyls that are titrated first, hence is abundant at low coverage (<1.5 W nm−2); (iii) the O![[double bond, length as m-dash]](https://www.rsc.org/images/entities/char_e001.gif) W(–O–)4 site prevails over the O
W(–O–)4 site prevails over the O![[double bond, length as m-dash]](https://www.rsc.org/images/entities/char_e001.gif) W(–O–)3 site at medium to high coverage (≥2 W nm−2) and partially occurs in associated (polymerized) coverages above 2 W nm−2; (iv) lowering the temperature in the 430 → 250 → 175 °C sequence does not affect the structural and vibrational properties of O
W(–O–)3 site at medium to high coverage (≥2 W nm−2) and partially occurs in associated (polymerized) coverages above 2 W nm−2; (iv) lowering the temperature in the 430 → 250 → 175 °C sequence does not affect the structural and vibrational properties of O![[double bond, length as m-dash]](https://www.rsc.org/images/entities/char_e001.gif) W(–O–)3 but leads to the gradual transformation of the O
W(–O–)3 but leads to the gradual transformation of the O![[double bond, length as m-dash]](https://www.rsc.org/images/entities/char_e001.gif) W(–O–)4 site to a di-oxo (O
W(–O–)4 site to a di-oxo (O![[double bond, length as m-dash]](https://www.rsc.org/images/entities/char_e001.gif) )2W(–O–)3 site (with a symmetric stretching mode at ∼985 cm−1) and the partial association of adjacent O
)2W(–O–)3 site (with a symmetric stretching mode at ∼985 cm−1) and the partial association of adjacent O![[double bond, length as m-dash]](https://www.rsc.org/images/entities/char_e001.gif) W(–O–)4 units. All temperature-dependent structural/configurational transformations are fully reversible in the 430–175 °C range and are interpreted at the molecular level by a mechanism involving water molecules retained at the surface that act in a reversible temperature-dependent mediative manner resulting in hydroxylation (upon cooling, e.g. to 250 °C) and dehydroxylation (upon heating, e.g. to 430 °C). The Raman spectra obtained for the hydroxyl region confirm the successive hydroxylation/dehydroxylation steps during temperature cycles (e.g. 430 → 250 → 430 °C). One can tune the speciation of the dispersed (WOx)n phase under dehydrated conditions by appropriate control of temperature and coverage.
W(–O–)4 units. All temperature-dependent structural/configurational transformations are fully reversible in the 430–175 °C range and are interpreted at the molecular level by a mechanism involving water molecules retained at the surface that act in a reversible temperature-dependent mediative manner resulting in hydroxylation (upon cooling, e.g. to 250 °C) and dehydroxylation (upon heating, e.g. to 430 °C). The Raman spectra obtained for the hydroxyl region confirm the successive hydroxylation/dehydroxylation steps during temperature cycles (e.g. 430 → 250 → 430 °C). One can tune the speciation of the dispersed (WOx)n phase under dehydrated conditions by appropriate control of temperature and coverage.
1. Introduction
A wide range of reactions in industrial and environmental catalysis benefit from the formidable mix of strong acid and modest redox properties of titania-supported tungsta catalysts. Applications worth mentioning are—although not restricted to—photocatalytic processes, e.g. the photooxidation of methane,1 the photodecompositions of 1,4 dichlorobenzene2 and 4-nitrophenol,3 olefin processing reactions4 and environmental processes such as the NH3/SCR of NOx,5–7 the abatement of chlorinated VOCs and CFC-128,9 and sorbitol transformation into biofuels.10 A very recent review summarises the applications of tungsten oxide–based catalysts in environmental catalysis.11The behavior of tungsta/titania as a catalyst is directly connected to the configuration and molecular structure of the oxo-WVI phase, (WOx)n, dispersed on the titania support surface. The literature on catalysis science abounds with studies of the molecular structure of dispersed acidic oxometallic (MOx)n sites (M = transition metal, e.g. V, Mo, W, and Re) and many pertinent reviews are available.12–24 Despite the extent of the literature, the reports on key aspects such as the termination configuration (i.e. discriminating between the mono-oxo, di-oxo and/or trioxo termination configurations) of dehydrated MOx sites and the eventual heterogeneity of the dispersed oxometallic phase (i.e. the occurrence of more than one prevailing species within the deposited phase) are not in consensus. Diverging views and statements based on fragmented evidence and/or arbitrarily oversimplified generalizations have created a real puzzle. For example, an old, “established” view has been claiming that thermodynamic constraints drive the formation of the prevailing configurations and structures of transition metal oxide species dispersed on oxide supports and that the configurations and structures obtained by the deposited oxometallic sites are reported as independent of the catalyst preparation routes.20,21,24,25 However, the preparation method affects the molecular structure of the deposited e.g. (WOx)n phase, particularly when advanced synthesis routes based on molecular approaches are followed, thereby in some cases enabling catalyst design.15,26,27 In addition, it has been reported, without sufficient evidence, that the prevalent configurations obtained after calcination by the deposited species do not revert/change with temperature under dehydrating conditions,16–25 despite the sound evidence to the contrary documented in scarce reports.28 Recently, however, we have provided strong evidence that controverts the soundness of the above statement and showed that a temperature-dependent transformation takes place under dehydrated conditions between the sites of distinct configurations in rhenia supported on TiO2 and low-loaded tungsta and molybdena supported on TiO2.29–31
Literature reports pertaining to the molecular structure of the (WOx)n/TiO2 system are far from being in consensus. An early in situ Raman work, with the spectra recorded after cooling to 80 °C, on 1–10 wt% WO3 on TiO2(P25) samples made by incipient wetness impregnation32 reports the existence of one single band at 1010 cm−1 in the W![[double bond, length as m-dash]](https://www.rsc.org/images/entities/char_e001.gif) O stretching region at all weight loadings, which is ascribed to the existence of one single species. A second in situ Raman report33 based on the same samples and the same spectra as ref. 32 enriches the interpretation supporting the mono-oxo configuration, based on the correspondence of the Raman and IR W
O stretching region at all weight loadings, which is ascribed to the existence of one single species. A second in situ Raman report33 based on the same samples and the same spectra as ref. 32 enriches the interpretation supporting the mono-oxo configuration, based on the correspondence of the Raman and IR W![[double bond, length as m-dash]](https://www.rsc.org/images/entities/char_e001.gif) O stretching wavenumbers. The claim for the existence of one single band appears to be abandoned later when a poorly resolved band in the W
O stretching wavenumbers. The claim for the existence of one single band appears to be abandoned later when a poorly resolved band in the W![[double bond, length as m-dash]](https://www.rsc.org/images/entities/char_e001.gif) O stretching region of in situ Raman spectra (recorded however at 25 °C, after cooling) is reported at 1007 cm−1 for 2.7 W nm−2 and 1011 cm−1 for 4 W nm−2 WO3/TiO2(P25) samples made by incipient wetness impregnation.34 An in situ structural analysis by XANES/EXAFS showed that under dehydrated conditions, wolfram is in the hexavalent state in the form of WVIO5 and WVIO4 units dispersed on TiO2(P25) in mono-oxo W
O stretching region of in situ Raman spectra (recorded however at 25 °C, after cooling) is reported at 1007 cm−1 for 2.7 W nm−2 and 1011 cm−1 for 4 W nm−2 WO3/TiO2(P25) samples made by incipient wetness impregnation.34 An in situ structural analysis by XANES/EXAFS showed that under dehydrated conditions, wolfram is in the hexavalent state in the form of WVIO5 and WVIO4 units dispersed on TiO2(P25) in mono-oxo W![[double bond, length as m-dash]](https://www.rsc.org/images/entities/char_e001.gif) O configuration with the W–O–W interlinking bridges and WO5 units prevailing over their WO4 counterparts with increasing loading.35 The use of a one-pot co-precipitation synthesis route led, based on X-ray absorption and vibrational (infrared and in situ Raman combined with 18O/16O exchange) spectroscopy, to the first report on the heterogeneity of dispersed (WOx)n on TiO2 with two distinctly observed tungstate species (bands at 978 and 1016 cm−1) forming an overlayer on TiO2
O configuration with the W–O–W interlinking bridges and WO5 units prevailing over their WO4 counterparts with increasing loading.35 The use of a one-pot co-precipitation synthesis route led, based on X-ray absorption and vibrational (infrared and in situ Raman combined with 18O/16O exchange) spectroscopy, to the first report on the heterogeneity of dispersed (WOx)n on TiO2 with two distinctly observed tungstate species (bands at 978 and 1016 cm−1) forming an overlayer on TiO2![[thin space (1/6-em)]](https://www.rsc.org/images/entities/char_2009.gif) 36 even at surface densities exceeding the reported34 monolayer coverage of ∼4.5 W nm−2. Onfroy et al. and Lebarbier et al. reported the amorphous nature of the deposited oxo-WVI phase on titania up to 4.4 W nm−2 and a correlation between the abundance of Brønsted acid sites, which reportedly prevail above 1.3 W nm−2, and the catalytic activity towards isopropanol dehydration and n-hexane isomerization.37,38 An elegant spectroscopic study combining IR and Raman work examined the effect of surface density in the range of 0.6–3.4 W nm−2 for WOx/TiO2(P25) catalysts and proposed the occurrence of three distinct mono-oxo species (bands at 1004, 1012 and 1017 cm−1), albeit the spectroscopic measurements were undertaken after cooling, under controlled atmosphere.39 The formation of two distinct surface mono-oxo WO5 species has also been confirmed recently by adopting a co-precipitation method in the catalyst synthesis route,40 although providing an alternative interpretation viewing angle, to be discussed below.
36 even at surface densities exceeding the reported34 monolayer coverage of ∼4.5 W nm−2. Onfroy et al. and Lebarbier et al. reported the amorphous nature of the deposited oxo-WVI phase on titania up to 4.4 W nm−2 and a correlation between the abundance of Brønsted acid sites, which reportedly prevail above 1.3 W nm−2, and the catalytic activity towards isopropanol dehydration and n-hexane isomerization.37,38 An elegant spectroscopic study combining IR and Raman work examined the effect of surface density in the range of 0.6–3.4 W nm−2 for WOx/TiO2(P25) catalysts and proposed the occurrence of three distinct mono-oxo species (bands at 1004, 1012 and 1017 cm−1), albeit the spectroscopic measurements were undertaken after cooling, under controlled atmosphere.39 The formation of two distinct surface mono-oxo WO5 species has also been confirmed recently by adopting a co-precipitation method in the catalyst synthesis route,40 although providing an alternative interpretation viewing angle, to be discussed below.
Hence, despite the extensive extant literature, the molecular structures, the site configurations, coordination and aspects related to the occurrence of multiple sites with distinct configurations are not fully resolved and understood. A plethora of published spectroscopic work suffers from one or more deficiencies including e.g. relying on only one or two samples with loading below monolayer coverage, undertaking “in situ” spectroscopic measurements at one single temperature or after cooling the samples (in which case the state of sample dehydration is questioned), performing fast spectroscopic measurements without being concerned with steady-state attainment etc.
The scope of the present work is to deploy the tools of in situ vibrational (Raman and FTIR) spectroscopy combined with 18O/16O isotope exchange for studying the molecular structures and termination configurations of WOx sites dispersed on two variations of titania (P25 and anatase) under dehydrated conditions in the temperature range of 175–470 °C and in the entire submonolayer surface density range of 0.5–4.5 W nm−2. The study is complemented by neoteric30 Raman measurements in sealed quartz cells under static equilibrium. The results point towards rethinking the molecular structure of the dispersed WVIOx phase with respect to its heterogeneity and temperature dependence of its molecular structure.
2. Experimental section
2.1 Synthesis and textural analyses of WOx/TiO2 materials
Two variations of titanium dioxide were used as supports, Degussa P25 (surface area of 49 m2 g−1; consisting of 80 wt% anatase and 20% rutile with a surface composition of 90% anatase and 10% rutile) and anatase (Alfa Aesar, surface area: 127 m2 g−1). The tungsta/titania samples were synthesised by wet impregnation using (NH4)10W12O41·5H2O (Alfa Aesar, 99.999% metal basis) as the precursor and previously calcined (480 °C, 4 h) supports. The concentration of the aqueous precursor solutions was adjusted to correspond to the desired W loading (see Table 1). During the stages of precursor dissolution and support impregnation (both procedures lasted for 1 h under agitation), the pH of the solutions and suspensions was continuously measured and controlled to 7.5. In the applied concentration region of CW(VI) = 0.9 × 10⁻³–1.3 × 10⁻² M and for pH = 7.5, the oxo-WVI species in the electrolyte solutions as well as in the titania/electrolyte interface are exclusively in the mononuclear monomeric tetrahedral form.41,42 The support/precursor solution suspensions were then heated under mixing at 45 °C for 1 h and subjected to rotary evaporation under reduced pressure at 45 °C for removing the solvent. The final samples were obtained after overnight drying at 120 °C and calcination at 480 °C for 4 h in a muffle furnace under static air.| Catalysts | n s (W nm−2) | Loading (wt% W) | S BET (m2 g−1) | C W(VI) (M) | Sealed cells # | Support |
|---|---|---|---|---|---|---|
| 0.51WTiO2(P25) | 0.51 | 0.81 | 52 | 9 × 10⁻⁴ | P25 | |
| 1.2WTiO2(P25) | 1.2 | 1.67 | 47 | 1.9 × 10⁻³ | 3, 8 | P25 |
| 2.1WTiO2(P25) | 2.1 | 3.32 | 51 | 3.6 × 10⁻³ | 11 | P25 |
| 2.5WTiO2(P25) | 2.5 | 3.90 | 52 | 4.3 × 10⁻³ | P25 | |
| 3.4WTiO2(P25) | 3.4 | 5.35 | 52 | 5.9 × 10⁻³ | 4, 7 | P25 |
| 4.2WTiO2(P25) | 4.2 | 6.33 | 50 | 7.0 × 10⁻³ | P25 | |
| 0.54WTiO2(a) | 0.54 | 1.56 | 94 | 1.7 × 10⁻³ | Anatase | |
| 1.1WTiO2(a) | 1.1 | 3.17 | 94 | 3.4 × 10⁻³ | 5 | Anatase |
| 2.2WTiO2(a) | 2.2 | 6.34 | 93 | 6.9 × 10⁻³ | 12 | Anatase |
| 2.6WTiO2(a) | 2.6 | 7.14 | 91 | 7.8 × 10⁻³ | Anatase | |
| 3.6WTiO2(a) | 3.6 | 9.52 | 86 | 1.04 × 10⁻² | 6 | Anatase |
| 4.6WTiO2(a) | 4.6 | 11.90 | 85 | 1.29 × 10⁻² | Anatase |
The BET specific surface area (SBET) of the calcined samples was determined by nitrogen adsorption–desorption, as earlier described.42 The samples’ coverage, ns, expressed in the form of W surface density (W nm−2) was determined based on the wt% W loading and the SBET. The pertinent results are compiled in Table 1 together with other characteristics. Each calcined catalyst sample is denoted as xWTiO2(P25) or xWTiO2(a) where x is the W surface density (W nm−2). The following formula is used for calculating the W surface density (W nm−2):
2.2 Raman spectroscopy and protocols of measurements
Each sample was first heated under flowing (30 cm3 min−1) 20% O2/He gas mixture at 430 °C for 1 h and the in situ Raman spectra were recorded under dehydrated conditions at 430 °C. The gases used were He (99.999%) and O2 (99.995%) from L'Air Liquide and the incoming feed gas stream was passed through molecular sieve traps to eliminate any traces of moisture. The temperature was then lowered to 250 °C and 175 °C and in situ Raman spectra were recorded after subjecting the sample for 1 h and 45 min at each temperature under flowing 20% O2/He gas. Subsequently, the sample was reheated to 430 °C and the reinstatement of the initial structural condition could be verified by reproducing the in situ Raman spectrum at 430 °C. Alternative sequences of temperatures have been tested (always starting at 430 °C, i.e. 430 °C → 175 °C → 250 °C, 430 °C → 175 °C → 120 °C → 250 °C etc.) and the in situ Raman spectra could always be reproduced. To achieve a satisfactory signal-to-noise ratio, a slow scanning protocol of 1.2 s of photon counting per point in 0.25 cm−1 increments was applied, thereby giving rise to a 1.5 h duration per recording. To account for the “path length” effect resulting from the variations in sample coverage (0.5–4.5 W nm−2), the Raman spectra were normalized, as described earlier.30,44
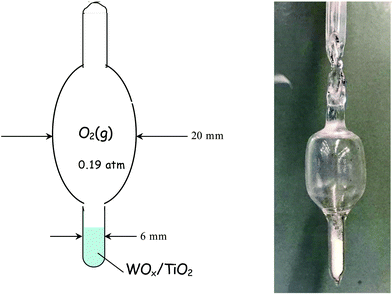 | ||
| Fig. 1 Diagram and actual picture of a quartz cell used for measuring Raman spectra under static equilibrium. The cell is sealed under O2(g), pO2 = 0.19 atm. | ||
In a typical experiment, 100 mg of each studied WOx/TiO2(P25 or anatase) catalyst was filled into the cell that was then attached to the vacuum line, which is suitable also for gas additions. The cell was evacuated (p = ∼1.3 × 10⁻⁴ atm) and a cylindrical furnace was subsequently connected around the cell. The sample containing cell was then heated at 200 °C and subjected to evacuation for 1 h, while maintaining the vacuum line trap immersed in liquid nitrogen (77 K). The main valve connecting the vacuum pump was then closed, the furnace surrounding the cell was removed, oxygen gas (99.999%) was injected into the evacuated line at a pressure of 0.19 atm (i.e. the vapor pressure of oxygen at 77 K) and finally the cell stem was sealed off by means of a propane/oxygen torch. Several such “static” cells were made and WOx/TiO2 catalysts with representative coverages were sampled as listed in Table 1. The purpose of designing the static equilibrium experiments was twofold: first, we wanted to demonstrate that the temperature-dependent structural evolution reported is not due to humidity incoming with the gas feed, and second, we wanted to check the effect of limiting the amount of water retained directly by the surface and examine if this could inhibit the temperature-dependent changes observed.
A description of the optical furnace used for recording Raman spectra under static equilibrium has been given earlier.47,48 The Raman spectra under static equilibrium were obtained using the linearly polarized 532.0 nm green line of a Spectra-Physics Excelsior DPSS laser operated at a power level of ∼20 mW on the sample (defocused in order to reduce sample irradiance). The scattered light was passed through a notch filter to reject Rayleigh scattering. The Raman spectra were recorded in a 90° geometry using a collecting lens system (90 and 150 mm FL) coupled to a monochromator (IHR-320 JY, ISA-Horiba group) and equipped with a CCD detector thermoelectrically cooled to −70 °C. The resolution of the instrument was set at 2 cm−1. Each cell was first heated to 430 °C and the Raman spectra under static equilibrium were recorded at a sequence of decreasing temperatures. The Raman setup used for the measurements under static equilibrium has been described earlier.49
2.3 In situ FTIR spectra
In situ FTIR spectra at temperatures ranging from 175–430 °C under flowing (30 cm3 min−1) 2% O2/He were recorded in order to complement the in situ Raman spectra. The FTIR spectrometer used was a Nicolet 6700 equipped with a DRIFT cell from Spectra Tech, an MCTB detector and a KBr beam splitter. The sample treatment protocol was identical to the one followed for recording the in situ Raman spectra. Before recording each spectrum, each studied sample was subjected to the applied temperature and gas atmosphere conditions for 1 h and 45 min. In situ FTIR spectra were also recorded under flowing 20%O2/He and were similar (though of lower signal-to-noise ratio) to the ones reported. Due to the strong absorption in the wavenumber range of fundamental W![[double bond, length as m-dash]](https://www.rsc.org/images/entities/char_e001.gif) O stretching, the corresponding overtone region of the in situ FTIR spectra is explored.
O stretching, the corresponding overtone region of the in situ FTIR spectra is explored.
3. Results
3.1 Vibrational (Raman and FTIR) spectra of WOx/TiO2 (P25 and anatase) catalysts under oxidative dehydration conditions—Temperature dependence and effect of coverage
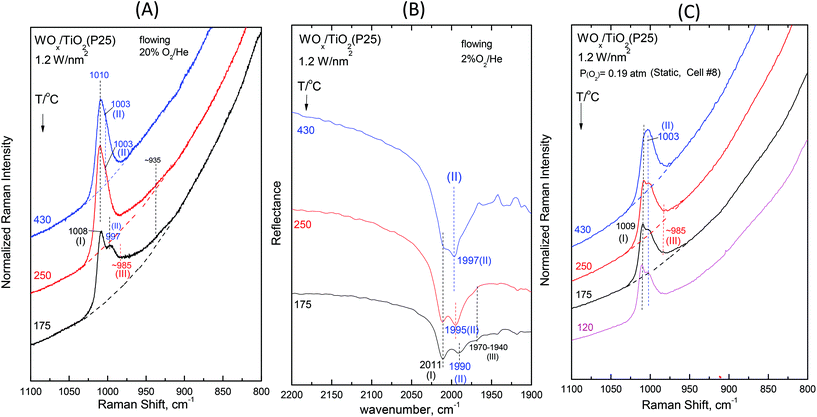
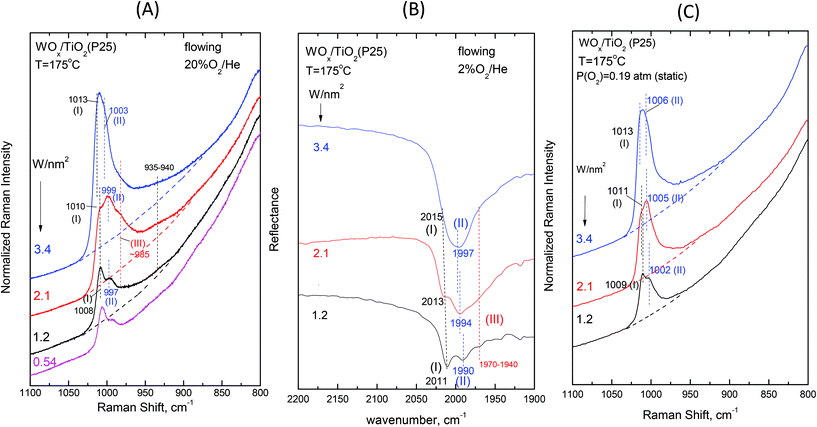
Fig. 2–7 (panels (A) and (B)) show the temperature dependence of the in situ Raman and in situ FTIR spectra obtained for the WOx/TiO2(P25) and WOx/TiO2(anatase) catalysts under flowing O2/He gas in the temperature range of 430–175 °C at representative constant coverages of 1.2 W nm−2 on P25 (Fig. 2), 1.1 W nm−2 on anatase (Fig. 3), 2.1 W nm−2 on P25 (Fig. 4), 2.2 W nm−2 on anatase (Fig. 5), 3.4 W nm−2 on P25 (Fig. 6) and 3.6 W nm−2 on anatase (Fig. 7), i.e. at low, intermediate and high coverage for both studied systems. The left panels (i.e.Fig. 2(A)–7(A)) pertain to in situ Raman spectra whilst the middle panels (i.e.Fig. 2(B)–7(B)) show the counterpart in situ FTIR spectra. Notably, the spectra are recorded at a sequence of decreasing temperatures. Before recording each in situ spectrum at 250 and/or 175 °C, each sample was treated at 430 °C for 0.5 h, the in situ spectrum was recorded at 430 °C and then temperature was lowered to 250 and/or 175 °C and allowed to attain the steady state. The observed changes are fully reversible, i.e. upon reheating each sample at 430 °C under flowing O2/He gas, the respective spectral features are fully reinstated. Fig. 2(C)–7(C) (i.e. the right panels) show the respective Raman spectra obtained under static equilibrium conditions in sealed quartz cells.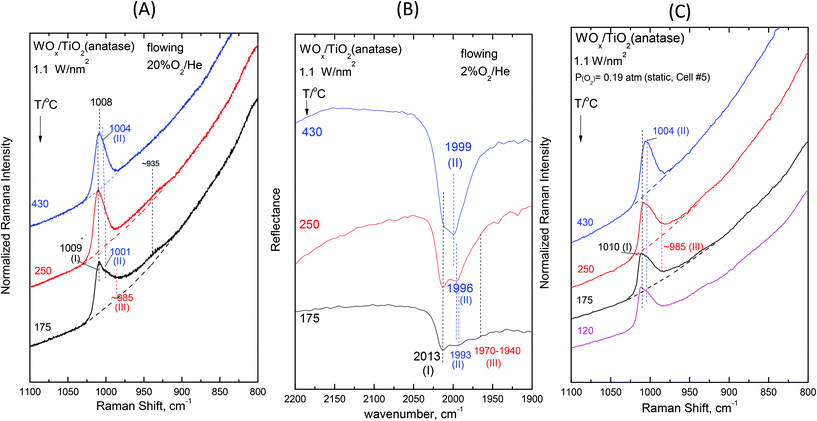 | ||
| Fig. 3 WOx/TiO2(anatase) with a surface density of 1.1 W nm−2: (A)–(C): see Fig. 2 caption. | ||
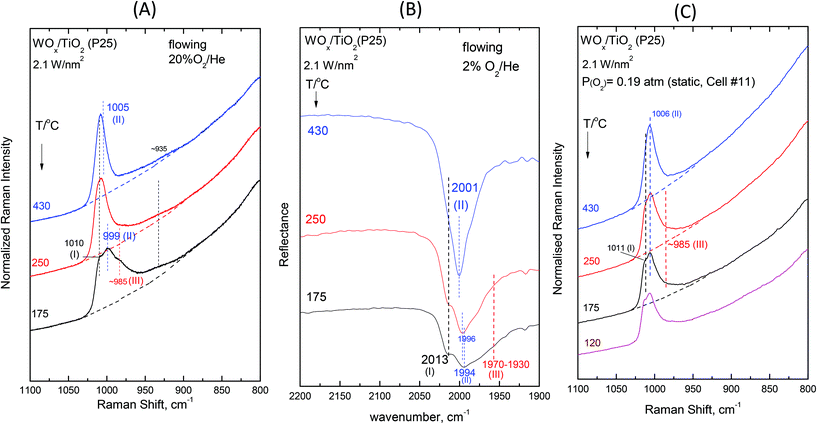 | ||
| Fig. 4 WOx/TiO2(P25) with a surface density of 2.1 W nm−2: (A)–(C): see Fig. 2 caption. | ||
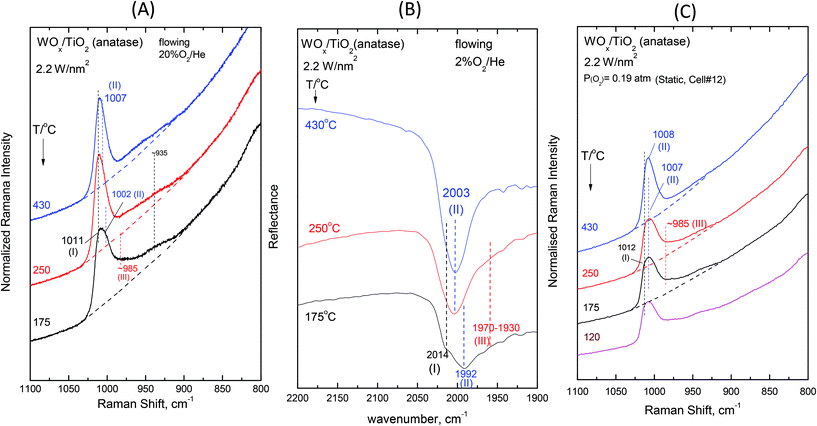 | ||
| Fig. 5 WOx/TiO2(anatase) with a surface density of 2.2 W nm−2: (A)–(C): see Fig. 2 caption. | ||
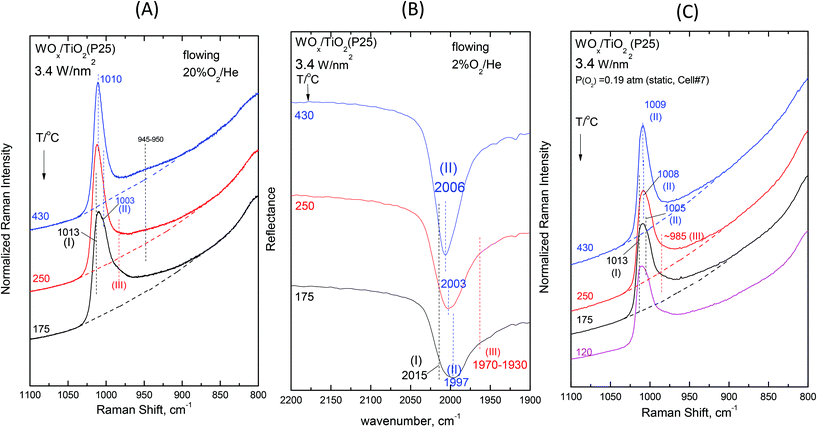 | ||
| Fig. 6 WOx/TiO2(P25) with a surface density of 3.4 W nm−2: (A)–(C): see Fig. 2 caption. | ||
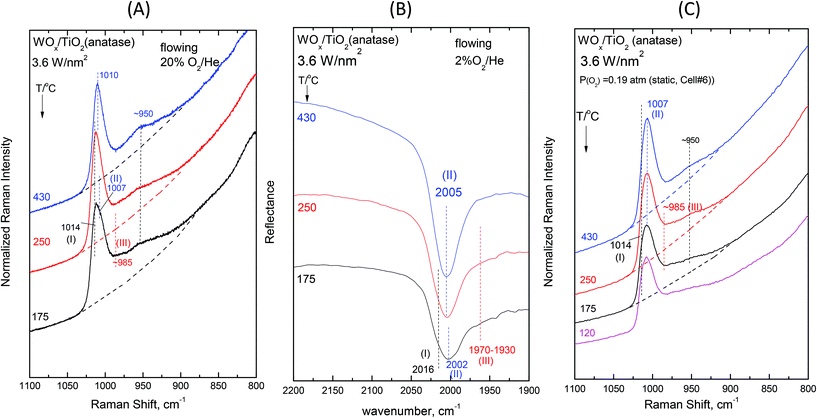 | ||
| Fig. 7 WOx/TiO2(anatase) with a surface density of 3.6 W nm−2: (A)–(C): see Fig. 2 caption. | ||
The effect of temperature shows trends that are mutatis mutandis common to both types of carriers (i.e. WOx/P25 and WOx/anatase samples) and all coverages in the range of 1.1–3.6 W nm−2 for the in situ Raman and in situ FTIR spectra displayed in Fig. 2–7 (panels (A) and (B)). As far as the extent of the observed effects is concerned, the latter varies slightly in coverage and type of carrier, as described below. A comparison between the in situ Raman spectra (Fig. 2(A)–7(A)) with the corresponding static Raman spectra (Fig. 2(C)–7(C)) shows (as further described and discussed below) that the structural changes taking place upon cooling are indeed partly inhibited after heating the samples in vacuo at 200 °C for 1 h and sealing their container cells under oxygen (pO2 = 0.19 atm).
Additional subtle changes taking place upon cooling in the in situ Raman spectra (Fig. 2(A)–3(A)) pertain to the appearance and gradual growth of a weak and broad peak mass at ∼935 cm−1. This event proceeds parallel to the weakening and gradual shift of band (II).
We now turn our attention to a comparison between the in situ Raman spectra (Fig. 2(A)–3(A)) and the corresponding static equilibrium Raman spectra shown in Fig. 2(C)–3(C). A diversified behavior is observed when studying the spectral changes taking place upon cooling the sealed cells #8 and #5 containing the low-loaded samples (see Table 1). Upon cooling, band (II) initially weakens without undergoing any redshift and eventually its intensity remains stable. Concomitantly, i.e. with decreasing temperatures, band (I) becomes prevalent without gaining intensity. Moreover, in agreement with the in situ conditions (panels (A)), the emergence of Species-III is (albeit to a limited extent) evidenced in the low-temperature region under static conditions (panels(C)). However, the observed changes do not show further progress below 250 °C. The spectra obtained at 120 °C are also shown to strengthen the last statement.
The non-single character of the observed Raman band at 430 °C is once again ascertained from the in situ FTIR spectra due to the doubling of the distance between the component bands in the overtone region. In addition, with decreasing temperature, the in situ FTIR spectra clearly confirm the emergence and clear appearance of the Species-I band and cross-check the emergence of the Species-III peak mass at 175 °C. Significantly, the peak mass assigned to Species-III spreads to ∼1930 cm−1 in the IR overtone region, thereby implying the activity of a vibrational stretching mode that is less active in the Raman spectra, as further discussed below.
The spectral changes that take place upon cooling under static equilibrium conditions (Fig. 4(C) and 5(C), cells #11 and #12) follow similar trends to the ones described in the context of Fig. 2(C) and 3(C), i.e. band (I) undergoes neither an intensity change upon cooling to 250 °C and 175 °C nor any shift but band (II) relatively weakens with decreasing temperature. In addition, the weakening of band (II) goes along with the emergence of a peak mass ascribed to the formation of Species-III. Moreover, in this case (i.e. intermediate coverage), the observed changes appear to terminate upon cooling to 250 °C.
![[double bond, length as m-dash]](https://www.rsc.org/images/entities/char_e001.gif) O modes that give rise to closely packed overlapping bands. In addition, a broadband at ∼945–950 cm−1 extant already at 430 °C, progressively gains intensity upon cooling. Remarkably, the ∼945–950 cm−1 band is stronger for the anatase-supported sample compared to its P25-supported counterpart.
O modes that give rise to closely packed overlapping bands. In addition, a broadband at ∼945–950 cm−1 extant already at 430 °C, progressively gains intensity upon cooling. Remarkably, the ∼945–950 cm−1 band is stronger for the anatase-supported sample compared to its P25-supported counterpart.
The changes in the Raman spectra upon cooling under static equilibrium conditions (Fig. 6(C) and 7(C), cells #7 and #6) are in agreement with the trends described for lower loaded samples (Fig. 2(C)–5(C)), i.e. the Species-II band gradually weakens and the Species-I band emerges. Therefore, the high wavenumber component of the convoluted band becomes more prominent. Moreover, clear evidence for the formation of Species-III is obtained, thereby confirming that Species-III is formed with decreasing temperature at the expense of Species-II.
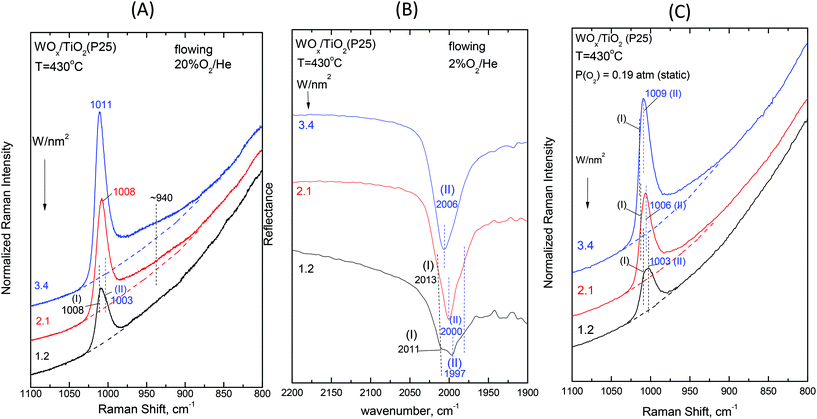 | ||
| Fig. 8 Dependence on surface coverage for WOx/TiO2(P25) at T = 430 °C. (A) In situ Raman spectra obtained under flowing 20%O2/He for samples with W surface densities (W nm−2) as indicated by each spectrum; spectral conditions: see Fig. 2(A) caption. (B) In situ FTIR spectra obtained under flowing 2%O2/He for samples with W surface densities (W nm−2) as indicated by each spectrum. (C) Raman spectra at static equilibrium under pO2 = 0.19 atm for samples with W surface densities (W nm−2) as indicated by each spectrum; spectral parameters: see Fig. 2(C) caption. | ||
 | ||
| Fig. 9 Dependence on surface coverage for WOx/TiO2(P25) at T = 175 °C. (A)–(C): see Fig. 8 caption. | ||
3.2 Surface hydroxyl groups—temperature and coverage effects
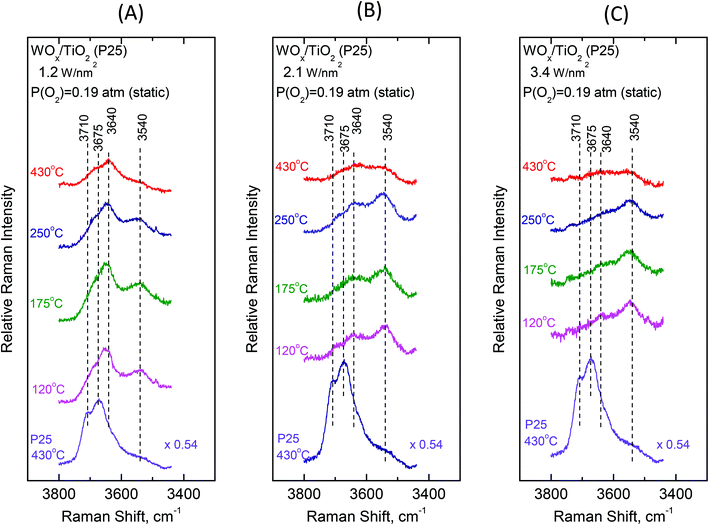
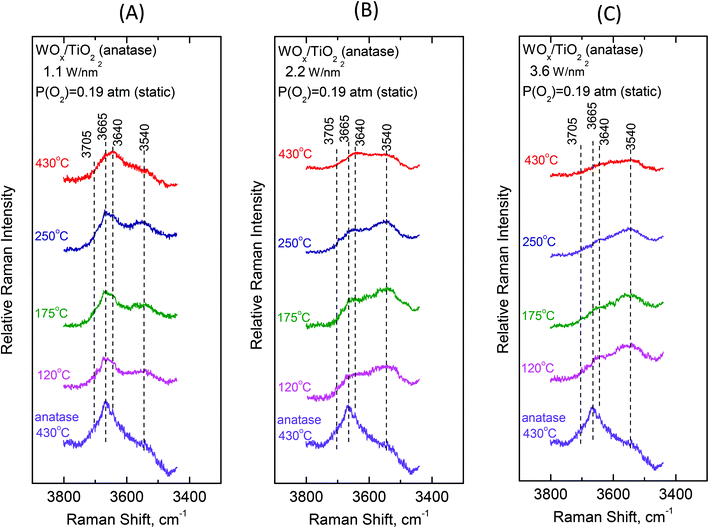
To gain insight into the mechanisms governing the configurational changes that affect the vibrational properties of the dispersed WOx phase, it is of importance to also address the spectral region of the surface hydroxyls. The vibrational properties of the surface hydroxyls on titanium dioxides have been extensively studied under dehydrated conditions, primarily by means of infrared spectroscopy. Worth mentioning are the often-referred pioneer studies of Primet et al.50 and Busca et al.51 In contrast, the Raman spectra of titania surface hydroxyls under dehydrated conditions are scarce.52 Most commonly, the OH stretching region of 3500–3750 cm−1 is explored.50–53 The Ti–O(H) Raman stretching vibrations are masked by strong bands due to bulk titania; however, meticulous studies addressing the difference in Raman spectra were able to discern the Ti–O(H) stretching bands due to the isolated (∼700 cm−1) and geminal (∼800 cm−1) hydroxyls.54Fig. 10 and 11 portray the temperature dependence of the Raman spectra obtained under static equilibrium in the wavenumber region pertaining to the OH groups. Fig. 10 pertains to the WOx/TiO2(P25) samples with coverages of 1.2 W nm−2 (panel Fig. 10(A)), 2.1 W nm−2 (panel Fig. 10(B)) and 3.4 W nm−2 (panel Fig. 10(C)), respectively. Correspondingly, Fig. 11 pertains to the WOx/TiO2(anatase) samples with coverages of 1.1 W nm−2 (panel Fig. 11(A)), 2.2 W nm−2 (panel Fig. 11(B)) and 3.6 W nm−2 (panel Fig. 11(C)), respectively. The Raman spectrum obtained for the pure support materials under static equilibrium at 430 °C (i.e. in cells containing pure TiO2(P25) and TiO2(anatase) sealed under 0.19 atm of O2(g)) is included in each panel for reference. Four bands due to hydroxyl species can be discerned in the Raman spectra of each support type under O2(g) at 430 °C, albeit with different relative intensities. The bands at 3710, 3675, 3640 and 3540 cm−1 are assigned to surface hydroxyls on the P25 carrier (spectra (a) in panels 10(A), 10(B) and 10(C)), whilst the bands at ∼3705, 3665, 3640 and 3540 cm−1 due to hydroxyl species are observed for the counterpart anatase support (spectra (a) in panels 11(A), 11(B) and 11(C)).
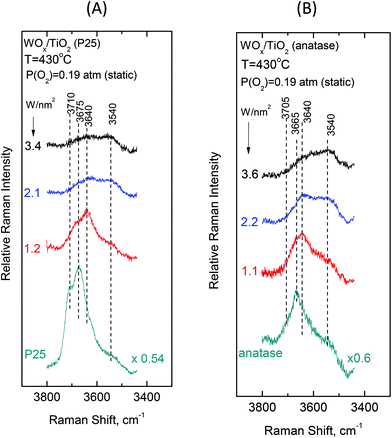
Fig. 12 (panels (A) and (B)) shows the effect of coverage on the Raman spectra under static equilibrium at a constant temperature of 430 °C and sheds light on the progressive consumption of surface hydroxyls with increasing WOx coverage. The titration of surface hydroxyls and deposition of WOx species results in the diminishing of hydroxyl groups and condensation of water molecules that remain on the surface by hydrogen bonds.27,30 Hence, with increasing coverage a gradual weakening of the hydroxyl bands is observed as shown in Fig. 12. Significantly, the OH band intensities are not attenuated simultaneously, but in a specific order of priority as follows. In the case of P25-supported materials (Fig. 12, panel(A)), the OH group represented by the 3710 cm−1 band is selectively titrated first and it nearly disappeared for coverage of 1.2 W nm−2, followed by the OH group represented by the 3675 cm−1 band and finally the 3640 cm−1 band is also eventually diminished, whilst the 3540 cm−1 OH band is not at all affected during the deposition. Likewise, a corresponding order of priority is evidenced in the attenuation of the OH bands with increasing WOx coverage for the anatase-supported catalysts (Fig. 12, panel(B)), namely the ∼3705 cm−1 band is attenuated first, followed by the 3665 cm−1 band and then by the 3640 cm−1 band whereas the 3540 cm−1 band does not undergo any weakening with increasing coverage. Notably, a similar order of priority of OH band attenuation as a function of coverage has been reported in in situ FTIR studies of vanadia/titania catalysts.28,55 Finally, it is worth pointing out that lower basicity for surface hydroxyls is evidenced for the anatase-supported samples compared to their P25-supported counterparts, thereby accounting the lower respective band wavenumber52 for the respective hydroxyls (3705 vs. 3710 cm−1 and 3665 vs. 3675 cm−1).
Significantly, the order of priority for the hydroxyl bands’ intensities’ diminishing with increasing WOx coverage at 430 °C is in perfect agreement with the corresponding order of WOx species appearance and evolution of species’ prevalence as a function of coverage. Hence, the diminishing of the 3710/3705 cm−1 hydroxyl band (due to the type-I terminal and the most basic OH group52 that is titrated first, vide infra) at low coverage is accompanied by the appearance and significant presence of Species–I, whilst the successive diminishing of the 3675/3665 and 3640 cm−1 bands (due to the OH groups of lower basicity and the type-II hydroxyls,52vide infra) comes along with the appearance and progressive prevalence of Species–II with increasing WOx coverage (see Fig. 8 and 9 and Fig. S1–S4†). Notably, the formation of Species–I ceases upon the elimination of the 3710/3705 cm−1 OH band, which is further discussed below.
3.3 18O/16O isotope exchange and in situ Raman spectra
Examining the vibrational isotope effects and the band splitting pattern caused by the 18O/16O isotope exchange can shed light on the termination configuration of the dispersed oxometallic sites.13,23 The present isotope exchange study is limited to the temperature of 470 °C that is required in order to attain a satisfactory reduction of the dispersed WVIOx species under flowing 5% H2/He for 20 min which would enable 18O/16O exchange by reoxidation under flowing 2% 18O2/He for 10 min (i.e. the two steps comprise one isotope exchange redox cycle). As described above, at high temperatures (i.e. at 430 °C and a fortiori at 470 °C) Species-I is prevalent at low coverage and Species-II prevails at high coverage. Hence, the oxygen-isotope-exchange Raman measurements primarily contribute to determine the termination configuration of the high-temperature prevailing species in each case. Therefore, representative samples of low and high surface densities (i.e. ∼0.5 W nm−2 and ∼3.5 W nm−2) were chosen for the isotope exchange study and Fig. 13 and 14 show the pertinent results.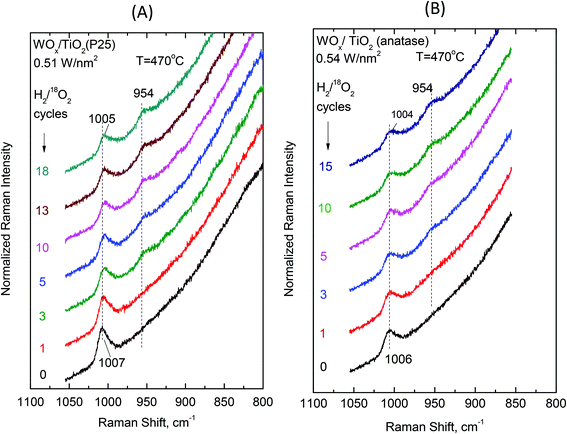 | ||
| Fig. 13 (A) WOx/TiO2(P25) with surface density of 0.51 W nm−2 and (B) WOx/TiO2(anatase) with a surface density of 0.54 W nm−2. Sequential in situ Raman spectra obtained under flowing (10 cm3 min−1) 2% 18O2/He after subsequent H2/18O2 reduction/oxidation isotope exchange cycles as indicated by each spectrum. Recording parameters: see Fig. 2(A) caption. | ||
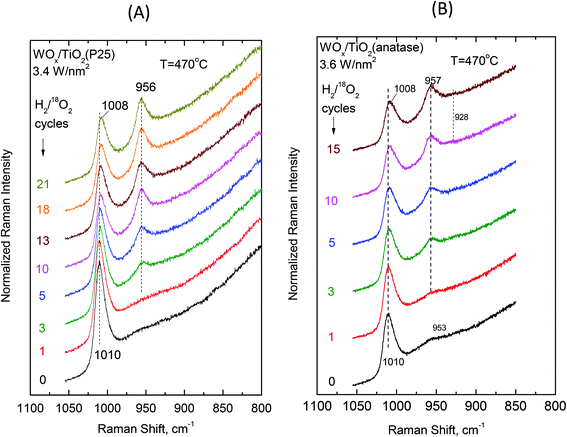 | ||
| Fig. 14 (A) WOx/TiO2(P25) with a surface density of 3.4 W nm−2 and (B) WOx/TiO2(anatase) with a surface density of 3.6 W nm−2. Sequential in situ Raman spectra obtained under flowing (10 cm3 min−1) 2% 18O2/He after subsequent H2/18O2 reduction/oxidation isotope exchange cycles as indicated by each spectrum. Recording parameters: see Fig. 2(A) caption. | ||
Single isotopic splitting is observed for all the samples subjected to oxygen isotopic substitution studies, i.e. 0.51 WOx/TiO2(P25), 0.54 WOx/TiO2(a), 3.4 WOx/TiO2(P25) and 3.6 WOx/TiO2(a). One single symmetric band due to W![[double bond, length as m-dash]](https://www.rsc.org/images/entities/char_e001.gif) 18O stretching emerges for all the samples at a fixed wavenumber in each case. Progress in the extent of the gradual 18O/16O isotope exchange is completed under the applied conditions after 13–15 isotope exchange redox cycles. Moreover, worth mentioning is a gradual slight redshift (ca. 2 cm−1) of the W
18O stretching emerges for all the samples at a fixed wavenumber in each case. Progress in the extent of the gradual 18O/16O isotope exchange is completed under the applied conditions after 13–15 isotope exchange redox cycles. Moreover, worth mentioning is a gradual slight redshift (ca. 2 cm−1) of the W![[double bond, length as m-dash]](https://www.rsc.org/images/entities/char_e001.gif) 16O mode due to the remaining (i.e. non-substituted) W
16O mode due to the remaining (i.e. non-substituted) W![[double bond, length as m-dash]](https://www.rsc.org/images/entities/char_e001.gif) 16O sites that can be discerned with the help of the corresponding vertical inspection lines in Fig. 13 and 14.
16O sites that can be discerned with the help of the corresponding vertical inspection lines in Fig. 13 and 14.
4. Discussion
The heterogeneity of the WOx amorphous phase dispersed on titania supports (P25 and anatase) has preliminarily been addressed in previous reports.29,30 The unprecedented effect of tunable speciation of the dispersed heterogeneous oxometallic phases has already been comprehensively explored for the ReVIIOx/TiO2(P25) catalysts by means of in situ Raman and FTIR spectroscopy and in situ Raman/18O isotope exchange.31 The role of surface non-titrated hydroxyls and water molecules retained by the surface27 (formed during the condensation steps involved in the impregnation/deposition steps) has been given documented prominence.30Arguments attributing the occurrence of water molecules as if they were part of the incoming gas feed during the in situ spectroscopic measurements were precluded by means of neoteric (as far as catalysis science is concerned) experiments, namely temperature-dependent static equilibrium Raman studies of samples sealed under an O2(g) atmosphere after evacuation at an elevated temperature (200 °C).30
In the present work, we are concerned with the challenge of elucidating the molecular structures and the termination configurations (i.e. mono-oxo vs. di-oxo etc.) of the species present within the oxo-wolfram(VI) sites dispersed on titania and proposing consistent molecular-level explanations for the reversible temperature-dependent transformations taking place. The above described in situ Raman, in situ FTIR, in situ Raman/18O isotope exchange and static equilibrium Raman results (the latter extending also in the hydroxyl spectral region) provided adequate evidence for the occurrence of three species in the temperature range of 430–175 °C (Species-I, Species-II and Species-III) depending on temperature and surface density (W nm−2). Below, we propose our full interpretation of the results and discuss adequately its full consistency with all the observed effects.
4.1 Interpretation of spectroscopic (in situ Raman, in situ FTIR, in situ Raman/18O isotope exchange and static Raman) results
Three distinct WOx configurations (I, II and III) occur within the oxo-wolfram phase dispersed on TiO2(P25) and TiO2(anatase). On grounds of mononuclear species representation, Species-I has a mono-oxo termination configuration and fourfold coordination for W in an O![[double bond, length as m-dash]](https://www.rsc.org/images/entities/char_e001.gif) W(–O–Ti)3 distorted C3v-like arrangement; likewise, Species-II has a mono-oxo termination configuration albeit with a fivefold coordination for W in an O
W(–O–Ti)3 distorted C3v-like arrangement; likewise, Species-II has a mono-oxo termination configuration albeit with a fivefold coordination for W in an O![[double bond, length as m-dash]](https://www.rsc.org/images/entities/char_e001.gif) W(–O–Ti)4 distorted C4v-like arrangement and Species-III has a di-oxo termination configuration with a fivefold W coordination in an (O
W(–O–Ti)4 distorted C4v-like arrangement and Species-III has a di-oxo termination configuration with a fivefold W coordination in an (O![[double bond, length as m-dash]](https://www.rsc.org/images/entities/char_e001.gif) W)2(–O–Ti)3 arrangement. Species-II and Species-III occur also in the associated (W–O–W linked) oligomeric form with increasing surface coverage. Fig. 15 depicts the molecular models for Species-I, Species-II and Species-III in mononuclear representations.
W)2(–O–Ti)3 arrangement. Species-II and Species-III occur also in the associated (W–O–W linked) oligomeric form with increasing surface coverage. Fig. 15 depicts the molecular models for Species-I, Species-II and Species-III in mononuclear representations.
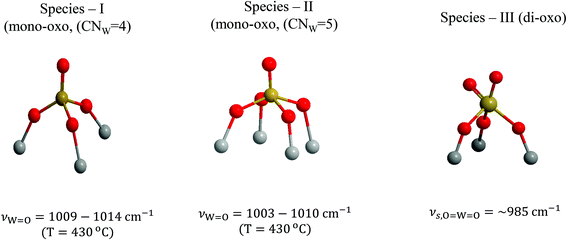 | ||
| Fig. 15 Structural models and W coordination/termination characteristics for Species-I, Species-II and Species-III in mononuclear representations. | ||
![[double bond, length as m-dash]](https://www.rsc.org/images/entities/char_e001.gif) O stretching modes of two distinct species. The striking similarity of the in situ Raman spectra in the fundamental W
O stretching modes of two distinct species. The striking similarity of the in situ Raman spectra in the fundamental W![[double bond, length as m-dash]](https://www.rsc.org/images/entities/char_e001.gif) O stretching region with its counterpart in situ FTIR spectra in the respective overtone region provides sound evidence that both species have a mono-oxo termination configuration. Considering the anharmonicity (accountable for observing the overtone modes) for W
O stretching region with its counterpart in situ FTIR spectra in the respective overtone region provides sound evidence that both species have a mono-oxo termination configuration. Considering the anharmonicity (accountable for observing the overtone modes) for W![[double bond, length as m-dash]](https://www.rsc.org/images/entities/char_e001.gif) O in diatomic approximation, the observed fundamental and observed first overtones are given by13,56,57
O in diatomic approximation, the observed fundamental and observed first overtones are given by13,56,57νW![[double bond, length as m-dash]](https://www.rsc.org/images/entities/char_e001.gif) O,1←0 = ωW O,1←0 = ωW![[double bond, length as m-dash]](https://www.rsc.org/images/entities/char_e001.gif) O(1–2χW O(1–2χW![[double bond, length as m-dash]](https://www.rsc.org/images/entities/char_e001.gif) O) O) |
νW![[double bond, length as m-dash]](https://www.rsc.org/images/entities/char_e001.gif) O,2←0 = ωW O,2←0 = ωW![[double bond, length as m-dash]](https://www.rsc.org/images/entities/char_e001.gif) O(1–3χW O(1–3χW![[double bond, length as m-dash]](https://www.rsc.org/images/entities/char_e001.gif) O) O) |
![[double bond, length as m-dash]](https://www.rsc.org/images/entities/char_e001.gif) O is the wavenumber corrected for anharmonicity and χW
O is the wavenumber corrected for anharmonicity and χW![[double bond, length as m-dash]](https://www.rsc.org/images/entities/char_e001.gif) O is the anharmonicity constant. Hence, the FTIR overtones would be expected at wavenumbers slightly lower than the respective doubled Raman fundamentals because the vibrational energy levels are not equidistant, but their separation decreases with increasing vibrational quantum number.56 This is exactly the case for bands marked as “I” and “II” in all spectra displayed in Fig. 2(A, B)–7(A, B). Utmost care is needed in assigning bands as due to overtones. Assignments must comply with the requirement for the first overtone wavenumber to be lower than the doubled wavenumber of the respective fundamental. Sometimes, wrong pertinent interpretations are reported, e.g. previously, a band at ∼2000 cm−1 has been erroneously assigned to the first overtone of a 985 cm−1 W
O is the anharmonicity constant. Hence, the FTIR overtones would be expected at wavenumbers slightly lower than the respective doubled Raman fundamentals because the vibrational energy levels are not equidistant, but their separation decreases with increasing vibrational quantum number.56 This is exactly the case for bands marked as “I” and “II” in all spectra displayed in Fig. 2(A, B)–7(A, B). Utmost care is needed in assigning bands as due to overtones. Assignments must comply with the requirement for the first overtone wavenumber to be lower than the doubled wavenumber of the respective fundamental. Sometimes, wrong pertinent interpretations are reported, e.g. previously, a band at ∼2000 cm−1 has been erroneously assigned to the first overtone of a 985 cm−1 W![[double bond, length as m-dash]](https://www.rsc.org/images/entities/char_e001.gif) O fundamental.40
O fundamental.40
It is shown below that Species-II occurs partly in the associated (WOx)n form at coverages above half monolayer at high temperatures (i.e. 430 °C) and also undergoes partial association with oligomeric units possessing W–O–W bridges when exposed to gradually decreasing temperatures (430 → 250 → 175 °C) under oxidative dehydrated conditions. Note that with increasing coverage, Species-II gradually prevails over Species-I (Fig. 8 and 9, and Fig. S1–S4†). Hence, in agreement with the very well documented study of Hilbrig et al.,35 which shows the existence of the WO5 and WO4 units with the WO5/WO4 ratio increasing with increasing coverage, Species-I is assigned to tetra-coordinated O![[double bond, length as m-dash]](https://www.rsc.org/images/entities/char_e001.gif) W(–O–)3 units and Species-II to penta-coordinated O
W(–O–)3 units and Species-II to penta-coordinated O![[double bond, length as m-dash]](https://www.rsc.org/images/entities/char_e001.gif) W(–O–)4 units, in conformity with the relative band wavenumbers for their respective W
W(–O–)4 units, in conformity with the relative band wavenumbers for their respective W![[double bond, length as m-dash]](https://www.rsc.org/images/entities/char_e001.gif) O terminal stretching modes (i.e. νW
O terminal stretching modes (i.e. νW![[double bond, length as m-dash]](https://www.rsc.org/images/entities/char_e001.gif) O, Species-I > νW
O, Species-I > νW![[double bond, length as m-dash]](https://www.rsc.org/images/entities/char_e001.gif) O, Species-II).
O, Species-II).
Notably, there exists a vital difference between the temperature dependence of bands (I) and (II). With decreasing temperature (panels (A) and (B), Fig. 2–7), band (II) loses intensity and undergoes a progressive redshift, whilst band (I) remains unaffected both in terms of its position as well as its intensity. As will be explained below, the structural transformation accountable for the weakening and redshift of band (II) is mediated by surface water molecules formed by condensation of surface hydroxyls during the deposition titration steps and retained at the surface by H-bonds. The stability exhibited by Species-I with decreasing temperature in the sequence 430 °C → 250 °C → 175 °C precludes the provenance of the water molecules as being in the incoming feed gas (20% O2/He). If water molecules were incoming as part of the feed gas, then there would be no selectivity of their “action” on Species-I and Species-II.
A critical inspection of Fig. 12 sheds light on the order of priority of Species-I and Species-II formation. The most basic surface hydroxyls (bands at ∼3710/3705 cm−1)52 are titrated first i.e. at low coverages of e.g. 1.2 W nm−2 and 1.1 W nm−2 (spectra 12Ab and 12Bb); hence, Species-I that prevails at low coverage (Fig. 8 and 9, and Fig. S1–S4†) is formed preferentially on those particular receptor sites where the most basic hydroxyls have first been titrated. Eventually, such sites are completely consumed and do not exist above ca. 1.5 W nm−2, when only hydroxyls with lower basicity remain for being titrated leading to the formation of Species-II (CNW = 5), which thereby gradually prevails over Species-I (CNW = 4) with increasing coverage.
Hence, Species-I and Species-II are distinct, they both have a mono-oxo termination configuration and Species-II prevails over Species-I with increasing coverage. Therefore, in alignment with the previously documented prevalence of WO5 sites over WO4 sites with increasing coverage,35 the C3v-like and C4v-like configurations are the most plausible ones, as depicted in Fig. 15. The CNW = 4 for Species-I justifies the higher wavenumber for νW![[double bond, length as m-dash]](https://www.rsc.org/images/entities/char_e001.gif) O, Species-I compared to νW
O, Species-I compared to νW![[double bond, length as m-dash]](https://www.rsc.org/images/entities/char_e001.gif) O, Species-II.
O, Species-II.
The Raman spectra obtained under the static equilibrium also show: (i) the gradual prevalence of Species-II over Species-I with increasing coverage (panels (C) shown in Fig. 8 and 9 and Fig. S1–S4†) and (ii) the progressive weakening of band (II) with decreasing temperature (panels (C), Fig. 2–7). In contrast, the gradual redshift of band (II) observed with decreasing temperature in the in situ Raman and FTIR spectra (Panels (A) and (B), Fig. 2–7) is hardly observed under static conditions. This is due to limiting the effect of surface water molecules ascribed to their partial removal during the 1 h evacuation of the samples at 200 °C before sealing off the cells for the static equilibrium Raman experiments (see the Experimental section).
Under in situ conditions, a temperature decrease of the order 430 °C → 175 °C results in the activation of water molecules retained by the surface (vide ante)27,30 for hydrolyzing the anchoring W–O–Ti bonds, thereby resulting in the formation of Species-III (to be further discussed below) and the partial association of WO5 Species-II sites by means of W–O–W linkages. The latter is justified by observing the broad peak mass evolved with decreasing temperature in the ∼935–950 cm−1 range (Fig. 2(A)–7(A)), of which the relative intensity increases with increasing coverage at a constant temperature (Fig. 8(A)–9(A) and S1(A)–S4(A)†). Hence the broadband at 935–950 cm−1 is attributed to the W–O–W bridging modes. Previously, in the in situ Raman studies pertaining to the WOx/ZrO2 catalysts,58–60 broadbands at 905–910 cm−1 have been observed with relative intensities that increased with increasing loading and assignment to W–O–W has been suggested to account for the observations.58 Significantly, such a peak mass at 935–950 cm−1 already exists for coverages above the half monolayer (Panels (A), Fig. 6 and 7) and can clearly be discerned for coverages above 2 W nm−2 already from 430 °C as shown in Fig. 8(A) and Fig. S2(A)†, that show the dependence on coverage at 430 °C. Hence, although the monomer-to-associated species transformation is completely reversed upon heating for low coverages of e.g. ∼1.2 W nm−2, this is not the case for high coverages where associated species existed already at 430 °C (see e.g.Fig. 6(A) and 7(A)). The formation of W–O–W bridges, which are inherently stronger than their counterpart W–O–Ti anchors, results in the redistribution of charge and valency around the W atom, thereby weakening of the Species-II W![[double bond, length as m-dash]](https://www.rsc.org/images/entities/char_e001.gif) O terminal bond and hence accounting for the redshift undergone by band (II) with decreasing temperature.
O terminal bond and hence accounting for the redshift undergone by band (II) with decreasing temperature.
The W![[double bond, length as m-dash]](https://www.rsc.org/images/entities/char_e001.gif) O terminal stretching mode wavenumbers for Species-I and Species-II undergo a blue shift with increasing coverage (Fig. 8, 9 and S1–S4†) due to the varying basicity of the corresponding “receptor” surface OH sites. It is evident that the most basic hydroxyls are titrated first, i.e. at low coverage preferably the most basic hydroxyls are titrated. With increasing coverage, hydroxyls with lower basicity are also titrated. The lower basicity of a titrated hydroxyl accounts for the lower electron donating ability of O towards W along with Ti–O–W and by the cascade effect to the strengthening of the terminal W
O terminal stretching mode wavenumbers for Species-I and Species-II undergo a blue shift with increasing coverage (Fig. 8, 9 and S1–S4†) due to the varying basicity of the corresponding “receptor” surface OH sites. It is evident that the most basic hydroxyls are titrated first, i.e. at low coverage preferably the most basic hydroxyls are titrated. With increasing coverage, hydroxyls with lower basicity are also titrated. The lower basicity of a titrated hydroxyl accounts for the lower electron donating ability of O towards W along with Ti–O–W and by the cascade effect to the strengthening of the terminal W![[double bond, length as m-dash]](https://www.rsc.org/images/entities/char_e001.gif) O bond with increasing coverage. Actually, with increasing coverage, the νW
O bond with increasing coverage. Actually, with increasing coverage, the νW![[double bond, length as m-dash]](https://www.rsc.org/images/entities/char_e001.gif) O for Species-II (band (II)) undergoes a pronounced blue shift (e.g. in Fig. 8, pertaining to WOx/TiO2(P25) at 430 °C: 1003 → 1010 cm−1 (R), 1997 → 2006 cm−1 (IR overtone) and 1003 → 1009 cm−1 (R, static)), which is justified by the progressively lower basicity of the titrated hydroxyls, thereby—by the cascade effect—resulting in the strengthening of the terminal W
O for Species-II (band (II)) undergoes a pronounced blue shift (e.g. in Fig. 8, pertaining to WOx/TiO2(P25) at 430 °C: 1003 → 1010 cm−1 (R), 1997 → 2006 cm−1 (IR overtone) and 1003 → 1009 cm−1 (R, static)), which is justified by the progressively lower basicity of the titrated hydroxyls, thereby—by the cascade effect—resulting in the strengthening of the terminal W![[double bond, length as m-dash]](https://www.rsc.org/images/entities/char_e001.gif) O bond. Concomitantly, whereas the formation of Species-I ceases at low-to-medium coverage due to the full consumption of the most basic hydroxyls, increasing amounts of Species-II are formed at medium-to-high coverage and band (II), on account of its intensity increase and blue shift, obscures the unshifted band (I) at high temperature (430 °C) and high coverage (e.g.Fig. 6 (panels (A),(B)) and Fig. 7 (panels (A),(B))).
O bond. Concomitantly, whereas the formation of Species-I ceases at low-to-medium coverage due to the full consumption of the most basic hydroxyls, increasing amounts of Species-II are formed at medium-to-high coverage and band (II), on account of its intensity increase and blue shift, obscures the unshifted band (I) at high temperature (430 °C) and high coverage (e.g.Fig. 6 (panels (A),(B)) and Fig. 7 (panels (A),(B))).
Therefore, Species-II is the dominant species at high coverage and high temperature, whilst Species-I is prevailing at low coverage. Hence, the in situ Raman/18O isotope labeling measurements performed for samples with coverages of ∼0.5 W nm−2 (Fig. 13) and ∼3.5 W nm−2 (Fig. 14) at the temperature of 470 °C address exclusively the confirmation of the termination configuration for Species-I and Species-II, respectively. In all the cases, a single isotopic splitting is observed, thereby cross-checking the proposal for mono-oxo termination configuration for both Species-I and Species-II. Notably, multiple band splitting would be expected in the case of 18O isotope labeling Raman measurements pertaining to poly-oxo (e.g., dioxo) termination configuration for the examined dispersed (WOx)n sites.13,31,61 Such multiple isotopic band splitting has indeed been observed in recent in situ Raman/18O isotope exchange studies for di-oxo (O![[double bond, length as m-dash]](https://www.rsc.org/images/entities/char_e001.gif) )2ReOx sites dispersed on TiO2(P25)31 and CeO2.62
)2ReOx sites dispersed on TiO2(P25)31 and CeO2.62
One can exploit the diatomic model in the harmonic approximation13,23,31,61 for calculating the corresponding theoretically predicted wavenumber for the W![[double bond, length as m-dash]](https://www.rsc.org/images/entities/char_e001.gif) 18O, in each case. This is done on the grounds of equal W–O distances for the W
18O, in each case. This is done on the grounds of equal W–O distances for the W![[double bond, length as m-dash]](https://www.rsc.org/images/entities/char_e001.gif) 16O and substituted W
16O and substituted W![[double bond, length as m-dash]](https://www.rsc.org/images/entities/char_e001.gif) 18O sites. Hence, by applying the isotopic ratio of 1.0554 (ref. 61) the calculated wavenumbers for the W
18O sites. Hence, by applying the isotopic ratio of 1.0554 (ref. 61) the calculated wavenumbers for the W![[double bond, length as m-dash]](https://www.rsc.org/images/entities/char_e001.gif) 18O modes in each case coincide with the values indicated in Fig. 13 and 14, thereby further strengthening the validity of the proposed mono-oxo configuration for the distinct Species-I and Species-II.
18O modes in each case coincide with the values indicated in Fig. 13 and 14, thereby further strengthening the validity of the proposed mono-oxo configuration for the distinct Species-I and Species-II.
A point worth discussing in the in situ Raman/18O exchange measurements is the slight gradual redshift (e.g. 1010 → 1008 cm−1 in Fig. 14) of the remaining non-substituted W![[double bond, length as m-dash]](https://www.rsc.org/images/entities/char_e001.gif) 16O sites. This is ascribed to the previously reported next-nearest-neighbor vibrational isotope effect.13,45 Very briefly, the DFT theoretical calculations63 predicted that the hydrogen most favorably adsorbs dissociatively on titania surface unsaturated Ti–O–Ti and Ti–O sites (deprotonated former hydroxyl sites), hence preferably reducing titania rather than a W
16O sites. This is ascribed to the previously reported next-nearest-neighbor vibrational isotope effect.13,45 Very briefly, the DFT theoretical calculations63 predicted that the hydrogen most favorably adsorbs dissociatively on titania surface unsaturated Ti–O–Ti and Ti–O sites (deprotonated former hydroxyl sites), hence preferably reducing titania rather than a W![[double bond, length as m-dash]](https://www.rsc.org/images/entities/char_e001.gif) 16O site, by leading the initial steps of 18O/16O exchange to take place on lattice oxygens and by surface diffusion to anchoring oxygens of W–O–Ti linkages (W–16O–Ti → W–18O–Ti). The lower nuclear charge density of 18O (compared to 16O) causes—by the cascade effect—a weakening of the remaining (yet non substituted) W
16O site, by leading the initial steps of 18O/16O exchange to take place on lattice oxygens and by surface diffusion to anchoring oxygens of W–O–Ti linkages (W–16O–Ti → W–18O–Ti). The lower nuclear charge density of 18O (compared to 16O) causes—by the cascade effect—a weakening of the remaining (yet non substituted) W![[double bond, length as m-dash]](https://www.rsc.org/images/entities/char_e001.gif) 16O bonds.13,45
16O bonds.13,45
Another comment worth mentioning on the vibrational properties of the W![[double bond, length as m-dash]](https://www.rsc.org/images/entities/char_e001.gif) O terminal stretching modes of Species-I and Species-II pertains to their respective band intensities in the Raman and FTIR spectra. A comparison of the in situ Raman spectra with the in situ FTIR spectra, e.g. at low coverages of 1.2 and 1.1 W nm−2 (i.e.Fig. 2(A, B) and 3(A, B)), shows that the intensity ratio of band (II) to band (I) is somewhat lower in the Raman spectra compared to the FTIR spectra, i.e.
O terminal stretching modes of Species-I and Species-II pertains to their respective band intensities in the Raman and FTIR spectra. A comparison of the in situ Raman spectra with the in situ FTIR spectra, e.g. at low coverages of 1.2 and 1.1 W nm−2 (i.e.Fig. 2(A, B) and 3(A, B)), shows that the intensity ratio of band (II) to band (I) is somewhat lower in the Raman spectra compared to the FTIR spectra, i.e.
This is ascribed to the different selection rules pertaining to the Raman vs. IR band intensities, namely change in polarizability vs. change in dipole moment.
![[double bond, length as m-dash]](https://www.rsc.org/images/entities/char_e001.gif) W
W![[double bond, length as m-dash]](https://www.rsc.org/images/entities/char_e001.gif) O core possessed by a dispersed WOx site formed at the expense of Species-II, of which the representative band (II) undergoes a corresponding weakening (vide ante). A mechanistic interpretation at the molecular level (presented below) suggests a five-fold coordination for W (CNW = 5) for the di-oxo (O
O core possessed by a dispersed WOx site formed at the expense of Species-II, of which the representative band (II) undergoes a corresponding weakening (vide ante). A mechanistic interpretation at the molecular level (presented below) suggests a five-fold coordination for W (CNW = 5) for the di-oxo (O![[double bond, length as m-dash]](https://www.rsc.org/images/entities/char_e001.gif) )2W(–O–)3 site formed at the expense of Species-II following the hydrolysis of an anchoring bond by surface-retained water, activated and favored by lowering the temperature to and below 250 °C.
)2W(–O–)3 site formed at the expense of Species-II following the hydrolysis of an anchoring bond by surface-retained water, activated and favored by lowering the temperature to and below 250 °C.
Previously, reference model compounds possessing di-oxo WO2 cores with W in environments consisting exclusively of oxo-ligands with W in six-fold coordination, namely WVIO2(SO4)22− and WVIO2(SO4)34− molten complexes,64 exhibited the (νs/νas) pairs at 972/937 cm−1 and 933/909 cm−1, respectively. The five-fold coordination evidenced for W in the di-oxo Species-III justifies the slight wavenumber upshift. Hence, νs is located at ∼985 cm−1 (Fig. 2–7) and its νas counterpart, expected with much lower intensity in the Raman and some 15–40 cm−1 below νs57 is obscured by the decaying envelope of band (II) and the ascent of the background towards the low wavenumber side of the spectra. Ideally, in the triatomic “gas phase” approximation for WO2, the symmetric stretching νs mode should be IR-silent57 but distortions within the amorphous dispersed (WOx)n phase relax the symmetry selection rules and both νs and νas become active in both types of vibrational spectra.
The FTIR spectra obtained for high loadings are dominated by band (II) both due to Species-II prevalence and due to the intrinsically higher IR activity of band (II) (see section 4.1.1). Moreover, as seen in Fig. 2–7, the redshift incurred by band (II) upon cooling is higher for P25-supported samples. Hence, when comparing the band (II) redshifts upon cooling in the in situ FTIR spectra for the highest W coverage (Fig. 6(B)vs.7(B)) where Species-II is predominant, a larger shift is evidenced for the P25-supported sample (2006 → 1997 cm−1) compared to its anatase-supported counterpart (2005 → 2002 cm−1).
4.2 Structural models and molecular-level mechanism for temperature-dependent structural transformations
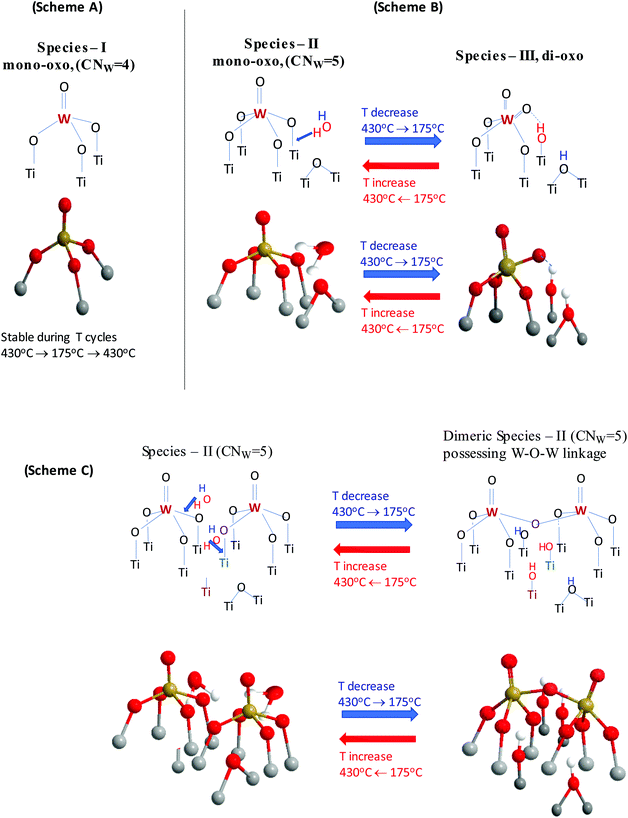
The structural transformations taking place under dehydrated conditions upon cooling the WOx/TiO2(P25, anatase) catalysts were interpreted above, based on the combined in situ Raman, in situ FTIR and static equilibrium Raman experiments by means of two processes at the molecular level: (i) Species-II (e.g. O![[double bond, length as m-dash]](https://www.rsc.org/images/entities/char_e001.gif) W(–O–)4 in mononuclear representation) transforms to Species-III (e.g. (O
W(–O–)4 in mononuclear representation) transforms to Species-III (e.g. (O![[double bond, length as m-dash]](https://www.rsc.org/images/entities/char_e001.gif) )2W(–O–)3 in mononuclear representation) and (ii) Species-II undergoes oligomerization. Notably, Species-I (O
)2W(–O–)3 in mononuclear representation) and (ii) Species-II undergoes oligomerization. Notably, Species-I (O![[double bond, length as m-dash]](https://www.rsc.org/images/entities/char_e001.gif) W(–O–Ti)3) was found to be stable and not subjected to temperature-dependent structural/transformational changes in the sequence 430 °C → 175 °C → 430 °C. The structural transformations undergone by Species-II are ascribed to the action of surface water molecules retained by the support27 that become activated and hydrolyze the anchoring sites of Species-II upon lowering the temperature.
W(–O–Ti)3) was found to be stable and not subjected to temperature-dependent structural/transformational changes in the sequence 430 °C → 175 °C → 430 °C. The structural transformations undergone by Species-II are ascribed to the action of surface water molecules retained by the support27 that become activated and hydrolyze the anchoring sites of Species-II upon lowering the temperature.
Fig. 16 portrays a consistent molecular level mechanism accounting for the spectral observations and the proposed transformations. Scheme (A) highlights the stability of Species-I that as evidenced by its vibrational properties does not undergo changes when cycling the temperature in the 430–175 °C range. Scheme (B) shows schematically the hydrolyzing action of a surface H2O molecule (activated upon lowering the temperature) on an anchoring W–O–Ti bond of Species-II nearby a deprotonated Ti–O–Ti site (it could also be a Ti–O site) that had been formed by the titration of surface hydroxyls during the deposition process steps. For simplicity, a mononuclear representation for Species-II is shown. As a result, on account of the H2O molecule hydrolyzing action, the O atom of the W–O–Ti chain is detached from the Ti atom, thereby Species-II [(O![[double bond, length as m-dash]](https://www.rsc.org/images/entities/char_e001.gif) W(–O–Ti)4] is transformed to Species-III [(O
W(–O–Ti)4] is transformed to Species-III [(O![[double bond, length as m-dash]](https://www.rsc.org/images/entities/char_e001.gif) )2W(–O–Ti)3] and two hydroxyls are formed on the surface. One hydroxyl group is formed by the hydroxylation of the liberated Ti atom and a second hydroxyl group is formed by the protonation of the Ti–O–Ti site. Scheme (B) also includes a perspective molecular model view of the above-described step.
)2W(–O–Ti)3] and two hydroxyls are formed on the surface. One hydroxyl group is formed by the hydroxylation of the liberated Ti atom and a second hydroxyl group is formed by the protonation of the Ti–O–Ti site. Scheme (B) also includes a perspective molecular model view of the above-described step.
Scheme (C) shows the parallel oligomerization undergone by two adjacent Species-II moieties, mediated by two surface water molecules. The neighboring dehydroxylated (Ti–) and deprotonated (Ti–O–Ti) sites are also shown. The activation of the two surface H2O molecules results in an oxygen-bridged associated dinuclear Species-II unit (i.e. comprised of two oxygen-bridged mono-oxo W![[double bond, length as m-dash]](https://www.rsc.org/images/entities/char_e001.gif) O sites with CNW = 5) and four hydroxyls in a stoichiometrically consistent step. Scheme (C) includes also the corresponding structural model perspective view. The process shown in Fig. 16(C) does not take place under static equilibrium conditions due to the partial removal of the retained water molecules caused by the samples’ evacuation for 1 h at 200 °C, thereby partly inhibiting the temperature-dependent effects.
O sites with CNW = 5) and four hydroxyls in a stoichiometrically consistent step. Scheme (C) includes also the corresponding structural model perspective view. The process shown in Fig. 16(C) does not take place under static equilibrium conditions due to the partial removal of the retained water molecules caused by the samples’ evacuation for 1 h at 200 °C, thereby partly inhibiting the temperature-dependent effects.
4.3 Implications on WOx/TiO2-based catalysis
The results of the present work cannot be used directly to assign a particular constituent of the (WOx)n dispersed phase as being of relevance for catalytic activity in WOx/TiO2-based catalysis. However, sound evidence is provided for ascertaining the heterogeneity of the dispersed phase and it remains to differentiate the spectator species and the catalytically active sites for each particular catalytic process without excluding the possibility of the active phase itself being heterogeneous, i.e. consisting of more than one active site. In contrast, it is clearly shown that a controlled tuning of the prevailing sites/configurations is feasible by appropriate control of temperature and surface coverage. Most importantly, it turns out that existing results and interpretations pertaining to temperature-dependent and coverage-dependent reactivity/selectivity for WOx/TiO2-based catalytic reactions probably need to be reevaluated by taking into account the corresponding dependence of configurations/site prevalence.5. Conclusions
(a) The dispersed (WOx)n phase supported on TiO2 is heterogeneous. At an elevated temperature of 430 °C it consists of two distinct species with the mono-oxo termination configuration exhibiting C3v-like (Species-I, mono-oxo, CNW = 4) and C4v-like (Species-II, mono-oxo, CNW = 5) arrangements.(b) Species-I (WO4) is formed by titration of the most basic support hydroxyls and is abundant at low coverage; its formation ceases upon consumption of the most basic surface hydroxyls that are exclusive receptor sites for Species-I formation. The νW![[double bond, length as m-dash]](https://www.rsc.org/images/entities/char_e001.gif) O mode for Species-I is at 1009–1014 cm−1 and remains stable in terms of intensity and position in the temperature sequence of 430 → 250 → 175 °C.
O mode for Species-I is at 1009–1014 cm−1 and remains stable in terms of intensity and position in the temperature sequence of 430 → 250 → 175 °C.
(c) Species-II (WO5) is formed by titration of the less basic support hydroxyls, in amounts that increase with increasing coverage and prevails over WO4 at high coverage and high temperature. The association of WO5 units takes place at and above half monolayer, evidenced by a band attributed to W–O–W links. The νW![[double bond, length as m-dash]](https://www.rsc.org/images/entities/char_e001.gif) O mode for Species-II is at 1003–1010 cm−1 (blue shifting and strengthened with increasing coverage) and undergoes a reversible weakening and redshift in the temperature sequence of 430 → 250 → 175 °C.
O mode for Species-II is at 1003–1010 cm−1 (blue shifting and strengthened with increasing coverage) and undergoes a reversible weakening and redshift in the temperature sequence of 430 → 250 → 175 °C.
(d) Two reversible temperature-dependent transformations of Species-II mediated by water molecules retained on the surface take place in the 430 → 250 → 175 → 430 °C sequence. First, Species-II by hydrolysis of one of its W–O–Ti anchors is transformed into Species-III (di-oxo, characteristic symmetric stretching at ∼985 cm−1) and second, Species-II undergoes partial association to oligomerized units. The latter effect is more pronounced at low-to-medium coverage where isolated O![[double bond, length as m-dash]](https://www.rsc.org/images/entities/char_e001.gif) W (–O–)4 units occur in adjacent locations; at medium-to-high coverage, the polymeric units already exist after calcination.
W (–O–)4 units occur in adjacent locations; at medium-to-high coverage, the polymeric units already exist after calcination.
(e) Subjecting the catalysts to 1 h evacuation at 200 °C, thus limiting the amount of surface retained water, results in the partial inhibition of the observed effects thereby restricting the Species-II polymerisation upon lowering the temperature.
(f) The results show the feasibility of tuning the speciation of the (WOx)n phase dispersed on TiO2 by appropriate control of temperature and coverage.
Conflicts of interest
There are no conflicts of interest to declare.Acknowledgements
This study was supported by the project “Materials and Processes for Energy and Environment Applications” (MIS 5002556), which was implemented under the “Action for the Strategic Development on the Research and Technological Sector”, funded by the Operational Program “Competitiveness, Entrepreneurship and Innovation” (NSRF 2014–2020) and co-financed by Greece and the European Union (European Regional Development Fund).References
- X. Chen, S. Li and Y. Wang, Catalytic Activities of MoO3/TiO2 and WO3/TiO2 for Photocatalytic Oxidation of CH4 by O2, Fenzi Cuihua, 2000, 14, 245–246 CAS.
- Y. R. Do, W. Lee, K. Dwight and A. Wold, The Effect of WO3 on the Photocatalytic Activity of TiO2, J. Solid State Chem., 1994, 108, 198–201 CrossRef CAS.
- C. Martin, G. Solana, V. Rives, G. Marci, L. Palmisano and A. Sclafani, Physico-chemical Properties of WO3/TiO2 Systems Employed for 4-nitrophenol Photodegradation in Aqueous Medium, Catal. Lett., 1997, 49, 235–243 CrossRef CAS.
- T. Yamagushi, Y. Tanaka and K. Tanabe, Isomerization and Disproportionation of Olefins over Tungsten Oxides Supported on Various Oxides, J. Catal., 1980, 65, 442–447 CrossRef.
- K. Bourikas, Ch. Fountzoula and Ch. Kordulis, Monolayer Transition Metal Supported on Titania Catalysts for the Selective Catalytic Reduction of NO by NH3, Appl. Catal., B, 2004, 52, 145–153 CrossRef CAS.
- L. Lietti, J. Svachula, P. Forzatti, G. Busca, G. Ramis and P. Bregan, Surface and Satalytic Properties of Vanadia-Titania and Tungsta-Titania Systems in the Selective Catalytic Reduction of Nitrogen Oxides, Catal. Today, 1993, 17, 131–139 CrossRef CAS.
- M. Kobayashi and K. Miyoshi, WO3−TiO2 Monolithic Catalysts for High Temperature SCR of NO by NH3: Influence of Preparation Method on Structural and Physico-chemical Properties, Activity and Durability, Appl. Catal., B, 2007, 72, 253–261 CrossRef CAS.
- F. Bertinchamps, A. Attianese, M. M. Mestdagh and E. M. Gaigneaux, Catalysts for chlorinated VOCs abatement: Multiple Effects of Water on the Activity of VOx based Catalysts for the Combustion of Chlorobenzene, Catal. Today, 2006, 112, 165–168 CrossRef CAS.
- Z. Ma, W. Hua, Y. Tang and Z. Gao, Catalytic Decomposition of CFC-12 over WO3/TiO2, Chem. Lett., 1999, 11, 1215–1216 CrossRef.
- L. Vilcocq, R. Koerin, A. Cabiac, C. Especel, S. Lacombe and D. Duprez, New bifunctional catalytic systems for sorbitol transformation into biofuels, Appl. Catal., B, 2014, 148-149, 499–508 CrossRef CAS.
- F. Can, X. Courtois and D. Duprez, Tungsten-Based Catalysts for Environmental Applications, Catalysts, 2021, 11, 703 CrossRef CAS.
- J. Strunk, M. A. Banares and I. E. Wachs, Vibrational Spectroscopy of Oxide Overlayers, Top. Catal., 2017, 60, 1577–1617 CrossRef CAS.
- G. Tsilomelekis and S. Boghosian, On the Configuration, Molecular Structure and Vibrational Properties of MoOx Sites on Alumina, Zirconia, Titania and Silica, Catal. Sci. Technol., 2013, 3, 1869–1888 RSC.
- C. Hess, In Situ Raman Spectroscopy of Catalysts: Examples from Current Research, Top. Catal., 2013, 56, 1593–1600 CrossRef CAS.
- S. L. Wegener, T. J. Marks and P. Stair, Design Strategies for the Molecular Level Synthesis of Supported Catalysts, Acc. Chem. Res., 2012, 45, 206–214 CrossRef CAS PubMed.
- I. E. Wachs and C. A. Roberts, Monitoring Surface Metal Oxide Catalytic Active Sites with Raman Spectroscopy, Chem. Soc. Rev., 2010, 39, 5002–5017 RSC.
- M. A. Banares and I. E. Wachs, Raman Spectroscopy of Catalysts, in Encyclopedia of Analytical Chemistry, John Wiley & Sons, 2010, pp. 1–30 Search PubMed.
- M. A. Banares and G. Mestl, Structural Characterization of Operating Catalysts by Raman Spectroscopy, in Advances in Catalysis, Elsevier, 2009, vol. 52, pp. 43–128 Search PubMed.
- I. E. Wachs and T. Kim, Oxidation Reactions over Supported Metal Oxide Catalysts: Molecular/Electronic Structure – Activity/Selectivity Relationships, in Metal Oxide Catalysis, Wiley-VCH, Weinheim, 2009, pp. 487–498 Search PubMed.
- E. L. Lee and I. E. Wachs, New Approaches based on Synthesis, Characterization and Modelling, in Design of Heterogeneous Catalysts, 2009, Wiley-VCH, Weinheim, pp. 1–23 Search PubMed.
- I. E. Wachs, Recent Conceptual Advances in the Catalysis Science of Mixed Metal Oxide Catalytic Materials, Catal. Today, 2005, 100, 79–94 CrossRef CAS.
- M. A. Banares and I. E. Wachs, Molecular Structures of Supported Metal Oxide Catalysts Under Different Environments, J. Raman Spectrosc., 2002, 33, 359–380 CrossRef CAS.
- G. Busca, Differentiation of Mono-oxo and Polyoxo and of Monomeric and Polymeric Vanadate, Molybdate and Tungstate Species in Metal Oxide Catalysts by IR and Raman Spectroscopy, J. Raman Spectrosc., 2002, 33, 348–358 CrossRef CAS.
- G. Mestl and T. K. K. Srinivasan, Raman Spectroscopy of Monolayer-Type Catalysts: Supported Molybdenum Oxides, Catal. Rev.: Sci. Eng., 1998, 40, 451–570 CrossRef CAS.
- I. E. Wachs, Raman and IR studies of Surface Metal Oxide Species on Oxide Supports: Supported Metal Oxide Catalysts, Catal. Today, 1996, 27, 437–455 CrossRef CAS.
- K. Bourikas, Ch. Kordulis and A. Lycourghiotis, The Role of the Liquid-Solid Interface in the Preparation of Supported Catalysts, Catal. Rev.: Sci. Eng, 2006, 48, 363–444 CrossRef CAS.
- K. Bourikas, Ch. Kordulis and A. Lycourghiotis, Titanium Dioxide (Anatase and Rutile): Surface Chemistry, Liquid–Solid Interface Chemistry, and Scientific Synthesis of Supported Catalysts, Chem. Rev., 2014, 114, 9754–9823 CrossRef CAS PubMed.
- N. Y. Topsoe, M. Anstrom and J. A. Dumesic, Raman, FTIR and Theoretical Evidence for Dynamic Structural Rearrangements of Vanadia/Titania Denox Catalysts, Catal. Lett., 2001, 1–2, 11–20 CrossRef.
- C. Andriopoulou and S. Boghosian, Heterogeneity of Deposited Phases in Supported Transition Metal Oxide Catalysts: Reversible Temperature-Dependent Evolution of Molecular Structures and Configurations, Phys. Chem. Chem. Phys., 2018, 20, 1742–1751 RSC.
- C. Andriopoulou and S. Boghosian, Tuning the Configuration of Dispersed Oxometallic Sites in Supported Transition Metal Oxide Catalysts: A Temperature Dependent Raman Study, Catal. Today, 2019, 336, 74–83 CrossRef CAS.
- C. Andriopoulou and S. Boghosian, Molecular Structure and Termination Configuration of Oxo-Re(VII) Catalyst Sites Supported on Titania, Catal. Today, 2020, 355, 665–677 CrossRef CAS.
- M. A. Vuurman, I. E. Wachs and A. M. Hirt, Structural Determination of Supported V2O5-WO3/TiO2 Catalysts by in situ Raman Sand X-ray Photoelectron Spectroscopy, J. Phys. Chem., 1991, 95, 9928–9937 CrossRef CAS.
- D. S. Kim, M. Ostromecki and I. E. Wachs, Surface Structures of Supported Tungsten Oxide Catalysts under Dehydrated Conditions, J. Mol. Catal. A: Chem., 1996, 106, 93–102 CrossRef CAS.
- T. Kim, A. Burrows, C. J. Kiely and I. E. Wachs, Molecular/Electronic Structure-Surface Acidity Relationships of Model-Supported Tungsten Oxide Catalysts, J. Catal., 2007, 246, 370–381 CrossRef CAS.
- F. Hilbrig, H. E. Gobel, H. Knozinger, H. Schmelz and B. Lengeler, X-ray Absorption Spectroscopy Study of the Titania- and Alumina-Supported Tungsten Oxide System, J. Phys. Chem., 1991, 95, 6973–6978 CrossRef CAS.
- S. Eibl, B. C. Gates and H. Knozinger, Structure of WOx/TiO2 Catalysts Prepared from Hydrous Titanium Oxide Hydroxide: Influence of Preparation Parameters, Langmuir, 2001, 17, 107–115 CrossRef CAS.
- T. Onfroy, G. Clet, S. B. Bukallah, T. Visser and M. Houalla, Acidity of Titania-Supported Tungsten or Niobium Oxide Catalsyts. Correlation with Catalytic Activity, Appl. Catal., A, 2006, 298, 80–87 CrossRef CAS.
- V. Lebarbier, G. Clet and M. Houalla, Relations Between Structure, Acidity, and Activity of WOx/TiO2: Influence of the Initial State of the Support, Titanium Oxyhydroxide, or Titanium Oxide, J. Phys. Chem. B, 2006, 110, 22608–22617 CrossRef CAS PubMed.
- T. Onfroy, V. Lebarbier, G. Clet and M. Houalla, Quantitative Relationship Between the Nature of Surface Species and the Catalytic Activity of Tungsten Oxides Supported on Crystallized Titania, J. Mol. Catal. A: Chem., 2010, 318, 1–7 CrossRef CAS.
- Y. He, M. E. Ford, M. Zhu, Z. Wu and I. E. Wachs, Selective Catalytic Reduction of NO by NH3 with WO3-TiO2 Catalysts: Influence of Catalyst Synthesis Method, Appl. Catal., B, 2016, 188, 123–133 CrossRef CAS.
- G. D. Panagiotou, Th. Petsi, K. Bourikas, Ch. Kordulis and A. Lycourghiotis, The Interfacial Chemistry of the Impregnation Step Involved in the Preparation of Tungsten(VI) Supported Titania Catalysts, J. Catal., 2009, 262, 266–279 CrossRef CAS.
- A. Tribalis, G. D. Panagiotou, G. Tsilomelekis, A. G. Kalampounias, K. Bourikas, Ch. Kordulis, S. Boghosian and A. Lycourghiotis, Temperature-Dependent Evolution of the Molecular Configuration of Oxo-Tungsten(VI) Species Deposited on the Surface of Titania, J. Phys. Chem. C, 2014, 118, 11319–11332 CrossRef CAS.
- A. Christodoulakis and S. Boghosian, Molecular Structure and Activity of Molybdena Catalysts Supported on Zirconia for Ethane Oxidative Dehydrogenation Studied by Operando Raman Spectroscopy, J. Catal., 2008, 260, 178–187 CrossRef CAS.
- C. Andriopoulou, D. Harris, H. Stephenson, A. M. Eftsathiou and S. Boghosian, In situ Raman Spectroscopy as a Tool for Discerning Subtle Structural Differences Between Commercial (Ce,Zr)O2-Based OSC Materials of Identical Composition, Catalysts, 2020, 10, 462 CrossRef CAS.
- G. Tsilomelekis and S. Boghosian, In Situ Raman and FTIR Spectroscopy of Molybdenum(VI) Oxide Supported on Titania Combined with 18O/16O Exchange: Molecular Structure, Vibrational Properties and Vibrational Isotope Effects, J. Phys. Chem. C, 2011, 118, 2146–2154 CrossRef.
- G. Tsilomelekis and S. Boghosian, Structural and Vibrational Properties of Molybdena Catalysts Supported on Alumina and Zirconia Studied by in Situ Raman and FTIR Spectroscopies Combined with 18O/16O Isotopic Substitution, Catal. Today, 2010, 158, 146–155 CrossRef CAS.
- S. Boghosian, Vibrational Modes and Structure of Vanadium(V) Complexes in M2SO4-V2O5 (M = K, Cs) Molten Salt Mixtures, J. Chem. Soc., Faraday Trans., 1998, 94, 3463–3469 RSC.
- S. Boghosian, A. Chrissanthopoulos and R. Fehrmann, Structure of Vanadium Oxosulfato Complexes in V2O5-M2S2O7-M2SO4 (M=K, Cs) Melts. A High Temperature Spectroscopic Study, J. Phys. Chem. B, 2002, 106, 49–56 CrossRef CAS.
- A. G. Kalampounias and S. Boghosian, Distribution of Tellurite Polymorphs in the xM2O–(1−x)TeO2 (M = Li, Na, K, Cs, and Rb) Binary Glasses Using Raman Spectroscopy, Vib. Spectrosc., 2012, 59, 18–22 CrossRef CAS.
- M. Primet, P. Pichat and M.-V. Mathieu, Infrared Study of the Surface of Titanium Dioxides. I. Hydroxyl Groups, J. Phys. Chem., 1971, 75, 1216–1220 CrossRef CAS.
- G. Busca, H. Saussey, O. Saur, L. C. Lavalley and V. Lorenzelli, FT-IR Characterization of the Surface Acidity of Different Titanium Dioxide Anatase Preparations, Appl. Catal., 1985, 14, 245–260 CrossRef CAS.
- K. Hadjiivanov, Identification and Characterization of Surface Hydroxyl Groups by Infrared Spectroscopy, Adv. Catal., 2014, 57, 99–318 CAS.
- W. J. Mortier, J. Sauer, J. A. Lercher and H. Noller, Bridging and Terminal Hydroxyls. A Structural Chemical and Quantum Chemical Discussion, J. Phys. Chem., 1984, 88, 905–912 CrossRef CAS.
- P. Waleska and C. Hess, Structural Dynamics of Dispersed Titania During Dehydration and Oxidative Dehydrogenation Studied by in Situ UV Raman Spectroscopy, Catal. Lett., 2018, 148, 2537–2547 CrossRef CAS.
- J. P. Dunn, J.-M. Jehng, D. S. Kim, L. E. Briand, H. G. Stenger and I. E. Wachs, Interactions Between Surface Vanadate and Surface Sulfate on Metal Oxide Catalysts, J. Phys. Chem. B, 1998, 102, 6212–6218 CrossRef CAS.
- G. Herzberg, Molecular Spectra and Molecular Structure, I. Spectra of Diatomic Molecules, D. Van Nostrand Company Inc., Princeton, 2nd edn, 1950 Search PubMed.
- K. Nakamoto, Infrared and Raman Spectra of Inorganic and Coordination Compounds, Wiley – Interscience, New York, 6th edn, 2009 Search PubMed.
- M. Scheithauer, R. K. Grasselli and H. Knozinger, H. Genesis and Structure of WOx/ZrO2 Solid Acid Catalysts, Langmuir, 1998, 14, 3019–3029 CrossRef CAS.
- M. Scheithauer, T.-K. Cheumg, R. E. Jentoft, R. K. Grasselli, B. C. Gates and H. Knozinger, Characterization of WOx/ZrO2 by Vibrational Spectroscopy and n-Pentane Isomerization Catalysis, J. Catal., 1998, 180, 1–13 CrossRef CAS.
- S. Loridant, C. Feche, N. Essayem and F. Figueras, WOx/ZrO2 Catalysts Prepared by Anionoc ExchangeQ In situ Raman Investigation from the Precursor Solutions to the Calcined Catalysts, J. Phys. Chem. B, 2005, 109, 5631–5637 CrossRef CAS PubMed.
- B. M. Weckhuysen, J.-M. Jehng and I. E. Wachs, In Situ Raman Spectroscopy of Supported Transition Metal Oxide Catalysts: 18O2-16O2 Isotopic Labeling Studies, J. Phys. Chem. B, 2000, 104, 7382–7387 CrossRef CAS.
- B. MacQueen, B. Ruiz-Yi, M. Royko, A. Heyden, Y. J. Pagan-Torres, C. Williams and J. Lauterbach, In-Situ Oxygen Isotopic Exchange Vibrational Spectroscopy of Rhenium Oxide Surface Structures on Cerium Oxide, J. Phys. Chem. C, 2020, 124, 7174–7181 CrossRef CAS.
- K. Hamraoui, S. Cristol, E. Payen and J.-F. Paul, Structure and reducibility of titania-supported monomeric and dimeric molybdenum oxide entities studied by DFT calculations, THEOCHEM, 2009, 903, 73–82 CrossRef CAS.
- A. L. Paulsen, A. G. Kalampounias, R. W. Berg and S. Boghosian, Raman Spectroscopic Study of Tungsten(VI) Oxosulfato Complexes in WO3-K2S2O7-K2SO4 Molten Mixtures: Stoichiometry, Vibrational Properties, and Molecular Structure, J. Phys. Chem. A, 2011, 115, 4214–4222 CrossRef CAS PubMed.
Footnote |
| † Electronic supplementary information (ESI) available: Fig. S1–S4 showing loading dependence of in situ Raman, in situ FTIR and static equilibrium Raman spectra obtained for WOx/TiO2(P25) at 250 °C (Fig. S1) and WOx/TiO2(a) at 430, 250 and 175 °C (Fig. S2–S4). See DOI: https://doi.org/10.1039/d2dt00595f |
| This journal is © The Royal Society of Chemistry 2022 |


