Electrodeposition of ligand-free copper nanoparticles from aqueous nanodroplets†
Nicole E.
Tarolla
 a,
Silvia
Voci
a,
Joshua
Reyes-Morales
a,
Silvia
Voci
a,
Joshua
Reyes-Morales
 a,
Andrew D.
Pendergast
 a and
Jeffrey E.
Dick
 *ab
*ab
aDepartment of Chemistry, The University of North Carolina at Chapel Hill, Chapel Hill, NC 27599, USA. E-mail: jedick@email.unc.edu
bLineberger Comprehensive Cancer Center, School of Medicine, The University of North Carolina at Chapel Hill, Chapel Hill, NC 27599, USA
First published on 17th August 2021
Abstract
Copper nanoparticles have emerged as promising electrocatalysts for energy storage and conversion. Generally, homogenous nanoparticle synthesis requires a stabilizing ligand, which may influence the electrocatalysis. Ligands can be avoided by direct nanoparticle electrodeposition. Here, we extend nanodroplet-mediated electrodeposition to the electrodeposition of copper nanoparticles from aqueous nanodroplets suspended in 0.1 M tetrabutylammonium hexafluorophosphate ([TBA][PF6]) and 1,2-dichloroethane. Stochastic electrochemistry on microelectrodes was used to elucidate nanoparticle growth kinetics for various solution conditions and substrate materials. A study on the effect of surfactants on nanoparticle morphology and growth kinetics demonstrated the surfactant's role as an avenue for morphological control. Nanoparticle morphology was studied by Scanning Electron Microscopy (SEM) and Transmission Electron Microscopy (TEM). Energy-dispersive X-ray Spectroscopy (EDX) confirmed the presence of copper nanoparticles. TEM and Selected Area Electron Diffraction (SAED) confirmed nanoparticle size, morphology, and polycrystallinity. We demonstrate tunable nanoparticle size using cyclic voltammetry on single aqueous nanodroplets by altering the voltammetric sweeping potentials of copper electroreduction. Finite element simulations validate the voltammetric response and ability to control the nanoparticle size with nanometer resolution during a voltammetric sweep. These results inform the electrodeposition of copper nanoparticles from aqueous nanodroplets for important applications, such as the conversion of CO2 to hydrocarbon fuels.
Introduction
One of the greatest issues facing society is the production of carbon dioxide (CO2) gas, a thermodynamically stable product of energy generation and transportation processes.1 As the world's energy consumption grows, the accumulation of atmospheric CO2 increases, contributing to deleterious environmental and economic effects.2,3 To combat these issues, there is an urgent need to convert CO2 into useful chemicals and hydrocarbon fuels.4,5 To-date, one of the most promising materials to achieve this goal is copper,6–13 with copper nanoparticles having displayed remarkable CO2 reduction capabilities.1,14–17A great challenge is that synthetic methods used to produce nanoparticles yield a distribution of shapes and sizes,18 making mechanistic investigations on ensembles of nanoparticles difficult to interpret since ensemble measurements report values on the average morphology and surface structure of the nanomaterial. By studying single nanostructures, heterogeneities can be accounted for and differences in size and morphology can be rigorously evaluated.19 A detailed understanding of, and therefore ability to control, these heterogeneities would further improve the design of next generation nanomaterials. Studying the fundamental reactivity and thermodynamics behind nanomaterial formation would allow for the precise and efficient engineering of nanostructures. Nanoparticle synthesis often also necessitates a stabilizing ligand or surfactant, which often must be removed before electrocatalysis can occur.20 A detailed understanding of the reactivity as well as the electrodeposition and oxidation of ligand-free copper nanoparticles would be useful to direct synthetic methods for nanoparticles with a desired property in the conversion of CO2 to useful fuels. Knowledge of these fundamental behaviors will enable precise control over nanoparticle morphology and size.5
To understand reactivity of single nanoparticles, methods have been developed to observe the electrocatalysis of single nanoparticles and isolated atoms and clusters.21–28 These methods are based on allowing single nanoparticles to collide with a microelectrode, where their properties can then be measured at the single nanoparticle level. Percival and Zhang used fast-scan cyclic voltammetry (FSCV) to study the voltammetric response of single, ligand-stabilized nanoparticles on microelectrodes to determine electron-transfer kinetics and electrocatalytic activity.29,30 Compton and co-workers have developed methods to study the anodic oxidation of single nanoparticles in real-time as they collide with a positively-biased electrode surface.31–33 Zamborini's group has performed ensemble experiments to probe how nanoparticle size influences the anodic stripping peak potential, Ep, by synthesizing monodisperse ligand-stabilized nanoparticles, adsorbing them to a relatively inert electrode, and performing anodic stripping voltammetry to observe nanoparticle oxidation.34–36
Electrodeposition can be used as a tool to synthesize nanoparticles without stabilizing ligands;37–39 however, the electrodeposition of a single nanoparticle and control over its size is difficult without the use of very small (radius < 100 nm) nanoelectrodes.40,41 Our group has been studying the electrodeposition of nanoparticles from aqueous nanodroplets39 suspended in 1,2-dichloroethane. We have termed this technique nanodroplet-mediated electrodeposition. An alkylammonium salt is also dissolved into the continuous phase to facilitate charge balance during the reduction of a metal salt precursor to its zero-valent state. Using this system, we have demonstrated the ability to electrodeposit nanoparticles on a variety of substrates without diffusion layer overlap;39 control nanoparticle porosity;42 electrodeposit high entropy metallic glass materials for designer, multifunctional electrocatalysis;37,43 and develop a quantitative model that describes both the electrokinetic and diffusion-limited growth of a single nanoparticle to quantify growth kinetics.44 In many of these experiments, nanoparticle formation was tracked by amperometry, where the collision of single nanodroplets filled with a metal salt could be observed as a transient current spike above the background. When the nanodroplet irreversibly collides with a properly biased microelectrode, a contact radius45,46 drives reactivity within the nanodroplets. This contact radius is effectively a nanoelectrode, and modern electrochemical instrumentation is sufficiently sensitive to measure reactivity within sub-femtoliter volumes. These experiments allow one to study the reactivity of metal salts in sub-femtoliter environments.
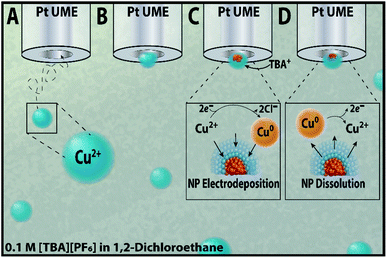
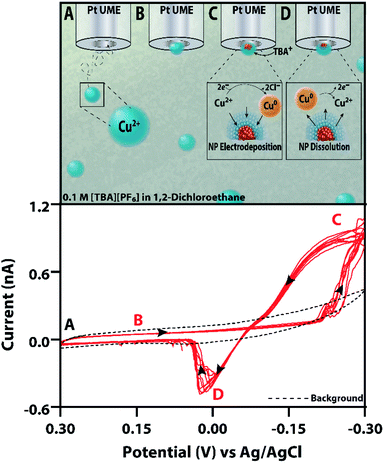
Here, we report the electrodeposition of copper nanoparticles from an inverse emulsion comprised of a cupric chloride (CuCl2) aqueous phase suspended in a 1,2-dichloroethane (1,2-DCE) and 0.1 M tetrabutylammonium hexafluorophosphate [TBA][PF6] oil continuous phase. When a nanodroplet loaded with CuCl2 irreversibly collides with the sufficiently biased microelectrode, the electrodeposition of copper can be observed in amperometry and voltammetry. Scheme 1 shows a representation of this experiment, demonstrating (1A and B) the diffusion and initial collision of an aqueous nanodroplet, (1C) the electrodeposition of a copper nanoparticle at cathodic potentials, and (1D) the subsequent electrodissolution of the nanoparticle at sufficiently positive potentials. Given the structure-sensitive nature of electrocatalysis reactions, such as those initially suggested by Hori et al. for CO2 reduction on copper,47 the dependence of selectivity on nanomaterial size,16,48 and the importance placed on the reactivity of nanostructures,4,5 an in-depth study on each of these variables is necessary to better direct synthesis methods for electrocatalysts. Here, the effect of substrate material and added surfactants on copper nanoparticles' resultant morphology and growth kinetics is studied using amperometry before a robust method to control nanoparticle size for a polydisperse solution is introduced using cyclic voltammetry. Using these different electrochemical techniques allows for a comprehensive study on the morphological characteristics and reactivity of copper nanoparticles.
Results and discussion
Substrate effects on morphology
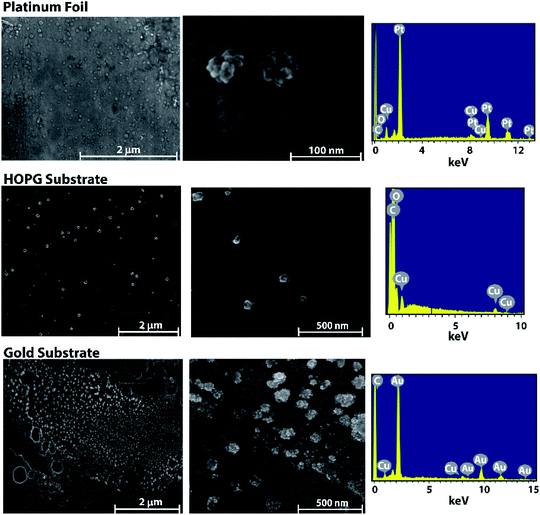
The surface structure and morphology of nanostructures are crucial factors to take into account when tuning the selectivity of an electrocatalyst and obtaining high faradaic efficiencies.4,5,16 Therefore, studying the morphological effects brought about by using different substrates is an important avenue of inquiry.Electrodeposition can be used on a variety of conductive substrates with amperometry being the method of choice for their deposition. The effect that different substrate materials have on the morphology of copper nanoparticles deposited using amperometry was probed using Scanning Electron Microscopy (SEM) to image the nanoparticles and Energy-dispersive X-ray spectroscopy (EDX) to confirm the presence of copper. Each of the nanoparticles was deposited from a water-in-oil emulsion consisting of 50 mM CuCl2 filled aqueous nanodroplets suspended in a continuous phase of 1,2-dichloroethane with 0.1 M [TBA][PF6] as the supporting electrolyte. Three substrates were chosen – platinum, highly oriented pyrolytic graphite (HOPG), and gold – due to the EDX spectra of copper being easily distinguished from the background. As seen in Fig. 1, there are similarities between the observed morphologies of the nanoparticles on each of the different substrates. The nanoparticles appear dendritic in nature, which may be caused by the agglomeration of smaller nanoparticles during the initial moments of electrocrystallization. A detailed mechanism of the morphological growth will be the topic of a future investigation. The size of the copper nanoparticles on each substrate were similar as well: r = 29 nm ± 7 nm, 29 nm ± 9 nm, and 28 nm ± 13 nm, respectively, and were not statistically different when an analysis of variance (ANOVA) test was performed. Histograms showing the SEM data of the nanoparticle size distributions on each of the different substrates can be found in the ESI file (Fig. S1†). Given these results, it is likely that the substrate material does not have a large effect on the morphology of copper nanoparticles at this concentration.
Kinetics analysis
Elucidation of the kinetics of nanoparticle growth can yield significant knowledge on the influence that surfactant molecules may have on the electrodeposition mechanism. In particular, such studies can indicate whether or not surfactant molecules play a role in the rate determining step. Reaction kinetics and mass transfer already play a large role when studying how to produce the most efficient copper nanomaterials for CO2 reduction;4,5 therefore, studying the initial growth kinetics of copper nanoparticles will better direct nanoparticle synthesis for the most productive catalysts.We have previously demonstrated the ability to quantify the growth kinetics of single platinum nanoparticles using amperometry with our nanodroplet-mediated electrodeposition system.44 Here, we have determined the apparent heterogeneous rate constants, k, for single copper nanoparticle growth using a variety of solutions and potentials (Table 1) under conditions of electrokinetically controlled growth. Parameters tested included different viscosities and added surfactants, such as Triton X-100 and sodium dodecyl sulfate (SDS). There is good agreement between the theoretical model and experimental results, as shown in ESI file Fig. S2,† demonstrating the reliability of the model. Representative amperograms of each solution makeup can be found in the ESI file (Fig. S3†).
| Nanodroplet solution | Pt microelectrode | Au microelectrode | ||
|---|---|---|---|---|
| k (cm s−1) | Potential (V) | k (cm s−1) | Potential (V) | |
| 50 mM CuCl2 | 0.0092 ± 0.0062 | −0.30 | 0.0040 ± 0.0019 | −0.25 |
50 mM CuCl2![[thin space (1/6-em)]](https://www.rsc.org/images/entities/char_2009.gif) : :![[thin space (1/6-em)]](https://www.rsc.org/images/entities/char_2009.gif) glycerol (50%, v/v) glycerol (50%, v/v) |
0.0059 ± 0.0026 | −0.30 | 0.0037 ± 0.0012 | −0.25 |
| 50 mM CuCl2 with 0.016% Triton X-100 (w/v) | 0.0069 ± 0.0036 | −0.15 | 0.0040 ± 0.0018 | −0.19 |
| 50 mM CuCl2 with 6 mM SDS | 0.0064 ± 0.0042 | −0.23 | 0.0049 ± 0.0019 | −0.18 |
25 mM CuCl2![[thin space (1/6-em)]](https://www.rsc.org/images/entities/char_2009.gif) : :![[thin space (1/6-em)]](https://www.rsc.org/images/entities/char_2009.gif) glycerol (50%, v/v) glycerol (50%, v/v) |
0.0029 ± 0.0007 | −0.25 | ||
We found the heterogeneous rate constants for the growth of copper nanoparticles deposited from aqueous nanodroplets containing exclusively 50 mM CuCl2 to be 0.0092 ± 0.0062 cm s−1 and 0.0040 ± 0.0019 cm s−1 when using a platinum microelectrode (Pt UME, r ∼ 5 μm) and a gold microelectrode (Au UME, r ∼ 6.25 μm), respectively. The summarized data for each of the different variables tested on the platinum and gold substrates can be found in Table 1 and Fig. S4.† To the best of our knowledge, this is the first time heterogeneous rate constants have been determined for the electrodeposition of single copper nanoparticles at these electrode sizes, materials, and solution conditions.
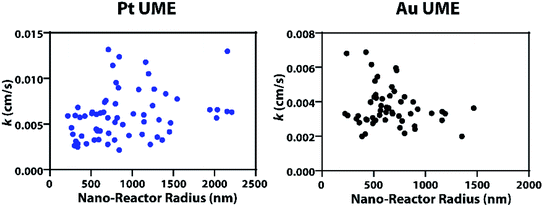
Statistical comparison of the apparent heterogeneous rate constants for Cu nanoparticle growth on Pt and Au substrates were statistically significant when using a one-way ANOVA test, indicating the dependence of kinetics on the substrate material, with platinum displaying faster kinetics. Using our model, the effect of nanodroplet size on heterogeneous rate kinetics was studied and revealed that the kinetics are independent of nanodroplet size, shown in Fig. 2, where there is a large spread of data points instead of a defined trend. The nanodroplet sizes were determined by integrating under the collision transient to obtain the charge (Q), which can then yield the nanodroplet size using Faraday's Law by:
| Q = nFCCuCl2Vnanodroplet | (1) |
 | (2) |
Dynamic Light Scattering (DLS) was also used to determine the nanodroplet size for each of the above solutions and can be found in the ESI file (Fig. S5†).
When determining the effect surfactants and viscosity have on the heterogeneous rate kinetics, there was no statistical difference found for the platinum microelectrode data according to an ANOVA test. Therefore, the different surfactants and viscosities in their present concentrations do not appreciably affect the heterogeneous rate kinetics of copper nanoparticle formation on a platinum substrate. We therefore conclude that surfactants do not play a significant role in the heterogeneous reaction rate. When performing the ANOVA test of significance for the solutions tested on the gold microelectrode, a statistical difference was observed. Yet, when the data from the 6 mM SDS solution were excluded, there was no statistical difference. This likely implies that electron transfer kinetics are affected by SDS in its present concentration and potential on a gold substrate. We note kinetics are dependent on the applied potential and to best determine whether surfactants do not play a role in determining rate kinetics, these experiments must be performed at the same potential. In this manuscript, potentials (Table 1) were chosen because they yielded the greatest amount of collision transients that most closely resembled electrokinetically controlled growth.
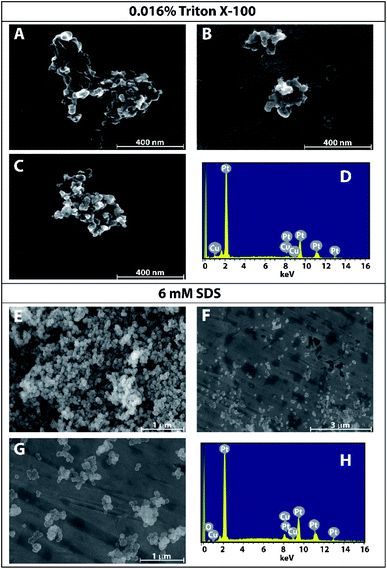
The rather large standard deviations for each of the calculated rate constants can likely be explained by one of the assumptions behind the model44 – that the deposited nanoparticles are hemispherical. As seen in Fig. 1 and 3, regardless of the substrate and solution conditions, the particles are not perfectly hemispherical, instead they are more dendritic (vide infra). Most importantly, however, this technique can easily be extended to other substrates or nanomaterials composed of different metals, making it a widely applicable technique to study the reactivity of nanoparticles for electrocatalytic applications.
Surfactant effects on morphology
While the previous sections indicate that kinetics are not governed by the surfactants used and morphology is not greatly affected by substrate material, surfactants do play a role in the resulting morphology of copper nanoparticles. SEM was used to image copper nanoparticles formed by nanodroplet-mediated electrodeposition on platinum foil when surfactants were included in the nanodroplet with EDX being used to verify the presence of copper. As seen in Fig. 3, nanoparticles formed from aqueous nanodroplets with 0.016% Triton X-100 were much more dendritic than the nanoparticles formed from nanodroplets containing 6 mM SDS or no added surfactant. Given the relatively spherical shape of the nanoparticles formed using 6 mM SDS (Fig. 3), a size analysis was performed with the average nanoparticle radius being 28 nm ± 11 nm, approximately the same size as those seen from nanodroplets comprised of only 50 mM CuCl2 (r = 29 nm ± 7 nm). No statistical difference was observed between the two according to a Student's t-test at the 95% confidence interval. The differences in observed morphologies support the hypothesis that while electron transport kinetics are not governed by these surfactants, it is likely the template of the surfactant that is governing the morphology of the nanoparticles.Controlling nanoparticle size using switching potential
Controlling the size of catalytically active nanoparticles has shown itself to be a successful method for tuning the activity and selectivity of catalysts.16,48 However, in our experiments, the nanodroplets are polydisperse in size. This means that tuning the concentration of CuCl2 in the nanodroplets is not a reliable method to homogenously control nanoparticle size. Although surfactants decrease nanodroplet size polydispersity, we have demonstrated and previously observed that they alter nanoparticle morphology.39 Furthermore, surfactants may affect the electrodeposition mechanism, and their removal is often required before nanoparticles can be used for catalytic purposes.49–51 Therefore, a reliable and reproduceable method was developed to control nanoparticle size for a polydisperse system without the use of surfactants using voltammetry, single nanodroplet isolation, and controlling the switching potential of the electrodeposition process.Fig. 4 shows a representative electrodeposition experiment consisting of 50 mM CuCl2 aqueous nanodroplets in a continuous phase of 1,2-dichloroethane with 0.1 M [TBA][PF6]. Initially, there is a background current due to the double layer on the microelectrode surface (Fig. 4). When a nanodroplet adsorbs to the electrode and once the potential is cycled negative enough to reduce copper(II), a cathodic current is observed. Upon cycling to more positive potentials, an anodic stripping peak is observed, shown in the red voltammogram of Fig. 4.
Control experiments using nanodroplets containing only water, no copper precursor, did not show the characteristics of electrodeposition and anodic stripping; however, some faradaic current due to oxygen reduction at sufficiently negative potentials (−0.2 V vs. Ag/AgCl) was observed (Fig. S6 and S7†). While the reduction of oxygen would make the droplet more alkaline and potentially precipitate copper hydroxide,52 we would expect to observe this effect on peak potential and magnitude during voltammetric cycling. In our experiments, we observe very robust and reproducible voltammetric behavior over many cycles, indicating oxygen reduction likely does not have a large effect (Fig. 4).
While we can determine nanodroplet size by integrating under the anodic stripping peak and using eqn (1) and (2) above, we note that it is not possible to relate the integrated charge under the anodic stripping peak to the nanoparticle size since the nanoparticle is dendritic in nature (Fig. 1). In the stochastic electrochemistry literature, amperometry has been used extensively as a way to use charge to determine reactor size.39,42,45,53,54 Therefore, we compared the nanodroplet size results from amperometry (r = 844 nm ± 366 nm) with those obtained by voltammetry (r = 811 nm ± 244 nm) and dynamic light scattering (r = 738 nm ± 76 nm, Fig. S5†). After performing an ANOVA test, the data displayed no statistical difference between the techniques used. However, it is important to note that the electrochemical techniques use data from single reactors, making it easy to detect outliers, while the scattering technique uses an ensemble average from light scattering patterns and has shown discrepancies in past literature, especially for polydisperse samples.45,53–56
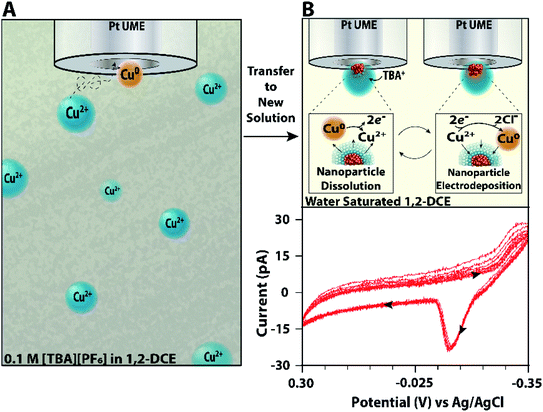
These experiments suffer since another nanodroplet may collide and convolute the signal. Thus, in Fig. 4, it is possible that more than one nanoparticle is being analyzed. To mitigate these issues, we designed an experiment that allows for uninterrupted interrogation within a single reactor. When a nanodroplet irreversibly collides with the microelectrode in the emulsion, it is then transferred to a solution of water saturated 1,2-dichloroethane without reactors. These ‘fishing experiments’ allow for robust interrogation of the reactivity within a single nanodroplet. Further experimental details are given in the Methods section in the ESI file.†
Scheme 2A shows a schematic of the nanodroplet being captured from an inverse emulsion. Scheme 2B shows the subsequent voltammetric experiments performed on the single nanodroplet and the single nanoparticle. The voltammogram in Scheme 2B shows data that are representative of the reduction and stripping of a single nanoparticle. Because there is a lack of variation observed in the charge of the oxidation peak for the single isolated nanodroplet, we can infer that these voltammograms are likely attributed to a single nanoparticle since the electrode was removed from the emulsion solution upon nanodroplet collision after the observation of a featureless (i.e., capacitance-only) voltammetric background. This type of experiment allows one to interrogate the voltammetric reduction and oxidation of single nanoparticles hundreds of times without the need to fabricate a nanoelectrode.
To validate the reliability of the method and ensure nanodroplets are stable in the fresh solution over the time course of the experiment, we correlated this experiment with optical bright field microscopy57 (Fig. S8 in the ESI†). Due to the resolution of the microscope and nature of the measurement, this experiment favors larger droplets (>1 μm in radius). As seen in Fig. S8,† an aqueous nanodroplet with 50 mM CuCl2 was imaged and analyzed electrochemically throughout all stages of the transfer process. This indicates that a single nanodroplet can be isolated from a solution full of nanodroplets, and it is stable enough to be interrogated repeatedly by electrochemical methods over the timecourse of our experiments.
Given the efficacy of this method, we hypothesized that controlling the switching potential will enable control over the nanoparticle size, allowing for the tunability of an essential variable in electrocatalysis. If this hypothesis is correct and the anodic stripping peak potential depends on the nanoparticle size, we should observe a change in the anodic stripping peak potential as a function of switching potential. Fig. 5 shows voltammograms of a single, isolated nanodroplet at various switching potentials. From these voltammograms, as the switching potential becomes more negative, the anodic stripping potential becomes more positive and the overall charge under the stripping wave increases. These observations indicate that controlling the switching potential is a robust means by which one can control the size of a nanoparticle. Fig. 5D shows the quantification of charge as a function of the switching potential. As the switching potential becomes more negative by a value of 10 mV, the charge under the stripping curve increases from an average of 11 pC ± 3 pC to 34 pC ± 15 pC and, lastly, to 49 pC ± 13 pC. Statistical analyses revealed the difference in charge as a function of switching potential was significant using an ANOVA test. Cyclic voltammograms using this method were also obtained that yielded larger droplets which can be found in the ESI file (Fig. S9 and S10†). Droplet aggregation could explain voltammograms yielding high charge values; however, the trend of an increase in charge with more negative switching potentials was still observed.
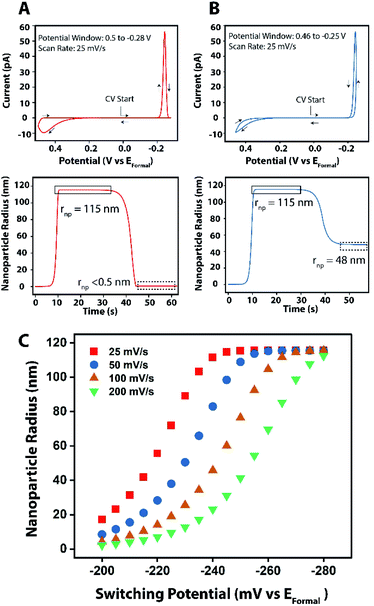
To confirm our experimental results in using the switching potential to control the nanoparticle size, we performed finite element simulations using COMSOL multiphysics. Simulation details can be found in the ESI file.†Fig. 6A and B show simulated cyclic voltammograms for the reversible electrodeposition and electrodissolution of a single hemispherical copper nanoparticle from a 1.3 μm radius aqueous nanodroplet. By tuning the scan rate and the switching potentials, the voltammetric profile of complete (Fig. 6A) and incomplete (Fig. 6B) electrodissolution can be observed, demonstrating a potential method to control nanoparticle size by partial electrodissolution. Fig. 6C presents simulated nanoparticle radii following a single cathodic sweep over a range of different scan rates and switching potentials, showing that at a constant scan rate, the resultant nanoparticle radius is observed to increase with the switching potential. Furthermore, for a given switching potential, the predicted nanoparticle radius is observed to increase at slower scan rates. This behavior can be explained due to the system being exposed to conditions sufficient for nanoparticle growth for increasing timeframes at slower scan rates and higher switching potentials.
Importantly, one can vary the scan rate to adjust the sensitivity by which a nanoparticle might grow (e.g. what switching potential should one choose such that the nanoparticle has only grown 2 nm in radius). This is especially important for electrocatalysis given the catalytic particle size effect,51 and the fact that tuning the size of copper nanoparticles by a few nanometers can influence the selectivity of the CO2 reduction reaction from CO evolution to hydrocarbon production.16
The slopes of the linear regions of the first four data points within each curve are given in Table 2. Notably, these values indicate that a change in the switching potential on the order of 1 mV will change the nanoparticle by only a few nanometers. To exact control over nanoparticle size within a given nanodroplet, the initial volume of the nanodroplet must still be known, which can be calculated by integrating under the stripping peak and using eqn (1) above. The power behind the technique presented here lies in its ability to continuously interrogate a single nanoparticle's electrodeposition and stripping, allowing for the ability to control the size of nanoparticles by merely tuning one parameter.
| Scan rate (mV s−1) | 25 | 50 | 100 | 200 |
| Slope (nm/mV) | 3.12 | 3.07 | 2.94 | 2.73 |
Conclusion
We have demonstrated the ability to deposit ligand-free copper nanoparticles onto a variety of substrates including platinum, highly oriented pyrolytic graphite (HOPG), and gold by nanodroplet-mediated electrodeposition. By using these different substrate materials and tuning experimental parameters, such as the addition of surfactant species, we have shown the effect that these variables have on the heterogeneous kinetics and the nanoparticle's overall morphology. For example, we have demonstrated that surfactants do not play a substantial role in the growth kinetics of copper nanoparticle formation; however, they do impact morphology while substrate material does not have a large effect. We have also developed a method that not only allows for the uninterrupted interrogation of a single nanodroplet, but is a reliable technique to control nanoparticle size in a polydisperse solution without the need for surfactants. We also performed transmission electron microscopy imaging to further validate nanoparticle size, morphology, and crystal structure. TEM and Selected Area Electron Diffraction (SAED) validate the size and morphology, and indicate the nanoparticles are polycrystalline. These data are given in the ESI Fig. S15.† These results create a foundation to use nanodroplet-mediated electrodeposition to form copper nanoparticles for a variety of uses in energy storage and conversion.Author contributions
All authors have given approval to the final version of the manuscript.Conflicts of interest
There are no conflicts to declare.Acknowledgements
This material is based upon work solely supported as part of the Center for Hybrid Approaches in Solar Energy to Liquid Fuels (CHASE), an Energy Innovation Hub funded by the U.S. Department of Energy, Office of Science, Office of Basic Energy Sciences under Award Number DE-SC0021173. We acknowledge use of scanning electron microscopy and energy dispersive X-ray spectroscopy instrumentation at the Chapel Hill Analytical and Nanofabrication Laboratory, CHANL, a member of the North Carolina Research Triangle Nanotechnology Network, RTNN, which is supported by the National Science Foundation, Grant ECCS-2025064, as part of the National Nanotechnology Coordinated Infrastructure, NNCI.References
- R. Kas, R. Kortlever, A. Milbrat, M. T. M. Koper, G. Mul and J. Baltrusaitis, Electrochemical CO2 reduction on Cu2O-derived copper nanoparticles: controlling the catalytic selectivity of hydrocarbons, Phys. Chem. Chem. Phys., 2014, 16(24), 12194–12201 RSC.
- S. E. Schwartz, Uncertainty in climate sensitivity: causes, consequences, challenges, Energy Environ. Sci., 2008, 1(4), 430–453 RSC.
- D. M. D'Alessandro, B. Smit and J. R. Long, Carbon Dioxide Capture: Prospects for New Materials, Angew. Chem., Int. Ed., 2010, 49(35), 6058–6082 CrossRef PubMed.
- S. Nitopi, E. Bertheussen, S. B. Scott, X. Liu, A. K. Engstfeld, S. Horch, B. Seger, I. E. L. Stephens, K. Chan, C. Hahn, J. K. Nørskov, T. F. Jaramillo and I. Chorkendorff, Progress and Perspectives of Electrochemical CO2 Reduction on Copper in Aqueous Electrolyte, Chem. Rev., 2019, 119(12), 7610–7672 CrossRef CAS PubMed.
- D. Raciti and C. Wang, Recent Advances in CO2 Reduction Electrocatalysis on Copper, ACS Energy Lett., 2018, 3(7), 1545–1556 CrossRef CAS.
- M. Gattrell, N. Gupta and A. Co, A review of the aqueous electrochemical reduction of CO2 to hydrocarbons at copper, J. Electroanal. Chem., 2006, 594(1), 1–19 CrossRef CAS.
- C. W. Li and M. W. Kanan, CO2 Reduction at Low Overpotential on Cu Electrodes Resulting from the Reduction of Thick Cu2O Films, J. Am. Chem. Soc., 2012, 134(17), 7231–7234 CrossRef CAS PubMed.
- K. P. Kuhl, E. R. Cave, D. N. Abram and T. F. Jaramillo, New insights into the electrochemical reduction of carbon dioxide on metallic copper surfaces, Energy Environ. Sci., 2012, 5(5), 7050–7059 RSC.
- A. A. Peterson, F. Abild-Pedersen, F. Studt, J. Rossmeisl and J. K. Nørskov, How copper catalyzes the electroreduction of carbon dioxide into hydrocarbon fuels, Energy Environ. Sci., 2010, 3(9), 1311–1315 RSC.
- L. R. L. Ting, R. Garcia-Muelas, A. J. Martin, F. L. P. Veenstra, S. T.-J. Chen, Y. Peng, E. Y. X. Per, S. Pablo García, N. Lopez, J. Perez-Ramirez and B. S. Yeo, Electrochemical Reduction of Carbon Dioxide to 1-Butanol on Oxide-Derived Copper, Angew. Chem., Int. Ed., 2020, 59, 21072–21079 CrossRef CAS PubMed.
- Q. Zhu, X. Sun, D. Yang, J. Ma, X. Kang, L. Zheng, J. Zhang, Z. Wu and B. Han, Carbon dioxide electroreduction to C2 products over copper-cuprous oxide derived from electrosynthesized copper complex, Nat. Commun., 2019, 10(1), 3851 CrossRef PubMed.
- Y. Hori, K. Kikuchi and S. Suzuki, Production of CO and CH4 in electrochemical reduction of CO2 at metal electrodes in aqueous hydrogencarbonate solution, Chem. Lett., 1985, 14(11), 1695–1698 CrossRef.
- Y. Hori, A. Murata, R. Takahashi and S. Suzuki, Electroreduction of carbon monoxide to methane and ethylene at a copper electrode in aqueous solutions at ambient temperature and pressure, J. Am. Chem. Soc., 1987, 109(16), 5022–5023 CrossRef CAS.
- D. Kim, J. Resasco, Y. Yu, A. M. Asiri and P. Yang, Synergistic geometric and electronic effects for electrochemical reduction of carbon dioxide using gold–copper bimetallic nanoparticles, Nat. Commun., 2014, 5(1), 4948 CrossRef CAS PubMed.
- R. Kortlever, J. Shen, K. J. P. Schouten, F. Calle-Vallejo and M. T. M. Koper, Catalysts and Reaction Pathways for the Electrochemical Reduction of Carbon Dioxide, J. Phys. Chem. Lett., 2015, 6(20), 4073–4082 CrossRef CAS PubMed.
- R. Reske, H. Mistry, F. Behafarid, B. Roldan Cuenya and P. Strasser, Particle Size Effects in the Catalytic Electroreduction of CO2 on Cu Nanoparticles, J. Am. Chem. Soc., 2014, 136(19), 6978–6986 CrossRef CAS PubMed.
- C. W. Li, J. Ciston and M. W. Kanan, Electroreduction of carbon monoxide to liquid fuel on oxide-derived nanocrystalline copper, Nature, 2014, 508(7497), 504–507 CrossRef CAS PubMed.
- J. B. Sambur, T.-Y. Chen, E. Choudhary, G. Chen, E. J. Nissen, E. M. Thomas, N. Zou and P. Chen, Sub-particle reaction and photocurrent mapping to optimize catalyst-modified photoanodes, Nature, 2016, 530(7588), 77–80 CrossRef CAS PubMed.
- M. Choi, N. P. Siepser, S. Jeong, Y. Wang, G. Jagdale, X. Ye and L. A. Baker, Probing Single-Particle Electrocatalytic Activity at Facet-Controlled Gold Nanocrystals, Nano Lett., 2020, 20(2), 1233–1239 CrossRef CAS PubMed.
- H. S. Toh, K. Jurkschat and R. G. Compton, The Influence of the Capping Agent on the Oxidation of Silver Nanoparticles: Nano-impacts versus Stripping Voltammetry, Chem.–Eur. J., 2015, 21(7), 2998–3004 CrossRef CAS PubMed.
- J. E. Dick and A. J. Bard, Toward the Digital Electrochemical Recognition of Cobalt, Iridium, Nickel, and Iron Ion Collisions by Catalytic Amplification, J. Am. Chem. Soc., 2016, 138(27), 8446–8452 CrossRef CAS PubMed.
- D. A. Robinson, A. M. Kondajji, A. D. Castaneda, R. Dasari, R. M. Crooks and K. J. Stevenson, Addressing Colloidal Stability for Unambiguous Electroanalysis of Single Nanoparticle Impacts, J. Phys. Chem. Lett., 2016, 7(13), 2512–2517 CrossRef CAS PubMed.
- A. D. Castaneda, D. A. Robinson, K. J. Stevenson and R. M. Crooks, Electrocatalytic amplification of DNA-modified nanoparticle collisions via enzymatic digestion, Chem. Sci., 2016, 7(10), 6450–6457 RSC.
- T. M. Alligrant, R. Dasari, K. J. Stevenson and R. M. Crooks, Electrocatalytic Amplification of Single Nanoparticle Collisions Using DNA-Modified Surfaces, Langmuir, 2015, 31(42), 11724–11733 CrossRef CAS PubMed.
- A. J. Bard, H. J. Zhou and S. J. Kwon, Electrochemistry of Single Nanoparticles via Electrocatalytic Amplification, Isr. J. Chem., 2010, 50(3), 267–276 CrossRef CAS.
- M. W. D. Glasscott and J. E. Dick, Direct Electrochemical Observation of Single Platinum Cluster Electrocatalysis on Ultramicroelectrodes, Anal. Chem., 2018, 90, 7804–7808 CrossRef CAS PubMed.
- M. Zhou, S. J. Bao and A. J. Bard, Probing Size and Substrate Effects on the Hydrogen Evolution Reaction by Single Isolated Pt Atoms, Atomic Clusters, and Nanoparticles, J. Am. Chem. Soc., 2019, 141(18), 7327–7332 CrossRef CAS PubMed.
- M. Zhou, J. E. Dick and A. J. Bard, Electrodeposition of Isolated Platinum Atoms and Clusters on Bismuth-Characterization and Electrocatalysis, J. Am. Chem. Soc., 2017, 139(48), 17677–17682 CrossRef CAS PubMed.
- Z. Guo, S. J. Percival and B. Zhang, Chemically Resolved Transient Collision Events of Single Electrocatalytic Nanoparticles, J. Am. Chem. Soc., 2014, 136(25), 8879–8882 CrossRef CAS PubMed.
- S. J. Percival and B. Zhang, Fast-Scan Cyclic Voltammetry Allows Determination of Electron-Transfer Kinetic Constants in Single Nanoparticle Collision, J. Phys. Chem. C, 2016, 120(37), 20536–20546 CrossRef CAS.
- Y. G. Zhou, B. Haddou, N. V. Rees and R. G. Compton, The charge transfer kinetics of the oxidation of silver and nickel nanoparticles via particle-electrode impact electrochemistry, Phys. Chem. Chem. Phys., 2012, 14(41), 14354–14357 RSC.
- N. V. Rees, Y. G. Zhou and R. G. Compton, The Aggregation of Silver Nanoparticles in Aqueous Solution Investigated via Anodic Particle Coulometry, ChemPhysChem, 2011, 12(9), 1645–1647 CrossRef CAS PubMed.
- Y. G. Zhou, N. V. Rees and R. G. Compton, Electrode-nanoparticle collisions: the measurement of the sticking coefficient of silver nanoparticles on a glassy carbon electrode, Chem. Phys. Lett., 2011, 514(4–6), 291–293 CrossRef CAS.
- D. K. Pattadar, J. N. Sharma, B. P. Mainali and F. P. Zamborini, Anodic stripping electrochemical analysis of metal nanoparticles, Curr. Opin. Electrochem., 2019, 13, 147–156 CrossRef CAS.
- S. L. Allen, J. N. Sharma and F. P. Zamborini, Aggregation-Dependent Oxidation of Metal Nanoparticles, J. Am. Chem. Soc., 2017, 139(37), 12895–12898 CrossRef CAS PubMed.
- O. S. Ivanova and F. P. Zamborini, Size-Dependent Electrochemical Oxidation of Silver Nanoparticles, J. Am. Chem. Soc., 2010, 132(1), 70–72 CrossRef CAS PubMed.
- A. D. Pendergast, M. W. Glasscott, C. Renault and J. E. Dick, One-step electrodeposition of ligand-free PdPt alloy nanoparticles from water droplets: controlling size, coverage, and elemental stoichiometry, Electrochem. Commun., 2019, 98, 1–5 CrossRef CAS.
- Y. E. Jeun, B. Baek, M. W. Lee and H. S. Ahn, Surfactant-free electrochemical synthesis of metallic nanoparticles via stochastic collisions of aqueous nanodroplet reactors, Chem. Commun., 2018, 54(72), 10052–10055 RSC.
- M. W. Glasscott, A. D. Pengergast and J. E. Dick, A Universal Platform for the Electrodeposition of Ligand-Free Metal Nanoparticles from a Water-in-Oil Emulsion System, ACS Appl. Nano Mater., 2018, 1(10), 5702–5711 CrossRef CAS.
- S. L. Chen and A. Kucernak, Electrodeposition of platinum on nanometer-sized carbon electrodes, J. Phys. Chem. B, 2003, 107(33), 8392–8402 CrossRef CAS.
- J. Velmurugan, J. M. Noel, W. Nogala and M. V. Mirkin, Nucleation and growth of metal on nanoelectrodes, Chem. Sci., 2012, 3(11), 3307–3314 RSC.
- M. W. Glasscott and J. E. Dick, Fine-Tuning Porosity and Time-Resolved Observation of the Nucleation and Growth of Single Platinum Nanoparticles, ACS Nano, 2019, 13(4), 4572–4581 CrossRef CAS PubMed.
- M. W. Glasscott, A. D. Pendergast, S. Goines, A. R. Bishop, A. T. Hoang, C. Renault and J. E. Dick, Electrosynthesis of high-entropy metallic glass nanoparticles for designer, multi-functional electrocatalysis, Nat. Commun., 2019, 10, 2650 CrossRef PubMed.
- M. W. Glasscott, C. M. Hill and J. E. Dick, Quantifying Growth Kinetics of Single Nanoparticles in Sub-Femtoliter Reactors, J. Phys. Chem. C, 2020, 124(26), 14380–14389 CrossRef CAS.
- B. K. Kim, A. Boika, J. Kim, J. E. Dick and A. J. Bard, Characterizing Emulsions by Observation of Single Droplet Collisions—Attoliter Electrochemical Reactors, J. Am. Chem. Soc., 2014, 136(13), 4849–4852 CrossRef CAS PubMed.
- M. W. Glasscott and J. E. Dick, Visualizing Phase Boundaries with Electrogenerated Chemiluminescence, J. Phys. Chem. Lett., 2020, 11(12), 4803–4808 CrossRef CAS PubMed.
- Y. Hori, H. Wakebe, T. Tsukamoto and O. Koga, Adsorption of CO accompanied with simultaneous charge transfer on copper single crystal electrodes related with electrochemical reduction of CO2 to hydrocarbons, Surf. Sci., 1995, 335, 258–263 CrossRef CAS.
- S. Mukerjee, Particle size and structural effects in platinum electrocatalysis, J. Appl. Electrochem., 1990, 20(4), 537–548 CrossRef CAS.
- J. F. Callejas, C. G. Read, C. W. Roske, N. S. Lewis and R. E. Schaak, Synthesis, Characterization, and Properties of Metal Phosphide Catalysts for the Hydrogen-Evolution Reaction, Chem. Mater., 2016, 28(17), 6017–6044 CrossRef CAS.
- E. J. Popczun, C. G. Read, C. W. Roske, N. S. Lewis and R. E. Schaak, Highly Active Electrocatalysis of the Hydrogen Evolution Reaction by Cobalt Phosphide Nanoparticles, Angew. Chem., Int. Ed., 2014, 53(21), 5427–5430 CrossRef CAS PubMed.
- Y. T. Guntern, V. Okatenko, J. Pankhurst, S. B. Varandili, P. Iyengar, C. Koolen, D. Stoian, J. Vavra and R. Buonsanti, Colloidal Nanocrystals as Electrocatalysts with Tunable Activity and Selectivity, ACS Catal., 2021, 11(3), 1248–1295 CrossRef CAS.
- J. D. Cuppett, S. E. Duncan and A. M. Dietrich, Evaluation of Copper Speciation and Water Quality Factors That Affect Aqueous Copper Tasting Response, Chem. Senses, 2006, 31(7), 689–697 CrossRef CAS PubMed.
- B.-K. Kim, J. Kim and A. J. Bard, Electrochemistry of a Single Attoliter Emulsion Droplet in Collisions, J. Am. Chem. Soc., 2015, 137(6), 2343–2349 CrossRef CAS PubMed.
- Y. Li, H. Deng, J. E. Dick and A. J. Bard, Analyzing Benzene and Cyclohexane Emulsion Droplet Collisions on Ultramicroelectrodes, Anal. Chem., 2015, 87(21), 11013–11021 CrossRef CAS PubMed.
- H. Deng, J. E. Dick, S. Kummer, U. Kragl, S. H. Strauss and A. J. Bard, Probing Ion Transfer across Liquid–Liquid Interfaces by Monitoring Collisions of Single Femtoliter Oil Droplets on Ultramicroelectrodes, Anal. Chem., 2016, 88(15), 7754–7761 CrossRef CAS PubMed.
- J. Lee, T. L. T. Ho, H.-Y. Kim, J. H. Park and B.-K. Kim, Direct Electrolysis and Detection of Single Nanosized Water Emulsion Droplets in Organic Solvent Using Stochastic Collisions, Electroanalysis, 2019, 31(1), 167–171 CAS.
- C. K. Terry Weatherly, M. W. Glasscott and J. E. Dick, Voltammetric Analysis of Redox Reactions and Ion Transfer in Water Microdroplets, Langmuir, 2020, 36(28), 8231–8239 CrossRef CAS PubMed.
Footnote |
| † Electronic supplementary information (ESI) available: Histograms showing the size distributions of nanoparticles from SEM, theoretical model vs. amperometric results for kinetics analysis, representative amperograms, summarized kinetics data, dynamic light scattering (DLS) data, cyclic voltammograms with water only droplets, overlay of cyclic voltammograms of water only droplets and CuCl2 droplets, correlated electrochemical experiments with optical microscopy, cyclic voltammograms of a potential conglomeration of CuCl2 droplets in water saturated 1,2-dichloroethane, overall trend of the integrated charge as a function of peak potential, materials and methods section, COMSOL discussion. See DOI: 10.1039/d1ta02369a |
| This journal is © The Royal Society of Chemistry 2021 |

