Highly efficient photoluminescent graphene oxide with tunable surface properties†
Qingsong
Mei
ab,
Kui
Zhang
ab,
Guijian
Guan
a,
Bianhua
Liu
a,
Suhua
Wang
*a and
Zhongping
Zhang
*ab
aInstitute of Intelligent Machines, Chinese Academy of Sciences, Hefei, Anhui, 230031, China. E-mail: zpzhang@iim.ac.cn; shwang@iim.ac.cn
bDepartment of Chemistry, University of Science & Technology of China, Hefei, Anhui, 230026, China
First published on 7th September 2010
Abstract
A bright blue fluorescent graphene oxide that originates from passivation of surface reactive sites by amide formation and ring-opening amination of epoxide has been prepared. The surface polarity and charges of the fluorescent graphene oxide can synchronously be tuned by varying the used alkylamines.
Highly efficient and stable luminescent materials are of fundamental and technological importance in optoelectronic devices, biological labeling and sensing.1–4 Intensive efforts have been made in the exploration of new efficient emitters such as semiconductor quantum dots,1 silicon nanoparticles,2 gold nanodots,3 and carbon-based nanomaterials including carbon nanotubes, nanodiamond, and carbon dots (C-dots).4 Among those materials, the fluorescent carbon-based nanomaterials have been attracting much more attention as they show more stable emissions, lower cytotoxicity and give rise to less environmental concern. The origin of photoluminescence (PL) in these carbon-based nanomaterials is tentatively proposed to be from isolated polyaromatic structures or passivated surface defects.4 However, the preparation of these carbon nanomaterials usually shows a very low yield and is carried out under extreme conditions, e.g. laser ablation, high temperature and high pressure.4 Graphene oxide (GO) nanosheet, a two-dimensional oxidized derivative of graphene, also contains isolated polyaromatic clusters and can be easily exfoliated from graphite with a high yield under simple oxidizing conditions. While it has been widely studied in regard to electrical conductivity, drug delivery, self-assembly, and surface functionalization,5 the PL properties of GO have rarely been explored due to its low emission efficiency.6
GO possesses a finite electronic bandgap generated by the disruption of π networks due to the formation of oxygen-containing groups. It is well documented that GO nanosheet bears phenol hydroxyl and epoxide groups at the basal plane and carboxylic groups at the lateral edge.6 Recently, an extremely weak broad PL from GO was reported, which was believed to originate from the carbon sp2 domains/clusters,6,7 but it was invisible under UV irradiation. Even though the PL intensity was slightly improved after moderate reduction using hydrazine, the quantum yield (QY) was too low to be measured accurately.6 Moreover, the weak PL was quenched upon further reduction with hydrazine due to the formation of non-fluorescent graphene that is known as a zero-bandgap semiconductor.
As we know, the epoxy and carboxylic groups usually induce non-radiative recombination of localized electron–hole (e–h) pairs, which leads to the nonemissive property of GO.6 However, alkylamines are reactive to both the epoxy and carboxylic groups through nucleophilic reaction. The removal of non-radiative recombinative sites is expected to transform GO nanosheet into a highly efficient emitter. Here we report a bright blue fluorescent GO which was achieved by the surface amide formation and ring-opening amination of epoxide of an original GO by using various alkylamines. The functionalized GO exhibits a maximum QY up to ∼13% and tunable surface properties such as hydrophilic, hydrophobic and negative charges. The highly fluorescent GO nanosheets with diverse surface properties could facilitate and expand their applications in optoelectronics, biolabeling, and bioimaging.
GO nanosheet was first prepared by the oxidation of graphite using a modified Hummers method.8 The fluorescent GO was obtained through a facile and effective chemical approach consisting of the acylation reaction to form alkylamides and the ring-opening aminations of epoxides to yield 1,2-amino alcohols at the lateral edge and basal surface of GO nanosheets, respectively (see ESI). Typically, the original GO was activated first using dichlorosulfoxide to transform carboxylic groups (at the lateral edge) into acyl chloride under anhydrous conditions. The further treatment with n-butylamine (C3Me) led to the occurrence of acylation and ring-opening reactions at the GO nanosheets. The product was separated from the mixture and was redispersed in appropriate solvents for further studies. The n-butylamine modified GO is called GO-C3Me here for easy communication.
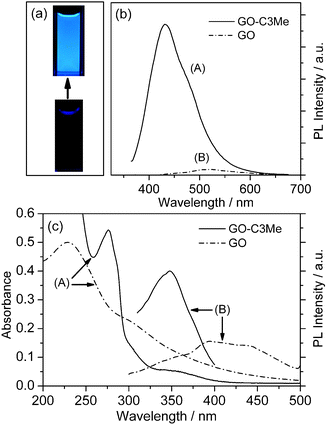
The GO-C3Me aqueous suspension exhibits strong blue fluorescence under UV irradiation which can be easily seen with the naked eye and recorded with a digital camera, as shown in Fig. 1a. The PL spectrum of GO-C3Me shows an emission maximum at 430 nm under the excitation wavelength of 350 nm (Fig. 1b). Unlike GO-C3Me, the starting GO shows no visible fluorescence when irradiated under the same UV lamp (Fig. 1a, bottom) and only a very weak PL maximum at 525 nm (Fig. 1b-B). The PL quantum yield of GO-C3Me was measured to be ∼13% (see ESI), which is about six hundred fold that of the original GO nanosheets (0.02%). The fluorescence enhancement by n-butylamine treatment could be attributed to the surface passivation instead of n-butylamine molecules themselves because they contain no any visible or near-UV fluorophores. The surface passivation removes reactive sites such as epoxy and carboxylic groups by nucleophilic reactions and hence improves the emission efficiency of the sp2 domains on GO nanosheets. This can be evidenced by the changes of absorption and excitation spectra of GO before and after alkylamine treatment (Fig. 1c). Clearly, the absorption peak around 230 nm of GO is assigned to the π–π* transitions of C![[double bond, length as m-dash]](https://www.rsc.org/images/entities/char_e001.gif) C. After alkylamine treatment, absorption bands at 276 nm and 350 nm become more pronounced and resolved. Meanwhile, the corresponding excitation spectrum exhibits a strong exciting band centered at 350 nm. The results suggest the formation and increase of new luminescent centers at the surface of GO-C3Me nanosheets.9
C. After alkylamine treatment, absorption bands at 276 nm and 350 nm become more pronounced and resolved. Meanwhile, the corresponding excitation spectrum exhibits a strong exciting band centered at 350 nm. The results suggest the formation and increase of new luminescent centers at the surface of GO-C3Me nanosheets.9
 | ||
| Fig. 1 (a) Photographs of GO-C3Me (above) and GO (below) aqueous solutions under 350 nm irradiation. (b) Photoluminescence spectra of (A) GO-C3Me and (B) GO in water (18 μg ml−1). (c) The UV-vis absorption spectra (A) of GO (dashed line, 0.02 mg ml−1) and GO-C3Me (solid line, 0.5 mg ml−1) aqueous solution, and the excitation spectra (B) of GO (dashed line, 18 μg ml−1) and GO-C3Me (solid line, 18 μg ml−1) aqueous solutions. | ||
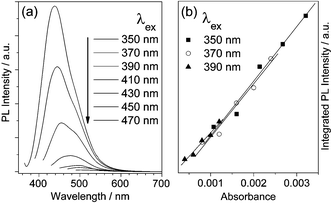
Interestingly, the emission maxima of the GO-C3Me aqueous suspension are dependent on the excitation wavelengths (Fig. 2). The emission maxima shift from 430 nm to 515 nm accompanied by the gradual decrease in emission intensity as the excitation wavelength varies from 350 nm to 470 nm. Furthermore, the integrated emission intensities are correlated with the absorbance in a parallel way (Fig. 2b), indicating similiar PL quantum yield among those emissive sites. The results further suggest the existence of heterogeneous electronic structures attributed to the polydistribution of sp2 cluster sizes within GO-C3Me.
 | ||
| Fig. 2 (a) Photoluminescence spectra of GO-C3Me aqueous solution at the different excitation wavelengths. (b) The correlation between the integrated PL intensities and the absorbance at the excitation wavelengths. The excitation beam intensities are calibrated for the integration of PL intensity. | ||
In general, GO shows very weak PL because of the isolated sp2 domains generated by oxidation.6,7 These sp2 domains have opened heterogeneous electronic band gaps which are intrinsically correlated to their sizes, shapes, and fractions. In principle, large sp2 domains have narrower energy gaps than those smaller ones and emit longer wavelengths when excited at appropriate wavelengths. However, the epoxide groups on the basal plane and carboxylic groups at the edge of GO often induce non-radiative recombination of localized e–h pairs, leading to a very low quantum yield. After reacting with alkylamines, these groups are removed and this results in a bright photoluminescence.
Similar photoluminescent characteristics were also observed when GO was modified with other alkylamines such as 1,6-hexylenediamine (C6NH2), octylamine (C7Me), dodecylamine (C11Me) and diamine-terminated poly(ethylene glycol) (PEG1500N). These longer alkylamine-passivated GO also exhibit bright blue fluorescence under UV light. The emission maxima show the same dependence on the excitation wavelengths (see ESI). For example, the emission maximum of GO-PEG1500N suspension shifts from 430 nm to 570 nm when the excitation wavelength varies accordingly. The PL quantum yields of these different surface passivated GO are measured using the same procedure and presented in Table 1. It is clear that the PL quantum yields obviously decrease with the increase of carbon chain length in the alkylamine molecules. GO-PEG1500N still exhibits a 4% quantum yield that is comparable to the PEG1500N capped C-dots (∼5%).4 Meanwhile, the alkylamine functionalized GO also become less hydrophilic as the the length of carbon chain increases, consistent with their molecular polarity. Furthermore, the surface charges are dependent not only on pH values but also on the properties of amines (see ESI). Therefore, the surface properties of the alkylamine functionalized GO can be easily tuned by altering the passivation molecular properties.
| Sample | NH2/C | Φ (%)a | Solubility |
|---|---|---|---|
| a The quantum yields were measured in H2O, H2O, H2O, ethanol, ethanol and H2O under excitation of 350 nm, respectively. | |||
| GO | 0 | 0.02 | H2O, DMF, ethanol |
| GO-C3Me | 1/4 | 12.8 | H2O, DMF, ethanol |
| GO-C6NH2 | 1/3 | 11.9 | H2O, DMF, ethanol |
| GO-C7Me | 1/8 | 5.0 | DMF, ethanol, cyclohexane |
| GO-C11Me | 1/12 | 5.6 | DMF, ethanol, cyclohexane |
| GO-PEG1500N | 1/34 | 4.0 | H2O, DMF, ethanol |
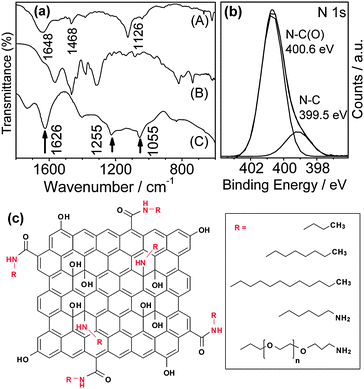
The surface covalent attachment of n-butylamine is supported by FT-IR and X-ray spectroscopy (XPS) data, as shown in Fig. 3. For GO-C3Me, a new vibration band around 1648 cm−1 due to the C![[double bond, length as m-dash]](https://www.rsc.org/images/entities/char_e001.gif) O stretching of primary amide emerges (Fig. 3a),10 but the carboxylic group bands at 1733 and 1225 cm−1 of original GO disappear after the chemical treatment. The results immediately suggest the covalent attachment of n-butylamine to the GO surface through the formation of an amide bond. It can also be seen that the epoxide band at 1055 cm−1 of the GO completely disappears in GO-C3Me, accompanied by the appearance of a new band at 1126 cm−1 that is assigned to the C–N–C asymmetric stretching of the attached alkylamines. Clearly, n-butylamine not only successfully removes the epoxy groups but also covalently attaches on the surface of GO by ring-opening aminations of epoxides to yield 1,2-amino alcohols. The double bands around 740 cm−1 and 818 cm−1 of the –NH2 vibration in pure n-butylamine disappear in the GO-C3Me sample, which strongly excludes the physical adsorption of n-butylamine. The band at 1626 cm−1 owing to the C
O stretching of primary amide emerges (Fig. 3a),10 but the carboxylic group bands at 1733 and 1225 cm−1 of original GO disappear after the chemical treatment. The results immediately suggest the covalent attachment of n-butylamine to the GO surface through the formation of an amide bond. It can also be seen that the epoxide band at 1055 cm−1 of the GO completely disappears in GO-C3Me, accompanied by the appearance of a new band at 1126 cm−1 that is assigned to the C–N–C asymmetric stretching of the attached alkylamines. Clearly, n-butylamine not only successfully removes the epoxy groups but also covalently attaches on the surface of GO by ring-opening aminations of epoxides to yield 1,2-amino alcohols. The double bands around 740 cm−1 and 818 cm−1 of the –NH2 vibration in pure n-butylamine disappear in the GO-C3Me sample, which strongly excludes the physical adsorption of n-butylamine. The band at 1626 cm−1 owing to the C![[double bond, length as m-dash]](https://www.rsc.org/images/entities/char_e001.gif) C vibration of aromatic rings is observed in both GO-C3Me and GO samples, implying the retention of most of the sp2 characteristic structures in GO-C3Me even after the alkylamine treatment. XPS results also suggest the covalent attachment of butylamine through amide formation (Fig. 3b). The result of deconvolution treatment for the N 1s spectrum revealed two peaks at 400.6 and 399.5 eV, which are attributed to the N 1s of the N–C bond of the amide linkage and the N–C bond of 1,2-amino alcohols of GO nanosheets,10 respectively. Based on the FT-IR and XPS analysis, a structure of the GO-C3Me is modeled as presented in Fig. 3c. The GO-C3Me nanosheet consists of small sp2 conjugated aromatic domains isolated by sp3 carbon.
C vibration of aromatic rings is observed in both GO-C3Me and GO samples, implying the retention of most of the sp2 characteristic structures in GO-C3Me even after the alkylamine treatment. XPS results also suggest the covalent attachment of butylamine through amide formation (Fig. 3b). The result of deconvolution treatment for the N 1s spectrum revealed two peaks at 400.6 and 399.5 eV, which are attributed to the N 1s of the N–C bond of the amide linkage and the N–C bond of 1,2-amino alcohols of GO nanosheets,10 respectively. Based on the FT-IR and XPS analysis, a structure of the GO-C3Me is modeled as presented in Fig. 3c. The GO-C3Me nanosheet consists of small sp2 conjugated aromatic domains isolated by sp3 carbon.
 | ||
| Fig. 3 (a) FT-IR spectra of (A) GO-C3Me, (B) n-butylamine and (C) GO. (b) Nitrogen 1s XPS spectrum obtained from GO-C3Me showing the oxidation states of nitrogen atoms. (c) The structure of alkylamine functionalized GO (R represents various hydrocarbon chains). | ||
In summary, we have prepared a bright blue photoluminescent GO by surface alkylamine functionalization under mild conditions. The fluorescence quantum yields of the alklyamine-functionalized GO are remarkably enhanced up to six hundred times compared with the original GO. Meanwhile, the surface properties of the modified GO can be easily tuned from hydrophilic to hydrophobic by changing the molecular structures of the used amines. These will greatly expand the applications of GO in many fields.
This work was supported by Natural Science Foundation of China (20925518, 20875090, 20807042, 30901008) and China–Singapore Joint Project (2009DFA51810) and 863 project of China (2007AA10Z434) and Innovation Project of Chinese Academy of Sciences (KSCX2-YW-G-058).
Notes and references
- M. Bruchez, M. Moronne, P. Gin, S. Weiss and A. P. Alivisatos, Science, 1998, 281, 2013 CrossRef CAS; X. Michalet, F. F. Pinaud, L. A. Bentolila, J. M. Tsay, S. Doose, J. J. Li, G. Sundaresan, A. M. Wu, S. S. Gambhir and S. Weiss, Science, 2005, 307, 538 CrossRef CAS; S. H. Wang, M. Y. Han and D. J. Huang, J. Am. Chem. Soc., 2009, 131, 11692 CrossRef CAS.
- J. H. Warner, A. Hoshino, K. Yamaomto and R. D. Tilley, Angew. Chem., Int. Ed., 2005, 44, 4550 CrossRef CAS.
- C. C. Huang, Z. Yang, K. H. Lee and H. T. Chang, Angew. Chem., Int. Ed., 2007, 46, 6824 CrossRef CAS; C. C. Huang, H. Y. Liao, Y. C. Shiang, Z. H. Lin, Z. Yang and H. T. Chang, J. Mater. Chem., 2009, 19, 755 RSC.
- J. E. Riggs, Z. X. Guo, D. L. Carroll and Y. P. Sun, J. Am. Chem. Soc., 2000, 122, 5879 CrossRef CAS; Y. Lin, B. Zhou, R. B. Martin, K. B. Henbest, B. A. Harruff, J. E. Riggs, Z. X. Guo, L. F. Allard and Y. P. Sun, J. Phys. Chem. B, 2005, 109, 14779 CrossRef CAS; S. J. Yu, M. W. Kang, H. C. Chang, K. M. Chen and Y. C. Yu, J. Am. Chem. Soc., 2005, 127, 17604 CrossRef CAS; V. N. Mochalin and Y. Gogotsi, J. Am. Chem. Soc., 2009, 131, 4594 CrossRef CAS; Y. P. Sun, B. Zhou, Y. Lin, W. Wang, K. A. Shiral Fernando, P. Pathak, M. J. Meziani, B. A. Harruff, X. Wang, H. F. Wang, P. G. Luo, M. E. Kose, B. Chen, L. M. Veca and S. Y. Xie, J. Am. Chem. Soc., 2006, 128, 7756 CrossRef CAS; H. Liu, T. Ye and C. D. Mao, Angew. Chem., Int. Ed., 2007, 46, 6473 CrossRef CAS; A. B. Bourlinos, A. Stassinopoulos, D. Anglos, R. Zboril, M. Karakassides and E. P. Giannelis, Small, 2008, 4, 455 CrossRef CAS.
- O. C. Compton, D. A. Dikin, K. W. Putz, L. C. Brinson and S. T. Nguyen, Adv. Mater., 2010, 22, 892 CrossRef CAS; L. J. Cote, F. Kim and J. X. Huang, J. Am. Chem. Soc., 2009, 131, 1043 CrossRef CAS; Z. Liu, J. T. Rovinson, X. M. Sun and H. J. Dai, J. Am. Chem. Soc., 2008, 130, 10876 CrossRef CAS.
- Z. T. Luo, P. M. Vora, E. J. Mele, A. T. Charlie Johnson and J. M. Kikkawa, Appl. Phys. Lett., 2009, 94, 111909 CrossRef; G. Eda, Y. Y. Lin, C. Mattevi, H. Yamaguchi, H. A. Chen, I. S. Chen, C. W. Chen and M. Chhowalla, Adv. Mater., 2010, 22, 505 CrossRef CAS.
- X. M. Sun, Z. Liu, K. Welsher, J. T. Robinson, A. Goodwin, S. Zaric and H. J. Dai, Nano Res., 2008, 1, 203 Search PubMed.
- W. S. Hummers and R. E. Offeman, J. Am. Chem. Soc., 1958, 80, 1339 CrossRef CAS; V. C. Tung, M. J. Allen, Y. Yang and R. B. Kaner, Nat. Nanotechnol., 2009, 4, 25 CrossRef CAS.
- D. Li, M. B. Muller, S. Gilje, R. B. Kaner and G. G. Wallace, Nat. Nanotechnol., 2008, 3, 101 CrossRef CAS; Z. T. Luo, Y. Lu, L. A. Somers and A. T. Charlie Johnson, J. Am. Chem. Soc., 2009, 131, 898 CrossRef CAS.
- N. B. Colthup, L. Daly and S. E. Weberley, in Introduction to Infrared and Raman Spectroscopy, Academic Press, New York, USA, 1999 Search PubMed; O. C. Compton, D. A. Dikin, K. W. Putz, L. C. Brinson and S. T. Nguyen, Adv. Mater., 2009, 21, 1 Search PubMed.
Footnote |
| † Electronic supplementary information (ESI) available: Preparation and characterization of alkylamine-modified graphene oxide. See DOI: 10.1039/c0cc02374d |
| This journal is © The Royal Society of Chemistry 2010 |
