
 Open Access Article
 This Open Access Article is licensed under a
 Creative Commons Attribution 3.0 Unported Licence
Compression, expansion and relaxation of soft colloidal monolayers at the air/water interface†
Vahan
Abgarjan
,
Keumkyung
Kuk
,
Jonathan Linus Samuel
Garthe
,
Tillmann Lukas
Wigger
 and
Matthias
Karg
*
and
Matthias
Karg
*
Institut für Physikalische Chemie I: Kolloide und Nanooptik, Heinrich-Heine-Universität Düsseldorf, Universitätsstr. 1, 40225 Düsseldorf, Germany. E-mail: karg@hhu.de; Tel: +49 211 81 12400
First published on 15th April 2025
Abstract
The phase behavior of soft and deformable microgels at fluid interfaces is typically studied with a Langmuir trough and using uniaxial compression. In situ investigations that shine light on the structural arrangements and changes during compression are scarce. Knowledge on the phase behavior is mostly generated from ex situ observations after transfer of monolayers from the fluid interface onto a substrate. Similarly, little is known about the impact of the compression geometry and potentially occurring relaxation processes after compression. Here, we use small-angle light scattering implemented in a Langmuir trough to follow the evolution of microgel monolayers in situ and in real time. We use core–shell microgels as soft model colloids where the rigid cores ensure large contrast for light diffraction. Not only the influence of compression but also the influence of expansion is studied as well as relaxation after previous compression/expansion. At sufficiently high surface pressures, densely packed monolayers of partially compressed microgels are obtained at air/water interfaces. In this regime, the monolayer response upon manipulation of the accessible interfacial area is reversible over many cycles. The uniaxial geometry of this manipulation leads to anisotropic deformation of the monolayer seen by the recorded structure factor. Upon stopping compression/expansion, anisotropy relaxes with two time constants but full isotropy is not recovered. This work underlines the potential and necessity of in situ ensemble techniques for investigating soft colloidal monolayers at fluid interfaces. With our results, we advance the understanding of how soft colloids react to uniaxial compression/expansion.
1 Introduction
The assembly of nano- and also microparticles into functional superstructures is an important step in materials science where the development of new materials from tailor-made building blocks requires a deep fundamental understanding.1 Often such building blocks are surface modified by polymeric ligands including DNA,2,3 homopolymer ligands4–7 or cross-linked polymer shells8–10 to render them colloidally stable and to manipulate/control their interparticle interactions and thus assemblies. Despite their stark difference in chemical composition and behavior, natural and synthetic macromolecular ligands typically render particles with long-range soft interactions11 in contrast to rigid bodies12,13 that show a steep interaction potential. While the close-packing of rigid discs leads to a maximum area fraction of 0.91 in 2-dimensional assemblies and the close-packing of rigid spheres in 3-dimensional assemblies has its limit of 74% space-filling, soft and deformable colloids can be packed far beyond this limit depending on their ‘softness’.14–16 A good example and model system for such soft colloids are microgels.15,17–19 Microgels are colloid-like objects consisting of a 3-dimensional polymer network that can be swollen by a good solvent rendering them soft and deformable.18 The wet-chemical synthesis by precipitation polymerization is relatively simple, reproducible and leads to monodisperse microgels where microgel size can be tailored for example through surfactants.20–23 One of the most common examples of such microgels is based on poly-N-isopropylacrylamide (PNIPAM) cross-linked with N,N′-methylenebisacrylamide (BIS). Via seeded precipitation polymerization, nanoparticles can be encapsulated by PNIPAM leading to core–shell (CS) microgels. Using gold and silver nanoparticles as cores, such core–shell microgels can be used to create plasmonic surface coatings with controlled resonance coupling features,8,10,24,25 for example. While the last decades have seen tremendous efforts in studying 3-dimensional assemblies of microgels and CS microgels using confocal microscopy,26,27 spectroscopy19,28,29 and small angle-neutron30–33 and X-ray scattering,19,31,32,34 recent studies on the phase behavior in 2-dimensional confinement at fluid interfaces have gained significant interest.35–43 The reader is also referred to recent review articles addressing the phase behavior of microgels at fluid interfaces.14,44,45At liquid interfaces (oil/water or air/water), microgels and CS microgels self-assemble into two-dimensional structures.35,37,46–48 This is why such soft colloids have attracted significant interest for the stabilization of fluid interfaces, for example, in foams49,50 and emulsions.51–53 Understanding of the microstructure at the interface and its response to alterations in packing density and varying colloid softness as well as understanding of mechanisms leading to destabilization of fluid interfaces53 is therefore crucial from a fundamental and also application related perspective. Using a Langmuir trough (LT), the available interfacial area (A) can be reduced by moving barriers, thus compressing a microgel monolayer. In previous works compression of such monolayers confined at fluid interfaces revealed different phases from liquid-like to crystalline structures.39,54–57 In contrast to their rigid counterparts, microgels deform significantly (lateral stretching/compression) at the interface, making it possible to create more complex microstructures.38,44,58,59 The microstructure of a thin film of soft microgels confined at liquid interfaces is typically studied ex situ by using microscopy applied to monolayer samples that were transferred to solid supports and subsequently dried. Little is known on whether the structures obtained from such ex situ analysis match to the structure at the respective fluid interface. Similarly, the influence of compression geometry and potential relaxation processes after compression/expansion of a confined soft colloidal monolayer is not well understood.
Recently, we reported on the in situ (at the liquid interface) vs. ex situ (dried state on a solid substrate) analysis applied to hard–core soft–shell microgel monolayers, where we observed significant structural differences.60,61 The in situ measurements relied on analysis of optical diffraction by using small-angle light scattering (SALS) that we combined with a Langmuir trough (LT-SALS). Applied to colloids with large enough optical contrast, e.g. through inorganic cores of higher refractive index, SALS revealed as perfectly suited to follow changes in microstructure in a non-destructive manner and excellent resolution in time and space monitoring ensemble behavior rather than local information as obtained for example through microscopy.
In this work, we study the uniaxial deformation of monolayers of CS microgels at air/water interfaces using SALS. Thanks to the rigid, inorganic nanoparticle core, the microgels possess high optical contrast enabling the analysis by light diffraction with high signal-to-noise ratio. At the same time, due to the significant difference in core and total microgel size, recorded SALS patterns are dominated by the structure factor of the microgel assembly. Using automated peak analysis, we directly extract the structure factor maximum that is then used to compute interparticle distances during monolayer deformation. Thereby, we investigate the influence of uniaxial compression, expansion and relaxation processes during rest on the microstructural arrangement of the CS microgels in real time. We show that the trough geometry leads to an anisotropic distortion of the soft colloidal monolayer that does not return to an isotropic state upon long equilibration.
2 Materials and methods
2.1 Materials
Ethanol (99.8%, Sigma-Aldrich, Taufkirchen, Gemany), tetraethyl orthosilicate (TEOS, 98%, Sigma-Aldrich), ammonium hydroxide solution (NH3 (aq.), 30%, PanReac AppliChem, Darmstadt, Germany), rhodamine B isothiocyanate (RITC, mixed isomers, Sigma-Aldrich), (3-aminopropyl)trimethoxysilane (APS, 97%, Sigma-Aldrich), 3-(trimethoxysilyl)propyl methacrylate (MPS, 98%, Sigma-Aldrich), N,N′-methylenebisacrylamide (BIS, 98%, Sigma-Aldrich), potassium peroxodisulfate (KPS, 99%, Sigma-Aldrich), sodium dodecylsulfate (SDS, Ph. Eur., Merck, Darmstadt, Germany) were used as received. Water was purified by a Milli-Q system (18.2 MΩ cm) and N-isopropylacrylamide (NIPAM, 97%, TCI) by recrystallization from cyclohexane (99.8%, Fisher Scientific).2.2 Methods
3 Results and discussion
In order to study the influence of uniaxial compression and expansion on the microstructure of soft colloidal monolayers at air/water interfaces by in situ SALS, we synthesized CS microgels with tailored dimensions.62 The role of the cores is primarily to provide high enough contrast for SALS to enable the measurement of the structure factor with high signal-to-noise ratio. The core and shell dimensions (dcore (TEM) = 433 ± 15 nm and dh (DLS, 20 °C) = 1003 ± 20 nm) were optimized so that we can resolve the structure factor of the microgel assemblies by SALS over the full range of surface pressures, Π. Correspondingly, the shell-to-core size ratio defined as the ratio between the total particle size and the core size is approximately 2.3 which renders the system comparable to previous studies36,63 and ensures that interparticle interactions are related to the microgel shell for a broad range of compressions.60 To monitor the response of the monolayer and potential changes in microstructure at the air/water interface and during the compression and expansion, we used SALS. This setup consists of a LT with a transparent window (microscopy trough) that allows for the compression/expansion of a monolayer and the simultaneous investigation by SALS, a technique previously introduced/featured in our recent paper.60 The diffraction patterns captured in situ, i.e., the structure factors of the microgel monolayer at the air/water interface, not only revealed the evolving symmetries of the microstructure under compression/expansion but also enabled the determination of the average nearest neighbor center-to-center distance, dc–c, corresponding to the measured Π (in real time).3.1 Compression isotherm and diffraction images
Fig. 1 shows a compression isotherm recorded at the air/water interface at 20 °C. Π increases continuously with decreasing trough area, A. The initial area at t = 0 s with fully opened barriers, A0, was used to normalize A. Note that the compression experiment was started at a non-zero Π (at approximately 8 mN m−1), i.e., under conditions where already a significant fraction of the available A was filled with CS microgels in laterally stretched shell–shell contact.64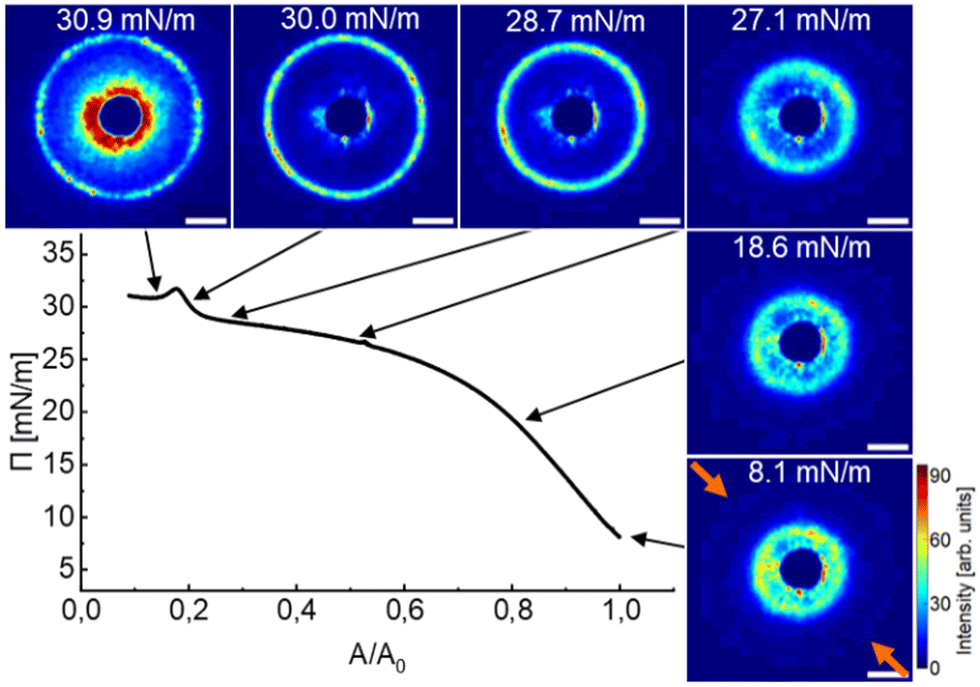 | ||
| Fig. 1 Compression isotherm (3 mm min−1) of a monolayer of CS microgels at the air/water interface: Surface pressure Π as a function of normalized area A/A0. Colored images correspond to diffraction patterns from SALS at given surface pressures. The grayscale of the recorded diffraction images was converted into a color scale (bright, from OriginPro 2021b) for better visibility, more details can be found in the experimental section. The orange arrows in the bottom right diffraction image show the compression direction that was the same for all SALS data in this work. The uniformly colored, dark blue inner circle in all diffraction images is the beam stop. The scale bars correspond to 10 mm real space dimension. | ||
Six diffraction images captured at various values of Π (black arrows) are exemplarily shown along the isotherm. Starting at the lowest surface pressure (8.1 mN m−1), we observe a large number of diffraction peaks that are centrosymmetrically aligned at scattering angles clearly outside the beam stop. Towards the beam stop we also observe diffuse scattering. The occurrence of many diffraction peaks indicates a multidomain structure with various lattice orientations. We want to note that our SALS setup probes macroscopic sample areas of > 1 mm2 that can accommodate a large number of CS microgels. Throughout the compression, the diffraction ring with the diffraction peaks grows in radius, starting from the vicinity of the beam stop (dark blue, homogeneously colored inner area) and extends outwards. In other words, the structure factor maximum shifts to larger values of the magnitude of the scattering vector, q, as A decreases. This indicates that dc–c decreases as Π increases, i.e. the microgels are getting closer. At the beginning of the compression, there is a substantial increase in Π that is accompanied by relatively small changes of the structure factor position towards larger q. The diffuse scattering near the beam stop diminishes progressively, implying that the decrease in dc–c is accompanied by a reduction of the broad distribution of dc–c, therefore becoming more uniform. At approximately 25 mN m−1, the isotherm displays a pseudo-plateau characterized by a minimal increase in Π, while the diffraction ring that still contains a large number of diffraction peaks not only undergoes substantial radial expansion but also becomes more defined. These observations imply that not only the dc–c is significantly reduced in this range of Π meaning that we start compressing the CS microgels but also that the degree of order is increasing with compression. Finally, the monolayer collapses, evidenced by the second steep growth of Π from 29.5 to 31.7 mN m−1 followed by a drop to 30.8 mN m−1 resulting in a plateau of Π. The collapse of the monolayer is further corroborated by the increased contribution of diffuse scattering near the beam stop caused by the multi-scattering of overlapping/buckling microgel layers.
Since the recorded diffraction patterns from SALS correspond directly to the structure factor of the monolayer, we can quantitatively analyze the structural evolution of the monolayer. For this purpose, the diffraction images were radially averaged to yield one-dimensional intensity profiles (for an example, see Fig. S1 in the ESI†).
Fig. 2(a) depicts a color map of the intensity profiles as a function of q and Π, where the intensity is represented as a color code. It should be noted that the scattering intensity in the range of low q up to 3 μm−1 was masked by a primary beam stop. At 8 mN m−1, two peaks can be differentiated with peak positions, qmax, at 3.3 μm−1 and 5.1 μm−1. The peak intensity at 3.3 μm−1, identified as the diffuse scattering near the beam stop, decreases with increasing Π. For the structure factor peak, we observe a small linear shift of qmax from 5.1 μm−1 at 8 mN m−1 to 6.1 μm−1 at 27 mN m−1, followed by a drastic increase to a constant value of 9.5 μm−1 at > 30 mN m−1. Fig. 2(b) displays the calculated dc–c from the structure factor peak as a function of Π. Based on the dc–c analyzed in situ at given Π, we divided the isotherm into three regions. In region I, there is a substantial increase in Π (from 8 mN m−1 to approximately 25 mN m−1) and values of dc–c decreased only slightly and in a linear manner (black line) from 1.43 μm to 1.22 μm. The intercept of the linear fit to the data, i.e. the extrapolation to Π = 0 mN m−1, gives an estimation of the interfacial diameter, di, 1.52 μm in this case. Compared to dh measured in the swollen state (20 °C), this means that the microgels stretch laterally by a factor of approximately 1.5 as compared to their bulk dimensions in dilute dispersion. This is in agreement to findings in our previous work.61 In region II, there is a substantial change in dc–c down to a constant value of 0.77 μm where we reach region III at >30 mN m−1. Region III is where we observed monolayer collapse. The vertical dashed lines in Fig. 2(b) divide the plot into these three regions. We want to note that these lines shall not indicate sharp borders between the regions, even though the dc–c–Π data is highly reproducible and therefore provides a universal representation for this microgel regardless of the initial Π of the experiment. Region II is highlighted with a green shaded area as we will later focus on this region for further experiments. Two horizontal red dashed lines mark the bulk apparent hydrodynamic diameter dh of the CS microgels in the swollen (at 20 °C) and collapsed (at 50 °C) state as reference. In region I where we observe a strong increase in Π but only a small change in dc–c, interparticle distances are significantly larger than dh due to the lateral stretching of the microgel shells at the interface.36,65 In this region microgels are in their stretched shell–shell contacts and islands of microgels are surrounded by voids. Upon compression, i.e., reduction of the available A, the voids are closed leading to an increase in the area fraction that is covered with microgels. This is in qualitative agreement with the observation in the low to medium surface pressure regime in a previous study.64 However, direct comparison is not reasonable as different microgels were studied and experiments were conducted at oil/water interfaces in contrast to air/water interfaces in the present work. The closing of voids during compression is accompanied by only small changes in dc–c. In region II where we see rather small changes in Π but the strongest changes in dc–c, significant deformation of the shells occurs as we further reduce A. Starting from microgels in their stretched shell–shell contacts (dc–c significantly larger than dh,20![[thin space (1/6-em)]](https://www.rsc.org/images/entities/char_2009.gif) °C), values of dc–c are reached that are significantly smaller than dh,20°C.
°C), values of dc–c are reached that are significantly smaller than dh,20°C.
 | ||
| Fig. 2 (a) Radially averaged scattering profiles from diffraction images captured during the measurement in Fig. 1; color scale intensity as a function of the magnitude of the scattering vector q for given surface pressure Π. (b) Calculated interparticle distance dc–c as a function of Π. Black dashed vertical lines divide regions I, II and III. The green colored area marks region II. Red dotted horizontal lines indicate the hydrodynamic diameter dh of the CS microgel in the swollen (20 °C) and collapsed (50 °C) state. The black, solid line corresponds to a linear fit (slope = −0.011 kPa−1 and y-intercept = 1.52 μm) to selected data points in the low to medium Π regime. (c) The same data set from (a) plotted for the given normalized area A/A0. (d) Normalized square of the interparticle distance (dc–c2) at A0 (dc–c,02) as a function of A/A0 for region I only. The solid line is a linear fit yielding a slope of 0.66. | ||
Fig. 2(c) shows the same data as in (a) but plotted versus the normalized trough area A/A0. While we see very little change in the position of the structure factor peak over a large range of reduction in trough area (from A/A0 = 1 to approximately 0.4), significant changes happen at further reduction in area, i.e., in region II and the beginning of region III. This can be explained by a transition from a relatively disordered (low Π) to a higher ordered monolayer structure (high Π), supported by in situ light microscopy images (see images in the ESI,† Fig. S2). In the images for Π < 25 mN m−1, we observed relatively large distances between the CS microgels, where they were ordered into multiple hexagonal domains, containing occasional defects. During the compression in region I mostly (microgel-free) voids are closed. This is supported by Fig. 2(d) where we plot normalized values of the square of the interparticle distance, dc–c2, as a function of the A/A0 for region I data only. Albeit the relatively large error bars, we see a linear decrease of dc–c2/dc–c,02 with decreasing A. The errors were computed using error propagation and using the FHWM of the structure factor peak as a measure of the standard deviation for dc–c. The linear fit to the data (solid line in Fig. 2(d)) provides a slope of 0.66. This value is significantly lower than the expected value of 0.91 for 2-dimensional hexagonal close-packing of circles. In other words, values of dc–c decrease significantly less than expected for a homogeneous, close-packed monolayer. This is also supported by the plots and detailed discussion provided in the ESI† (e.g. Fig. S3), where the trough area vs. area per particle, AP, showed a clear linear correlation over a broad range of trough areas (Fig. S3a, ESI†). Values of AP were directly determined by counting the number of microgels from the microscopy images of Fig. S2 in the ESI.† The clear linear trend implies that we deal with a constant number of CS microgels at the air/water interface independent of the available trough area in this regime of the isotherm. With the determined values of AP we calculated the theoretical values of dc–c assuming 2-dimensional close-packing (area fraction of 0.91). Fig. S3b (ESI†) shows that calculated values of dc–c are always larger than the measured values from the real space images. Considering our estimated interfacial diameter of 1.52 μm, the corresponding measured dc–c is at 1.25 μm. This observation can only be explained by voids between islands of ordered microgels in shell–shell contact with already deformed/overlapping shells. Reduction of the trough area in regime I leads to reduction of the voids. Therefore, in order to study the response of the microgel monolayer on uniaxial compression/expansion, region I is rather unsuitable. Before we discuss the behavior of the monolayer to alternating compression and expansion steps, we will look at the influence of the barrier speed on the monolayer response and its microstructure.
3.2 Influence of compression speed
In order to study the influence of the compression speed, three monolayers were prepared in sequence with the same starting conditions, but three different compression speeds were used. Fig. 3(a) shows the compression isotherm and normalized dc–c (see Fig. S4 in the ESI† for absolute values) from measured diffraction images for all three (slow: 3 mm min−1, medium: 30 mm min−1 and fast: 270 mm min−1; from dark to bright) compression speeds. We started at Π of ∼26.5 mN m−1 and dc–c between 1.05 μm and 1.10 μm. Here we normalized dc–c in regard to the starting values to highlight relative differences during the compression. The values of Π and dc–c followed similar trends as shown in Fig. 1 and 2(b) (3 mm min−1 compression speed) in region II, but a deviation was observed in the isotherms at very high Π (region III), where higher maximum values of Π were reached with faster compression speeds. It is noteworthy that Π dropped to a value of ∼35 mN m−1 for all three compressions within a few seconds after the barriers stopped. The evolution of dc–c (red solid lines) overlaps for slow and medium compression speeds, whereas the third line (fast barrier speed), shows a smaller relative change in dc–c over the whole course of compression. Vertical dashed lines mark the beginning (1), middle (2) and end (3) position of the compression. The diffraction patterns corresponding to these positions are shown in Fig. 3(b). At the beginning of the experiments (position 1, A/A0 = 1.0) all three SALS patterns look very similar with centrosymmetric diffraction rings with multiple, random intensity maxima along the ring. These patterns are characteristic for a multidomain structure without long-range order and potentially an isotropic fluid background. Upon compression to A/A0 = 0.725, i.e. position 2, we observe anisotropic diffraction patterns with a degree of distortion that increases with increasing compression speed. The structure factor maximum appears at larger angles, i.e., further away from the beam center in the direction parallel to the compression direction (‖). This indicates that the microgel monolayer becomes compressed stronger in the direction of compression with smaller interparticle distances as compared to perpendicular to the compression (⊥) where the structure factor maxima are located closer to the beam center. Furthermore, we see the increase in long-range hexagonal order by the appearance of a six-fold symmetry albeit the Bragg peaks being rather broad and with low intensity. For the fastest compression, the degree of order is lower at position 2 compared to the slowest and medium compression speeds. At the end of our compression experiments, at position 3 and A/A0 = 0.45, the diffraction images reveal less anisotropy at a first glance and show more pronounced Bragg peaks with six-fold symmetry. Generally, as the monolayers are compressed the structure factors move towards larger angles, i.e., further away from the beam center, indicating the reduction in interparticle distance independent of the compression speed. It is noticeable that the diffraction ring from the fast compression speed continued moving to larger angles for an additional 5 s after the barriers stopped (red framed image). This implies that the relaxation of the monolayer is slower than the compression at constant speed, at least for the fastest compression. | ||
| Fig. 3 (a) Compression isotherms for various speeds of compression (black line: 3 mm min−1, gray line: 30 mm min−1 and light gray line: 270 mm min−1), surface pressure Π and normalized interparticle distance dc–c/dc–c,0 (in red) as a function of normalized area A/A0. The darker the red color of the curves, the slower was the applied speed of compression, similar to the brightness used for Π. All three compression experiments were performed with freshly prepared monolayers. (b) Diffraction images at given positions as marked and highlighted by dashed vertical lines in (a). The orange arrows indicate the compression direction. The color code of the frames around groups of diffraction images corresponds to the colors of the compression isotherms in (a). The red-framed diffraction image was taken 5 seconds after the barriers stopped. The scale bars correspond to 10 mm. (c) The ratio of the structure factor maximum determined parallel (‖) and perpendicular (⊥) to the compression direction of the diffraction patterns from (b) is given as a function of position on the isotherm from (a). | ||
The anisotropy of the diffraction patterns was quantified by using the ratio of the structure factor maximum parallel (‖) and perpendicular (⊥) to the compression direction at given positions (see Fig. 3(c)). A horizontal dashed line marks the isotropic state with the ratio (‖)/(⊥) = 1 as a reference. At position 1, the diffraction patterns for all three compression speeds are isotropic with values of (‖)/(⊥) that are very close to unity. During the compression (position 2), the anisotropy increased by about 3% for the slow, 7% for the medium and 13% for the fast compression speed. For the slow and medium compression, the anisotropy did not change significantly when compressing from position 2 to position 3. In contrast, for the fast compression, the values of (‖)/(⊥) decreased by 6% and by a further 2% after 5 s equilibration (red triangle). While these experiments have revealed the influence of compression speed on the monolayer response, it was also shown that LT-SALS is an excellent tool to determine not only changes in interparticle spacing with great time resolution but also changes in monolayer symmetry. These findings will be the basis for the following experiments where we address the reversibility of microgel response not only for compression but also for expansion. To do so, we will focus on region II (green shaded area in Fig. 2(b) where we would expect an elastic response of the monolayer due to the dense packing of microgels. For this we choose a low barrier speed of 1 mm min−1 to decrease the asymmetric deformation of the monolayer as much as possible in order to get the best reversibility.
3.3 Influence of uniaxiality in monolayer deformation
To link the macroscopic changes to the monolayer (i.e., A/A0) with local changes in the microgel arrangement, we again make use of SALS. Fig. 4(a) shows the surface pressure isotherm (1 mm min−1) for a second compression/expansion cycle (black/blue line) with arrows pointing to the respective direction of the process. The first compression and expansion cycle is shown in Fig. S5 in the ESI.† Since we always found better reversibility beginning with the second cycle and a more pronounced hysteresis in the first cycle, we will focus on the observed phenomena within the second cycle. In Fig. 4(a) three positions (A/A0) on the isotherm are marked with vertical dashed lines. At these given positions, diffraction images reveal the structural states for compression (1–3) and expansion (4–6) in Fig. 4(b). We want to note that the SALS image 1 captures the state right after the end of the first compression and expansion cycle and right before the start of the next compression with the beginning of cycle 2. In Fig. 4(c), the radially averaged intensity profiles from the diffraction images are shown for better visualization of the structure factor and its evolution. Colored arrows point to the direction of profile development. Upon compression (black line in Fig. 4(a)) starting from position 1 at a Π of 25.0 mN m−1, we see a nearly linear increase in Π accompanied by a shift of the structure factor to larger q (see Fig. 4(b) and (c)). This indicates that the compression of the monolayer leads to a reduction in interparticle distance, as expected. Looking more closely at the SALS images in Fig. 4(b), we see several intensity maxima along the diffraction ring, varying in number and position with compression indicating that we average over different crystalline domains. For the highest compressed state (position and image 3), we can identify a six-fold symmetry of the diffraction pattern indicating larger domain sizes with hexagonally ordered CS microgels. | ||
| Fig. 4 (a) Compression (black) and expansion (blue) isotherm (each at 1 mm min−1) of CS microgels at the air/water interface, surface pressure Π as a function of normalized trough area A/A0. The black and blue arrows indicate the compression and expansion directions. Numbers mark three selected positions on the isotherm. The red circle indicates the measured surface pressure after expansion and equilibration for 30 minutes. (b) Diffraction images correspond to the points on the isotherm highlighted in (a). The orange arrows indicate the direction of compression (points 1–3) and expansion (points 4–6). The red-framed diffraction image was taken after expansion and equilibration for 30 minutes corresponding to Π marked with a red circle in (a). The scale bars correspond to 10 mm. (c) Radially averaged scattering profiles of images shown in (b), intensity as a function of the magnitude of scattering vector q. Colored arrows display the compression and expansion steps. (d) The orientation of the structure factor contribution parallel (‖) and perpendicular (⊥) to the compression/expansion direction (orange arrows). | ||
With expansion (blue line in Fig. 4(a)) starting from position 4 at Π = 27.6 mN m−1, we see an almost ideal overlap with the compression isotherm (1–3), whereby a minorN hysteresis becomes noticeable towards lower Π (toward position 1). This hysteresis was more pronounced in the first compression and expansion cycle (see Fig. S3 in the ESI†). The decrease of Π is accompanied by a shift of the structure factor to smaller q (Fig. 4(b) and (c)), i.e. increasing interparticle distance. At the same time, looking more closely at the SALS images in Fig. 4(b), we see a significant distortion of the diffraction ring, which is particularly pronounced in images 1 and 6, i.e. after the very first compression followed by expansion (image 1) and after the second expansion (image 6). The direction of the uniaxial compression in the used LT is indicated by the orange arrows in image 1 of Fig. 4(b). Similarly, the orange arrows in image 4 of Fig. 4(b) highlight the direction of uniaxial expansion. The fact that the diffraction patterns become anisotropic means that the microstructure of the monolayer is also anisotropic. In images 1 and 6 we see that the structure factor maximum is closer to the beam stop in the direction of uniaxial manipulation (‖) and further away in the perpendicular direction (⊥). This means that interparticle distances increase stronger in the direction of expansion as compared to perpendicular to the direction of expansion. At the end of the expansion, i.e. at position 6, we kept the trough area constant for 30 min. The red circle in Fig. 4(a) marks the measured Π after this equilibration time. The measured value of Π lies closely in between the values measured right at the start of the second compression and expansion cycle (position 1) and the value determined at the end of this expansion cycle (position 6), prior to the equilibration. The red framed SALS image in Fig. 4(b) shows the corresponding diffraction pattern recorded after the equilibration. Even after such long equilibration, the diffraction ring appeared still slightly anisotropic. This implies that the monolayer shows sort of a memory effect with respect to its uniaxial deformation, at least for the relatively high Π regime investigated here and the given timescales. In other words when uniaxially compressed in the dense packing regime, the microstructure of the monolayer will become anisotropic and does not return to its fully isotropic state. We attribute this to overlapping and entangled shells of the stretched CS microgels at the interface that restrict translational rearrangements, at least to some extent. It is possible that the monolayer will recover its initial isotropic arrangement for longer waiting times and/or expansion to lower final Π.
The experiments discussed in this section reveal that already at very slow barrier speeds (1 mm min−1), deformations in region II lead to anisotropic changes in the microstructure of the monolayer, especially in the case of expansion. We will now look closer at the monolayers properties after repeated compression and expansion cycles. Knowing that the anisotropy appears for very low barrier speeds, we will use 3 mm min−1 in the following to reduce the duration of the experiments.
3.4 Reversibility of monolayer under compression and expansion
We now want to study whether the behavior of the monolayer upon compression is reversible and what happens upon expansion of a previously compressed monolayer. Surprisingly, the available literature on microgels and CS microgels at fluid interfaces focuses on compression, while investigations on the expansion of compressed monolayers are notably scarce. We repeated several compression and expansion cycles and monitored the evolution of Π and dc–c.Fig. 5 visualizes the compression/expansion cycles in terms of area changes represented by A/A0 (gray), Π (black) and dc–c (red) as a function of time and cycle number, respectively. A single cycle is defined as one compression step followed by one expansion step. The shaded area in green marks region II as introduced in the previous section. In Fig. 5(a), the A/A0 profile (gray solid lines) exhibits an alternating linear decrease and increase ranging from 1 to 0.43 with a time of 3618 s per cycle. During the initial cycle, values of Π ascended from 26.3 mN m−1 to a maximum (35.4 mN m−1) and diminished to a minimum (23.7 mN m−1). On the other hand, dc–c decreased from 1.07 μm to a minimum (0.72 μm) and increased to a maximum (1.22 μm). As the number of cycles increased, a general reduction of Π and a simultaneous increase in dc–c is revealed, implying a reduction in the number of microgels present at the interface. This observation aligns with the findings of Gong et al.,56 where the microgels seem to escape the interface (reduction of Π) and reappear outside the barriers (increase of Π). In our case, a significant decrease (∼30%) to the initial cycle values is observed in both the maximum and minimum value for Π, within the fifth cycle, while dc–c increased (∼15%) accordingly. This is reasonable as we reached relatively high values of Π approaching region III towards the end of each compression in the first three cycles. Therefore, to achieve reversibility, we have to lower the limit of Π that is reached in the compression cycles. The result from this experiment is shown in Fig. 5(b) where the A/A0 profile alternates linearly between the values of 1 and 0.69 with a time of 2005 s per cycle. During the initial cycle, Π ascended from 26.4 mN m−1 to a maximum (28.0 mN m−1) and diminished to a minimum (25.3 mN m−1). On the other hand, dc–c decreased from 1.07 μm to a minimum (0.89 μm) and increased to a maximum (1.15 μm). The values of Π and dc–c followed the linear A/A0 trend (zig zag shape) closely. Furthermore, we see very good reversibility with variations of less than 3% over five cycles. The values of dc–c followed nearly the same linear path during the expansions in reverse to the compressions. This confirms the elastic response of the monolayer below the critical value of Π. Thus, performing alternating compression and expansion cycles staying closely within region II ensures that the monolayer response is reversible.
 | ||
| Fig. 5 Repeated compression/expansion cycles (each at 3 mm min−1). Surface pressure Π and interparticle distance dc–c as a function of cycle number and the normalized area A/A0 as a function of time as a reference are shown. (a) Cycles compressed beyond region II and (b) with adjusted parameters to not exceed region II are presented. The green-colored area marks region II. | ||
We will now study potential structural changes right after monolayer compression/expansion. To do so, we will add equilibration times after each step of compression and expansion and focus on the structure factor evolution from SALS.
3.5 Relaxation experiments
We will now focus on time-dependent changes of the monolayer. Therefore, we repeated the compression and expansion cycles as shown in Fig. 5(b) and added equilibration times in between every compression/expansion step. Furthermore, we performed these relaxation experiments using two significantly different compression/expansion speeds of 3 mm min−1 and 9 mm min−1. In Fig. 6(a), the results for the slow (3 mm min−1) repeated compression/expansion cycles are shown. The gray line profile visualizes A/A0 as a function of time. The compression (reduction in A/A0) was carried out from 1.0 to 0.69 A/A0 within 1003 s followed by an equilibration (constant A/A0) for 900 s. The expansion (increase in A/A0) was performed with the same speed and up to the initial trough area (A/A0 = 1.0), resulting in a total cycle time of 3806 s. The black and red line profiles represent the values of Π and dc–c during these cycles. In the beginning, Π increased from 27.7 mN m−1 to 29.1 mN m−1, whereas dc–c decreased from 1.05 μm to 0.86 μm. Within the following equilibration, no significant changes (<1%) in Π and dc–c were observed. During the first expansion, Π decreased from 29.0 mN m−1 to 27.0 mN m−1 and dc–c increased from 0.86 μm to 1.09 μm. Again, no significant changes were observed during the following equilibration phase. Fig. 6(b) shows the results for the fast (9 mm min−1) repeated compression/expansion cycles. The gray line profile depicts the A/A0 as a function of time in the same manner as shown in Fig. 6(a). The compression and expansion were carried out from 1.0 to 0.69 A/A0 within 333 s. | ||
| Fig. 6 Repeated compression and expansion cycles for slow (a: 3 mm min−1) and fast (b: 9 mm min−1) barrier speeds, surface pressure Π and interparticle distance dc–c as a function of cycle number and the normalized area A/A0 as a function of time as a reference are shown. Marked areas indicate the relaxation phase in a compressed (gray) and expanded (light blue) state. (c) and (d) Radially averaged scattering profiles from the marked relaxation phases at (a) and (b). The black and blue arrows indicate the direction of the peak evolution. The brightness of the lines increases with the relaxation time. | ||
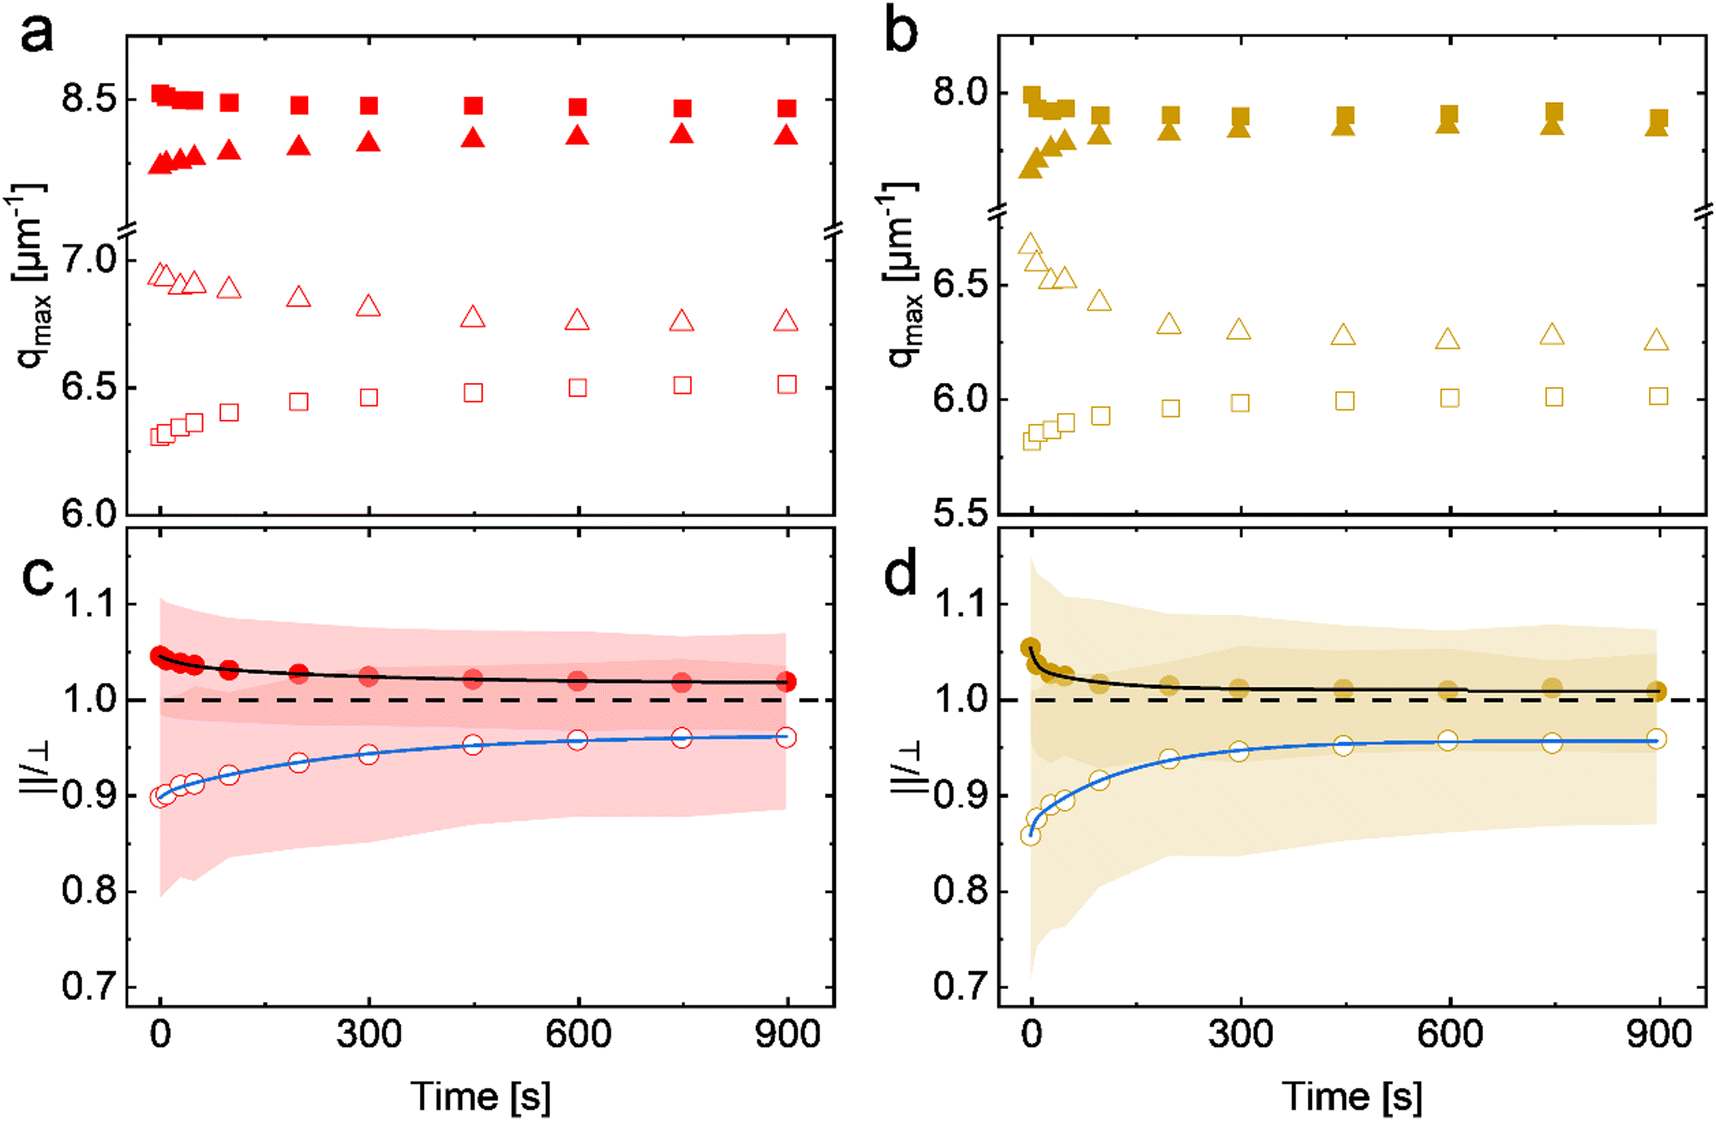
The equilibration time between the compression and expansion steps was 900 s and added up to a total cycle time of 2466 s. The black and orange line profiles represent the values of Π and dc–c. In the initial cycle, the Π increased from 27.4 mN m−1 to 28.8 mN m−1 with compression and dc–c decreased from 1.09 μm to 0.91 μm. The values remained nearly constant during the following equilibration, whereby Π reduced by 0.2 mN m−1. In the first expansion, Π decreased from 28.6 mN m−1 to 26.5 mN m−1 and dc–c increased from 0.91 μm to 1.16 μm. During the following equilibration, Π increased by 0.2 mN m−1 whereas values of dc–c remained constant. As the number of cycles increased, the maximum and minimum values of Π and dc–c varied by < 3% from the first to the fifth cycle. The shaded areas in Fig. 6(a) and (b) mark the equilibration time after the compression (gray) and expansion (blue) in the second cycle. In Fig. 6(c) and (d), four selected radially averaged intensity profiles from SALS measurements during the second cycle equilibration are shown. As previously discussed, we use the data from the second cycle instead of the first because we found better reversibility from the second cycle on. In Fig. 6(c) and (d) the time between each intensity profile is 300 s, where the darkest color is at the start of the equilibration and the brightness increases with time. Gray and blue arrows mark the evolution direction in the compressed or expanded state according to the same color code from Fig. 6(a) and (b) (shaded areas). In Fig. 6(c), we observed a shift of the structure factor (∼0.1 μm−1) to larger q for both equilibration cases after 900 s. Additionally, a reduction in full widths at half maximum (FWHM) of ∼18% in the compressed and ∼40% in the expanded state was evident. The intensity profiles in Fig. 6(d) showed the same shift of the structure factor maximum to larger q, whereby the FWHM reduced by ∼42% in the compressed and ∼45% in the expanded state. We have chosen the conditions for this experiment so that we obtain a reversible behavior of the monolayer in terms of Π and dc–c during compression/expansion cycles, as shown in Fig. 5(b). Full reversibility was obtained within the experimental error for both compression/expansion speeds. Although, we do not find significant alterations for Π and dc–c in Fig. 6(a) and (b) during equilibration, a trend in the radially averaged intensity profiles (Fig. 6(c) and (d)) can be found. We start with a relatively broad structure factor peak that becomes more intense and significantly narrower over time. This reduction in peak width implies that the real space microstructure of the confined monolayer becomes more homogeneous with a narrower distribution in dc–c. We believe that the narrowing of the dc–c distribution while maintaining a constant area, can be explained by the relaxation of the anisotropy and the packing inhomogeneities, which were induced by the process of compression or expansion. To get further insights into the relaxation process, we analyzed the structure factor peak parallel (‖) and perpendicular (⊥) to the compression/expansion direction as a function of time. Fig. 7(a) and (b) show the evolution of the maximum of the structure factor (qmax) as a function of relaxation time, parallel (square symbols) and perpendicular (triangles) to the compression/expansion direction. Filled symbols correspond to data after compression and empty symbols after expansion for slow (red symbols) and fast (orange symbols) speeds of uniaxial manipulation. To start with the changes observed after compression, we observe a decrease in qmax (‖) (filled squares) and an increase in qmax (⊥) (filled triangles) as a function of relaxation time for both speeds. This means that values of dc–c increase parallel and decrease perpendicular to the direction of uniaxial compression. The opposite effects are observed after expansion. In this case qmax (‖) (open squares) increases and qmax (⊥) (open triangles) decreases. Consequently, values of dc–c decrease parallel and increase perpendicular to the expansion direction.
 | ||
| Fig. 7 Results from SALS experiments during the relaxation upon compression/expansion with 3 mm min−1 (a) and (c) and with 9 mm min−1 (b) and (d). Peak positions (qmax) of the structure factors as a function of relaxation time after compression (filled symbols) and expansion (empty symbols) are shown in (a) and (b). The squares correspond to data determined parallel (‖) to and the triangles perpendicular (⊥) to the direction of uniaxial compression/expansion. The ratios of the structure factor maxima ‖ and ⊥ to the compression direction are shown in (c) and (d). The black and blue lines correspond to fits of the data using second-order exponential decays. Shaded areas highlight the range of error bars. | ||
In order to monitor the relaxation of the anisotropy induced by the uniaxial compression/expansion more quantitatively, we calculated the ratio of qmax determined parallel and perpendicular to the direction of monolayer manipulation. In Fig. 7(c) and (d), the values of (‖)/(⊥) are shown as a function of relaxation time. The horizontal black dashed lines correspond to the ideal isotropic value of 1 as a reference. The filled circles (values >1) represent the relaxation of the anisotropy after compression, whereby the empty circles (values <1) represent the relaxation after expansion. We fitted the data using second-order exponential decays (black and blue lines). Note that single exponential decays did not lead to good fits to the data. The colors are assigned according to the established color code from Fig. 6. In Fig. 7(c), the relaxation after slow (3 mm min−1) compression/expansion is shown. In the compressed state, values of (‖)/(⊥) started at 1.045 and decreased to 1.017 with time constants τ1 = 22 s and τ2 = 200 s from the fits to the data. In the expanded state, (‖)/(⊥) started at 0.896 and increased to 0.959 with time constants τ1 = 9 s and τ2 = 188 s from the fits. The relaxation after fast (9 mm min−1) compression/expansion is presented in Fig. 7(d). In the compressed state, (‖)/(⊥) started with 1.053 and was reduced to 1.007 with time constants τ1 = 5 s and τ2 = 64 s. In the expanded state, it started at 0.857 and rose to 0.958 with time constants τ1 = 3 s and τ2 = 98 s. The error bars are illustrated by colored shadows with respect to the color code from above. A darkening of the shaded areas is reflecting the overlap of the error bars.
The difference in (‖)/(⊥) after compression/expansion at various barrier speeds showed the same trend we saw in Fig. 3. Namely, the higher the compression speed, the stronger the anisotropy. Generally, and in agreement with the results of Fig. 4, we see that expansion leads to larger anisotropy than compression. Even for the slowest speed of 3 mm min−1 the monolayer is left in an out-of-equilibrium state when compression/expansion is stopped. Surprisingly, even after 900 s of equilibration time, the monolayer did not recover to an isotropic state, thus we still see anisotropy in the diffraction patterns. The observed anisotropy implies that the microgels are somewhat locked into the structure. We assume that structural rearrangements, in particular those that require translational movements of the CS microgels, are hindered due to overlap and entanglement of the microgel shells. This effect is more pronounced for relaxation after expansion than for the compression step. In all cases, the relaxation of the anisotropy could be described by a double exponential decay. We want to note that our SALS measurements were done in the central region of the monolayer, while the barriers used for the uniaxial distortion compress or expand the available area from the outside rather far away from the position where SALS was measured. In other words, when the monolayer is compressed fast enough so that the monolayer cannot relax fully into equilibrium states during compression, we potentially create a gradient in packing fraction along the compression direction. We postulate that the short time constant is related to fast homogenization of density fluctuations parallel to the direction of uniaxial manipulation. The long time constant on the order of 100–200 s is most likely related to structural rearrangements perpendicular to this direction where translational movements are required. In the state of dense packing (regime II) such movements will be hindered not at last because of overlap and entanglement of the shells.
Single microgel indentation experiments via AFM66–68 showed that a hysteresis between force profiles measured in approach and retraction appears due to shell deformation dynamics, which is slower than the indenter movement. We believe that this is similar to the relaxation process that we observed, although the timescales cannot be compared directly, since the microgel assemblies at the interface behave as a viscoelastic film.43 In this film we deal with a collective rather than a single microgel response. In our experimental timescale, the anisotropic diffraction pattern does not fully recover to the isotropic state, meaning the microgel monolayer is locked in an anisotropic state, at least to some extent. Unfortunately, we cannot track these dynamic processes in situ using microscopy because the motions in this non-equilibrium state hamper focusing and resolving individual microgels. We summarize our findings and hypothesis on the microstructure and its relaxation upon compression in Fig. 8.
 | ||
| Fig. 8 Illustration of microgel assemblies at different Π. From a submonolayer around 0 mN m−1 in region I, compression is leading to a loose monolayer at around 25 mN m−1 in region II. Most experiments were performed in region II, where anisotropic compression (orange arrows indicating the direction) was applied. The anisotropic deformation is leading to anisotropically assembled microgels, followed by a reorganization of the structure into a nearly isotropic dense microgel monolayer. The black hexagons are marking six microgels to visualize the anisotropic deformation of the monolayer. | ||
Similar relaxation processes might be expected for other monolayers of soft objects like polymer micelles69 and brushes,5 viruses70 and proteins.71,72 Since our measurements presented here rely on diffraction of visible light and therefore large enough scattering objects with good contrast as well as ordered arrangements, experiments on such different soft systems might be challenging. Most likely other in situ techniques will be required in these cases. To broaden our understanding of the relaxation of confined soft objects at fluid interfaces, a reasonable first step might be to address different softnesses. A study on the relaxation behavior and the influence of microgel softness, to provide systematic trends, is currently underway and will be presented elsewhere.
4 Conclusions
Small-angle light scattering was used to study the microstructure of monolayers of core–shell microgels with rigid nanoparticle cores and soft, deformable shells. Due to the micrometer size total dimensions of the microgels and the significantly smaller, high optical contrast cores, SALS captured dominantly the structure factor of the monolayer. In this case, simple peak analysis gave access to the nearest neighbor interparticle distance. This renders SALS the perfect tool to follow structural changes of such monolayers in situ in a non-destructive way while probing mm2 areas and thus large numbers of colloids (>106 microgels). A standard compression isotherm along with the results from SALS revealed three distinct regions: in region I we deal with a submonolayer that contains clusters of microgels without significant long-range order and voids in between such clusters. Compression in region I leads to closing the voids along with little changes in interparticle distance. In region II we deal with a rather dense monolayer of microgels starting in stretched shell–shell contact. Compression leads to a small change in surface pressure but a large change in interparticle distance. Here the microgels are pushed together and deform. Region III enters the regime of high surface pressures where the monolayers fail, buckle and microgels are pushed into the bulk subphase at approximately 30 mN m−1. In region II, we could perform alternating compression and expansion cycles that were highly reversible in terms of surface pressure and interparticle distance, despite some little hysteresis in the very first cycle. During the uniaxial manipulation of the monolayers, we observed anisotropic diffraction patterns related to an anisotropic deformation of the ordered microgel lattice with stronger anisotropy during expansion compared to the compression. Recently, Feller et al. have shown that similar deformations applied to soft colloidal monolayers can lead to other 2-dimensional Bravais lattices than the equilibrium hexagonal arrangement.73 In that work anisotropic deformation was induced during transfer of microgel monolayers from air/water to solid interfaces by variation of the substrate wettability and the transfer direction and speed.At the air/water interface we could show in this work, that after an expansion step followed by 30 minutes of equilibration time the monolayer still showed anisotropy. We attribute this to the dense packing of microgels most likely leading to overlapping and entangled shells that hinder translational rearrangements. Relaxation experiments after compression/expansion revealed a time-dependent decrease in anisotropy that could be described by a double-exponential decay. We postulate, that the short time constant on the order of a few seconds is related to a fast density equilibration in the direction of uniaxial deformation, while the slow time constant on the order of 100–200 seconds is related to slow translational rearrangements. The unexpectedly long second time constant points to the hindered movement of microgels in the dense viscoelastic film.43 Unfortunately, we were not able to visualize such processes in real space, e.g. by using optical microscopy. To ultimately support our assumptions additional measurements e.g. by grazing-incidence small-angle X-ray scattering (GISAXS) in combination with theoretical simulations are required.
Our combination of a Langmuir trough and small-angle light scattering allowed us to follow the microstructure of soft colloidal monolayers at fluid interfaces, not only in situ but also with excellent time resolution (limited only through the frame rate of the camera) during and after compression as well as expansion. Despite the monolayer response being highly reversible at sufficiently high surface pressures (in region II), our measurements revealed that the directionality of the monolayer manipulation as well as the speed of manipulation affect the microstructure. We believe that these important findings are relevant for many other synthetic and natural soft systems including polymer brush-decorated (nano)particles, block copolymer micelles, proteins and viruses. In future studies it will be highly interesting to also compare different trough geometries such as the quadrotrough74 and radial troughs,75 where the balance between dilatational manipulation and shear can be systematically varied in a controlled environment. While we have demonstrated that small-angle light scattering is the perfect tool for large enough colloids/colloid-like objects, a challenge to be tackled is the in situ analysis of significantly smaller objects at fluid interfaces. In the latter case, grazing-incidence X-ray and/or neutron scattering experiments will most likely be the most powerful tools to study microstructures in situ probing large areas and thus large number of particles in parallel.
Data availability
All data supporting the findings of this study are presented in the article and ESI.† Additional data are available from the corresponding author upon reasonable request.Conflicts of interest
The authors declare that they have no known competing financial interests or personal relationships that could have appeared to influence the work reported in this paper.Acknowledgements
M. K. acknowledges the Deutsche Forschungsgemeinschaft (DFG) for funding through grant no. KA3880/6-1. The authors acknowledge Joachim Dzubiella and Sebastien Groh (Physikalisches Institut, Albert-Ludwigs-Universität Freiburg) for fruitful discussions.References
- C. L. Bassani, G. van Anders, U. Banin, D. Baranov, Q. Chen, M. Dijkstra, M. S. Dimitriyev, E. Efrati, J. Faraudo, O. Gang, N. Gaston, R. Golestanian, G. I. Guerrero-Garcia, M. Gruenwald, A. Haji-Akbari, M. Ibáñez, M. Karg, T. Kraus, B. Lee, R. C. Van Lehn, R. J. Macfarlane, B. M. Mognetti, A. Nikoubashman, S. Osat, O. V. Prezhdo, G. M. Rotskoff, L. Saiz, A.-C. Shi, S. Skrabalak, I. I. Smalyukh, M. Tagliazucchi, D. V. Talapin, A. V. Tkachenko, S. Tretiak, D. Vaknin, A. Widmer-Cooper, G. C. L. Wong, X. Ye, S. Zhou, E. Rabani, M. Engel and A. Travesset, ACS Nano, 2024, 18, 14791–14840 CrossRef CAS PubMed.
- C. A. Mirkin, R. L. Letsinger, R. C. Mucic and J. J. Storhoff, Nature, 1996, 382, 607–609 CrossRef CAS PubMed.
- A. P. Alivisatos, K. P. Johnsson, X. G. Peng, T. E. Wilson, C. J. Loweth, M. P. Bruchez and P. G. Schultz, Nature, 1996, 382, 609–611 CrossRef CAS PubMed.
- K. Ohno, T. Morinaga, S. Takeno, Y. Tsujii and T. Fukuda, Macromolecules, 2007, 40, 9143–9150 CrossRef CAS.
- J. Menath, J. Eatson, R. Brilmayer, A. Andrieu-Brunsen, D. M. A. Buzza and N. Vogel, Proc. Natl. Acad. Sci. U. S. A., 2021, 118, e2113394118 CrossRef CAS PubMed.
- J. Sindram, M. Krüsmann, M. Otten, T. Pauly, L. Nagel-Steger and M. Karg, J. Phys. Chem. B, 2021, 125, 8225–8237 CrossRef CAS PubMed.
- T. Honold, D. Skrybeck, K. G. Wagner and M. Karg, Langmuir, 2017, 33, 253–261 CrossRef CAS PubMed.
- N. Vogel, C. Fernández-López, J. Pérez-Juste, L. M. Liz-Marzán, K. Landfester and C. K. Weiss, Langmuir, 2012, 28, 8985–8993 CrossRef CAS PubMed.
- M. Karg, Macromol. Chem. Phys., 2016, 217, 242–255 CrossRef CAS.
- T. Honold, K. Volk, A. Rauh, J. P. S. Fitzgerald and M. Karg, J. Mater. Chem. C, 2015, 3, 11449–11457 RSC.
- M. J. Bergman, N. Gnan, M. Obiols-Rabasa, J. M. Meijer, L. Rovigatti, E. Zaccarelli and P. Schurtenberger, Nat. Commun., 2018, 9, 5039 CrossRef PubMed.
- H. Löwen, Fun with Hard Spheres, in Statistical Physics and Spatial Statistics. Lecture Notes in Physics, ed. K. R. Mecke and D. Stoyan, 2000, vol. 554, Springer, Berlin, Heidelberg DOI:10.1007/3-540-45043-2_11.
- T. Palberg, J. Phys.: Condens. Matter, 1999, 11, R323–R360 CrossRef CAS.
- D. Feller and M. Karg, Soft Matter, 2022, 18, 6301–6312 RSC.
- A. Scotti, M. F. Schulte, C. G. Lopez, J. J. Crassous, S. Bochenek and W. Richtering, Chem. Rev., 2022, 122, 11675–11700 CrossRef CAS PubMed.
- M. Hildebrandt, S. Lazarev, J. Pérez, I. A. Vartanyants, J. M. Meijer and M. Karg, Macromolecules, 2022, 55, 2959–2969 CrossRef CAS.
- A. Scotti, M. Pelaez-Fernandez, U. Gasser and A. Fernandez-Nieves, Phys. Rev. E: Stat., Nonlinear, Soft Matter Phys., 2021, 103, 012609 CrossRef CAS PubMed.
- M. Karg, A. Pich, T. Hellweg, T. Hoare, L. A. Lyon, J. J. Crassous, D. Suzuki, R. A. Gumerov, S. Schneider, I. I. Potemkin and W. Richtering, Langmuir, 2019, 35, 6231–6255 CrossRef CAS PubMed.
- M. Hildebrandt, D. P. Thuy, J. Kippenberger, T. L. Wigger, J. E. Houston, A. Scotti and M. Karg, Soft Matter, 2023, 19, 7122–7135 RSC.
- B. Wedel, T. Brändel, J. Bookhold and T. Hellweg, ACS Omega, 2017, 2, 84–90 CrossRef CAS PubMed.
- K. von Nessen, M. Karg and T. Hellweg, Polymer, 2013, 54, 5499–5510 CrossRef CAS.
- A. Brézault, V. Schmitt, V. Ravaine, P. Perrin and N. Sanson, Macromol. Chem. Phys., 2024, 225, 2300372 CrossRef.
- R. H. Pelton and P. Chibante, Colloids Surf., 1986, 20, 247–256 CrossRef CAS.
- K. Volk, J. P. S. Fitzgerald and M. Karg, ACS Appl. Mater. Interfaces, 2019, 11, 16096–16106 CrossRef CAS PubMed.
- E. Ponomareva, K. Volk, P. Mulvaney and M. Karg, Langmuir, 2020, 36, 13601–13612 CrossRef CAS PubMed.
- J. Brijitta, B. V. R. Tata, R. G. Joshi and T. Kaliyappan, J. Chem. Phys., 2009, 131, 074904 CrossRef CAS PubMed.
- M. P. M. Schelling and J.-M. Meijer, Phys. Rev. E: Stat., Nonlinear, Soft Matter Phys., 2024, 109, L062601 CrossRef CAS PubMed.
- M. Karg, T. Hellweg and P. Mulvaney, Adv. Funct. Mater., 2011, 21, 4668–4676 CrossRef CAS.
- J. D. Debord and L. A. Lyon, J. Phys. Chem. B, 2000, 104, 6327–6331 CrossRef CAS.
- M. Stieger, J. S. Pedersen, P. Lindner and W. Richtering, Langmuir, 2004, 20, 7283–7292 CrossRef CAS PubMed.
- A. V. Petrunin, M. M. Schmidt, R. Schweins, J. E. Houston and A. Scotti, Langmuir, 2023, 39, 7530–7538 CrossRef CAS PubMed.
- A. Scotti, A. R. Denton, M. Brugnoni, R. Schweins and W. Richtering, Phys. Rev. E: Stat., Nonlinear, Soft Matter Phys., 2021, 103, 022612 CrossRef CAS PubMed.
- A. Scotti, Soft Matter, 2021, 17, 5548–5559 RSC.
- D. Lapkin, N. Mukharamova, D. Assalauova, S. Dubinina, J. Stellhorn, F. Westermeier, S. Lazarev, M. Sprung, M. Karg, I. A. Vartanyants and J. M. Meijer, Soft Matter, 2022, 18, 1591–1602 RSC.
- S. Ciarella, M. Rey, J. Harrer, N. Holstein, M. Ickler, H. Lowen, N. Vogel and L. M. C. Janssen, Langmuir, 2021, 37, 5364–5375 CrossRef CAS PubMed.
- A. Rauh, M. Rey, L. Barbera, M. Zanini, M. Karg and L. Isa, Soft Matter, 2016, 13, 158–169 RSC.
- M. Rey, M. A. Fernandez-Rodriguez, M. Steinacher, L. Scheidegger, K. Geisel, W. Richtering, T. M. Squires and L. Isa, Soft Matter, 2016, 12, 3545–3557 RSC.
- M. Rey, X. Hou, J. S. J. Tang and N. Vogel, Soft Matter, 2017, 13, 8717–8727 RSC.
- C. Picard, P. Garrigue, M. C. Tatry, V. Lapeyre, S. Ravaine, V. Schmitt and V. Ravaine, Langmuir, 2017, 33, 7968–7981 CrossRef CAS PubMed.
- T. Kawamoto, K. Yanagi, Y. Nishizawa, H. Minato and D. Suzuki, Chem. Commun., 2023, 59, 13289–13292 RSC.
- A. Maestro and E. Guzmán, Processes, 2019, 7, 942 CrossRef CAS.
- A. J. Mendoza, E. Guzman, F. Martinez-Pedrero, H. Ritacco, R. G. Rubio, F. Ortega, V. M. Starov and R. Miller, Adv. Colloid Interface Sci., 2014, 206, 303–319 CrossRef CAS PubMed.
- Y. Zhou, J. J. Crassous and M. Karg, Langmuir, 2025, 41, 9274–9287 CrossRef CAS PubMed.
- M. Rey, M. A. Fernandez-Rodriguez, M. Karg, L. Isa and N. Vogel, Acc. Chem. Res., 2020, 53, 414–424 CrossRef CAS PubMed.
- O. S. Deshmukh, D. van den Ende, M. C. Stuart, F. Mugele and M. H. Duits, Adv. Colloid Interface Sci., 2015, 222, 215–227 CrossRef CAS PubMed.
- J. Brijitta and P. Schurtenberger, Curr. Opin. Colloid Interface Sci., 2019, 40, 87–103 CrossRef CAS.
- P. S. Mohanty, S. Nojd, K. van Gruijthuijsen, J. J. Crassous, M. Obiols-Rabasa, R. Schweins, A. Stradner and P. Schurtenberger, Sci. Rep., 2017, 7, 1487 CrossRef PubMed.
- O. S. Deshmukh, A. Maestro, M. H. Duits, D. van den Ende, M. C. Stuart and F. Mugele, Soft Matter, 2014, 10, 7045–7050 RSC.
- A. Maestro, D. Jones, C. S. D. Candela, E. Guzman, M. H. G. Duits and P. Cicuta, Langmuir, 2018, 34, 7067–7076 CrossRef CAS PubMed.
- M. Kühnhammer, K. Gräff, E. Loran, O. Soltwedel, O. Löhmann, H. Frielinghaus and R. von Klitzing, Soft Matter, 2022, 18, 9249–9262 RSC.
- M. Destribats, V. Lapeyre, M. Wolfs, E. Sellier, F. Leal-Calderon, V. Ravaine and V. Schmitt, Soft Matter, 2011, 7, 7689–7698 RSC.
- S. Stock, S. Röhl, L. Mirau, M. Kraume and R. von Klitzing, Nanomaterials, 2022, 12, 2649 CrossRef CAS PubMed.
- M. Rey, J. Kolker, J. A. Richards, I. Malhotra, T. S. Glen, N. Y. D. Li, F. H. J. Laidlaw, D. Renggli, J. Vermant, A. B. Schofield, S. Fujii, H. Löwen and P. S. Clegg, Nat. Commun., 2023, 14, 6723 CrossRef CAS PubMed.
- L. Scheidegger, M. A. Fernandez-Rodriguez, K. Geisel, M. Zanini, R. Elnathan, W. Richtering and L. Isa, Phys. Chem. Chem. Phys., 2017, 19, 8671–8680 RSC.
- F. Pinaud, K. Geisel, P. Masse, B. Catargi, L. Isa, W. Richtering, V. Ravaine and V. Schmitt, Soft Matter, 2014, 10, 6963–6974 RSC.
- Y. Gong, Z. Zhang and J. He, Ind. Eng. Chem. Res., 2017, 56, 14793–14798 CrossRef CAS.
- D. Vollhardt and V. B. Fainerman, Adv. Colloid Interface Sci., 2006, 127, 83–97 CrossRef CAS PubMed.
- R. W. Style, L. Isa and E. R. Dufresne, Soft Matter, 2015, 11, 7412–7419 RSC.
- J. Vialetto, F. Camerin, S. N. Ramakrishna, E. Zaccarelli and L. Isa, Adv. Sci., 2023, e2303404, DOI:10.1002/advs.202303404,.
- K. Kuk, V. Abgarjan, L. Gregel, Y. Zhou, V. Carrasco Fadanelli, I. Buttinoni and M. Karg, Soft Matter, 2023, 19, 175–188 RSC.
- K. Kuk, J. Ringling, K. Graff, S. Hansch, V. Carrasco-Fadanelli, A. A. Rudov, I. I. Potemkin, R. von Klitzing, I. Buttinoni and M. Karg, Adv. Sci., 2024, 11, e2406977 CrossRef PubMed.
- K. Kuk, L. Gregel, V. Abgarjan, C. Croonenbrock, S. Hänsch and M. Karg, Gels, 2022, 8, 516 CrossRef CAS PubMed.
- S. A. Vasudevan, A. Rauh, M. Kröger, M. Karg and L. Isa, Langmuir, 2018, 34, 15370–15382 CrossRef CAS PubMed.
- S. A. Vasudevan, A. Rauh, L. Barbera, M. Karg and L. Isa, Langmuir, 2018, 34, 886–895 CrossRef CAS PubMed.
- K. Geisel, L. Isa and W. Richtering, Langmuir, 2012, 28, 15770–15776 CrossRef CAS PubMed.
- A. Mark, N. Helfricht, A. Rauh, M. Karg and G. Papastavrou, Small, 2019, 15, e1902976 CrossRef PubMed.
- N. Raßmann, S. Trippmacher, A. Specht, K. Theis, T. Rößler, S. Wohlrab, R. Kellnberger, S. Salehi, H. Bargel, N. Helfricht, K. Albrecht, T. Scheibel, J. Groll, S. Gekle and G. Papastavrou, ACS Appl. Nano Mater., 2025, 8, 5383–5398 CrossRef.
- M. F. Schulte, E. Izak-Nau, S. Braun, A. Pich, W. Richtering and R. Gostl, Chem. Soc. Rev., 2022, 51, 2939–2956 RSC.
- H. Xu, R. Erhardt, V. Abetz, A. H. E. Müller and W. A. Goedel, Langmuir, 2001, 17, 6787–6793 CrossRef CAS.
- J. F. Torres-Salgado, M. Comas-Garcia, M. V. Villagrana-Escareno, A. L. Duran-Meza, J. Ruiz-Garcia and R. D. Cadena-Nava, J. Phys. Chem. B, 2016, 120, 5864–5873 CrossRef CAS PubMed.
- R. Miller and L. Liggieri, Interfacial Rheology, Progress in Colloid and Interface Science, Brill, 2009 Search PubMed.
- J. Benjamins, J. Lyklema and E. H. Lucassen-Reynders, Langmuir, 2006, 22, 6181–6188 CrossRef CAS PubMed.
- D. Feller, M. Otten, M. S. Dimitriyev and M. Karg, Colloid Polym. Sci., 2024 DOI:10.1007/s00396-024-05285-4.
- Y. S. Tein, B. R. Thompson, C. Majkrzak, B. Maranville, D. Renggli, J. Vermant and N. J. Wagner, Rev. Sci. Instrum., 2022, 93, 093903 CrossRef CAS PubMed.
- M. Pepicelli, T. Verwijlen, T. A. Tervoort and J. Vermant, Soft Matter, 2017, 13, 5977–5990 RSC.
Footnote |
| † Electronic supplementary information (ESI) available. See DOI: https://doi.org/10.1039/d4sm01383b |
| This journal is © The Royal Society of Chemistry 2025 |