
 Open Access Article
 This Open Access Article is licensed under a
 Creative Commons Attribution 3.0 Unported Licence
From regular solutions to microemulsions†‡
Shih-Yu
Tseng
a,
Reinhard
Strey
b,
Ulf
Olsson
 *c and
Thomas
Sottmann
*a
*c and
Thomas
Sottmann
*a
aInstitute of Physical Chemistry, University of Stuttgart, Pfaffenwaldring 55, 70569 Stuttgart, Germany. E-mail: thomas.sottmann@ipc.uni-stuttgart.de
bDepartment of Chemistry, University of Cologne, Luxemburger Straße 116, 50939 Köln, Germany
cDivision of Physical Chemistry, Lund University, Box 124, 221 00 Lund, Sweden. E-mail: ulf.olsson@fkem1.lu.se
First published on 15th April 2025
Abstract
We address the structure of homogeneous mixtures of equal volumes of water and oil rendered miscible by the addition of amphiphilic molecules. Specifically, we study the pathway from regular ternary solutions to structured microemulsions with increasing amphiphilic chain length, i.e., increasing i and j for alkyl polyglycol ether surfactants (CiEj) from C3E0 (i.e., propanol) to C5E2, using contrast variation small angle neutron scattering (SANS). The bulk-contrast SANS pattern of the symmetric system water–cyclohexane–(2-propanol/1-propanol) with nearly horizontal tie-lines matches Ornstein–Zernike behavior with characteristic q−2 decay, implying critical composition fluctuations occurring predominantly in the water–oil ratio. Weak scattering signals were detected in film-contrast SANS possibly due to the existence of the nearby tricritical point (TCP). After passing the TCP, the increasing amphiphilic strength leads to the gradual build-up of well-defined amphiphilic interfaces stabilizing water- and oil-rich domains of colloidal dimensions, as evidenced by the well-known q−4 behavior observed in bulk-contrast SANS pattern at large q. The amphiphilicity factor fa ranging from +1.15 to −0.60 reveals the crossing of the disorder line, the Lifshitz line, and the wetting to non-wetting transition. Precursors of structuring in those mixtures with compositions, where the lamellar phase appears for even longer-chain amphiphiles, are also borne out by the experiments.
Introduction
It is well known that water and oil do not mix. However, equal volumes of water and oil may form a homogeneous stable single phase upon the addition of a third component, being miscible with both the water and the oil, a fact that has been known for over a hundred years. A classic example of such a third component, having the capability of mixing water and oil, is the simple short chain alcohol ethanol, which was also used in the pioneering studies of the ternary phase diagram of water, benzene, and ethanol by Bancroft and Taylor.1,2 Such ternary systems are typically governed by short range (nearest neighbour) intermolecular interactions, and can thus to a good approximation be described using the concepts of regular solution theory.3 At sufficiently large concentrations of the third component, it becomes the solvent for water and oil, with water and oil molecules being mainly surrounded by solvent molecules.The solubilization mechanism described above requires relatively large amounts of the third component. A more efficient additive is a surfactant that has a strong affinity for the water–oil interface.4–6 In these systems, termed microemulsions,7,8 water and oil do not mix on the molecular length scale but form different domains of colloidal dimensions separated by a dense surfactant film, stabilizing the water–oil interface.9 The microemulsion structure may be water or oil continuous, or bicontinuous.10,11 In the latter case both water and oil form sample spanning domains, again separated by a dense surfactant film.12–14 With focus on the surfactant-rich dividing surface between water and oil, microemulsions have been identified as interesting experimental model systems to study the thermodynamics of flexible two-dimensional fluid surfaces in three-dimensional space.15–17 With a fluid surface we here mean a surface that is flexible with a low bending rigidity, and has the ability to undergo topology transformations.9,15–18
Kahlweit and Strey have in a number of publications addressed the pathway from ternary molecular mixtures to microemulsions.5,19–23 They clearly described how the three-phase body, a signature of microemulsions, is born in a tricritical point (TCP) with increasing amphiphilicity (increasing i and j in a balanced fashion) of nonionic alkyl polyglycol ether surfactants, CH3(CH2)i−1(OCH2CH2)jOH (CiEj).20,21 They also demonstrated that the regular solution as a simple model is sufficient to generate the TCP even without imposing any structuring by increasing the enthalpic interactions compared to the ideal entropy of mixing.19 The gradual build-up of water- and oil-rich domains was demonstrated by bulk-contrast small angle neutron scattering (SANS) that showed a gradual transition from Lorentzian Ornstein–Zernike (OZ) scattering24 to a scattering curve exhibiting a well-defined structure factor peak.22,23 The q−4 Porod regime observed at higher q-values confirmed the presence of a dense surfactant film separating water- and oil-rich domains. It was also concluded that structured solutions, as defined by the first sign of deviation from simple OZ scattering in bulk-contrast SANS, appear approximately at the wetting to non-wetting transition of the middle-phase microemulsion at the water–oil interface.25,26 This is also suggested by theory.27,28 The transition occurs as the spreading coefficient, S = σab − (σac + σbc), changes its sign from positive to negative with increasing amphiphilicity. Here, σab is the interfacial tension between the water- (a) and oil-rich (b) phase in the presence of the middle-phase (c), while σac and σbc are the water/middle-phase and oil/middle-phase interfacial tensions, respectively. The wetting to non-wetting transition implies the formation of a stable water–oil interface with a low σab. With high amphiphilicity surfactants, σab even becomes ultra-low,29–31 which has attracted significant attention from e.g., the field of enhanced oil recovery.32,33Fig. 1 illustrates the evolution of the isothermal ternary phase behavior when increasing the amphiphilicity of the “third component”. We identify three regimes and refer to them as regular solution, intermediate solution and microemulsion, respectively, where the intermediate solution regime refers to the region between the tricritical point and the wetting to non-wetting transition.
 | ||
Fig. 1 Schematic phase diagrams illustrating the evolution in phase behavior from regular solutions, via intermediate solutions, to microemulsions, with increasing amphiphilicity of the “third component”. Here, A represents water, B the oil, and C the “third component”. 1 refers to a one phase region, while 2 and 3 refer to regions with two or three coexisting phases, respectively. ![[2 with combining macron]](https://www.rsc.org/images/entities/char_0032_0304.gif) refers to a coexistence of phases rich in water and in the “third component”. In the refers to a coexistence of phases rich in water and in the “third component”. In the ![[2 with combining low line]](https://www.rsc.org/images/entities/char_0032_0332.gif) phase region, phases rich in oil and in the “third component” coexist. Dashed lines illustrate tie-lines, and critical plait points are indicated by filled circles. phase region, phases rich in oil and in the “third component” coexist. Dashed lines illustrate tie-lines, and critical plait points are indicated by filled circles. | ||
More recently, microemulsions, referred to as “surfactant-free microemulsions”, or “highly flexible microemulsions” have been proposed to exist also in the regular solution regime34–42 (see also references therein). Arguments for being microemulsions mainly come from small angle X-ray or neutron scattering data, showing scattering length density (SLD) fluctuations on the nanometer length scale. However, these SLD fluctuations are generally found in the vicinity of critical plait points, pointing to the likelihood that the scattering rather are consequences of critical composition fluctuations.
It is in principle possible to determine whether the observed scattering pattern, I(q), reports mainly on critical composition fluctuations or non-critical solution (i.e., microemulsion) structure.23 The observation of a Lorentzian OZ scattering pattern, characterized by a forward (q = 0) scattering intensity, I0, and a real space correlation length of the fluctuations, ξ, is indicative of critical fluctuations.24 But more importantly, if critical composition fluctuations represent the dominating contribution to the scattered intensity, one expects both parameters to diverge at the critical plait point.43 This is something that can be easily verified experimentally, and something that is not expected for a microemulsion structure.9–14
Another way to address the question of critical composition fluctuation versus microemulsion structure is offered by contrast variation SANS.44 Using selectively deuterium labelled components allows for highlighting individual components in the mixture. In the vicinity of a critical plait point, composition fluctuations mainly occur in the direction of the critical tie-line.45 For a ternary system, critical fluctuations generally occur in both composition variables,46 which complicates the contrast variation analysis. In this paper we define these two variables as ϕ = ϕB/(ϕA + ϕB) and ϕC, respectively, where ϕI denotes the volume fraction of component I. The exception being the symmetric system, which is schematically illustrated on the left side of Fig. 1. When the third component (C) has the same affinity for the two immiscible components A and B, the critical point is located at equal volumes of A and B and the tie-lines are horizontal, i.e., defined by a constant ϕC. In this case, critical composition fluctuations are limited to fluctuations in ϕ.47 Then, by contrast matching A and B in a SANS experiment these fluctuations will not be visible and only a low scattering intensity is expected in the absence of a microemulsion structure. With strong contrast between A and B, on the other hand, (critical) fluctuations in ϕ can be evaluated. This is an important approach of the present study.
Non-ionic CiEj surfactants are particularly useful model surfactants for systematic studies of microemulsion structure and phase behavior.5,47,48 They do not require co-surfactants, and the amphiphilicity can be tuned by i and j. Moreover, it is also possible to tune the spontaneous curvature, H0, of surfactant monolayer films by varying the temperature.5,47–49 In this paper we particularly address the question of microemulsion structure versus critical composition fluctuations, by comparing three different systems having a different amphiphilicity of the “third component”. The first system is in the regular solution regime close to the TCP, while the two other systems are located on the opposite side of the TCP.
Results and discussion
We have investigated three different experimental systems, in which the degree of amphiphilicity of the “third component” (C) was varied from C3E0, via C4E1 to C5E2. All three systems being in the vicinity of the TCP, with the C3E0 system is located on the regular solution side, while the other two are on the microemulsion side. Below we will present and discuss results from the different systems, starting with the C3E0 system. For this particular system, we also address the question of “surfactant-free microemulsions”.Regular solutions – finding the balanced model system
Finding a suitable balanced ternary system in which the “third component” (C) has equal solubility in the A-rich and B-rich phases of the miscibility gap so that the critical composition fluctuations will predominantly involve fluctuations in the A/B-ratio43 with only minor fluctuations in ϕC is difficult. Our compromise has been to tune a quasi-ternary system having a mixture of a weakly hydrophilic and a weakly hydrophobic alcohol as the third component. Here, a mixture of 2-propanol (2-C3E0) and 1-propanol (1-C3E0) was used. Other components (A and B) being water and cyclohexane, respectively. Temperature was kept at T = 25.0 °C. At this temperature the ternary system H2O–cyclohexane–2-C3E0 exhibits the critical plait point on the oil-rich side of the miscibility gap, at ϕ ≈ 0.84. The corresponding system with 1-C3E0, on the other hand, has the critical plait point located on the water-rich side, at ϕ ≈ 0.08. Thus, by using a mixture of 2-C3E0 and 1-C3E0 it is possible to obtain a near-balanced quasi-ternary system for which the critical point is located at ϕ = 0.50 and the critical tie-line has an approximately constant ϕC. The two purely ternary phase diagrams with the two different alcohols are presented in the ESI‡ (Fig. S1), together with a schematic illustration of the quaternary phase tetrahedron with the line of critical points.For SANS experiments performed in the vicinity of the critical point, we are here focusing on two different scattering contrasts. One corresponding to the maximum contrast between water and oil, which is obtained by simply using heavy water (D2O) and normal cyclohexane. This contrast highlights the fluctuations in ϕ. We refer to this as A/B-contrast. In the second contrast we match the scattering length densities of water and oil by using D2O and deuterated cyclohexane containing a small amount of protonated cyclohexane. This contrast highlights possible fluctuations in ϕC, and we refer to this as C-contrast. In both cases the alcohols had their hydrogen exchanged for deuterium, being 2-propanol-OD and 1-propanol-OD, respectively, in order to avoid the hydrogen exchange with D2O.
Phase diagram studies were performed (see Methods section and Fig. S2, ESI‡) to find the particular 1-C3E0 fraction δ, for which the critical point is located at ϕ = 0.50. δ was found to be slightly different for the two contrasts, with the values δ = 0.24 for the A/B-contrast and δ = 0.18 for the C-contrast. The two corresponding quasi-ternary phase diagrams are presented in Fig. 2.
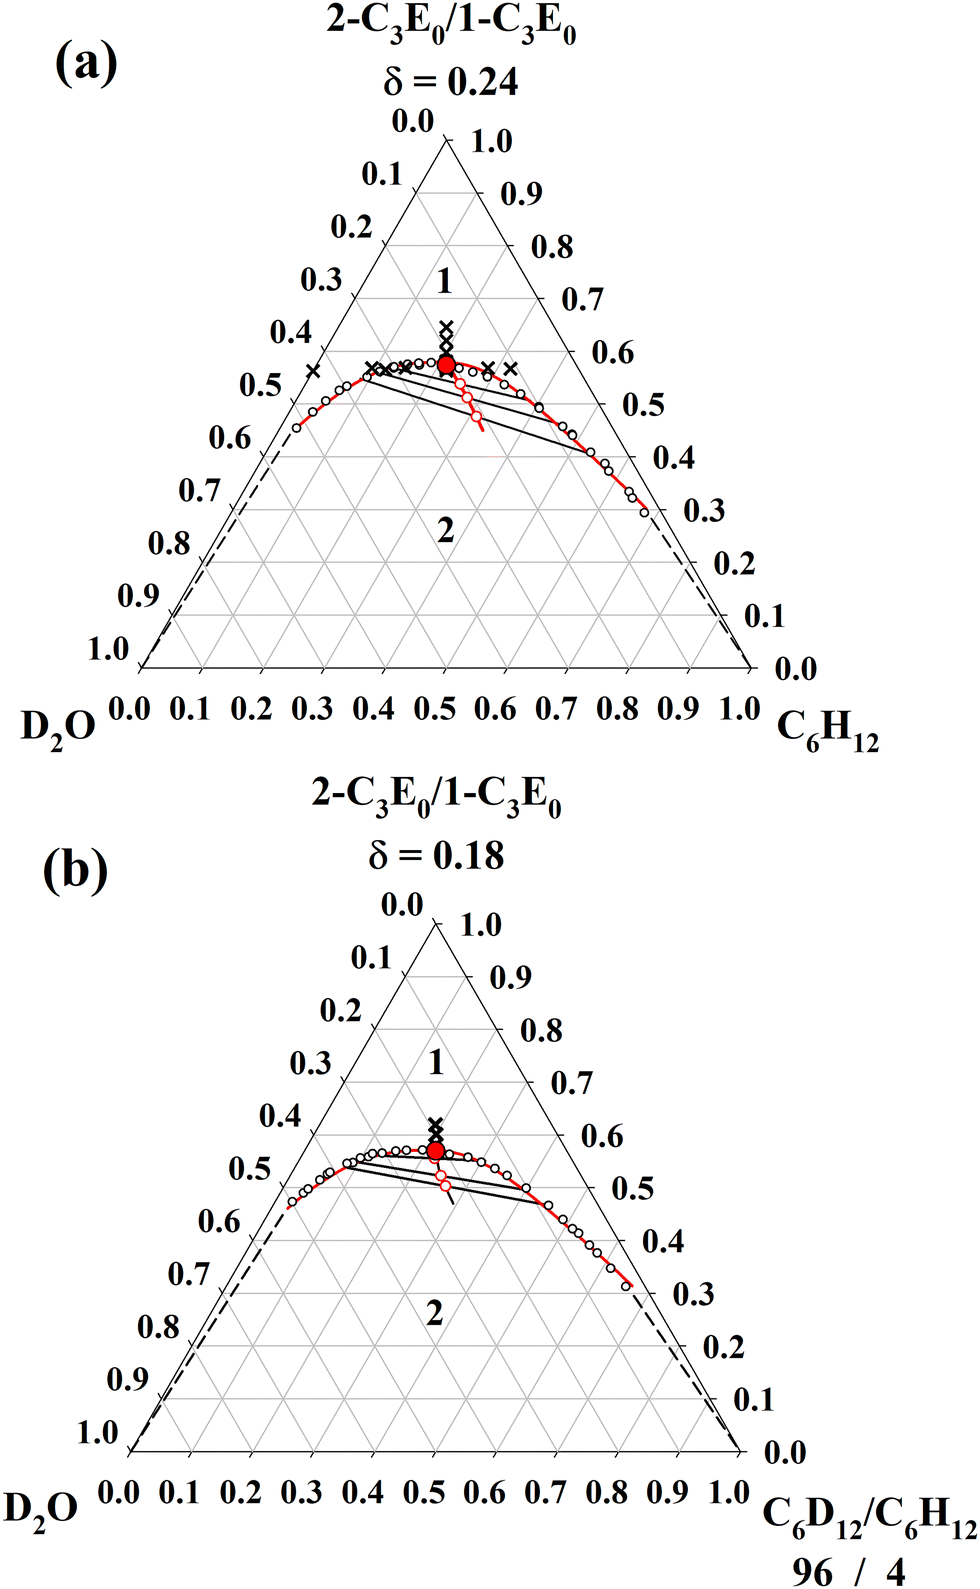 | ||
| Fig. 2 Gibbs triangles (volume fraction) of the quasi-ternary systems (a) D2O–cyclohexane–2-propanol-OD/1-propanol-OD at δ = 0.24 and (b) D2O–cyclohexane-D12/cyclohexane (96/4)–2-propanol-OD/1-propanol-OD at δ = 0.18, and T = 25.0 °C showing almost symmetric miscibility gaps, which can be described quantitively (red line) by eqn (1) taken from Guggenheim's equation using the predicted critical exponent β = 1/3. The critical points are located at ϕ* = 0.50 ± 0.01 (red filled circles), which are the end points of the lines (red) passing through the center of each tie-line (red open circles) determined from NMR. The SANS measurements were later performed as a function of the total alcohol volume fraction ϕC as well as varying the water/oil ratio ϕ (black crosses). | ||
The critical points, located at ϕ* = 0.50 ± 0.01, are marked by red filled circles. The critical C concentrations,  are 0.559 ± 0.003 and 0.565 ± 0.003 for the A/B-contrast and the C-contrast, respectively. With the help of 1H NMR we determined how the two alcohols distribute between the oil-rich phase and water-rich phase and thus the slope of the tie line (ESI,‡ Section S4). Together with the composition of the respective NMR sample and the phase boundary, this gives the tie lines, which are shown as black lines with open red circles marking the middle points where the two coexisting phases have equal volumes. According to the rectilinear diameter method,50 the line of open red circles shows the path to the critical point, which can be extrapolated by the intersection with the experimental binodal curve. Note that ϕC is close to, but not completely constant along the tie-lines. The experimentally determined binodal data (open circles) are well described by
 | (1) |
| ρ − ρc ∝ (1 − T/Tc)β | (2) |
Regular solutions – small-angle neutron scattering
The two contrast systems were investigated by SANS. The sample compositions measured are indicated as black crosses in Fig. 2(a) and (b). In both systems ϕC was varied at constant ϕ = 0.50 approaching the critical point. In the A/B-contrast system we also varied ϕ at constant ϕC = 0.565, passing near the critical point.Fig. 3(a) shows the SANS patterns obtained when varying ϕC at constant ϕ = 0.50. As can be seen, the scattered intensity, I(q), increases strongly with decreasing ϕC while approaching the critical point. In the studied interval ϕC = 0.563–0.645, the low q intensity varies by approximately three orders of magnitude. All curves are well described by the Ornstein–Zernike (OZ) relation24
| I(q) = I0/(1 + ξ2q2) + Iinc, | (3) |
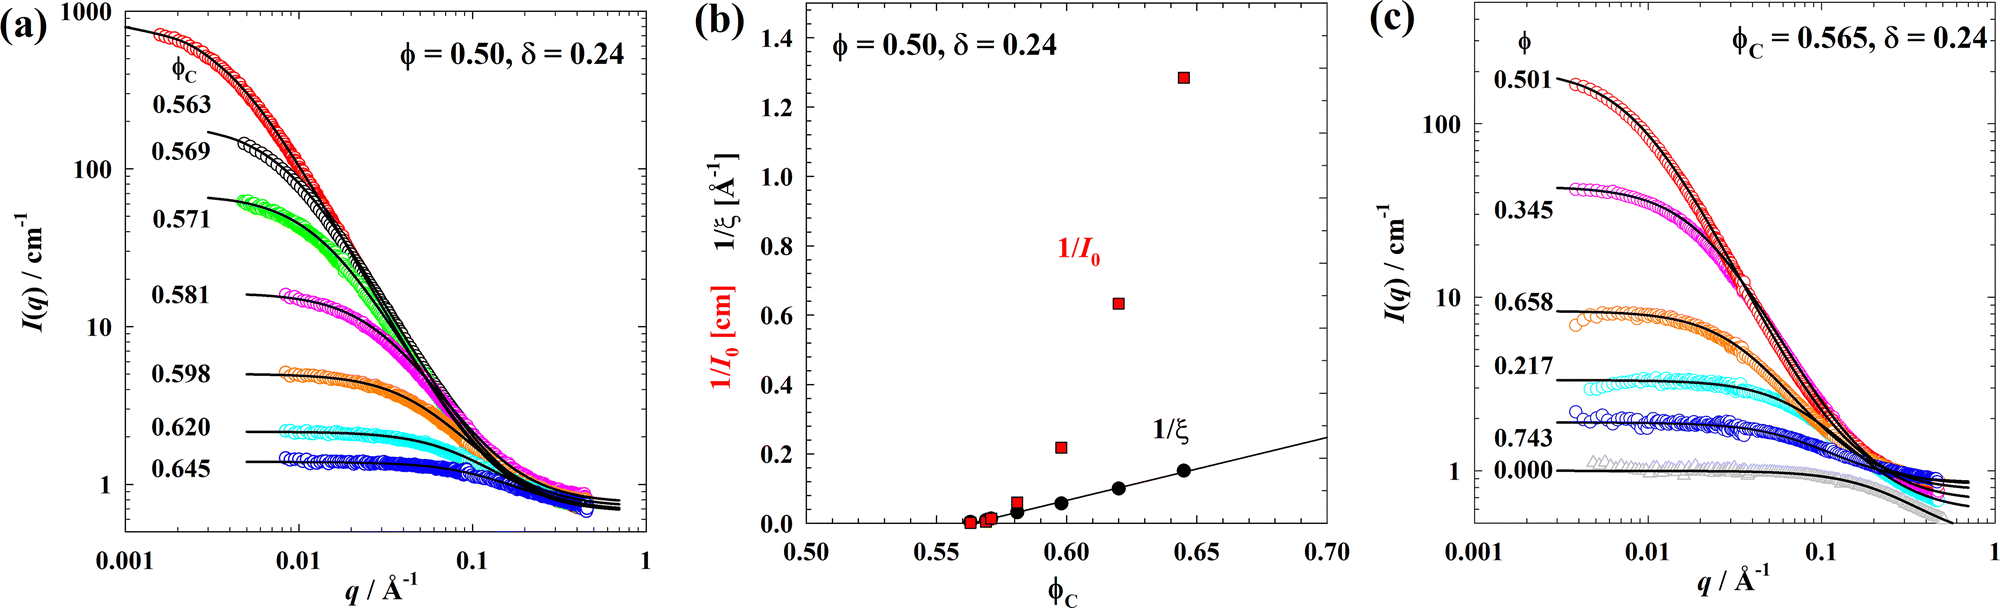 | ||
Fig. 3 (a) A/B-contrast SANS curves obtained at ϕ = 0.50 and T = 25.0 °C, along a line varying ϕC. (b) 1/I0 and 1/ξ, obtained from the fits, plotted versus ϕC. Both 1/I0 and 1/ξ go to zero at  . (c) A/B-contrast SANS curves obtained at ϕC = 0.565 ± 0.003, along a line varying ϕ. Solid lines are best fits of eqn (3) to the data shown in (a) and (c). . (c) A/B-contrast SANS curves obtained at ϕC = 0.565 ± 0.003, along a line varying ϕ. Solid lines are best fits of eqn (3) to the data shown in (a) and (c). | ||
Best fits of eqn (3) to the data are shown as solid lines. The fitting parameters I0 and ξ are summarized in the ESI‡ (Table S2). Both parameters diverge at the same critical ϕC-value  , confirming the presence of the critical point and the fact that the scattering is dominated by critical composition fluctuations. This can be seen in Fig. 3(b) where we have plotted 1/I0 and 1/ξ versus ϕC. Both 1/I0 and 1/ξ go to zero at
  .
.
SANS data were also collected along the line of constant ϕC = 0.565 ± 0.003 varying ϕ, passing near the critical point. The collected scattering patterns at selected values of ϕ are presented in Fig. 3(c). Also, along this line, the SANS patterns are well described by the OZ relation (eqn (3)). The values of I0 and ξ are also presented in the ESI‡ (Table S2). Both parameters show a maximum at the critical ϕ* ≈ 0.50, again consistent with the scattering being dominated by critical composition fluctuations.
Furthermore, SANS measurements in C-contrast were applied to probe any possible solution structure beneath the critical fluctuations. The phase diagram shown in Fig. 2(b) shows that the concentration of the alcohol mixture in the water-rich phase was slightly larger than in the oil-rich phase. Thus, to obtain an exact film contrast, contrast variation experiments (see Fig. S3, ESI‡) were performed to determine the cyclohexane-D12/cyclohexane ratio, at which the total scattering length density of water- and oil-rich domains are fully matched. The obtained 85/15 ratio was used in the C-contrast SANS measurements.
SANS patterns measured in the quasi-ternary system D2O–cyclohexane-D12/cyclohexane (85/15)–2-propanol-OD/1-propanol-OD (δ = 0.18) at ϕ = 0.50, varying the total alcohol volume fraction ϕC are shown in Fig. 4(a). As can be seen, the scattered intensities for this contrast are very low, approximately of the same low magnitude as for the quasi-binary alcohol–D2O (ϕ = 0) sample (Fig. 3(c)). I0 is of the order of 1 cm−1, to be compared with A/B-contrast where intensities are three orders of magnitude higher. The question then arises, what is the origin of the weak scattering that increases when ϕC decreases towards the critical point? A plausible explanation is that there are small critical fluctuations also in ϕC, due to being close to the TCP. As will be further addressed below and in the ESI,‡ the present mixture is in fact close to the TCP, that marks the “birth” of the three-phase triangle, when approaching it from the regular solution side. The three-phase triangle represents an area in the quasi-ternary phase diagram, with variations both in the water–oil ratio ϕA/ϕB and ϕC. Hence, we expect to see fluctuations also in ϕC, near the TCP. The observed scattering is weak, and at present we are unable to completely rule out contributions from tie-lines deviating slightly from constant ϕC, (Fig. 2(b)). The SANS patterns in Fig. 4(a) do not follow the OZ prediction. Instead of an asymptotic 1/q2 dependence, I(q) ∼ 1/q at large q-values. A reasonable description of the data is provided by
| I(q) = I0/(1 + ξq) + Iinc, | (4) |
 | ||
| Fig. 4 (a) C-contrast SANS curves plotted on a double logarithm scale and (b) [I0/(I(q) − Iinc)] − 1 plotted versus q for the quasi-ternary system D2O–cyclohexane–D12/cyclohexane (85/15)–2-propanol-OD/1-propanol-OD measured as a function of the total alcohol volume fraction ϕC at δ = 0.18, ϕ = 0.50, and T = 25.0 °C. ξ-Values were obtained from the slope of the plot. | ||
Best fits using eqn (4) are presented in Fig. 4(a) by solid lines. Parameter values are listed in the ESI‡ (Table S3). This unusual functional form of I(q) is further confirmed in Fig. 4(b) where the data are plotted as [I0/(I(q) − Iinc)] − 1 versus q. The straight lines confirm the functional form of eqn (4). The data set here is limited, but we note that a very similar functional form for I(q) was derived for a model with two coupled fluctuating order parameters,56 that also can be traced back to a four-point correlation function.57
Regular solutions – analysis of critical fluctuations
Having established above that the scattered intensity in A/B-contrast is governed by critical composition fluctuations, we now proceed and investigate the scaling laws for the correlation length ξ and the forward scattering intensity I0. As the total alcohol volume fraction ϕC is the main tuning parameter used to approach the critical point at a constant temperature and water/oil ratio, we use the chemical potential difference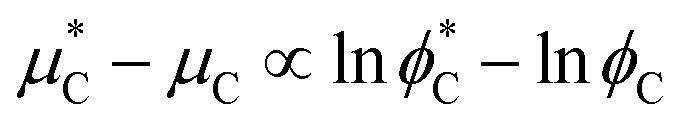 to define the scaling variable
 | (5) |
 representing the critical alcohol volume fraction. In Fig. 5(a), ξ and I0 are plotted versus ε on a double logarithmic scale. Both parameters appear to follow power laws
ξ = ![[small xi, Greek, circumflex]](https://www.rsc.org/images/entities/i_char_e0b9.gif) ε−ν ε−ν | (6) |
| I0 = Îε−γ, | (7) |
and Î the critical amplitudes.46
 | ||
Fig. 5 (a) ξ (black circles) and I0 (red squares) plotted as a function of the reduced logarithm volume fraction of alcohol mixture  of the quasi-ternary system D2O–cyclohexane–2-propanol-OD/1-propanol-OD at δ = 0.24, ϕ = 0.50, and T = 25.0 °C. Critical exponents were determined to be ν = 1.22 and γ = 2.38, which indicates a doubling of the exponents. (b) ξ and I0 along the line of constant ϕC = 0.565 ± 0.003, plotted as a function of ϕ. Both parameters show a maximum in the vicinity of the critical point at ϕ = 0.50. Solid lines are calculated using eqn (9) and (10).59 of the quasi-ternary system D2O–cyclohexane–2-propanol-OD/1-propanol-OD at δ = 0.24, ϕ = 0.50, and T = 25.0 °C. Critical exponents were determined to be ν = 1.22 and γ = 2.38, which indicates a doubling of the exponents. (b) ξ and I0 along the line of constant ϕC = 0.565 ± 0.003, plotted as a function of ϕ. Both parameters show a maximum in the vicinity of the critical point at ϕ = 0.50. Solid lines are calculated using eqn (9) and (10).59 | ||
The best fits of eqn (6) and (7) to the ξ- and I0-data are obtained when the critical volume fraction was set to  , which quantitatively agrees with the value determined from the phase behavior within the measurement error. For ξ, the corresponding parameter values are = 1.25 ± 0.04 Å and the critical exponent ν = 1.22 ± 0.04. The latter is noticeably larger than the exponents predicted by the mean-field theory and the 3D Ising model, i.e., ν = 0.50 and ν = 0.63, respectively.46,60–62 For I0, the best fit of eqn (7) to the data yields Î = 0.025 ± 0.008 cm−1 and γ = 2.38 ± 0.08. Again, the determined value for the critical exponent γ is larger than the predicted values from the mean-field theory and the 3D Ising model, i.e., γ = 1 and γ = 1.24, respectively.46,58 Nevertheless, the crucial scaling law63
 | (8) |
In Fig. 5(b) we also analyze the variation of ξ and I0 along the line of constant ϕC = 0.565 ± 0.003, varying ϕ, adapting the approach of Kortan et al.59
 | (9) |
 | (10) |
For the correlation length, the best fit with eqn (9) yields b1,ξ = 0.60 Å, b2,ξ = 0.03, ϕ* = 0.47 ± 0.01,  , and ν = 1.22 ± 0.01. For the forward scattering we obtain b1,I = 0.007 cm−1, b2,I = 0.03, ϕ* = 0.47 ± 0.01,
  , and γ = 2.38 ± 0.02 using eqn (10).
To sum up, the obtained values of the critical volume fraction of total alcohol  and oil ϕ* in the water/oil mixture are consistent with the values found in the phase behavior (Fig. 2(a)) and in the 1/ξ versus ϕC plot (Fig. 3(b)). Most importantly, same values of the critical exponents ν and γ were found approaching the critical point by keeping either ϕ or ϕC constant. A doubling of the exponents was found, but still keeping the scaling law γ/ν = 2 − η.
The critical exponents obtained here are about two times larger than the values generally found in the literature of microemulsion and micelle systems.64,65 This exponent doubling phenomenon has been explained with the model of Leung–Griffiths,58,66 in which the observed behavior was attributed to approaching the line of critical points that bounds the closed-loop coexistence in a direction that becomes tangential to this line.67 Sorensen68 also explained the exponent doubling observed in microemulsion systems69,70 with the same argument. Likewise, the exponent doubling observed here might be related to the fact that the critical point of the quasi-ternary system studied is part of the critical line connecting two critical points of the two ternary side systems. However, it should be noted that the critical point is not approached tangentially to the critical line here.
Regular solutions – searching for the tricritical point (TCP)
The weak q−1-scattering observed in the C-contrast SANS data suggested searching for a nearby tricritical point. To prove that a TCP is indeed present in the studied quasi-ternary system by examining the volumes of the water-rich (a) and oil-rich (b) phases with increasing volume fraction δ of 1-propanol in the 2-propanol/1-propanol mixture at ϕ = 0.50, ϕC = 0.40. As shown in ESI‡ (Fig. S4), the “bending stress” (as Kahlweit put it) of the sigmoidal curve describing the change in phase volumes with δ increases towards the inflection point when the temperature is lowered from T = 25.0 °C to T = 5.0 °C, in analogy to the concept of Kahlweit et al., according to which the shape of the critical line is an essential measure of the distance to a TCP.5,19–21 By then increasing the hydrophobicity of the alcohol mixture using a larger 1-C3E0 fraction δ, we were able to convert the unbroken critical line into a broken line and thus pass the TCP. Thus, three phases were observed at T = 1.5 °C, confirming that the quasi-ternary system is now located on the other side of the TCP (Fig. 1, center).To locate the position of the TCP, the point U, characterized by the intersection of the lower (at Tl) and upper (at Tu) critical lines when projected onto the base of a phase prism,5,20 was determined for different δ through variation of both the volume fraction (ϕ) of cyclohexane in the water/cyclohexane mixture and of the two propanol's in the overall mixture (ϕC). Note that, at the point U, two critical lower phases coexist with an oil-rich excess phase at Tl, while at Tu two critical upper phases coexist with a water-rich excess phase, as shown by the photos of the sample closest to the TCP in Fig. 6. It was found that at δ = 0.45, only Tu could be determined, while Tl was below 0 °C. By decreasing δ to δ = 0.435, both Tl = 9.5 °C and Tu = 11.9 °C and could be detected, with three phases forming at temperatures in between. Thus, a phase sequence → 3 → , as observed in classical non-ionic microemulsions, was found. Accordingly, the T(ϕC) section taken through the phase prism at this δ and ϕ shown in the ESI‡ (Fig. S5) demonstrates a fish-like phase diagram with a three-phase and a one-phase region.
 | ||
Fig. 6 Lower (Tl (blue)), mean (![[T with combining tilde]](https://www.rsc.org/images/entities/i_char_0054_0303.gif) (green)) and upper (Tu (red)) temperature of the three-phase body as a function of the 1-propanol volume fraction δ in the 2-propanol/1-propanol mixture, obtained by varying the volume fractions ϕ and ϕC, i.e., of cyclohexane in the water/cyclohexane mixture and of the two propanol's in the overall mixture, respectively. The intersection of the Tu and Tl trajectories gives the tricritical point (TCP) at ϕ = 0.63 ± 0.01, ϕC = 0.545 ± 0.002, δ = 0.406 ± 0.005 and T = 15.2 ± 0.1 °C. Photos of the sample located the closest to the TCP were taken at Tu = 14.3 °C, Tl = 13.9 °C, and = 14.1 °C to show the critical scattering of the phases by green laser light. (green)) and upper (Tu (red)) temperature of the three-phase body as a function of the 1-propanol volume fraction δ in the 2-propanol/1-propanol mixture, obtained by varying the volume fractions ϕ and ϕC, i.e., of cyclohexane in the water/cyclohexane mixture and of the two propanol's in the overall mixture, respectively. The intersection of the Tu and Tl trajectories gives the tricritical point (TCP) at ϕ = 0.63 ± 0.01, ϕC = 0.545 ± 0.002, δ = 0.406 ± 0.005 and T = 15.2 ± 0.1 °C. Photos of the sample located the closest to the TCP were taken at Tu = 14.3 °C, Tl = 13.9 °C, and = 14.1 °C to show the critical scattering of the phases by green laser light. | ||
The TCP of the quasi-ternary system water–cyclohexane–2-propanol/1-propanol was then successfully determined at δ = 0.406 ± 0.005 and T = 15.2 ± 0.1 °C via the intersection of the trajectories Tl(δ) and Tu(δ) at the point U(δ).
In conclusion, this study shows clearly that the studied quasi-ternary system is located close to a TCP, which is indeed passed when the temperature and the composition are adjusted accordingly. This proximity of a TCP therefore supports our hypothesis that the weak fluctuations detected in the C-contrast SANS measurements originate from fluctuations in ϕC.
Microemulsions
To prove the formation of the amphiphilic film in systems after passing the TCP, two systems water–n-octane–CiEj were studied with SANS measurements in bulk (A/B) – contrast. In the balanced state, there is now a three-phase triangle where the middle phase contains equal amounts of water and oil in the system. With increasing amphiphilicity (i, j), the evolution from weakly to strongly structured microemulsions with a three-phase triangle is expected.5,19–23Microemulsions – phase behavior
The isothermal ternary phase diagram (Gibbs triangle) of the system water–n-octane–C4E1, determined at the phase inversion temperature = 19.5 °C, is shown in Fig. 7(a). Within this system, the monomeric solubility γ0 of C4E1 in water and oil is 0.152 and the minimum mass fraction ![[small gamma, Greek, tilde]](https://www.rsc.org/images/entities/i_char_e0dd.gif) of C4E1 to solubilize water and oil into each other is 0.533, which is also known from a previous study.19
of C4E1 to solubilize water and oil into each other is 0.533, which is also known from a previous study.19
 | ||
| Fig. 7 Gibbs triangles (volume fraction) of the ternary systems (a) H2O–n-octane–C4E1 measured at T = 19.5 °C and (b) H2O–n-octane–C5E2 measured at T = 33.7 °C. Black crosses illustrate the SANS study measured as a function of ϕC in bulk-contrast at equal volumes of water and oil, i.e., ϕ = 0.50. | ||
After passing the wetting–nonwetting transition, a more amphiphilic C5E2 was used in the system water–n-octane–C5E2 to characterize microemulsions dominated by the properties of the amphiphilic surfactant film. The ternary phase diagram measured at = 33.7 °C in Fig. 7(b) shows a larger three-phase triangle compared to the C4E1 microemulsion system. It is already known that the three-phase body evolves from the tricritical point upon increasing amphiphilicity (i, j) of CiEj and reaches a maximum in the range of rather short medium chain amphiphiles.19 However, with stronger amphiphilicity, a more efficient solubilization of water and n-octane, i.e., smaller as 0.474, with a much smaller monomeric solubility γ0 compared to C4E1 was observed here.
Microemulsions – small-angle neutron scattering
The SANS spectra of the ternary system D2O–n-octane–C4E1 measured in bulk (A/B) – contrast varying the volume fraction of amphiphile ϕC at ϕ = 0.50 and T = 14.8 °C are presented in Fig. 8(a). One can see that, a decrease in the scattering intensity at low q and a gradual development of the peak at high q while increasing ϕC. There is no obvious peak in samples with low ϕC, which agrees to the findings in previous works.22,23 At high q, an asymptotic Porod regime (I(q) ∼ q−4) is observed indicating the birth of a structure of separated water-rich and oil-rich domains with a sharp interface between them. These curves can be well described with the Teubner–Strey model for bicontinuous microemulsions71| ITS(q) = (a2 + c1q2 + c2q4)−1. | (11) |
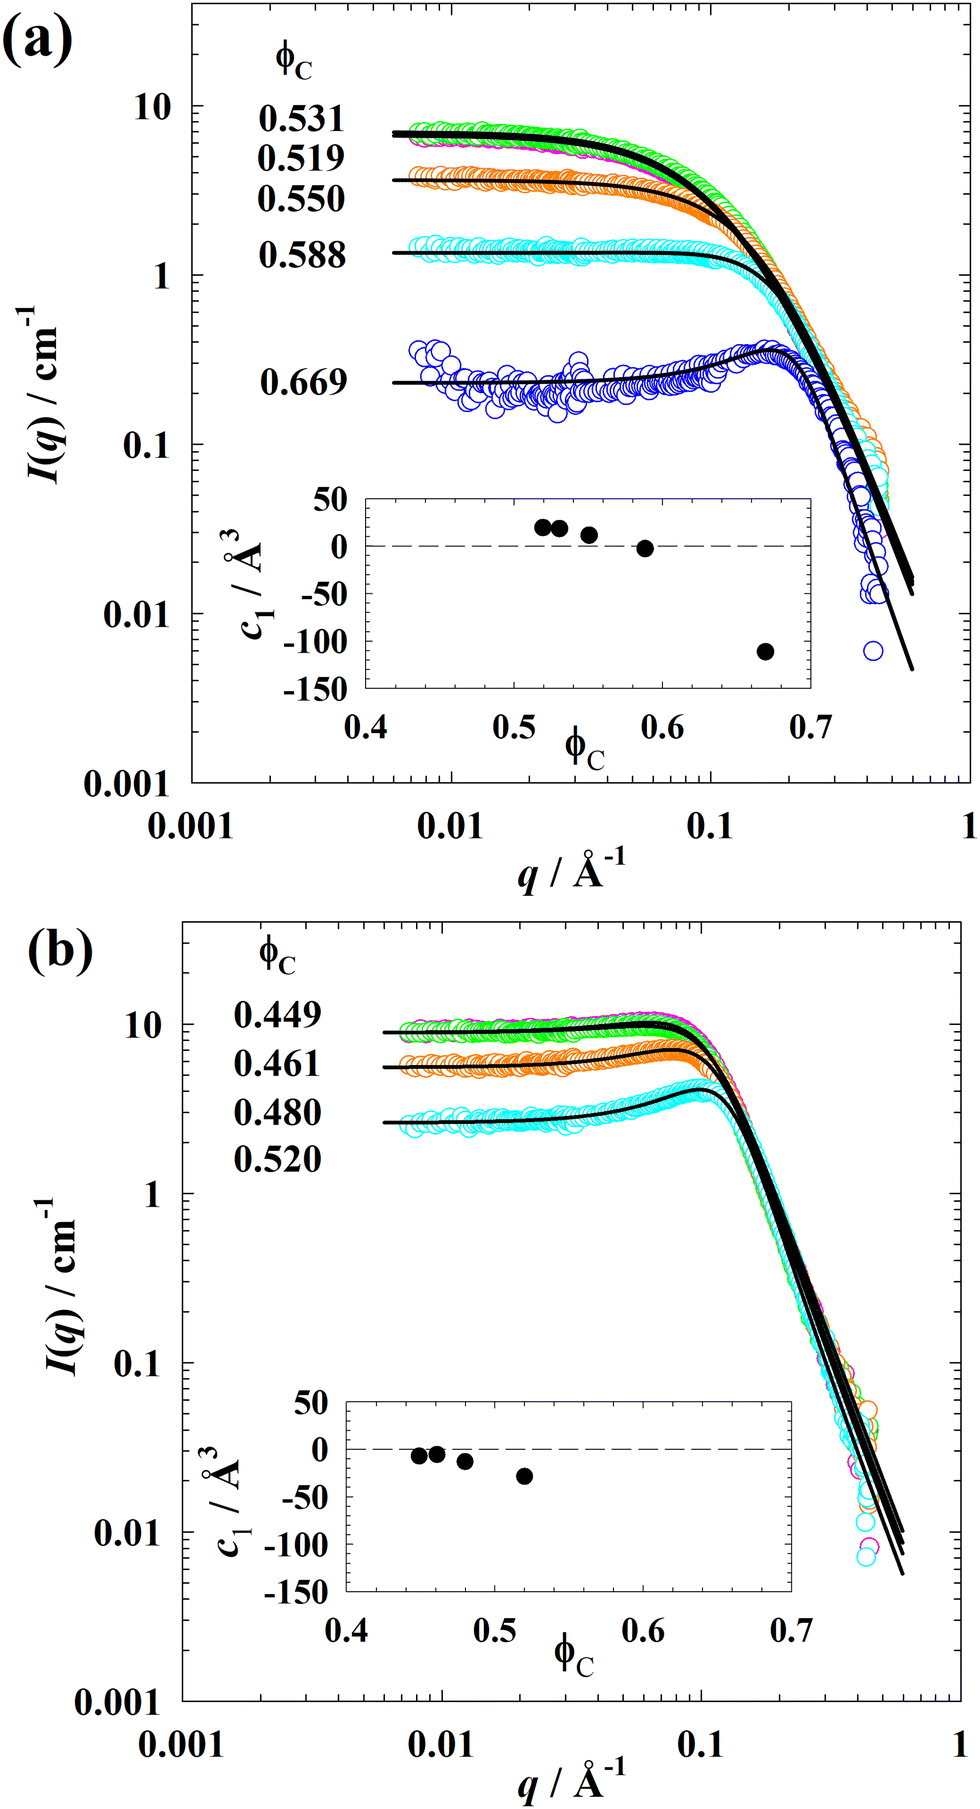 | ||
| Fig. 8 SANS curves of (a) the ternary system D2O–n-octane–C4E1 at T = 14.8 °C and (b) the ternary system D2O–n-octane–C5E2 at T = 30.3 °C measured as a function of the volume fraction ϕC of amphiphile in bulk-contrast at equal volumes of water and oil, i.e., ϕ = 0.50. The insets show the parameter c1 of the Teubner–Strey structure factor (eqn (11)) as a function of ϕC for both ternary systems. Note that we have added a plot of 1/I(q) versus (q − qmax)2 in the ESI‡ (Fig. S6) exemplarily for the system D2O–n-octane–C5E2, including the fits with the TS model. | ||
Here a2 = 1/I0, c1 and c2 are the coefficients of the order parameter expansion defining the periodicity dTS, the correlation length ξTS, and the amphiphilicity factor fa according to
 | (12) |
 | (13) |
 | (14) |
As can be seen, the Teubner–Strey model allows for a quantitative description of the scattering data. The fitting results are listed in the ESI‡ (Table S4). It was found that the periodicity dTS decreases with increasing volume fraction ϕC of amphiphile, whereas the correlation length ξTS slightly increases from 7.24 Å to 10.33 Å. Note that, no dTS values can be obtained when the fa values are bigger than 1 in the first two samples with low ϕC, which is already revealed by the monotonically drop in I(q) curves. It is noteworthy that the amphiphilicity factor fa is an important parameter, which changes from positive to negative when c1 becomes negative, to quantify the degree of order in bicontinuous microemulsions.72,73 For fa > 1 the water–water correlation function (being the Fourier transform of the structure factor eqn (11)), decays monotonically. For fa < 1, the correlation function also contains oscillations, indicative of solution structure. The so-called disorder line (fa = 1) marks the boundary between these two cases. As c1 and fa becomes negative, passing the Lifshitz line (fa = 0), a structure factor peak gradually appears at q > 0. Accordingly, well-structured bicontinuous microemulsions show correlation peaks in the scattering spectra and have negative values of fa.
The analysis of the SANS spectra of the ternary system D2O–n-octane–C4E1 revealed that fa decreases from 1.15 to −0.60 with increasing ϕC (ESI,‡ Table S4) implies a transition passing the disorder line and Lifshitz line. Values of c1 are reported as insets in Fig. 8(a) and (b). These results agree to the previous studies of Gompper and Schick72,73 that the disorder line and/or the Lifshitz line can be passed by increasing the amphiphile concentration even with weak amphiphiles. Further increasing amphiphile concentration will lead to more negative fa values and closer to −1, which implies more structured microemulsions or even lamellar phase.
Afterwards, the structure of the D2O–n-octane–C5E2 system was also studied as a function of ϕC at ϕ = 0.50 and T = 30.3 °C. The SANS curves in Fig. 8(b) show that increasing the C5E2 volume fraction leads to a more distinct scattering peak moving towards higher q-values. In other words, a classical microemulsion behavior was presented and can thus be well described with the TS model. The results of the analysis are listed in the ESI‡ (Table S4). As one can see, the correlation length ξTS in the mixture D2O–n-octane–C5E2 varies from 16.9 Å to 17.7 Å while in the mixture D2O–n-octane–C4E1 the ξTS varies from 7.24 Å to 10.3 Å. In addition, the decrease of periodicity dTS and amphiphilicity factor fa with increasing amphiphile concentration ϕC indicates the evolution of a more defined structure.22,23 The fact that more negative values of fa at low ϕC also points out that more defined structures exist in the mixtures with C5E2 than with C4E1.
Finally, the insets of Fig. 8(a) and (b) show that with increasing amphiphile concentration ϕC, the c1 value obtained from the TS model decreases strongly for both systems, i.e., more structured mixtures are developed with increasing ϕC. Especially, at low ϕC, the system formulated with C5E2 already exhibits negative c1 values, while the system formulated with C4E1 shows positive ones, indicating a higher structural ordering formed with a more amphiphilic C5E2.
Critical composition fluctuations versus “surfactant-free microemulsions”
Above, we have characterized the transition from regular solutions to microemulsions by gradually increasing the amphiphilicity of the “third component”, including the birth of the microemulsion phase, as a “middle phase” from a tricritical point. In the regular solution regime, we have paid particular attention to the critical composition fluctuations that occur not only near the critical plait point, and characterized these fluctuations quantitatively. The results from this work suggest that the mixtures containing propanol as “third component”, showing only a simple miscibility gap, behave to a good approximation as regular solutions, while with C4E1 and C5E2 the SANS data clearly indicate structure on the colloidal length scale and the presence of relatively sharp water–oil interfaces. This crucial difference between regular solutions and microemulsions manifests itself through the different power law behavior of the bulk contrast SANS at large q. While the former exhibit I(q) ∼ q−2 behavior that results from a diverging correlation function,63 microemulsions show Porod scattering (I(q) ∼ q−4). These results are perfectly in line with the overall picture outlined by Kahlweit, Strey and coworkers in their pioneering work approximately three decades ago.19–21Several works have claimed that also solutions in the regular solution regime can be structured microemulsions, referring this to “surfactant-free microemulsions”.34–41 In the early works of Barden and coworkers,74,75 the system water–n-hexane–2-propanol was investigated, and a large part of the one phase region near the binodal was claimed to be an oil continuous microemulsion. More recently, the system water–1-octanol–ethanol has been extensively studied35–38 in particular using small angle scattering, interpreting the scattering data in terms of oil-in-water, bicontinuous and water-in-oil structures.
Obviously, the molecular mixing in these ternary regular solutions is not completely random, as shown by the presence of a miscibility gap. However, referring to these solutions as microemulsions is somewhat misleading and may be a source of confusion as this term normally is reserved for surfactant stabilized oil–water solutions, having structure on the colloidal length scale where essentially pure oil and water domains are separated by a dense surfactant film. Clearly there is a gradual, although non-trivial, transition from regular solutions to microemulsions as illustrated in this work, and first demonstrated by Kahlweit and coworkers.19–21 There is a vast structural difference between the solutions situated on the opposite sides of the tricritical point and the wetting to non-wetting transition. Calling everything microemulsion seems less useful. It is probably better to stay with the suggestions of Danielsson and Lindman,8 including that the concept of microemulsion does not cover surfactant-free systems of any kind.
If small angle scattering data in the regular solution regime essentially show a Lorentzian q-dependence (Ornstein–Zernike), this should most likely best be interpreted in terms of simple composition fluctuations. In particular if the forward scattering, I(0), and the correlation length monotonically increases and appear to diverge as one approaches the critical plait point. Claiming microemulsion structure from such data would require that one first clearly demonstrate that they are not resulting from critical composition fluctuations.
Conclusions
The present study deals with water–oil mixtures stabilized by a third component of varying amphiphilicity. Particular focus is on the transition between essentially disordered molecular mixtures, i.e., regular solutions, and structured microemulsions containing distinct water-rich and oil-rich domains of colloidal dimensions, separated by a surfactant loaded interface. With C3E0 (propanol) as third component, the quasi-ternary system forms regular solutions. In contrast variation SANS the observed scattering is dominated by diverging composition fluctuations as the critical plait point is approached. By carefully tuning a mixture of 1-propanol and 2-proponol it was possible to obtain an approximately symmetric system with fluctuations only in the local water–oil ratio. No signs of any significant solution structure on the nanometer length scale were observed. In oil–water contrast, the SANS patterns, showing the typical q−2 decay, are well described by the classical Ornstein–Zernike scattering function. The critical fluctuations were quantitatively analyzed in terms of critical exponents for the correlation length and the effective compressibility, that showed a doubling of the exponents compared to classical mean-field and 3D Ising models. Such doubling has been explained by the presence of a line of critical points58,66–68 that here may be associated with the use of an alcohol mixture as a quasi third component.The regular solution regime and microemulsions are essentially separated by a tricritical point (TCP), that thus marks the birth of the middle phase microemulsions. The propanol system is close to the TCP and a minor increase in molecular amphiphilicity to C4E1 results in a crossing of the TCP and the formation of microemulsions. Here, the observation of an asymptotic Porod regime (I(q) ∼ q−4) in water–oil contrast strongly indicates a structure of separate water-rich and oil-rich domains with a sharp interface in between. Increasing the amphiphilicity of the third component further to C5E2, results in a further swelling of the middle phase microemulsion and an increasingly well-defined structure as seen by the appearance of a peak in the SANS pattern. We conclude from this that C3E0 (propanol) is not sufficiently amphiphilic to form a dense film at the oil–water interface and stabilize a microemulsion structure, while C4E1 and subsequently C5E2 are.
It has been suggested in the literature that also ternary mixtures in the regular solution regime may be structured into separate water-rich and oil-rich domains, and have referred to the solutions as “surfactant-free microemulsions”.34–42,74,75 The results of the present study, however, where our propanol system is close to the TCP, on the contrary suggest that microemulsions, as defined by being structured into water-rich and oil-rich domains separated by a surfactant loaded interface, are first formed after the TCP. We note also that the ability to form microemulsions with surfactant stabilized oil–water interfaces is also manifested by the wetting-to-nonwetting transition of the middle phase microemulsion.25,26
Data availability
The authors declare that the data supporting the findings of this study are available within the article and its ESI.‡ Should any raw data files be needed in another format they are available from the corresponding author upon reasonable request.Conflicts of interest
The authors declare that they have no known competing financial interests or personal relationships that could have appeared to influence the work reported in this article.Acknowledgements
The authors thank Karl-Erik Bergquist (Lund University) for NMR measurements and the SANS teams consisting of K. Abitaev, K. Schneider, D. Sottmann, S. Lülsdorf, J. Fischer and M. Krappel (Institute of Physical Chemistry, University of Stuttgart) for their help during the SANS measurements. We acknowledge the support of the National Institute of Standards and Technology, U.S. Department of Commerce, in providing the neutron research facilities used in this work. The authors particularly thank the local contact Yun Liu for his expert help during the two beam-times under the proposal numbers S37-87 and S39-47. This work is furthermore based upon experiments (proposal number 14021) performed at the KWS-1 instrument operated by Henrich Frielinghaus at the Heinz Maier-Leibnitz Zentrum (MLZ), Garching, Germany. The authors gratefully acknowledge the financial support provided by the Jülich Centre for Neutron Science (JCNS) to perform the neutron scattering measurements at the MLZ. We thank the Institut Laue Langevin (ILL) in Grenoble (France) for additional SANS measurements performed at the D11 instrument and the valuable support of our local contact Ralf Schweins also for DLS measurements performed at the Partnership for Soft Condensed Matter (PSCM). S.-Y. Tseng acknowledges support from the European Union's Horizon 2020 research and innovation program under grant agreement no. 731019 (EUSMI). U. Olsson acknowledges funding from the Swedish Research Council (grant no. 2020-04633).References
- S. F. Taylor, J. Phys. Chem., 1897, 1, 301 CrossRef CAS.
- W. D. Bancroft and S. S. Hubard, J. Am. Chem. Soc., 1942, 64, 347 CrossRef CAS.
- J. H. Hildebrandt, Proc. Natl. Acad. Sci. U. S. A., 1927, 13, 267 CrossRef PubMed.
- K. Shinoda, H. Kunieda, T. Arai and H. Saijo, J. Phys. Chem., 1984, 88, 5126 CrossRef CAS.
- M. Kahlweit and R. Strey, Angew. Chem., Int. Ed. Engl., 1985, 24, 654 CrossRef.
- K. Ishikawa, M. Behrens, S. Eriksson, D. Topgaard, U. Olsson and H. Wennerström, J. Phys. Chem. B, 2016, 120, 6074 CrossRef CAS PubMed.
- J. H. Schulman and T. P. Hoar, Nature, 1943, 152, 102 CrossRef.
- I. Danielsson and B. Lindman, Colloids Surf., 1981, 3, 391 CrossRef CAS.
- P. G. De Gennes and C. Taupin, J. Phys. Chem., 1982, 86, 2294 CrossRef CAS.
- D. Langevin, Acc. Chem. Res., 1988, 21, 255 CrossRef CAS.
- R. Strey, Colloid Polym. Sci., 1994, 272, 1005 CrossRef CAS.
- J. F. Bodet, J. R. Bellare, H. T. Davis, L. E. Scriven and W. G. Miller, J. Phys. Chem., 1988, 92, 1898 CrossRef CAS.
- W. Jahn and R. Strey, J. Phys. Chem., 1988, 92, 2294 CrossRef CAS.
- B. Lindman, K. Shinoda, U. Olsson, D. Anderson, G. Karlström and H. Wennerström, Colloids Surf., 1989, 38, 205 CrossRef CAS.
- S. A. Safran, Statistical Thermodynamics of Surfaces, Interfaces, and Membranes, Addison-Wesley, Reading, MA, 1994 Search PubMed.
- H. Wennerström and U. Olsson, Langmuir, 1993, 9, 365 CrossRef.
- G. Gompper and M. Schick, Self-assembling Amphlphilic Systems, Academic Press, 1994 Search PubMed.
- D. C. Morse, Curr. Opin. Colloid Interface Sci., 1997, 2, 365 CrossRef CAS.
- M. Kahlweit, R. Strey, P. Firman, D. Haase, J. Jen and R. Schomaecker, Langmuir, 1988, 4, 499 CrossRef CAS.
- M. Kahlweit, R. Strey, M. Aratono, G. Busse, J. Jen and K. V. Schubert, J. Chem. Phys., 1991, 95, 2842 CrossRef CAS.
- M. Kahlweit, R. Strey and G. Busse, Phys. Rev. E: Stat. Phys., Plasmas, Fluids, Relat. Interdiscip. Top., 1993, 47, 4197 CrossRef CAS PubMed.
- K. V. Schubert, R. Strey, S. R. Kline and E. W. Kaler, J. Chem. Phys., 1994, 101, 5343 CrossRef CAS.
- K. V. Schubert and R. Strey, J. Chem. Phys., 1991, 95, 8532 CrossRef CAS.
- L. S. Ornstein and F. Zernike, Proc. Akad. Sci., 1914, 17, 793 Search PubMed.
- O. Abillon, L. T. Lee, D. Langevin and K. Wong, Phys. A, 1991, 172, 209 CrossRef CAS.
- M. Gradzielski, D. Langevin, T. Sottmann and R. Strey, J. Chem. Phys., 1996, 104, 3782 CrossRef CAS.
- B. Widom, Langmuir, 1987, 3, 12 CrossRef CAS.
- G. Gompper and M. Schick, Phys. Rev. Lett., 1990, 65, 1116 CrossRef CAS PubMed.
- R. Aveyard, B. P. Binks, S. Clark and J. Mead, J. Chem. Soc., Faraday Trans. 1, 1986, 82, 125 RSC.
- T. Sottmann and R. Strey, Ber. Bunsen-Ges. Phys. Chem., 1997, 100, 237 CrossRef.
- T. Sottmann and R. Strey, J. Chem. Phys., 1997, 106, 8606 CrossRef CAS.
- D. O. Shah and R. S. Schechter, Improved oil recovery by surfactant and polymer flooding: AIChE symposium on improved oil recovery by surfactant and polymer flooding, 1976, Elsevier, New York, 1977.
- A. Bera and A. Mandal, J. Pet. Explor. Prod. Technol., 2015, 5, 255 CrossRef CAS.
- W. Hou and J. Xu, Curr. Opin. Colloid Interface Sci., 2016, 25, 67 CrossRef CAS.
- T. N. Zemb, M. Klossek, T. Lopian, J. Marcus, S. Schöettl, D. Horinek, S. F. Prevost, D. Touraud, O. Diat, S. Marčelja and W. Kunz, Proc. Natl. Acad. Sci. U. S. A., 2016, 113, 4260 CrossRef CAS PubMed.
- M. L. Klossek, D. Touraud, T. Zemb and W. Kunz, ChemPhysChem, 2012, 13, 4116 CrossRef CAS PubMed.
- O. Diat, M. L. Klossek, D. Touraud, B. Deme, I. Grillo, W. Kunz and T. Zemb, J. Appl. Crystallogr., 2013, 46, 1665 CrossRef CAS.
- S. Schöttl, T. Lopian, S. Prévost, D. Touraud, I. Grillo, O. Diat, T. Zemb and D. Horinek, J. Colloid Interface Sci., 2019, 540, 623 CrossRef PubMed.
- J. Xu, J. Song, H. Deng and W. Hou, Langmuir, 2018, 34, 7776 CrossRef CAS PubMed.
- V. Fischer, J. Marcus, D. Touraud, O. Diat and W. Kunz, J. Colloid Interface Sci., 2015, 453, 186 CrossRef CAS PubMed.
- S. Krickl, L. Jurko, K. Wolos, D. Touraud and W. Kunz, J. Mol. Liq., 2018, 271, 112 CrossRef CAS.
- Y. Han, N. Pan, D. Li, S. Liu, B. Sun, J. Chai and D. Li, Chem. Eng. J., 2022, 437, 135385 CrossRef CAS.
- B. Widom, Physica, 1974, 73, 107 CrossRef CAS.
- H. B. Stuhrmann, J. Appl. Crystallogr., 1974, 7, 173–178 CrossRef CAS.
- J. C. Wheeler and B. Widom, J. Am. Chem. Soc., 1968, 90, 3064 CrossRef CAS.
- H. E. Stanley, Introduction to phase transitions and critical phenomena, Oxford University Press, 1971 Search PubMed.
- H. Kunieda and K. Shinoda, J. Dispersion Sci. Technol., 1982, 3, 233 CrossRef CAS.
- U. Olsson and H. Wennerström, Adv. Colloid Interface Sci., 1994, 49, 113 CrossRef CAS.
- R. Strey, Curr. Opin. Colloid Interface Sci., 1996, 1, 402 CrossRef CAS.
- L. Cailletet and E. Mathias, J. Phys. Theor. Appl., 1886, 5, 549 CrossRef.
- W. Schröer, J. Mol. Liq., 2006, 125, 164 CrossRef.
- V. R. Vale, B. Rathke, S. Will and W. Schröer, J. Chem. Eng. Data, 2010, 55, 4195 CrossRef CAS.
- X. Shao, W. Schröer and B. Rathke, J. Chem. Eng. Data, 2014, 59, 225 CrossRef CAS.
- S. Diekmann, E. Dederer, S. Charmeteau, S. Wagenfeld, J. Kiefer, W. Schröer and B. Rathke, J. Phys. Chem. B, 2020, 124, 156 CrossRef CAS PubMed.
- E. A. Guggenheim, J. Chem. Phys., 1945, 13, 253 CrossRef CAS.
- D. Roux, M. E. Cates, U. Olsson, R. C. Ball, F. Nallet and A. M. Belloq, Europhys. Lett., 1990, 11, 229 CrossRef CAS.
- S. Davatolhagh, Am. J. Phys., 2006, 74, 441 CrossRef.
- R. B. Griffiths and J. C. Wheeler, Phys. Rev. A:At., Mol., Opt. Phys., 1970, 2, 1047 CrossRef.
- A. R. Kortan, H. v Känel, R. J. Birgeneau and J. D. Litster, Phys. Rev. Lett., 1981, 47, 1206 CrossRef CAS.
- J. C. le Guillou and J. Zinn-Justin, Phys. Rev. B:Condens. Matter Mater. Phys., 1980, 21, 3976 CrossRef CAS.
- A. Sariban and K. Binder, J. Chem. Phys., 1987, 86, 5859 CrossRef CAS.
- R. Guida and J. Zinn-Justin, J. Phys. A: Math. Gen., 1998, 31, 8103 CrossRef.
- M. E. Fisher, J. Math. Phys., 1964, 5, 944 CrossRef.
- J. S. Huang and M. W. Kim, Phys. Rev. Lett., 1981, 47, 1462 CrossRef CAS.
- M. Corti and V. Degiorgio, J. Phys. Chem., 1981, 85, 1442 CrossRef CAS.
- S. S. Leung and R. B. Griffiths, Phys. Rev. A:At., Mol., Opt. Phys., 1973, 8, 2670 CrossRef CAS.
- R. G. Johnston, N. A. Clark, P. Wiltzius and D. S. Cannell, Phys. Rev. Lett., 1985, 54, 49 CrossRef CAS PubMed.
- C. M. Sorensen, Chem. Phys. Lett., 1985, 117, 606 CrossRef CAS.
- R. Dorshow, F. de Buzzaccarini, C. A. Bunton and D. F. Nicoli, Phys. Rev. Lett., 1981, 47, 1336 CrossRef CAS.
- F. Nicoli, F. de Buzzaccarini, L. S. Romsted and C. A. Bunton, Chem. Phys. Lett., 1981, 80, 422 CrossRef.
- M. Teubner and R. Strey, J. Chem. Phys., 1987, 87, 3195 CrossRef CAS.
- J. Lerczak, M. Schick and G. Gompper, Phys. Rev. A:At., Mol., Opt. Phys., 1992, 46, 985 CrossRef CAS PubMed.
- G. Gompper, R. Hołyst and M. Schick, Phys. Rev. A: At., Mol., Opt. Phys., 1991, 43, 3157 CrossRef CAS.
- G. D. Smith, C. E. Donelan and R. E. Barden, J. Colloid Interface Sci., 1977, 60, 488 CrossRef CAS.
- B. A. Keiser, D. Varie, R. E. Barden and S. L. Holt, J. Phys. Chem., 1979, 83, 1276 CrossRef CAS.
Footnotes |
| † This article is dedicated to the memory of Professor Stefan Egelhaaf, an outstanding scientist and inspiring academic teacher. To have known and worked with Stefan personally has been a privilege and an honour. |
| ‡ Electronic supplementary information (ESI) available. See DOI: https://doi.org/10.1039/d4sm01258e |
| This journal is © The Royal Society of Chemistry 2025 |