Structural electrochemistry of poly(3,4-ethylenedioxythiophene) and its applicability as simultaneous sensor of environmental surroundings: self-sensing electrical, thermal, and chemical working conditions†
Lijin
Rajan
a,
Madari Palliyalil
Sidheekha
 a,
Aranhikundan
Shabeeba
 a,
Toribio F.
Otero
 b and
Yahya A.
Ismail
 *a
*a
aAdvanced Materials Research Center, Department of Chemistry, University of Calicut, Thenhipalam, Kerala 673635, India. E-mail: aiyahya@uoc.ac.in; aiyahya123@gmail.com
bLaboratory of Electrochemistry, Intelligent Materials and Devices, Universidad Politécnica de Cartagena, Campus Alfonso XIII, 30203 Cartagena, Spain
First published on 19th January 2024
Abstract
An extensive electrochemical investigation of PEDOT has been carried out with a particular focus on understanding the structural electrochemistry during its faradaic process, a topic that has not been previously explored in such detail. Using coulovoltammetry, we examined the diverse conformational states of PEDOT and the corresponding charge consumption, shedding new light on its electrochemical behavior. For the first time, we conducted a thorough coulovoltammetric study of PEDOT, which enables us to delve deeper into its unique electrochemical characteristics and reactions. By utilizing voltammetry, we also explored how the anodic and cathodic potential limits influence the various electrochemical processes involved in the PEDOT reaction. Moreover, we have analyzed PEDOT's reactive sensing capabilities towards its working environmental surrounding condition such as electrical, chemical and thermal conditions using both voltammetry and chronopotentiometry. The charge and electrical energy consumed during the reaction serve as essential sensing parameters, providing valuable insights into PEDOT's versatile applications as a biomimetic reactive sensor. Here we once again proved the simultaneous and biomimetic self-sensing property of a conducting polymer during actuation.
1 Introduction
Bio-mimicking is a fascinating approach that draws inspiration from the nature to solve complex problems and create innovative solutions. By studying nature's brilliant adaptations, scientists, engineers, and designers seek to replicate these adaptations to human-made technologies, products, and systems helping us create a balanced connection between our innovations and the environment. Mimicking one of the fascinating biological phenomena, i.e., the brain–muscle interfacing remains as a great challenge to the scientific community.1 The working of biological muscles is based on the electrical signals generated in the brain; send to the muscle through the motor neuron, liberating Ca2+ ions in the cell initiating the reaction-driven conformational movements of the actin–myosin–ATP (muscular contraction).2 Any muscle is an electro-chemo-mechanical organ working by cooperative actuation of the constitutive macromolecular motors (actin–myosin proteins).3 While actuation biological muscles sense the environment (temperature, pressure, muscle potential and chemical potential in the body), transmitting back this sensing information to the brain through the sensing neuron.4 Scientific community is in search of a reactive material model constituted by macromolecular motors which can mimic this simultaneous actuation and sensing abilities using the same connectivity: actuation orders and sensing signals present, simultaneously in the two connecting wires.5,6Every chain of a conducting polymer acts as a macromolecular motor during electrochemical reactions mimicking the sensing ability of the biological muscle and its feedback communication back to the brain.4 Among the conducting polymers, the remarkable biomimetic simultaneous reactive sensing abilities of polypyrrole, polyaniline and polyindole have been effectively demonstrated recently.7,8 The cooperative actuation of the chains in the polymeric material during the oxidation/reduction reactions in liquid electrolytes promotes the generation/destruction of free volume required for the incorporation/expulsion of balancing counter ions and solvent, required for osmotic balance: the reactions drive reversible structural changes (relaxation, swelling, shrinking and contraction). The reaction is driven by an electrical order (potential, potential sweep, constant current) sent to the material. The electrical responses during reactions (consumed charge, consumed energy, potential evolution) are different for different working (chemical, thermal, electrical) conditions.9 Signal, the order and the sensing responses, are included simultaneously within the only two connecting wires.
In our pursuit of proving all conducting polymers have such biomimetic sensing capability, here we have identified poly(3,4-ethylenedioxythiophene) (PEDOT) as a promising candidate.10–12 PEDOT's exceptional qualities make it an ideal choice for establishing optimal sensing performance under various working conditions.13,14 PEDOT boasts numerous advantageous features, including ease of synthesis, high electrical conductivity, lightweight, and precise control over its electrochemical performance.15,16 These outstanding properties have led to its versatile applications in various fields, such as actuators,17–19 sensors,20–22 supercapacitors,23–26 batteries,27,28 tissue engineering,29,30 and electrocatalysis.31 Harnessing the potentials of PEDOT enables us to enhance device fabrication and explore new horizons in the realm of materials science.
Here our primary focus lies in delving into the reactive sensing capability of PEDOT concerning various working conditions, encompassing electrical, chemical, and thermal conditions.3,7,32 To establish this sensing ability, we employ cyclic voltammetry as a reliable tool. Through the implementation of coulovoltammetry (QV, by integrating the CV) and chronopotentiometry, we quantitatively compute the charge and electrical energy expended during the reaction.33–35 Moreover, we have discussed in detail the structural electrochemistry of the PEDOT powder.
PEDOT has earned its reputation as a renowned conducting polymer, finding applications in various fields as mentioned earlier. However, the intricacies of its electrochemistry, along with the electrochemically induced structural variations and conformational changes, remain largely unexplored. Thus, the primary objective of this work is to delve into the realm of PEDOT's electrochemistry and place special emphasis on the intricacies of its structural variations. We aim to thoroughly examine the diverse processes of this polymer triggered by its unique electrochemical reactions and here we argued that the reactive sensing capabilities towards the working condition are a general property of all conducting polymers.
2 Experimental
2.1. Synthesis of PEDOT
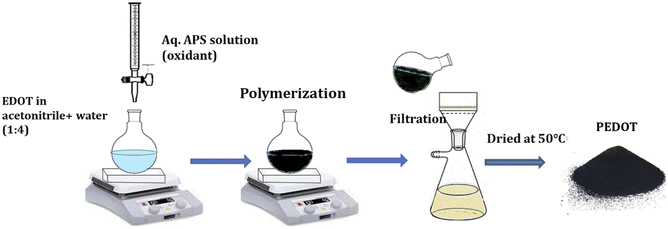
Conductive poly(3,4-ethylenedioxythiophene) powder (PEDOT) was synthesized via chemical oxidative polymerization, utilizing ammonium persulfate (APS) as the catalyst in an acetonitrile/water mixture. In the typical procedure, the 3,4-methylenedioxy thiophene monomer (0.01 moles) was dissolved in 50 ml of acetonitrile/water mixture (1![[thin space (1/6-em)]](https://www.rsc.org/images/entities/char_2009.gif) :
:![[thin space (1/6-em)]](https://www.rsc.org/images/entities/char_2009.gif) 3). The surfactant CTAB (0.01 moles) was added to the mixture and stirred for 2 hours. Gradually, 0.0125 moles of APS solution in 50 ml of water were introduced to the monomer solution. After 24 hours, the resulting dark powder was filtered using Whatman 40 filter paper. The precipitate was then repeatedly rinsed initially with double distilled water to remove the oxidant and later with methanol to eliminate the oligomers and unreacted monomers. The product was dried for 24 hours at 50 °C (Fig. 1).
3). The surfactant CTAB (0.01 moles) was added to the mixture and stirred for 2 hours. Gradually, 0.0125 moles of APS solution in 50 ml of water were introduced to the monomer solution. After 24 hours, the resulting dark powder was filtered using Whatman 40 filter paper. The precipitate was then repeatedly rinsed initially with double distilled water to remove the oxidant and later with methanol to eliminate the oligomers and unreacted monomers. The product was dried for 24 hours at 50 °C (Fig. 1).
2.2. Working electrode fabrication using PEDOT
The PEDOT powder, which was prepared beforehand, was employed as the working electrode by affixing it onto a glassy carbon electrode using conducting carbon paste. A mixture containing 5 mg of PEDOT powder and 5 mg of conducting carbon paste was dissolved in 200 μL of isopropyl alcohol using ultra sonication. Later, 20 μL (containing 0.5 mg of PEDOT powder) of the solution was drop-deposited onto a glassy carbon electrode (GCE) and left to dry. The resulting GCE with the embedded PEDOT was used as the working electrode for all electrochemical characterizations in three-electrode methods.3 Results and Discussion
3.1 General characterization of PEDOT
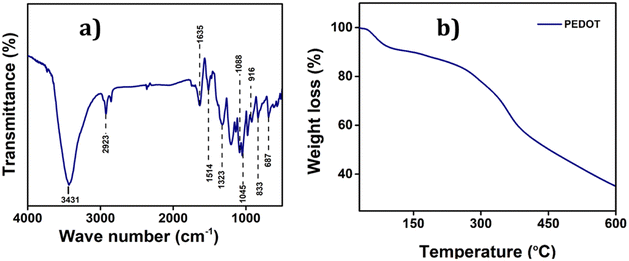
![[double bond, length as m-dash]](https://www.rsc.org/images/entities/char_e001.gif) C and the inter-ring stretching mode of C–C, respectively.36 The bending vibrations of C–O–C bonds in the ethylenedioxy groups within PEDOT are represented by the bands at 1045, 1088, 1138, and 1188 cm−1. Additionally, the bands at 972, 916, 833, and 687 are attributed to the stretching vibrations of C–S–C bonds within the thiophene ring. Moreover, the bands at 3431 cm−1 and 2923 cm−1 are indicative of the C–H and C–O stretching within the ring, respectively. These characteristic bands serve as robust evidence confirming the successful polymerization and formation of PEDOT.37
C and the inter-ring stretching mode of C–C, respectively.36 The bending vibrations of C–O–C bonds in the ethylenedioxy groups within PEDOT are represented by the bands at 1045, 1088, 1138, and 1188 cm−1. Additionally, the bands at 972, 916, 833, and 687 are attributed to the stretching vibrations of C–S–C bonds within the thiophene ring. Moreover, the bands at 3431 cm−1 and 2923 cm−1 are indicative of the C–H and C–O stretching within the ring, respectively. These characteristic bands serve as robust evidence confirming the successful polymerization and formation of PEDOT.37
The Raman spectrum of PEDOT also provides more information about its vibration and doping stage which is given in the ESI (Fig. S1†).38
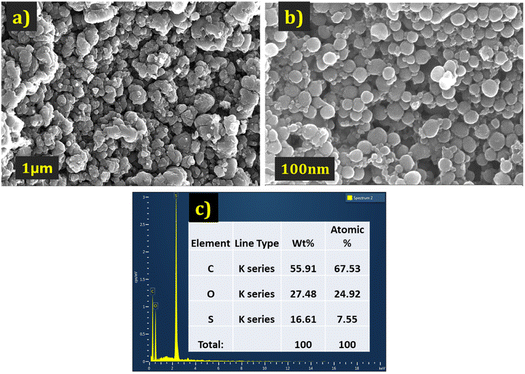 | ||
| Fig. 3 The FE-SEM images of PEDOT (a) at 1 μm. (b) At 100 nm magnification (c) EDX data of the PEDOT. | ||
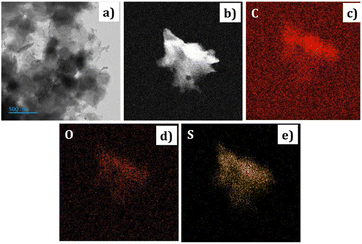
The elemental analysis of the PEDOT polymer was also conducted and depicted in Fig. 3(c). The percentage of sulphur confirms the presence of HSO4− counter ions.
3.2 Electrochemical characterization
The oxidation of the polymer chain by extraction of one electron results in a restructuration of the double bonds along several monomeric units with generation of a positive charge (in fact a radical-cation or polaron). For charge balance this charge is effectively compensated by the incorporation of a monovalent counterion (anion) from the electrolyte.46 Furthermore, solvent molecules are interchanged between the polymer and the electrolyte to maintain equilibrium amidst anion intercalation-induced osmotic pressure.1,45 The reaction goes on by extraction of consecutive electrons from each polymeric chain at rising potentials promote conformational movements of the polymeric chains (macromolecular electrochemical motors) with generation of the free volume required to incorporate balancing counterion and solvent. The reversible reaction of the polymer's active centres can be precisely described as:
(PEDOT*)S + n(A−)sol + m(H2O) ![[left over right harpoons]](https://www.rsc.org/images/entities/char_21cb.gif) [(PEDOT)n+(A−)n(H2O)m]gel + ne− [(PEDOT)n+(A−)n(H2O)m]gel + ne− | (1) |
Each polymer's active centre, referred to as “PEDOT*”, is the key player responsible for generating a positive charge at the interface of the electrode and electrolyte when the first electron is removed from the polymer chain. The monovalent anion present in the electrolyte is represented as “(A−)sol.” Upon oxidation the cooperative actuation of the polymeric motors promotes the incorporation of counter ions and solvent, the polymer swells and forms a polymeric gel, as depicted in reaction (1).47 This volume variation is a large reaction-driving structural change. The term “ne−” indicates that up to “n” electrons are expelled from each polymeric chain through n consecutive steps. The polymer reduction drives reverse processes: expulsion of counter ions and solvent and contraction of the polymeric volume.
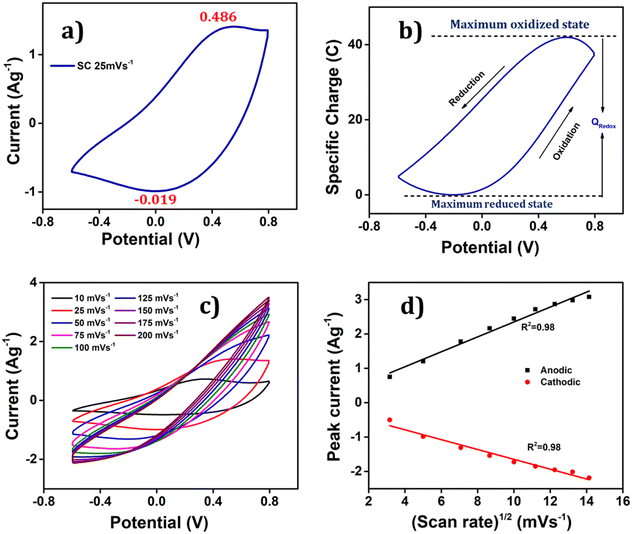
To ascertain the process initiated at the electrode–electrolyte interfaces and then involving the full PEDOT volume during the redox reaction of the polymer electrode, the relationship between the anodic/cathodic peak current and the scan rate was examined, as shown in Fig. 5(c). This figure compellingly illustrates that as the scan rates increase, the anodic peaks shift towards more positive potential values, while the cathodic peaks shift towards more negative potential values, providing solid evidence that the redox reaction becomes more resistant at higher scan rates due to the constrained entry/expulsion of counter ions through the polymer film. Conversely, a reversed trend is observed when the scan rate is reduced; confirming that the conformational movements of the polymeric chains are significantly impacted due to the creation/demolition of a larger quantity of free volume, which is essential to accommodate the increased number of counter ions and solvent molecules. Interestingly, the Fig. 5(d) demonstrates a linear relationship between the anodic and cathodic current peaks with the square root of the scan rate, implying that the process at the electrode–electrolyte interface is under diffusion control up to 200 mV s−1.
The attained coulovoltammetric response from Fig. 5(b) presents a great asymmetry between the evolution of the oxidation charge and that of the reduction charge. That means that by integration a great asymmetry will be obtained between the concomitant consumed energies. This fact linked to the actuation of electro-chemo-mechanical macromolecular motors is being explored as a model to understand why and how Mother Nature has developed asymmetric biological functions based on electro-chemo-mechanical proteins: muscles only work by contraction or ionic channels only allow one way ionic flow: the most efficient from an energetic point of view.50
3.3 Structural faradaic processes in PEDOT
The Fig. 6 presents the QV, acquired by integrating the CV recorded in a 1 M NaCl solution at room temperature with a scan rate of 25 mV s−1, enabling the structural variations of PEDOT material during the faradaic processes.47 The closed QV loop displays four distinct basic slope variations, shedding light on the structural changes of PEDOT induced by the reaction-driven conformational movements of the polymeric chains, including reduction–shrinking (from point 5 to point 6), reduction–compaction (from 6 to 2), oxidation–relaxation (from 2 to 3), and oxidation–swelling (from 3 to 5), which can be characteristic of all conducting polymers.1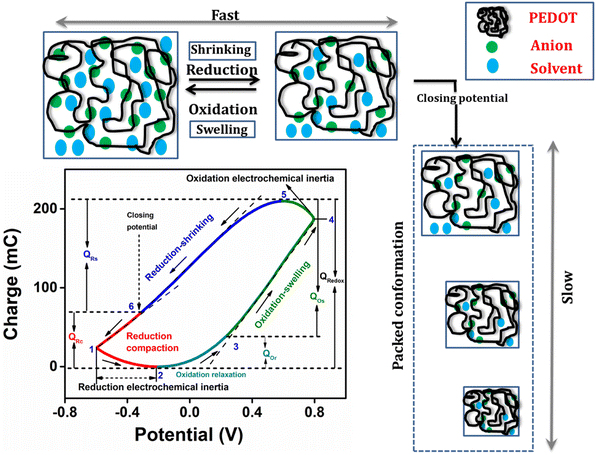 | ||
| Fig. 6 Different structural processes during the electrochemical reaction from QV in 1 M NaCl at 25 mV s−1. | ||
The closed QV exhibits four distinct slope variations like polypyrrole,48,51 the four slope variations in PEDOT QV corresponds to the structural changes occurring during the redox process: starting from a swollen oxidized PEDOT material identified as fast reduction–shrinking closing the structure when the average intrachain distances equals the diameter of the counter ion unit, slow subsequent reduction compaction, slow oxidation relaxation52 opening channels through the compacted structure, and fast oxidation swelling.
All of these structural processes are controlled by the reaction kinetics under conformational kinetic control (compaction and relaxation) or counter ion diffusion control (Fig. 5(c)) swelling and shrinking. The oxidation process in the PEDOT film commences from the QV minimum. As electrons are extracted from the polymer chain, a positive charge is generated, initiating the relaxation of the reduced-compacted polymer chains to create sufficient free volume for accommodating anions and solvent molecules.
Prior to relaxation, the polymer chain adopts a compact structure. The segment of the curve in the Fig. 6, ranging from point 2 to point 3, corresponds to the structural change known as oxidation–relaxation. Following the relaxation, the polymer undergoes fast oxidation–swelling, starting from point 3 on the QV curve. The significant anodic slope observed from point 3 to point 4 on the QV curve indicates the occurrence of the oxidation–swelling process, governed by kinetics. The rate at which anions diffuse from the solution to the polymer chain plays a crucial role in this process. It is worth noting that the anodic potential limit at point 4 in the Fig. 6 (0.8 V) does not mark the boundary of the oxidation process. Instead, the process continues beyond this anodic potential limit at the beginning of the cathodic potential sweep, up to the QV maximum. This fact is known as oxidation electrochemical inertia (OEI).
The reduction process of the polymer commences from the QV maximum, which is also where the oxidation process ends. The rate of this reduction–shrinking process is determined by the diffusion of anions and solvent molecules from the film to the solution. As a result, the reduction–shrinking is classified as a fast kinetic control process. The polymer material experiences shrinking during reduction until it reaches the closing potential (point 6 on the QV curve in the Fig. 6). Upon reaching the closing potential, the rate of shrinking decreases despite the higher cathodic potential due to the fact that the counter ions must push apart those polymeric chains (still this is a soft and wet material allowing movements of the polymeric chains) closing its way towards the solution: this fact consumes energy and time. At the closing potential, the distance between adjacent polymer chains almost equals the hydrated anion diameter. Consequently, the rate of diffusion reduces, and the anions push against the polymer chain, leading to a more compact conformation known as reduction–compaction. The reduction–compaction process initiates from the closing potential and continues until the QV minimum is reached. Notably, the reduction of PEDOT is not completed at the cathodic potential limit. From points 1 to 2 on the Fig. 6, a slow reduction persists for the partially oxidized polymer chain (at −0.6 V), referred to as reduction electrochemical inertia.
The closed QV loop indicates that the PEDOT reaction at this specific potential limit is reversible. In a reversible redox process, the charge consumed during oxidation is equivalent to the charge consumed during reduction. Therefore, the total redox charge and the charge for each structural process can be determined from the QV. The overall oxidation charge (QOx) is calculated by adding the charge from oxidation–relaxation (QOr) and the charge from oxidation–swelling, which includes the oxidation electrochemical inertia (QOei). Conversely, the reduction charge is the sum of the fast reduction–shrinking charge (QRs) and the reduction–compaction charge (QRc). The total charge consumed in each structural process is listed in Table 1.
| Structural process | Oxidation (QOx) | Reduction (Qred) | |||
|---|---|---|---|---|---|
| Relaxation (QOr) | Swelling (QOs) | OEI (QOei) | Shrinking (QRs) | Compaction (QRc) | |
| Potential range (V) | −0.213 to 0.234 | 0.234 to 0.793 | 0.793 to 0.582 | 0.582 to −0.313 | −0.313 to −0.213 |
| Charge (mC) | 38.87 | 146.79 | 23.96 | −141.18 | −68.44 |
| Total charge (mC) | 209.62 | −209.62 | |||
| Q Ox = Q Or + Q Os + Q Oei | Q red = Q Rs + Q Rc | ||||
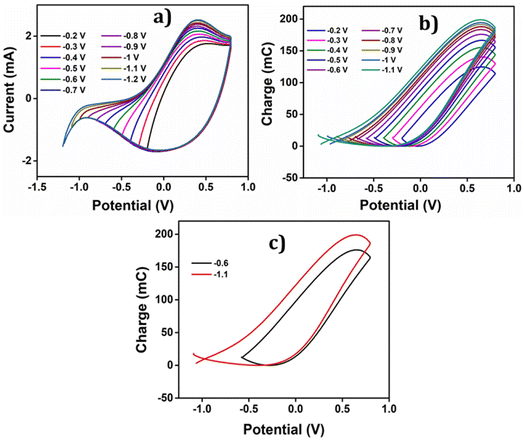
• In the cathodic region, there is a continuation of the reduction process beyond −0.5 V, as evidenced by the presence of low current. The specific cathodic potential limit, at which the reduction process concludes, needs to be determined.
• With an increase in the cathodic potential limit, the oxidation current peak shows a noticeable rise, indicating a deeper reduction of PEDOT. The potential limit for the reversible redox process of the PEDOT electrode must be identified.
• Beyond −0.7 V, there is a notable increase in the reduction current, suggesting the occurrence of a new reduction process. The nature of this reduction process needs to be investigated to determine whether it is reversible or irreversible.
To uncover all the valuable insights gathered from the cyclic voltammetry (CV), the charge versus potential (QV) curve is utilized. It reveals the nature of the process-induced structural variations and the corresponding charge consumption throughout the reaction. The QV curves, obtained by integrating the data from the Fig. 7(b), are presented in the same figure along with the following observations and their interpretations:
• As evidenced by the CV results, the low cathodic current flow beyond −0.2 V is attributed to the slow reduction–compaction of PEDOT.
• A closed loop is observed in the QV curve, ranging from −0.2 V to −0.6 V, which confirms the presence of a reversible reduction process. This range corresponds to the maximum potential range of −0.6 V to 0.8 V, where the oxidation charge is equivalent to the reduction charge.
• Beyond −0.6 V, the QV curve displays two distinct segments: the closed loop representing the reversible reduction process and an open part signifying the parallel irreversible reduction (the cycle end is sifted cathodically related to the starting point: a net reduction charge) caused by hydrogen evolution during the reaction.
• The total reversible redox charge consumed during the reaction is determined from the difference between the QV maximum and minimum points.
• Similarly, the charge consumed during the irreversible reduction process (Qirr) can be calculated by finding the difference between the starting and ending points of the open section in the QV curve.
• Consequently, the overall charge consumed during the two reactions is computed as Qred = Qredox + Qirr.
The Fig. 7(c) illustrates the QVs obtained at −0.6 V and −1.1 V, to distinguish the reversible and irreversible QVs. The charge consumed during each cathodic potential limit is calculated and listed in Table 2.
| Cathodic limit (V) | Q redox (mC) | Q irr (mC) | Q reduction (mC) |
|---|---|---|---|
| −0.2 | 124.76 | 124.76 | |
| −0.3 | 140.43 | 140.43 | |
| −0.4 | 155.18 | 155.18 | |
| −0.5 | 166.57 | 166.57 | |
| −0.6 | 176.08 | 176.08 | |
| −0.7 | 183.57 | 4.34 | 187.91 |
| −0.8 | 188.04 | 7.7 | 195.74 |
| −0.9 | 191.75 | 8.28 | 200.03 |
| −1 | 194.47 | 12.59 | 207.06 |
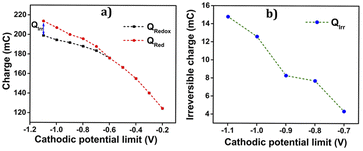
The Fig. 8(a) illustrates the charge consumption during the cathodic potential limit. Remarkably, the reduction–compaction process persists beyond the maximum reduction potential of −0.6 V.
As depicted in the Fig. 8(a), from −0.2 V to −0.6 V, an overlap of oxidation and reduction charges is observed, unequivocally indicating a purely reversible polymeric reaction (1) within this range. The charge variations exhibit a linear relationship with the cathodic potential limit during this reversible process. However, after reaching −0.6 V, the charge profile shows two separate components, namely Qredox and Qirr. Notably, the rising compacted structure beyond 0.8 V gives slower reduction and disrupts the linearity, leading to a reduction in charge magnitude up to the potential limit of −1.1 V. Furthermore, the parallel irreversible charge consumption rises as the cathodic potential limit increases, demonstrating its dependence on this limit. The Fig. 8(b) showcases the variation of this irreversible charge with the cathodic potential limit, providing insightful information about the process.
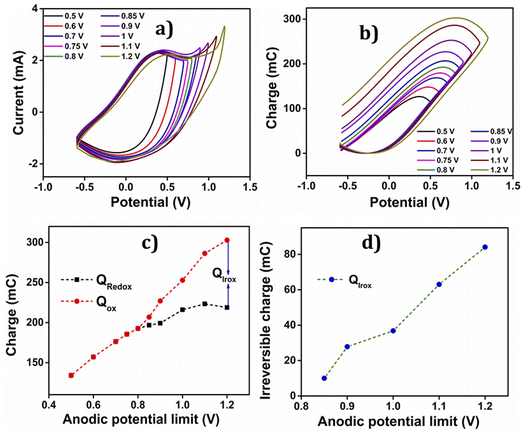
• Up to 0.8 V, a closed loop devoid of any reversible process is observed.
• Beyond 0.8 V, the anodic potential exhibits a higher oxidation charge than the reduction charge, indicating the presence of parallel irreversible oxidation reactions during the process.
• The irreversible charge consumed during the reaction is determined by calculating the difference between the starting and ending points of the open loop. Consequently, the reversible charge (Qredox) consumed is derived by subtracting the irreversible oxidation charge (Qirox) from the total charge (the difference between QV maxima and minima) (Qtotal),
| Qredox = Qtotal − Qirox | (2) |
The parallel irreversible oxidation occurring during the reaction or the overlap with the polymeric redox process is attributed to the liberation of oxygen from the electrode, leading to over oxidation.
The Fig. 9(c) illustrates the charge variation during the oxidation–reduction process at different anodic potential limits. It is evident from the figure that the oxidation charge and reduction charge show an overlap up to 0.8 V. Beyond 0.8 V, two distinct components of charges are observed; one reversible and the other irreversible.
The Qox is greater than Qredox due to the irreversible oxygen evolution and PEDOT over-oxidation, initiated from 0.85 V and extending up to 1.2 V. The charge consumed during each anodic potential limit is calculated and given in Table 3.
| Anodic limit (V) | Q redox (mC) | Q iox (mC) | Q reduction Q total (mC) |
|---|---|---|---|
| 0.5 | 126.85 | — | 126.85 |
| 0.6 | 148.28 | — | 148.28 |
| 0.7 | 168.95 | — | 168.95 |
| 0.75 | 179.63 | — | 179.63 |
| 0.8 | 192.62 | — | 192.62 |
| 0.85 | 206.75 | 10 | 196.75 |
| 0.9 | 227.04 | 27.85 | 199.19 |
| 1 | 252.83 | 36.82 | 216.01 |
| 1.1 | 286.35 | 63.02 | 223.33 |
| 1.2 | 302.91 | 84.1 | 218.81 |
The graph in the Fig. 9(d) depicts the change in irreversible oxidation concerning the anodic potential limit. It is evident from the plot that as the anodic potential increases, the irreversible oxidation also increases.
Based on the discussions in the preceding sections, the potential range for the reversible redox process of the PEDOT electrode in aqueous electrolyte takes place between −0.6 V and 0.8 V. In this way we should avoid any hydrogen and oxygen evolution. Another important point related to Fig. 9(d) and 8(a) is that the polymeric oxidation/reduction goes on beyond those limits: the increase of the redox charge goes on. An organic solvent having a large potential window than aqueous solitons should be more convenient for a deeper study of the reversible polymeric redox reactions.
3.4 Sensing ability of PEDOT electrode material towards the working electrical, chemical and thermal ambient using voltammetric study
Voltammetry was employed to validate the PEDOT electrode's ability to detect alterations in operational conditions. The study delved into the influence of diverse electrical, chemical, and thermal factors on the charge consumption during the reaction.53 The extent of the redox process was ascertained by computing the redox charge expended throughout the process. When the reaction reaches a high degree, it generates a substantial free volume that accommodates counter anions and solvent molecules, countering the positive charge osmotic pressure, thus leading to more profound oxidation and greater charge consumption during the process.54 The amount of charge consumed in this process was quantified by integrating the voltammogram, the QV.55 The reversible redox charge expended during the reaction serves as a sensing parameter, providing quantitative predictions about the working environment.After achieving a stable voltammetric response, the PEDOT electrode underwent three consecutive potential sweeps, ranging from −0.6 V to 0.8 V, with a scan rate of 25 mV s−1 in 1 M aqueous NaCl solution at room temperature.
The corresponding voltammetric response at different scan rates was presented in the Fig. 5(c), revealing an increase in both anodic and cathodic peak currents as the scan rates escalates. By integrating the voltammograms, the reversible charge during the reaction was determined at various scan rates, enabling the creation of a coulovoltammogram, as depicted in the Fig. 10(a). Notably, the figure demonstrates a decline in redox charge as the scan rate rises: the reaction time drops. The double logarithmic correlation between scan rates and consumed redox charge, which was depicted in Fig. 10(b) validates that the PEDOT electrode exhibits the ability to sense electrical working conditions, utilizing the consumed redox charge as the sensing parameter with −0.5653 C (mV s−1)−1 sensitivity (the slope).
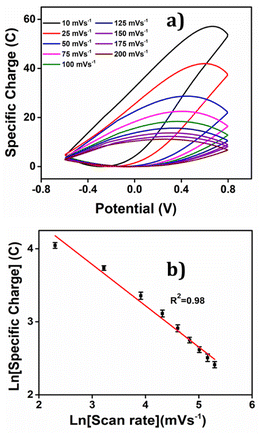 | ||
| Fig. 10 (a) Coulovoltammogram obtained by integrating the corresponding CVs from Fig. 5(c). (b) Double logarithmic relation of redox charge consumed during the reaction of PEDOT obtained from the coulovoltammogram with the scan rate. | ||
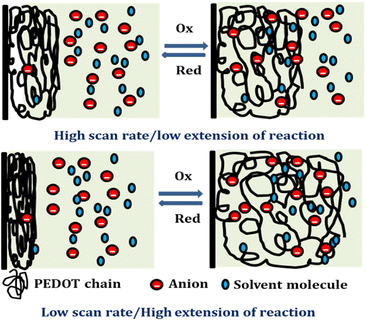
Reducing the scanning rates results in a prolonged reaction time, this, in turn, leads to a greater exchange of anions and solvent molecules. This increased interaction amplifies the extension of the reaction and results in a higher consumption of redox charge. Conversely, at higher scanning rates, the exchange between anions and solvent molecules is reduced. This phenomenon occurs because the reaction time is reduced for higher scan rates, causing a smaller extension of the reaction and consequently lower redox charge consumption. Fig. 11 illustrates the visual representation of this reaction extension at different scan rates.
3.4.1.1 Theoretical description. Through the observation of the reversible reaction (1), we have successfully showcased its capability to discern alterations in thermal conditions. The key parameter employed for this detection is the quantity of redox charge consumed during the reaction, which has been measured and employed to elucidate the sensing mechanism of PEDOT. To establish the relationship between the amount of redox charge and the working temperature, a thorough investigation of the PEDOT oxidation kinetics was conducted, representing the forward reaction of reaction (1).
| r = k[Cl−]α[PEDOT0]β | (3) |
The reaction rate can be denoted as “r” and the rate constant as “k.” The concentration of the counter anion, chloride ion, is represented as [Cl−]. The concentration of the active centre in the polymer gel is indicated by [PEDOT]0. The reaction orders corresponding to the concentrations of the counter ion and polymer gel's active centre are denoted as “α” and “β,” respectively. As the volume of the active centre undergoes continuous changes during the reaction, the rate equation can be expressed in terms of the concentration of the active polymeric centre per unit of dry polymeric mass (specific concentration). In other words, the rate equation can be reformulated as the rate per unit mass.
 | (4) |
Reaction (1) demonstrates the alteration in the concentration of the polymeric centre, which can be assessed by examining the redox charge consumed throughout the process.
 | (5) |
The particular reaction rate, defined as the partial derivative of the specific concentration of the active centre per unit time, is determined by the specific concentration of the active centre, labelled as q. The charge consumed during the reaction is denoted by Q, and z represents the valence of the counter anion or the valence of the polymeric active centre (in this instance, Cl− possesses a valence of 1). F, having a value of 96![[thin space (1/6-em)]](https://www.rsc.org/images/entities/char_2009.gif) 489 C mol−1, stands for the Faraday constant.
489 C mol−1, stands for the Faraday constant.
 | (6) |
The mean specific reaction rate can be ascertained by examining the coulovoltammetric response and computing the duration required to complete a potential window (ΔE/ν).
 | (7) |
Eqn (5) can be rearranged as;
 | (8) |
The function of the consumed redox charge was employed to assess the impact of scan rate on the reaction extension, where V represents the active centre's volume in litters, and ρ signifies the density in grams per litter. The consumed oxidation or reduction charge, as given by eqn (8), determines the alteration in the concentration of the polymer active centre. The rate of reaction is defined by the rate of change of the concentration of the active centre [PEDOT] per unit of time, which can be calculated using the potential, scan rate (ν), and time (∂t = ∂E/ν). The formation rate of polarons is equivalent to the reduction in the concentration of the polymer active centre, which also corresponds to the number of moles of electrons (number of Faraday) released from the polymer chain.
 | (9) |
The reaction rate also can be expressed as;
 | (10) |
The equations can be rearranged as;
 | (11) |
Integration of the left side can be performed for the reversible coulovoltammetric charge employed during the reaction, ranging from the minimum coulovoltammetric charge (charge = 0) to the maximum charge (qR). Conversely, the right side can be integrated from the potential when the charge is zero (E0) to the potential at the maximum charge (ER).
 | (12) |
 | (13) |
The degree of a reaction is established by the quantity of redox charge expended throughout the process. Eqn (13) establishes a relationship between the consumed charge and the scan rate. When all other factors like electrolyte concentration, working temperature, atmospheric pressure, and potential window remain constant, the expansion of the reaction or the utilization of redox charge diminishes as the scan rate escalates. The constant terms in eqn (13) can be combined and represented as a new constant, denoted by h prime. By taking the logarithm of both sides of eqn (20), a linear equation can be derived.
ln![[thin space (1/6-em)]](https://www.rsc.org/images/entities/char_2009.gif) qR = x − y qR = x − y![[thin space (1/6-em)]](https://www.rsc.org/images/entities/char_2009.gif) ln ln![[thin space (1/6-em)]](https://www.rsc.org/images/entities/char_2009.gif) ν ν | (14) |
The double logarithmic association provides the gradient (y, indicating sensitivity) and the intersection point (referred to as x) of the linear equation, which can be described as follows:
 | (15) |
 | (16) |
The sensing eqn (14) establishes a relationship between the reaction extension and the scan rate, allowing for the assessment of changes in the electrical condition (scan rate) and its impact on the conformational movement of the polymer chain in the film. This observation highlights the biomimetic nature of the PEDOT electrode.
Through the utilization of the theoretical eqn (14), a fitting analysis was performed on the experimental results (Fig. 10(b)). By examining the slope (representing sensitivity) of the reaction concerning the scan rate, it becomes feasible to ascertain the rate at which the charge consumed during the reaction decreases. Additionally, the sensing eqn (14) provides support for the significant conformational changes occurring in the polymer chain within the film at lower scan rates. These changes arise due to the extended time available for the oxidation/reduction of the polymeric chains, leading to the creation/destruction of a substantial amount of free volume within the film to accommodate/expel the counter anions, respectively. Consequently, a decrease in scanning speed results in a notable increase of the redox charges.
The findings from the experiment indicate that the structural alterations of macromolecular machines during reactions result in reduced motion, shorter extension, and lower redox charge consumption at rising sweep rates.
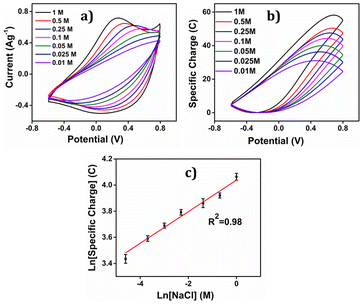
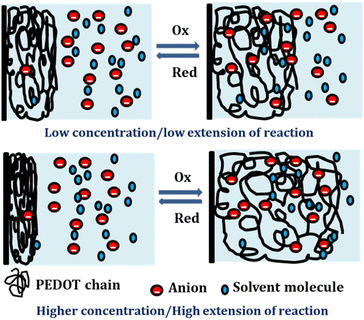
By integration of the voltammograms the coulovoltammetric responses were generated, revealing that the redox charge consumed during the reaction increases with higher electrolyte concentration (Fig. 12(b)). At higher concentrations, the polymer chain undergoes deeper oxidation within the potential window consuming more charge. The rising amount of available chemical energy drives the intercalation of more counter anions and water molecules into the polymer matrix (larger extension of reaction).
On the other hand, at lower concentrations, partial oxidation occurs, resulting in a smaller amount of free volume for the counter anions and solvent molecules to enter or exit during oxidation and reduction, respectively (smaller extension of reaction). The Fig. 13 shows the schematic representation of the extension of reaction and conformational movement during the reaction at different concentration of electrolyte. Consequently, the reaction extends further at higher concentrations compared to lower ones. The Fig. 12(c) illustrates a double logarithmic relationship between the electrolyte concentration and the consumed redox charge, demonstrating capability of the PEDOT reaction to sense, simultaneously, its chemical environment with 0.1209 cm−1 sensitivity (slope).
Consequently, the polymeric gel responds to the chemical ambient by undergoing larger conformational movements and structural changes, such as swelling or de-swelling, as higher is the ambient chemical energy, and the charge acts as a sensing parameter for monitoring these thermal changes. Therefore, the PEDOT electrode exhibits characteristics akin to biological sensing properties triggered by chemical reactions and can detect operating conditions akin to biological muscles, which are considered as sensing motors.
3.4.2.1 Theoretical description. Eqn (7) provides an alternative expression for representing the average reaction rate.
 | (17) |
Through the rearrangement of eqn (17), we obtain eqn (18), which establishes the relationship between the changes in concentration of the electrolyte and the amount of redox charge consumed during the reaction.
 | (18) |
The coefficients in eqn (18) are consolidated into a new constant, represented as k′. Upon taking the logarithm of eqn (18), a double logarithmic correlation emerges, relating the consumed redox charge during the reaction (under constant pressure, temperature, potential sweep, and scan rate) to the electrolyte concentration.
ln(q) = a + b![[thin space (1/6-em)]](https://www.rsc.org/images/entities/char_2009.gif) ln[Cl−] ln[Cl−] | (19) |
Eqn (19) portrays a direct relationship between the redox charge and the electrolyte concentration, with the parameter “a” signifying the intercept, and the slope of the line designated as “b”.
 | (20) |
 | (21) |
The observed experimental data in Fig. 12(c) fit the theoretical eqn (19). PEDOT's sensing ability is rooted in the reaction-driven conformational movements of its polymeric chain, replicating the biological muscles sensing and informing brain about the fatigue state (chemical conditions) of the muscle.
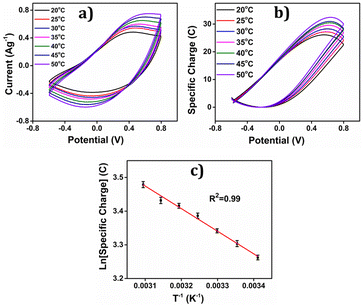
The concomitant coulovoltammogram are depicted in the Fig. 14(b). All QVs exhibited a distinctive closed loop indicating that only the reversible redox reaction of the polymer material takes place there. The redox charge consumed during the reaction, known as reaction extension, demonstrates an upward trend with increasing experimental temperature, under constant chemical, physical, and mechanical energetic conditions.
The depicted Fig. 14(c) showcases the relationship between the redox charge consumption and temperature, providing evidence that the PEDOT electrode possesses the capacity to sense the operational temperature. The empirical results strongly validate the proposed theoretical eqn (25).
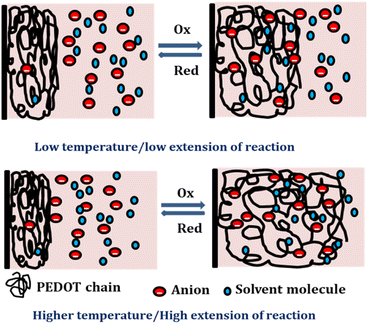
At lower temperatures, where thermal energy is limited, the reaction experiences only partial conformational relaxation, leading to a minor extension of the reaction. This is due to the limited creation of free volume for the insertion of counter anions and solvent molecules into the polymer chain, resulting in a low consumption of oxidation charge. Conversely, elevating the temperature provides more thermal energy, resulting in faster and more extensive conformational relaxation. This generates a larger free volume, enabling the insertion and ejection of anions and solvent molecules, leading to increased charge consumption during the reaction. Consequently, under identical chemical, electrical, and mechanical conditions, the reaction exhibits a greater extent at higher temperatures. Higher temperatures drive the polymer chain in the device to undergo a more profound oxidation/reduction state, yielding a larger charge. The Fig. 15 shows the extension of reaction at different working temperatures.
3.4.3.1 Theoretical description. The connection between the rate constant and the working temperature was expressed using the Arrhenius equation, which is formulated as follows:
 | (22) |
According to the theoretical approach, the polymer chains within the film are uniform in length, and during the redox process, they exchange an equal number of electrons with the background metal electrode, resulting in an identical positive charge development on each chain. The redox process involves a series of n consecutive steps, with each polymer chain exchanging one electron per step. However, the energy required to remove each electron from the chain varies, depending on the ionization potential. The total energy needed for all n steps is defined as the activation energy of the redox reaction, where A represents the pre-exponential factor, Ea represents the activation energy, R represents the universal gas constant (J mol−1 K−1), and T represents the absolute temperature (K).
In order to establish a connection between the redox charge utilized per unit mass in the PEDOT redox process and the operating temperature, we rearranged eqn (4), (5), (7) and (22), leading to the following relationship:
 | (23) |
By modifying the eqn (23) we get;
 | (24) |
To account for all the constants associated with the ionic exchange during oxidation/reduction, a novel constant h′ is introduced. This gives rise to a semi-logarithmic correlation between the specific redox charge acquired (with consistent electrolyte concentration, pressure, potential window, and scan rate) and the operational temperature.
 | (25) |
The acquired linear equation (in the y = mx + C format) offers valuable insights into the direct relationship between the redox charge and the operating temperature. The intercept and slope values are ascertained as:
 | (26) |
 | (27) |
Eqn (25) is considered the sensing equation, offering insights into the polymer chain's conformational movements triggered by the reaction. The semi-logarithmic link between the redox charge and the working temperature indicates that the charge acts as the sensing parameter. With the presence of an aqueous NaCl electrolyte, the consumed charge during the redox reaction of the PEDOT film effectively detects the available thermal energy (working temperature) with the sensitivity (slope) of −671.1401 C (T−1)−1, all while keeping the chemical (electrolyte concentration), pressure, and electrical (constant potential window with constant scan rate) conditions unchanged.
The experimental findings (red points) are juxtaposed with the theoretical equation (full line), showcasing the comparison in Fig. 14. The inclination of the linear trend in Fig. 14(c) illustrates the PEDOT electrode responsiveness to alterations in working temperature. The mean energy utilized during the reaction, while electrical, chemical, and mechanical conditions remain constant, was calculated from the redox charge consumed, as depicted in the subsequent equation:
| U = E × Q | (28) |
Elevating the temperature results in greater charge consumption and, consequently, higher reaction energy for a larger reaction extension. This suggests that the muscle reaction demands less energy at higher temperatures. This mechanism reflects how the muscle of a cold-blooded organism detects the surrounding temperature and conveys this information to the brain through variations in reaction energy at various working temperatures.
3.5 Reaction driven sensing characteristics of PEDOT towards the working ambient (electrical, chemical and thermal): chronopotentiometric investigation
PEDOT electrode's sensing capabilities during operation was further verified using chronopotentiometry. This involved applying square current waves, either anodic or cathodic, to the electrode continuously. Through this method, the rate of reaction (1) and composition of the polymer material (polymer/counter ion ratio) could be controlled through the flowing current (charge per unit of time) and the charge consumed at any time, leading to a continuous shift in the electrode's potential. Any physical or chemical alteration of the reaction ambient that influence the reaction rate would consequently impact the material's potential evolution.53,56 Thus, the PEDOT electrode exhibits the ability to detect or sense changes in its environment that affect the reaction rate, as it monitors potential fluctuations during the reaction process.The PEDOT electrode was subjected to a sequence of square current waves to assess its capability to perceive alterations in its working environment. The extent of the reaction was controlled by adjusting the duration of current flow and the amount of redox charge utilized. Before recording the chronopotentiogram, the material was stabilized by potential cycling, and data was collected from 20 consecutive voltammetric cycles. The last cycle was always interrupted at the same potential in order to get the same oxidation state of the polymer. The chronopotentiograms were measured between the same initial and final oxidation states, providing valuable insights into the electrode's response to changes in its surrounding conditions.
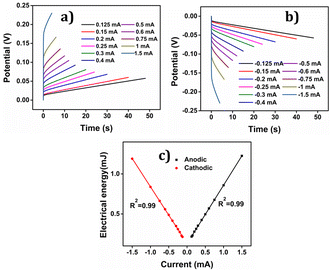
The consumed electrical energy is  , attained by integration of those responses. Notably (Fig. 16(c)), it was observed that the potential evolved during the redox process increased with higher anodic current, while a more negative potential was noted with an increased cathodic current.57 The electrical energy consumed served as the sensing parameter, as it is a linear function of both anodic and cathodic currents. This implies that the material reaction senses the applied current.
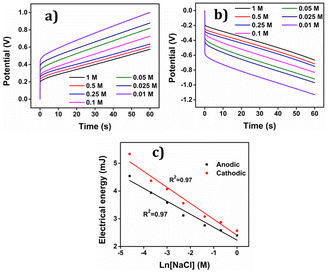
The relative variation in potential can be understood using the equation.58 In addition here higher concentrations of the electrolyte lead to enhanced reaction rates and lower reaction resistance under constant current for both the anodic and cathodic processes, resulting in a lower potential difference, Fig. 17(a) and (b). Conversely, the reaction process exhibits higher resistance when a constant current is applied, leading to an increase in potential difference at lower electrolyte concentrations.
The electrical energy consumed by the reaction, calculated by integrating the CP (chronopotentiogram) acts as the sensing parameter following, Fig. 17(c), a semi logarithmic function of the concentration, enabling the material to detect variations in concentration effectively. As indicated above oxidation and reduction reactions involving macromolecular motors are asymmetric from an energetic point of view, consuming different energies.
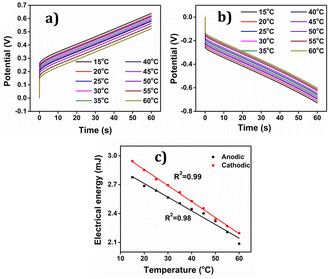
The PEDOT electrode was submitted to +0.1 mA for anodic and −0.1 mA for cathodic processes for 60 seconds each in 1 M NaCl aqueous solution at different temperatures. Results are depicted in Fig. 18(a) and (b). By integrating the chronopotentiogram, the electrical energy consumed during the reaction was determined, revealing a linear correlation: linear decrease of the reaction energy at rising temperatures as depicted in Fig. 18(c).
Again oxidation and reduction energies are asymmetric, as correspond to macromolecular motors. This correlation was further analysed using a theoretical equation for the evolved potential outside the equilibrium, as derived by Otero et al. (eqn (S7)†).
The obtained results were elucidated using the Arrhenius concept, which proposes that with increasing temperature, the polymer chain undergoes more rapid conformational movements, leading to a higher diffusion coefficient.59 Consequently, reaction (1) takes place to the same extent under a constant current (constant charge) and time, but at a reduced potential evolution, resulting in lower energy consumption as temperature rises. That means that in order to get the same reaction extension every time the conformational movements of the macromolecular motors use a higher fraction of the available thermal energy when the ambient temperature rises requiring a lower consumption of electrical energy, this fact provides a quantitative approach the behaviour of coldblooded animals: they use thermal energy from the ambient during biological functions based on macromolecular electro-chemical motors (muscles, brain functions, ionic channels in neurons).
The findings unveiled that during the anodic process, the potential evolution tends to decrease with increasing temperature, whereas for the cathodic process, the potential evolution becomes less negative as the temperature rises. This discovery indicates that PEDOT exhibits temperature sensing capability, which can prove advantageous in various applications where precise temperature control is essential.
The theoretical description of chronopotentiometric sensing ability of PEDOT is given in ESI S3.†
4 Conclusions
Poly(3,4-ethylenedioxythiophene) is a commonly utilized polymer, synthesized chemically with ammonium persulfate as the oxidant, resulting in agglomerated granular particles. The synthesized polymer is commonly subjected to characterization using FTIR, UV-Vis, FE-SEM, EDX analysis, and TGA analysis. The material's electrochemical properties are assessed through cyclic voltammetry (CV), chronopotentiometry (CP), and coulovoltammetry (QV).The cyclic voltammetry (CV) of PEDOT displays well-defined oxidation and corresponding reduction peaks. The optimization of potential window of the PEDOT during CV is essential and the effect of cathodic and anodic potential limits on the charge consumption of the polymer is also explored. Using QV we have examined the potential limits of full reversible faradaic process. A closed coulovoltammetric loop is observed within the potential range of −0.6 V to 0.8 V, indicating that only the reversible redox process occurs within this specific window in aqueous solutions.
The various structural processes (conformational process): reduction–shrinking, reduction–compaction, oxidation–relaxation and finally oxidation–swelling during the unique electrochemical reaction are demonstrated from the coulovoltammetric analysis. The slope of the QV gives different conformational process and the corresponding charges during the process were also identified. By doing so, we have aimed to present a comprehensive and insightful account of the structural electrochemistry of the PEDOT and the potential applications of this intriguing material. At potentials beyond −0.6 V, the reversible processes overlap with irreversible reduction (hydrogen evolution), while beyond 0.8 V, a parallel irreversible oxidation process takes place (oxygen evolution and polymeric over oxidation). By utilizing QV, the charges consumed during both the reversible and irreversible processes are accurately calculated, enabling a comprehensive characterization of the electrochemical behaviour of PEDOT.
The responsiveness of PEDOT-based electrodes to changes in electrical, chemical, and thermal conditions was also confirmed. The material's sensing capabilities were assessed through CV/QV and chronopotentiometry methodologies. The evolution of the material potential under flow of a constant current, chronopotentiogram, is different, responds and senses to changes in any working parameter: chemical energy (electrolyte concentration), thermal energy (temperature) or imposed electrical conditions. The electrical energy consumed during the reaction and obtained from the chronopotentiometric response, is the sensing parameter: the consumed energy decreases linearly at rising temperatures, increases linearly when the imposed current rises and decreases as a semi logarithmic function of rising electrolyte concentrations. Those experimental results were theoretically described. Whatever the used experimental methodology the oxidation energy and the reduction energy are asymmetric. Those facts indicate a possible reason for the existence of asymmetric biological functions based on the electro-chemo-mechanical actuation of proteins: muscles only work by contraction. Nature has selected and improved the most efficient, energetically, of the two (direct and reverse) reactions.
The responsive sensing ability was also confirmed through the use of voltammetric techniques: CV and QV. The charge consumed by the reaction under different working conditions (scan rate, electrolyte concentration, and working temperature) follows a double logarithmic relationship with the scan rate, or with the electrolyte concentration, and a logarithmic relationship with the inverse temperature. Those facts were described theoretically and validate that the PEDOT-based electrode can sense changes in the working variables, including electrical, chemical, and thermal conditions, using the charge as a sensing parameter.
Whatever the electrochemical methodology used to check those sensing abilities of the reaction both signal, the actuating electrical order (potential sweep or constant current) and the sensing response (consumed charge, potential evolution or consumed electrical energy) are included simultaneously in the only two connecting wires. This unparalleled fact from nowadays technologies replicates natural muscles where the actuating signal (brain order) and the sensing signals send back during muscular actuation to inform brains about the mechanical, chemical or thermal working conditions (neuronal signals) only require two neuron: motor neuron and sensing neuron.
Author contributions
Yahya A. Ismail: conceptualization, supervision, formal analysis, methodology, writing – review and editing the draft; Lijin Rajan: investigation, formal analysis, methodology, validation, writing – original draft; Madari Palliyalil Sidheekha: validation, formal analysis, writing – review and editing; Aranhikundan Shabeeba: validation, formal analysis, writing – review and editing; Toribio F. Otero: formal analysis, review and editing the draft.Conflicts of interest
There are no conflicts to declare.Acknowledgements
The authors express their gratitude to Central Sophisticated Instrumentation Facilities (CSIF), University of Calicut, Kerala, India, Sophisticated Analytical Instrumentation Facility (SAIF), IITM, India and Sophisticated Test and Instrumentation Centre (STIC), CUSAT, Kerala, India, for providing analysis resources. Lijin Rajan acknowledges Kerala State Council for Science Technology and Environment (KSCSTE), Kerala, India for their financial support via a research fellowship. M. P. Sidheekha and A. K. Shabeeba also wish to acknowledge University Grants Commission (UGC), India for providing them with a research fellowship.References
- T. F. Otero, M. Alfaro, V. Martinez, M. A. Perez and J. G. Martinez, Adv. Funct. Mater., 2013, 23, 3929–3940 CrossRef CAS.
- M. H. Doran, M. J. Rynkiewicz, D. Rasicci, S. M. Bodt, M. E. Barry, E. Bullitt, C. M. Yengo, J. R. Moore and W. Lehman, J. Gen. Physiol., 2023, 155, e202213267 CrossRef CAS PubMed.
- F. García-Córdova, L. Valero, Y. A. Ismail and T. F. Otero, J. Mater. Chem. B, 2011, 21, 17265–17272 RSC.
- T. F. Otero, J. Mater. Chem. A, 2009, 19, 681–689 RSC.
- T. F. Otero and J. G. Martinez, J. Mater. Chem. B, 2013, 1, 26–38 RSC.
- T. Otero and J. Martinez, J. Mater. Chem. B, 2016, 4, 2069–2085 RSC.
- L. Rajan, M. P. Sidheekha, A. Shabeeba and Y. A. Ismail, Mater. Chem. Front., 2022, 6, 1706–1718 RSC.
- M. P. Sidheekha, A. Shabeeba, L. Rajan, M. S. Thayyil and Y. A. Ismail, Eng. Sci., 2023, 23, 890 CAS.
- L. Rajan, A. Shabeeba, M. P. Sidheekhaa and Y. Ismail, Chem.–Asian J., 2023, e202300742 CrossRef CAS PubMed.
- G. F. Richardson, Q. Meng, S. Zhu, H.-C. Kuan and J. Ma, Nanotechnology, 2016, 27, 042001 CrossRef PubMed.
- Y. Wen and J. Xu, J. Polym. Sci., Part A: Polym. Chem., 2017, 55, 1121–1150 CrossRef CAS.
- X. Zhang, W. Yang, H. Zhang, M. Xie and X. Duan, Nanotechnol. Precis. Eng., 2021, 4, 045004 CrossRef CAS.
- J. Mathiyarasu, S. Senthilkumar, K. Phani and V. Yegnaraman, Mater. Lett., 2008, 62, 571–573 CrossRef CAS.
- M. Soni, M. Bhattacharjee, M. Ntagios and R. Dahiya, IEEE Sens. J., 2020, 20, 7525–7531 CAS.
- X. Zhang, J.-S. Lee, G. S. Lee, D.-K. Cha, M. J. Kim, D. J. Yang and S. K. Manohar, Macromolecules, 2006, 39, 470–472 CrossRef CAS.
- S. Panigrahy and B. Kandasubramanian, Eur. Polym. J., 2020, 132, 109726 CrossRef CAS.
- S.-S. Kim, J.-H. Jeon, C.-D. Kee and I.-K. Oh, Smart Mater. Struct., 2013, 22, 085026 CrossRef CAS.
- K. Rohtlaid, G. T. Nguyen, S. Ebrahimi-Takalloo, T. N. Nguyen, J. D. Madden, F. Vidal and C. Plesse, Adv. Mater. Technol., 2021, 6, 2001063 CrossRef CAS.
- I. Põldsalu, K. Rohtlaid, T. M. G. Nguyen, C. Plesse, F. Vidal, M. S. Khorram, A.-L. Peikolainen, T. Tamm and R. Kiefer, Sens. Actuators, B, 2018, 258, 1072–1079 CrossRef.
- Z. Xu, J. Song, B. Liu, S. Lv, F. Gao, X. Luo and P. Wang, Sens. Actuators, B, 2021, 348, 130674 CrossRef CAS.
- Z. Liu, L. Wu, J. Qian, J. Peng, R. Liu, Y. Xu, X. Shi, C. Qi and S. Ye, J. Electron. Mater., 2021, 50, 2356–2364 CrossRef CAS.
- C. B. Tran, T. F. Otero, J. Travas-Sejdic, Q. Bao Le and R. Kiefer, Synth. Met., 2023, 299, 117466 CrossRef CAS.
- J. Song, W. Li, K. Song, C. Qin, X. Chen, Y. Sui and Y. Ye, J. Colloid Interface Sci., 2021, 602, 251–260 CrossRef CAS PubMed.
- K. S. Ryu, Y.-G. Lee, Y.-S. Hong, Y. J. Park, X. Wu, K. M. Kim, M. G. Kang, N.-G. Park and S. H. Chang, Electrochim. Acta, 2004, 50, 843–847 CrossRef CAS.
- J. Romero, D. Rodriguez-San-Miguel, A. Ribera, R. Mas-Ballesté, T. F. Otero, I. Manet, F. Licio, G. Abellán, F. Zamora and E. Coronado, J. Mater. Chem. A, 2017, 5, 4343–4351 RSC.
- M. Wang, Q. Liu, J. Yang, K. Jiang, S. Liu, X. Che, Q. Weng, J. Wu, D. Lin and J. Qiu, Chem. Eng. J., 2023, 143801 CrossRef CAS.
- T. J. Simons, M. Salsamendi, P. C. Howlett, M. Forsyth, D. R. MacFarlane and C. Pozo-Gonzalo, ChemElectroChem, 2015, 2, 2071–2078 CrossRef CAS.
- C. V. Amanchukwu, M. Gauthier, T. P. Batcho, C. Symister, Y. Shao-Horn, J. M. D'Arcy and P. T. Hammond, J. Phys. Chem. Lett., 2016, 7, 3770–3775 CrossRef CAS PubMed.
- A. G. Guex, J. L. Puetzer, A. Armgarth, E. Littmann, E. Stavrinidou, E. P. Giannelis, G. G. Malliaras and M. M. Stevens, Acta Biomater., 2017, 62, 91–101 CrossRef CAS PubMed.
- A. Abedi, M. Hasanzadeh and L. Tayebi, Mater. Chem. Phys., 2019, 237, 121882 CrossRef CAS.
- H. Liu, D. Zhao, M. Dai, X. Zhu, F. Qu, A. Umar and X. Wu, J. Chem. Eng., 2022, 428, 131183 CrossRef CAS.
- M. P. Sidheekha, K. Nufaira, A. K. Shabeeba, L. Rajan and Y. A. Ismail, Mater. Today: Proc., 2022, 51, 2286–2292 CAS.
- L. Rajan, M. P. Sidheekha, A. Shabeeba, S. C. Unnikrishnan and Y. A. Ismail, Res. Chem. Intermed., 2022, 48, 4313–4329 CrossRef CAS.
- A. Shabeeba and Y. A. Ismail, Mater. Res. Bull., 2022, 152, 111817 CrossRef CAS.
- Y. A. Ismail, S. R. Shin, K. M. Shin, S. G. Yoon, K. Shon, S. I. Kim and S. J. Kim, Sens. Actuators, B, 2008, 129, 834–840 CrossRef CAS.
- M. Reyes-Reyes, I. Cruz-Cruz and R. López-Sandoval, J. Phys. Chem. C, 2010, 114, 20220–20224 CrossRef CAS.
- C. Kvarnström, H. Neugebauer, S. Blomquist, H. Ahonen, J. Kankare, A. Ivaska and N. Sariciftci, Synth. Met., 1999, 101, 66 CrossRef.
- S. Nešpůrek, P. Kuberský, R. Polanský, M. Trchová, J. Šebera and V. Sychrovský, Phys. Chem. Chem. Phys., 2022, 24, 541–550 RSC.
- M. R. Moraes, A. C. Alves, F. Toptan, M. S. Martins, E. M. Vieira, A. J. Paleo, A. P. Souto, W. L. Santos, M. F. Esteves and A. Zille, J. Mater. Chem. A, 2017, 5, 3807–3822 CAS.
- S.-G. Oh and S.-S. Im, Curr. Appl. Phys., 2002, 2, 273–277 CrossRef.
- K. Manivannan, M. Sivakumar, C.-C. Cheng, C.-H. Lu and J.-K. Chen, Sens. Actuators, B, 2019, 301, 127002 CrossRef CAS.
- J. Liu, B. Wei, J. D. Sloppy, L. Ouyang, C. Ni and D. C. Martin, ACS Macro Lett., 2015, 4, 897–900 CrossRef CAS PubMed.
- N. A. B. Ismail, F. Abd-Wahab and W. W. A. W. Salim, IEEE-EMBS Conference on Biomedical Engineering and Sciences (IECBES), 2018, pp. 330–335 Search PubMed.
- A. R. Hillman, S. J. Daisley and S. Bruckenstein, Electrochem. Commun., 2007, 9, 1316–1322 CrossRef CAS.
- T. F. Otero, J. G. Martinez, K. Hosaka and H. Okuzaki, J. Electroanal. Chem., 2011, 657, 23–27 CrossRef CAS.
- J. Arias-Pardilla, P. A. Giménez-Gómez, A. de la Pena, J. L. Segura and T. F. Otero, J. Mater. Chem. B, 2012, 22, 4944–4952 RSC.
- T. F. Otero and M. Caballero Romero, Polym. Int., 2010, 59, 329–336 CrossRef CAS.
- T. F. Otero, J. G. Martinez, M. Fuchiwaki and L. Valero, Adv. Funct. Mater., 2014, 24, 1265–1274 CrossRef CAS.
- J. G. Martinez, T. F. Otero and E. W. Jager, Langmuir, 2014, 30, 3894–3904 CrossRef CAS PubMed.
- T. F. Otero, RSC Adv., 2021, 11, 21489–21506 RSC.
- T. F. Otero and J. G. Martinez, Adv. Funct. Mater., 2014, 24, 1259–1264 CrossRef CAS.
- T. F. Otero, H.-J. Grande and J. Rodríguez, J. Phys. Chem. B, 1997, 101, 3688–3697 CrossRef CAS.
- Y. A. Ismail, J. G. Martínez, A. S. Al Harrasi, S. J. Kim and T. F. Otero, Sens. Actuators, B, 2011, 160, 1180–1190 CrossRef CAS.
- T. F. Otero and S. Beaumont, Sens. Actuators, B, 2018, 263, 493–501 CrossRef CAS.
- T. F. Otero and S. Beaumont, Sens. Actuators, B, 2017, 253, 958–966 CrossRef CAS.
- Y. A. Ismail, J. G. Martínez and T. F. Otero, Electrochim. Acta, 2014, 123, 501–510 CrossRef CAS.
- T. Otero and M. Cortes, Sens. Actuators, B, 2003, 96, 152–156 CrossRef CAS.
- T. Otero, J. Martinez and J. Arias-Pardilla, Electrochim. Acta, 2012, 84, 112–128 CrossRef CAS.
- T. F. Otero, J. J. Sanchez and J. G. Martinez, J. Phys. Chem. B, 2012, 116, 5279–5290 CrossRef CAS PubMed.
Footnote |
| † Electronic supplementary information (ESI) available. See DOI: https://doi.org/10.1039/d3ta07081f |
| This journal is © The Royal Society of Chemistry 2024 |

