 Open Access Article
Creative Commons Attribution 3.0 Unported Licence
Molecular and material property variations during the ideal degradation and mechanical recycling of PET
Chiara
Fiorillo
ab,
Lynn
Trossaert
ab,
Erion
Bezeraj
a,
Simon
Debrie
a,
Hannelore
Ohnmacht
a,
Paul H. M.
Van Steenberge
 b,
Dagmar R.
D'hooge
 *bc and
Mariya
Edeleva
 *a
*a
aCentre for Polymer Material and Technologies (CPMT), Technologiepark 130, 9052 Zwijnaarde, Belgium. E-mail: mariya.edeleva@ugent.be
bLaboratory for Chemical Technology (LCT), Technologiepark 125, 9052 Zwijnaarde, Belgium. E-mail: dagmar.dhooge@ugent.be
cCentre for Textile Science and Engineering (CTSE), Technologiepark 70a, 9052 Zwijnaarde, Belgium
First published on 11th September 2024
Abstract
Poly(ethylene terephthalate) (PET) is an important polyester utilized for a wide variety of applications such as in the manufacturing of bottles, fibers and engineering compositions. Its chemical composition depends on the use of main monomers (e.g. terephthalic acid and ethylene glycol) and comonomers (e.g. diethylene glycol and isophthalic acid) at low concentrations, defining several reaction pathways upon its degradation or (mechanical) recycling. The present work provides a detailed overview of these molecular pathways, differentiating among thermal, thermo-mechanical, thermo-oxidative, photo-oxidative, hydrolytic and enzymatic degradation reactions. Considering the lowest contaminant amount, under ideal (mechanical) recycling (lab) conditions, a wide range of functional group variations has already been revealed, specifically during consecutive polyester processing cycles. Moreover, as a key novelty, how molecular variations influence material behavior is explained, considering rheological, thermal and mechanical properties. Supported by basic life cycle analysis, it is highlighted that our future improved assessment of the mechanical recycling potential of PET must better link the molecular and material scales. Only this linkage will open the door to a well-balanced polyester waste strategy, including (i) the evaluation of the most suitable recycling technology at the industrial scale, dealing with the mitigation of contaminants, and (ii) its further adoption and design in the context of overall virgin and recycling market variation.
Sustainability spotlightA key consumer product in our society is PET bottles, for which long-term circularity via polyester recycling is within reach (UN SDG 12). However, with more generations of waste being created, it is unclear when which recycling technology is the most suitable (UN SDG 9 and 13), specifically for how long mechanical recycling is a preferred technique. The current review puts forward how the quality of polyester-based materials depends on their molecular changes, demonstrating that the connection between the molecular and material scales is paramount in future R&D and product design. Consequently, better guidelines can be formulated regarding the ideal PET recycling route and industrial implementation, considering regulations and geographical constraints. |
Introduction
Poly(ethylene terephthalate) (PET) is a thermoplastic polymer belonging to the polyester family. It is used for applications such as synthetic fibers; beverage, food and liquid containers, in general, packaging; thermoformed shape production; and engineering resins often in combination with glass fibers. Packaging, in particular beverage packaging, is likely the most important application of PET, with a current market size larger than $20 billion,1 where plastic bottles account for more than 80%. Furthermore, the global PET bottle market is expected to be worth around $35.7 billion by 2032, growing at an annual growth rate (CAGR) of 3.3% during the forecast period from 2024 to 2032.2In its simplest form, only two monomers are employed for the synthesis of PET.3,4 These monomers include terephthalic acid (TPA), or its counterpart dimethyl terephthalate (DMT), and ethylene glycol (EG), as depicted in the left part of Fig. 1. The reactions taking place are polycondensation reactions, releasing small molecules such as water or methanol as byproducts, considering at first sight equimolar amounts of monomers.5 Practically, volatility issues can be encountered but PET with a high average chain length is commercially required,6–8 implying deviations from natural stoichiometric balance. Moreover, an injection-molded PET grade (e.g. bottle-grade PET; PET-btg)5 needs to be synthesized employing low concentrations of comonomers alongside the aforementioned traditional (main) monomers. As shown in the right part of Fig. 1, typical comonomers are diethylene glycol (DEG), isophthalic acid (IPA), trimethylolpropane (TMP), and cyclohexanedimethylene glycol or 1,4-cyclohexanedimethanol (CHDM).9,10 DEG is the main comonomer used in the production of PET-btg and its ether groups provide more flexibility to the otherwise relatively stiff conventional backbone. Depending on the polymerization conditions, the concentration of DEG monomer units in the final polymer application changes from 1 to 4 mol%.11
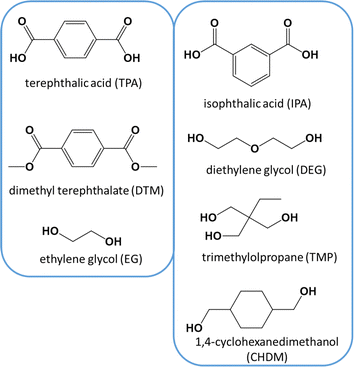 | ||
| Fig. 1 Left: conventional monomers for PET synthesis. Right: typical comonomers used in low amounts (e.g. few mass%) to enable the production of bottle-grade PET (PET-btg). | ||
The presence of comonomers decreases the thermal crystallization rate and improves the ductility,11 processability and clarity of modified PET compared to conventional PET.5,12–15 The lowering of the crystallinity is important to easily avoid further production challenges regarding shrinkage and warpage.16 For example, this can be further exploited in additive manufacturing applications, as exemplified by the copolyester polyethylene terephthalate glycol (PETG), which is synthesized using a significant molar amount of CHDM (up to 50%) in the presence of EG and DMT.17
One of the greatest challenges encountered in the PET industry is the efficient incorporation of its own waste in the value chain for many decades to come, guaranteeing an acceptable product quality at any time. Thus, governments are taking a leading role in setting recycling boundaries, e.g. the environmental rules of the European Commission demanding that PET-based packaging materials need to include 30% of recycled plastics by 2030.18 Recycling of PET has been industrially realized but with an increase in the circular usage of PET (bottles), the composition of the PET waste stream will change in a very dynamic manner, which will be further influenced by the local collection methods, sorting strategies and process efficiencies.19 Thus, it is paramount to evaluate which recycling technology and/or operating settings are the most suitable during a non-trivial feedstock variation for a given geographical location.
Parallel to changing regulations, societal pressure exists for the polymer production community to become more sustainable and deliver circular innovative polymeric materials. According to the Organization for Economic Cooperation and Development (OECD), in 2022, only ca. 10% of plastic waste was recycled, while (i) worldwide polymer production doubled in the last decade (to ca. 350 Mt in 2019) and (ii) ca. 66% of the produced plastics had a use lifetime of less than 5 years, specifically packaging items.20 The majority of plastic waste still ends up in landfill, is incinerated or unfortunately leaks into the environment.21 Interestingly, the global polymer production originating from recycled or secondary sources is becoming more relevant, with a reported increase from ca. 7 to 30 Mt from 2000 to 2019. However, the market share for these recycled products is still below 10%, showcasing the relevance of recycling research and design. In any case, it is advisable to work on a worldwide waste management plan, including dedicated and durable investments in waste management infrastructure.20
It is particularly critical to compare polymer recycling technologies and define criteria allowing a fair judgment of the preferred technology in a given geographical area, considering regulations and future intentions in view of scale-up and technology improvement. Notably, for PET streams, both mechanical and chemical recycling technologies have already been developed and adjusted.22,23 For example, re-melting through extrusion, and hence mechanical recycling technology was originally implemented in the absence of additives; however, to counteract discoloration and molecular changes, complementary color agents, inorganic substances and chain extenders were later added.24 More recently, it has been put forward that a vacuum solid-state pre-reactor enables the better decontamination and crystallization of flakes before performing the actual re-melting.25 Next to crushed PET waste mixing for filler replacement, incinerating PET waste for direct energy recovery (ca. 45 kJ g−1), and PET waste pyrolysis for indirect energy recovery (e.g. fuels),26,27 chemical technology has been developed to exploit the reverse nature of polycondensation reactions by adding in excess the solvent that was a byproduct from the synthesis to induce depolymerization.28 For these depolymerization technologies that aim to use high yield monomers and form oligomers, a distinction can be made between hydrolysis (use of water),29 glycolysis (use of glycol),30 and alcoholysis (use of alcohol).31 However, stringent reactor conditions (e.g. high temperature and pressure) and dedicated separation techniques are needed. In parallel, physical recycling through dissolution and extraction has been developed.28,32
Mechanical recycling is a lower energy process compared to chemical recycling but it requires clean inputs, and after multiple cycles, the polyester may degrade, which may limit its fitness for use in certain applications, while chemical recycling can handle hard to recycle inputs and provides a virgin quality material as an output.19,33 For example, it has been indicated that the material properties of PET post-consumer-waste (PCW) as flakes should obey the requirements specified in Table 1. Besides requirements for molecular driven properties such as the intrinsic viscosity ([η]; also known as IV) and the melting temperature (Tm), care should be taken regarding acceptable contamination levels in the processed flakes.19 As shown in Table 1, process contaminants such as water need to be avoided by drying, although some industrial cases operate in the presence of water, which allows molecular-scale degradation by hydrolysis, then the chains are later repaired in the production train. Hence, it is critical to understand the molecular-scale driven changes during PET mechanical recycling, which are less explored in detail in previous work.
| Property | Value |
|---|---|
| Intrinsic viscosity, [η] | >0.7 dL g−1 |
| Melting temperature, Tm | >240 °C |
| Water content | <0.02 wt% |
| Flake size, D | 0.4 mm < D < 8 mm |
| Dye content | <10 ppm |
| Yellowing index | <20 |
| Metal content | <3 ppm |
| Poly(vinyl chloride) content | <50 ppm |
| Polyolefin content | <10 ppm |
The primary differences between the composition of post-industrial waste (PIW) and PCW, with respect to virgin PET, are the source of the waste and the level of contamination. PIW comes from manufacturing processes, and generally is clean and easily recyclable, whereas PCW originates from products used by individuals and can be more contaminated and challenging to recycle. This is because in PCW PET, dirt, labels, glue, other polymers and various small molecule contaminants are present, which are associated with the packaging, bottles and other applications in which the PET material has been used.34
In the present contribution, starting from a discussion of the expected chemical building blocks incorporated during the synthesis of PET, in the first part, we present an overview of the variations in the molecular properties during PET mechanical recycling. This is done assuming that the contamination amount is low, and in many cases even negligible, and hence the ideal (lab) mechanical recycling conditions are included. A distinction is made in this first part among the thermal, thermo-oxidative, photo-oxidative, hydrolytic and enzymatic (degradation) reactions, including a discussion of the literature data on their kinetic parameters, specifically their (overall/lumped) degradation rate coefficients. For the interpretation of the impact of the molecular properties on the material properties, as covered in a second part of this contribution, the emphasis is on the variations in rheological, thermal and mechanical properties, as induced by environmental exposure during use and/or by mechanical recycling.
By connecting the discussion in the second part to the first part, a framework is set to facilitate answering two major questions of relevance for the PET recycling community and regulation authorities, as follows: (i) how does the recycling of PET influence the (packaging) material properties due to (macro)molecular changes and (ii) how can we achieve an acceptable (mechanical) performance by PET products that contain recycled PET (rPET)?
The novelty of this review is that it provides a perspective on PET (mechanical) recycling on both the molecular and material scales and connects both. This is different to most other PET-based reviews, which (i) only dealt with the overall chemical modification and main operational units of the manufacturing steps,31,35–38 (ii) from a fundamental point of view, only focused on less industrially mature (enzymatic-based) molecular alternations but not material properties,39 and (iii) oriented more towards molecular design for chemical recycling purposes.40
This connection of molecular and material variations for PET mechanical recycling goes hand in hand with further understanding the chemistry behind the original polyester; in general, polymer synthesis. This synthesis is only treated in more material-driven approaches to a limited extend, for instance, by a (indirect) average molar mass assessment only.41,42 It should be stressed that chain repair, being a key mitigation in the PET mechanical recycling industry, depends on having the correct functional groups and chain lengths. Specifically, the science-driven evaluation of mechanical recycling techniques needs to account for sufficiently detailed (degradation) reaction schemes.
For comparison, the results on one of the most other studied polyesters, i.e. poly(lactic acid) (PLA), as well as on conceptually related thermoplastic vinyl polymers such as polystyrene (PS) and acrylonitrile butadiene styrene polymer (ABS) are included. Guidelines are also provided to better identify threshold and boundary values for PET mechanical recycling constraints and support strategic finetuning of PET recycling policies.
The present contribution will be followed by a second contribution dealing with the industrial details of the overall PET mechanical recycling process. In that contribution, the industrial challenges compared to ideal (lab) mechanical recycling are addressed, with a specific focus on the expected degree of contamination and typical mitigation strategies together with the production chain and detailed life cycle assessment (LCA) analysis. This second contribution will target state-of-the-art insights on the impact of industrial contaminants on the most important relationships between molecular and material property variations as established in the present contribution, which is already supported by more basic LCA analysis addressing the overall numbers in carbon footprint and E-factor.
Synthesis routes and commercial grades
In line with general step-growth polymerization principles and as outlined in Fig. 2 (top), conventional PET is obtained via the esterification reaction between EG and TPA with water as a by-product. Alternatively, this transesterification reaction can be realized by reacting EG and DMT, releasing methanol as a byproduct (Fig. 2; bottom). | ||
| Fig. 2 Basic reaction scheme for the conventional synthesis of PET, either via the polycondensation of EG and TPA (top) or EG and DMT (bottom) from Fig. 1. | ||
However, a chemical challenge is the reversibility of the reaction and the difficult byproduct removal.35,43 Industrially, a three-stage synthesis is applied with the main reactions in each stage depicted in the top part of Fig. 3 (only TPA-EG route shown to not overload the subplot) and the associated (continuous) reactor configuration is included in the bottom part of the same figure.
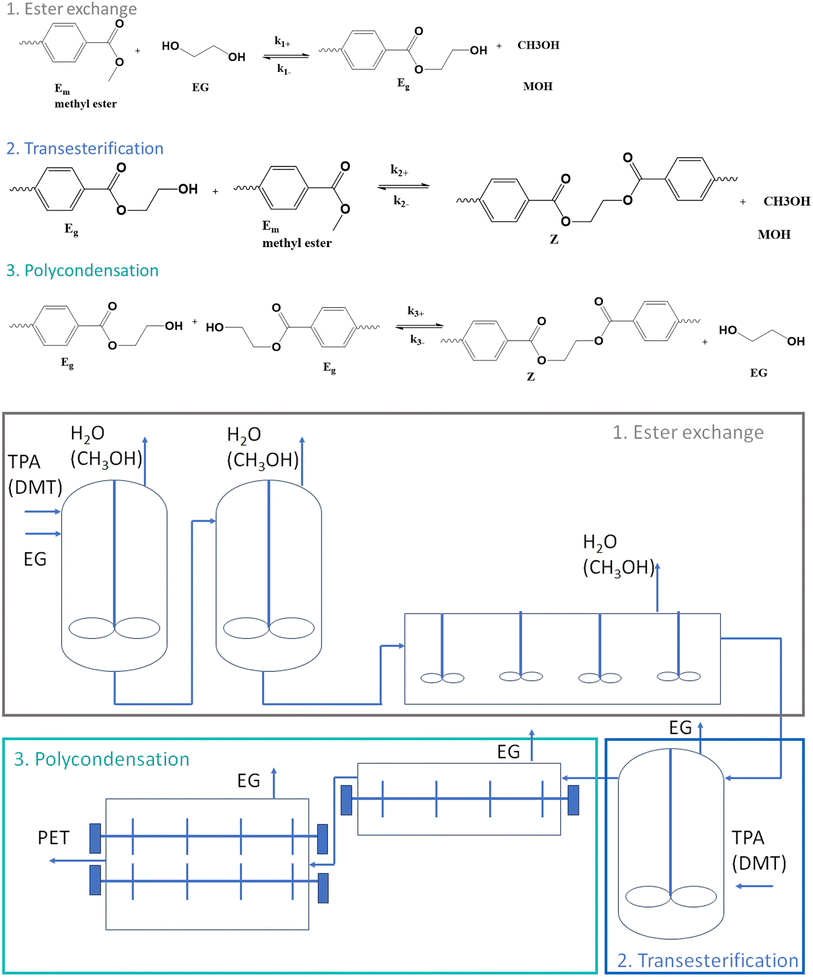 | ||
| Fig. 3 Industrial implementation of PET synthesis, starting either from EG and TPA or EG and DMT from Fig. 1, according to three stages with the top, the main reactions in each stage, and at the bottom, the associated continuous reactor configuration; k(–)i values are rate coefficients for stage i with kinetic equations depicted in Fig. 4 also accounting for mass transfer (kL). | ||
In the first stage of the commercial implementation,8 which is known as esterification, TPA (or DMT) is reacted with an excess amount of EG to obtain bishydroxyethyl terephthalate (BHET) and possibly some oligomers. Mostly, a metal acetate catalyst is employed such as zinc acetate. A temperature of 160–180 °C is applied for several hours, and in a reflux column the condensation product water (or methanol) is separated from EG, while additives and stabilizers are also utilized in the reactor.44
In the second stage of the commercial implementation, the BHET-rich mixture exiting the first reactor reaches a superfine filter to remove residues related to the additives. Subsequently, pre-polymerization takes place under vacuum at a higher temperature of about 270 °C, defining the so-called transesterification stage. EG is removed by a vacuum pump, while the polymer product is pumped to finishing reactors after a residence time of about two hours, defining the third stage typically denoted as polycondensation.
This last stage of the commercial implementation in Fig. 3 is considered to increase the number average chain length xn, e.g. from 30 to 80.8 A large surface area is needed to remove EG from the viscous melt, with the typical reactors being rotating disk, extruders, and cage reactors. If the xn of the conventional PET needs to be, e.g. above 100, solid-state polymerization (SSP) can be additionally applied in a fourth stage of the industrial implementation. Sintering of PET particles can be prevented in this stage by selecting a sufficiently high reaction time for crystallization through prior annealing.45–48
In any case, kinetic modeling can facilitate the reaction progress efficiency in each stage, as conceptually highlighted in Fig. 4, showcasing the differential equations to calculate the variations in functional group concentrations according to the reactions in Fig. 3. This is done accounting for volume (V) variations and byproduct removal considering the mass transfer coefficients (kL values). In the case of the latter coefficients, correlations can be utilized depending on the reactor geometry, reaction system and agitation type or in general more fundamental theories can be considered, which have a direct link, e.g. the Flory–Huggins theory.8
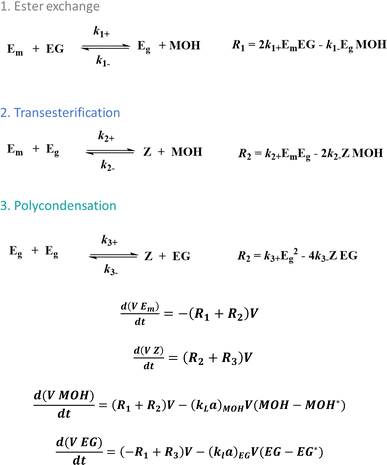 | ||
| Fig. 4 Kinetic modeling principles to describe and tune PET synthesis according to the reactions in Fig. 3 (calculation of reaction rates Ri). Functional group modeling is applied with kL being the mass transfer coefficient, a the mass transfer area and V the volume. | ||
Modified PET is synthesized in a similar way as depicted in Fig. 3 but other types and/or ratios of reactants are employed, consistent with the chemical structures introduced in the right part of Fig. 1. An overview of the typical PET commercial grades for given applications is included in Table 2, distinguishing between the (co)monomers, additives and targeted number average molar masses (Mn values).
| Grade | (Co)monomers | Comonomer% | M n (g mol−1) | Common additives | Applications | References |
|---|---|---|---|---|---|---|
| (v)PET | EG, TPA/DMT | n.a. | 17.600–52.300 | depending on application | Disposable beverage bottles, packaging, textile fiber production, films | 49–53 |
| rPET | EG, TPA/DMT | n.a. | 5.000–35.000 | Thermal stabilizers, antioxidant | Textile production, fiber applications | 49, 52 and 54–59 |
| PET foam | EG, TPA/DMT | n.a. | 22.390–23.159 | Blowing agents, flame retardant | Building and construction, composites | 8, 49 and 60–62 |
| PETG | EG, TPA/DMT, CHDM | Up to 50 mol% CHDM | 27.300–33.200 | Fibers, glass/carbon | 3D printing, packaging | 63–70 |
| PBT | TPA/DMT, 1, 4-butanediol | <5 mol% total diol | 5.000–45.000 | Pigments, minerals, fillers, flame retardants, fibers | Electrical engineering/electronics, vehicle manufacturing, household goods | 8 and 71–74 |
| PCTA | TPA, IPA, CHDM | <20 mol% total diacid | — | — | Optical applications | 72 and 75 |
| PTT | TPA, 1,3-propane-diol, DEG | <5 mol% total diol | — | — | Textile fibers | 72, 76 and 77 |
The incorporation of comonomer units can significantly change the thermal stability of PET. Given that conventionally Tm and the glass transition temperature (Tg) are about 260 °C and 78 °C, respectively, a modified PET with a somewhat lower Tm and a moderately higher Tg would result in easier and cheaper processing and make PET more suitable for higher temperature applications such as packaging of hot-filled products. Furthermore, the ability to synthesize PET with a weaker tendency to crystallize by adding comonomers increases its ductility range for applications, with important related reviews reported by Kint and Munoz-Guerra,78 Demirel et al.,79 Pang et al.,80 and Konstantopoulou et al.81
A key example is the use of the bulky CHDM unit, enabling a highly amorphous structure and transparency specifically for high molar amounts (e.g. 50%) as in PETG. The incorporation of 1,4-cyclohexylene units compared to the linear EG units delivers a higher Tm value, which is critical to certain applications; however, it also introduces potential thermal degradation issues during processing. The initial commercialization target for PETG was extrusion blow moulding; however, its greatest success has been found in extruded sheets, in which its combination of excellent clarity, chemical resistance, and toughness is important. PETG has also gained interest because of its ease of use in 3D printing.82 Furthermore, the modification of crystallinity in CHDM-modified PET (PCT) with IPA is the basis of the PCTA family. This family of copolyesters based on CHDM and 2,2,4,4-tetramethyl-1,3-cyclobutanediol (TMCD) as diols has an important practical feature of improved resistance to hydrolysis upon melt processing,83 meaning that these copolyesters need less drying prior to processing.16,84
Molecular degradation reactions and variations in chemical functional groups
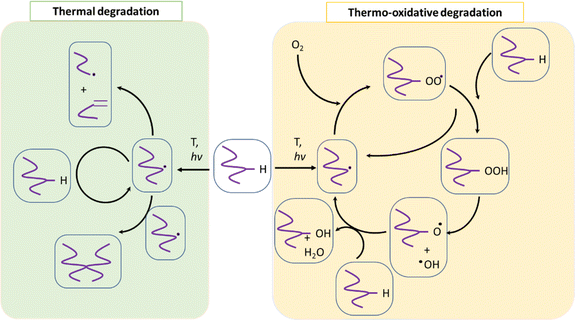
PET (waste) can undergo several types of degradation reactions depending on the external conditions such as temperature, mechanical forces, UV intensity, and the presence of small species, for instance, water, ionic, and oxygen molecules. Specifically, UV light from the sun provides energy to facilitate the incorporation of (extra) oxygen atoms into the chains, which can cause the polymer to become more brittle.85–87 Consistent with most studies regarding (vinyl) polymer stability, in the case of PET, the emphasis has been understanding its thermal and thermo-oxidative degradation, in which the main reactions considering a general “purple” chain are depicted in Fig. 5.The reaction starting the degradation in Fig. 5 is a temperature (T)-driven hydrogen (H) abstraction, delivering a (mid-chain) radical, and the follow-up reactions result in double bound formation, crosslinking or the incorporation of oxygen-derived functional groups. Because of the screw activity or UV contact with energy hν, where h is the Planck constant and ν is frequency, more radicals can be even formed at a given T, and thus the overall degradation rate increases. Specifically, for PET, the presence of ester linkages makes hydrolytic and enzymatic degradation possible. Many authors88–90 put forward that short oligomers with carboxylic and unsaturated ester end groups are particularly formed due to the specific role of intramolecular exchange reactions in the primary PET thermal degradation. Thus, mapping the balance between the inter- and intramolecular degradation reactions can be kinetically relevant. In general, during PET mechanical recycling, it is necessary to track the variations in chain length and chemical functional groups, where the latter can enable chain repair if they are reactive enough under the polymerization conditions.
In the following section, an overview is given of the reported thermal degradation, thermo-mechanical, thermo-oxidative, photo-oxidative, hydrolytic and enzymatic degradation reactions, with a key focus on PET as the substrate. This summary is accompanied by details of the relevant functional groups and experimental techniques to pinpoint the main molecular parameters and a summary of the typical (apparent) rate coefficients (or kinetic parameters) reported in the literature.
Thermal degradation
The pioneering work on PET thermal degradation was reported by Marshall and Todd91 at temperatures between 282 °C and 320 °C. These authors concluded that chain scission, which has been also denoted as fission,92,93 takes place with an overall activation energy of 133.9 kJ mol−1. Foti et al.94 and Luderwald95 confirmed the results reported by Marshall and Todd91 by conducting PET pyrolysis experiments above 200 °C, also performing analysis of the degradation products via mass spectrometry. They reported that poly(alkylene terephthalates) are preferentially degraded by cleavage of their ester bond. Correspondingly, Yoda et al.96 investigated thermal degradation of PET at temperatures between 263 °C and 300 °C, showcasing that under nitrogen purging, crosslinking can be neglected, whereas in air, both scission and crosslinking can occur.Most studies on PET thermal degradation propose that first the scission of the ester group (–C(O)–O–CH2–) occurs, delivering –C(O)–O* and *CH2– radicals. As shown in the top part of Fig. 6 (m = 2), subsequent disproportionation or βH-abstraction97 results in the formation of a chain fragment with a hydroxyl functional end group and another chain fragment with a alkene functional end group. Alternatively, (β)H-abstractions with other molecules can deliver the same end groups.
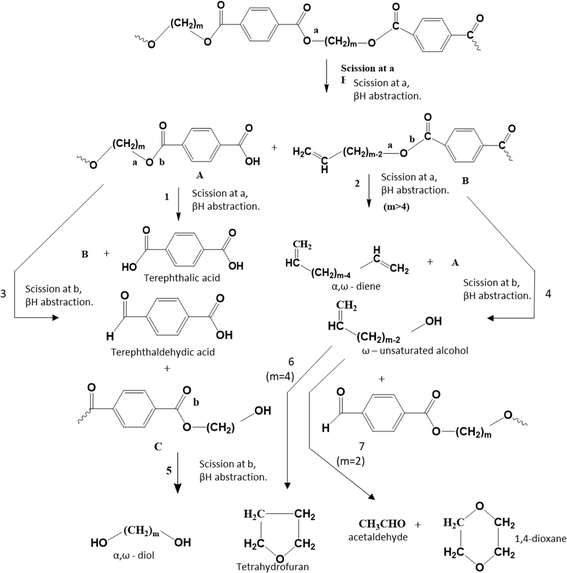 | ||
| Fig. 6 Thermal degradation reaction pathways for poly(alkylene terephthalate)s: ester scission (or fission) driven. Additional reaction pathways in Fig. 7 and 8. Figure is made based on the reactions proposed by McNeill and M. Bounekhel.97 | ||
Based on thermogravimetry and thermal volatilization analysis, McNeill and M. Bounekhel97 put forward several combined scission and (β)H-abstraction pathways for poly(alkylene terephthalate) thermal degradation characterized by a general m (≥2), as highlighted in the middle and bottom part of Fig. 6. These authors identified seven main reaction pathways. However, in the case of PET (m = 2), diene formation (reaction pathway 2) is impossible and reaction pathway 4, formally producing vinyl alcohol, leads in practice to acetaldehyde formation via fast reaction pathway 7.
In parallel with the ester scission-based reactions in Fig. 6, decarboxylation reactions can take place, yielding various products, as depicted in Fig. 7. Here, scission occurs at positions “a” and “c” toward carbon dioxide (CO2) formation, or at positions “b” and “c” toward carbon oxide (CO) formation.
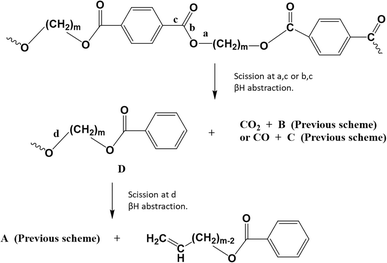 | ||
| Fig. 7 Thermal degradation reaction pathways for poly(alkylene terephthalate)s: carboxylation driven. Additional reaction pathways in Fig. 6 and 8. Figure is made based on the reactions proposed by McNeill and M. Bounekhel.97 | ||
It should be noted that the reaction pathways in Fig. 6 and 7 rely on homolytic cleavage of bonds, given that it is assumed to occur in most polymer systems, specifically for temperatures above 300 °C. Zimmermann et al.90 postulated that homolysis is not the main chain scission process, given that PET degradation is not inhibited by free radical trapping reagents. This observation triggered the use of more precise analytical techniques to enable a deeper mapping of the spectrum of degradation products.
Particularly, Montaudo et al.98 highlighted that cyclic compounds can be formed during PET thermal degradation in the absence of radical formation, as displayed in Fig. 8 (top). These authors put forward that ionic intramolecular exchange takes place as a cleavage process, followed by a βH-abstraction reaction to generate a series of non-cyclic oligomers. The likelihood of the ionic nature of this cyclization-based mechanism has been supported by the observation that the presence of acids increases the degradation rate but does not alter the degradation product types.
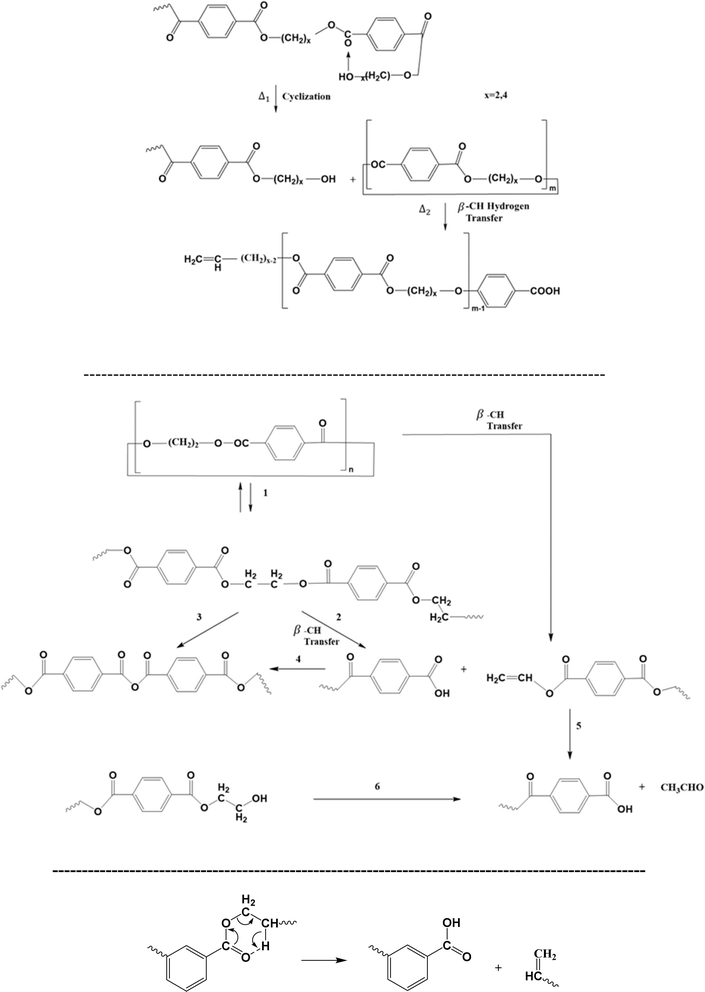 | ||
| Fig. 8 Additional thermal degradation reaction pathways for poly(alkylene terephthalate)s: cyclization-driven (end-group) attack: top (ionic); middle: alternative representation; bottom: ester rearrangement; additional reaction pathways in Fig. 6 and 7. Figure is made based on the reactions proposed in ref. 97–100. | ||
The relevance of cyclic structures has also been indicated by Samperi et al.,99 who focused on the degradation of poly(alkylene terephthalate)s at higher processing temperatures between 270 °C and 370 °C. They highlighted the formation of cyclic oligomers and their further degradation according to the reactions reported in Fig. 8 (middle). Specifically, additional reactions toward the formation of the small (volatile) molecule acetaldehyde have been proposed. In general, the study of volatiles is key for poly(alkylene terephthalate) thermal degradation, where Fig. 6 (bottom) shows the formation of the volatile small molecules tetrahydrofuran (THF), acetaldehyde and 1,4-dioxane.99 Moreover, ester rearrangement, as included in Fig. 8 (bottom), has been proposed by Assadi et al.100
Notably, the Fourier transform infrared spectroscopic (FTIR) study by Holland and Hay101 revealed the presence of polyaromatic compounds during thermal degradation in the higher temperature range of 200 °C to 370 °C. An overview of the typical PET labeling using FTIR is included in Table 3. Holland and Hay101 proposed a series of reactions to explain the formation of these compounds, with examples depicted in Fig. 9.
| Wavenumber (cm−1) | Assignment |
|---|---|
| 3535 | Absorbed moisture |
| 3440 | O–H stretching of diethylene glycol end-group |
| 3060 | Aromatic C–H stretching |
| 2960, 2880 | Aliphatic C–H stretching |
| 1950 | Aromatic summation band |
| 1720 | Carbonyl C![[double bond, length as m-dash]](https://www.rsc.org/images/entities/char_e001.gif) O stretching O stretching |
| 1615, 1450, 1430, 1410 | Aromatic skeletal stretching bands |
| 1950 | Aromatic summation band |
| 1720 | Carbonyl C![[double bond, length as m-dash]](https://www.rsc.org/images/entities/char_e001.gif) O stretching O stretching |
| 1615, 1450, 1430, 1430 | Aromatic skeletal stretching bands |
| 1465 | –CH2– deformation band |
| 1270 | C(![[double bond, length as m-dash]](https://www.rsc.org/images/entities/char_e001.gif) O)–O stretching of ester group O)–O stretching of ester group |
| 1175, 1120 and 1020 | Bands in the skeletal ring region are indicative of aromatic substitution pattern, and indicates 1,4-substitution |
| 980 | O–CH2 stretching of ethylene glycol segment |
| 850 | C–H deformation of two adjacent coupled hydrogens on an aromatic ring |
| 730 | Associated with the out of plane deformation of the two carbonyl substituents on the aromatic ring |
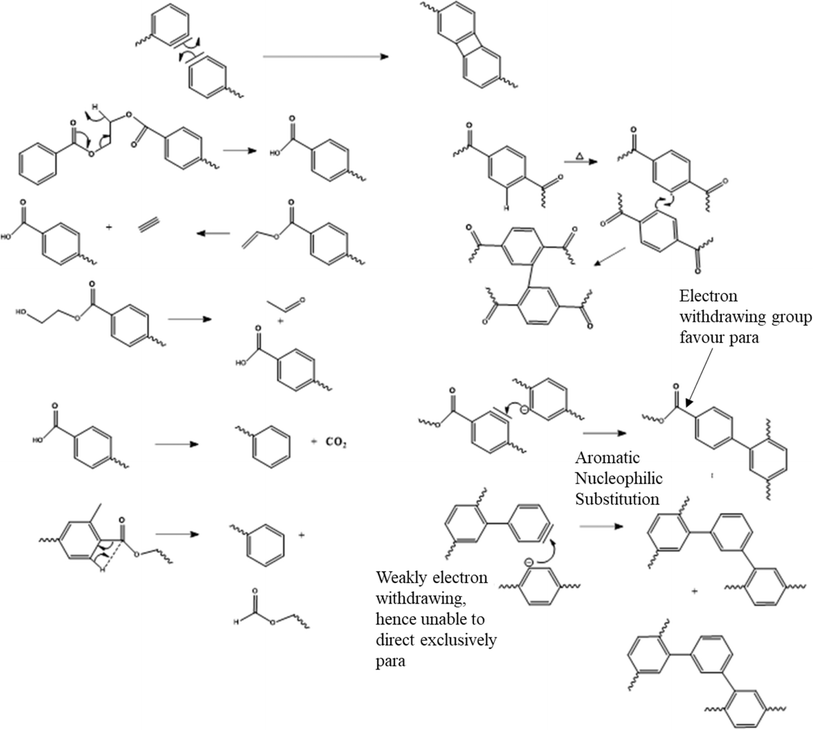 | ||
| Fig. 9 Additional proposed thermal degradation pathways for poly(alkylene terephthalate)s at very high temperatures toward polyaromatics. Main reaction pathways in Fig. 6–8. Figure is made based on reactions of the work by Holland and Hay.101 | ||
However, it should be mentioned that in certain cases, energetically unlikely transition states and chemical intermediates have been proposed. Thus, the formation of polyaromatics still needs to be further investigated, which is outside the scope of PET mechanical recycling studies and design under industrially relevant conditions.
Holland and Hay101 further highlighted that the DEG and IPA comonomer units promote thermal degradation through increased chain flexibility and the presence of more favorable bond angles, respectively. Romao et al.102 found similar results when DEG was used as a comonomer for the production of PET-btg, stating that the DEG unit is formally a reactive site in PET-btg thermal degradation.
The impact of thermal degradation also becomes more evident in the case PET is processed multiple times. More oligomers and volatile compounds are produced if PET is held for a longer time above its melting temperature, contributing to a lowering of its (number) average molar mass.103–105 It should be noted that for the direct measurement of this variation, average gel permeation chromatography (GPC), which is also known as size exclusion chromatography (SEC), is the most recommended. However, polyesters are difficult to solubilize, given that their high crystallinity and strong polar interactions require aggressive analysis solvents and elevated analysis temperatures. PET has been analyzed in 1,1,1,3,3,3-hexafluoroisopropanol (HFIP), a polar organic solvent, considering the addition of sodium trifluoroacetate to prevent its aggregation. Alternatively, o-chlorophenol has been applied, which under normal conditions is a viscous solvent, practically requiring analysis at elevated temperature (e.g. 110 °C) as well as careful handling given that it is a hazardous substance. A solvent mixture of chloroform and hexafluoroisopropanol106 (98 vs. 2 vol%) has also been applied, including UV detection and conventional calibration.
Parallel with chain length (molar mass) investigations via GPC, specifically considering different passes, one can perform end group analysis, focusing on the formation (or disappearance) of a specific functional group to assess the intensity of the ongoing thermal degradation. For example, Spinace and De Paoli105 found that the concentration of carboxylic end groups increases almost linearly with the number of processing cycles, changing from 36 eq. per 106 g for virgin PET to 100 eq. per 106 g after five cycles, as shown in Fig. 10.
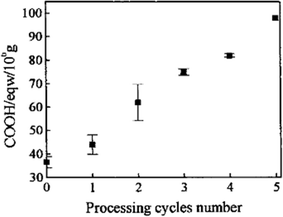 | ||
| Fig. 10 Variation in the carboxylic end group concentration as a function of the number of processing cycles for PET thermal degradation.105 Reproduced with permission from the publisher John Wiley & Sons. | ||
Thermomechanical degradation
In extrusion-based mechanical recycling, high shear forces are applied to a polymer melt, which can lead to shear-induced chain scission.107 An elevated temperature is used to realize this melt situation, and thus practically thermomechanical degradation reactions need to be considered. Compared to purely thermal degradation reactions, these thermomechanical reactions result in the formation of extra radical types or at least in an increase in the radical concentration(s).108,109This implies that more molecular changes are manifested compared to the pure thermal degradation case but to a first approximation, the same set of reactions as in the previous section occurs with additional mechanical forces.110–112 From a practical point of view, in modeling studies, the Arrhenius-like behavior of thermal degradation needs to be mathematically extended to account for these forces.113 Specifically, for larger chains and under more concentrated conditions, a mechanical action stress can be formally included.
Polymer chains that are subjected to shear stress can be both stretched and compressed simultaneously. As explained by Bueche114 and illustrated in Fig. 11a, an isolated chain stretches in the OO’ direction and compresses in the II’ direction upon applying shear. No rupture is expected as the movement is oscillatory, with chain rotation due to shear causing the chain part that was first compressed to be stretched later on and vice versa. In contrast, for concentrated polymer systems, the entanglements between chains play a critical role. As shown in Fig. 11b, for one chain to be stretched, it first needs to be liberated from these entanglements. This interactive phenomenon generates stress points, which even at very low shear rates can lead to shear-induced degradation.
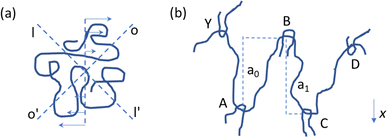 | ||
| Fig. 11 Conceptual illustration of why melts are prone to thermomechanical degradation, with an isolated polymer chain under shear flow (a) having flexibility and a chain having entanglements in the melt ((b); concentrated cases), experiencing stress points for shear-induced breakage.114 | ||
Regarding the understanding and quantifying of the thermomechanical degradation kinetics, most attention has been paid to polyolefin degradation. For example, Oblak et al.110 deduced that the reprocessing of high density polyethylene (HDPE) leads to molecular changes via competitive chemical reactions, including mechanical contributions. These authors observed a peak for the pressure and torque with an increase in the number of recycling cycles, as shown in Fig. 12. The initial increase for both properties was associated with dominant crosslinking, implying a reduced flowability, whereas the decrease in these properties at more recycling cycles was linked to dominant chain fission.
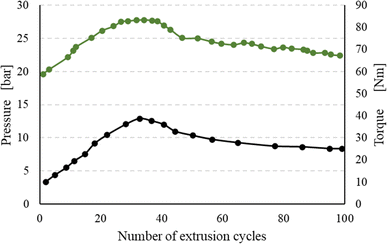 | ||
| Fig. 12 Impact of the number of recycling cycles in an extruder environment, thus with mechanical forces. Recorded torque and pressure variation for HDPE; in general, polyolefin is the most studied polymer considering thermomechanical degradation kinetics. Data to construct the figure were taken from Oblak et al.110 | ||
For polyesters, it has been indicated that thermomechanical degradation mainly happens at the C–O bond, which has a bond energy of 109 kcal mol−1 comparable with that of a C–C bond of 99 kcal mol−1.115 The presence of an ester function in close proximity further decreases the C–C bond dissociation energy to ca. 85 kcal mol−1, thus facilitating the scission.116 However, to have chain rupture due to mechanical forces, sufficient energy needs to be stored in the intermolecular bond, as highlighted by Bestul117 for other polymers.
Thermo-oxidative degradation
At first sight, the presence of oxygen initiates the typical cascade of thermo-oxidative reactions, as introduced in the right part of Fig. 5 in general terms and specified in greater detail in the right part of Fig. 13. However, the presence of C–O linkages and phenyl rings in the PET backbone leads to some specific oxygen-induced reactions, as addressed in the present subsection, further distinguishing between more overall observations and mechanistic insights based on (small) model compounds.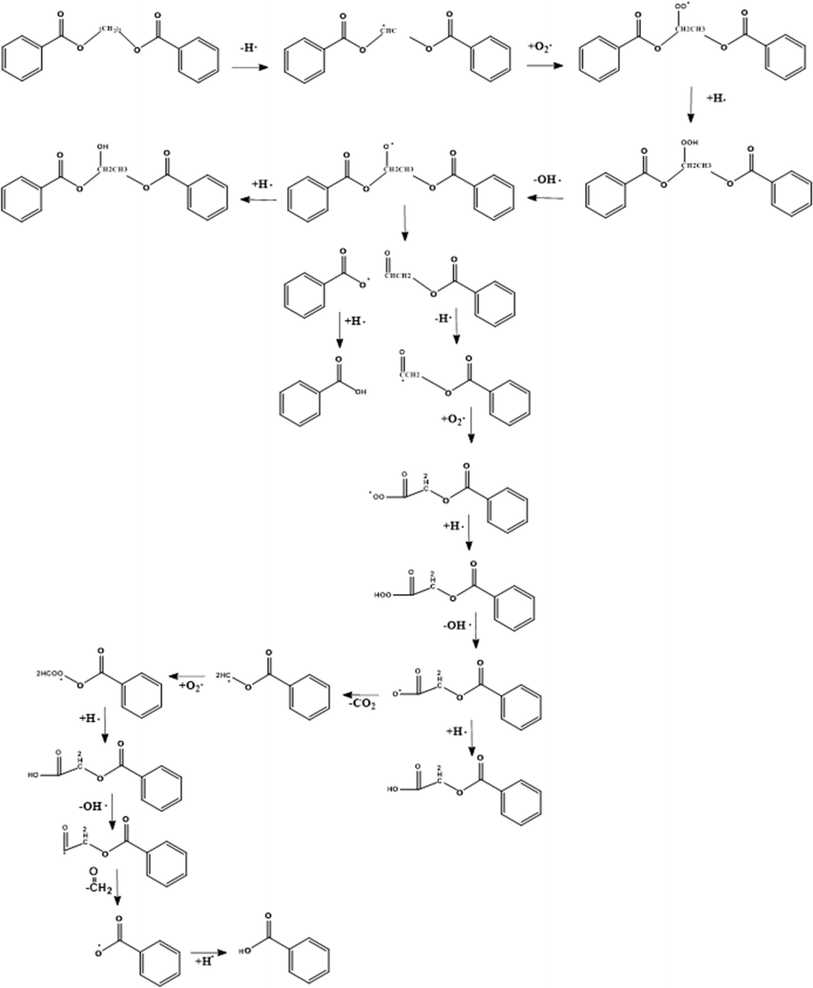 | ||
| Fig. 13 First mechanism of thermo-oxidative degradation of ethylene dibenzoate (EDB) being a model compound for PET. This mechanism is based on the work by Botelho et al.118 | ||
The presence of oxygen significantly affects the degradation of PET, as first postulated by Marshall and Todd.119 Without mentioning a mechanism, these authors highlighted that oxygen accelerates the scission process and leads to carbonyl group formation, as further explored in follow-up studies. For example, Jabarin and Lofgren120 showed that the (lumped) activation energy of PET degradation in the melt state is dependent on the presence of oxygen in the sample. Subsequently, Botelho et al.118 derived a more detailed thermo-oxidative mechanism based on ethylene dibenzoate (EDB) and butylene dibenzoate (BDB) as model compounds for PET and polybutylene terephthalate (PBT), respectively.
As shown in Fig. 13, Botelho et al.118 highlighted that for BDB, oxygen particularly attacks the C–H bond adjacent to the ester linkage carbon atom. In follow-up degradation reactions, peroxide decomposition, with the formation of O-centered radicals, and the subsequent cleavage reactions forming carboxyl radicals and aldehydes are essential. A carboxyl radical can abstract hydrogen and generate a carboxylic functionality but can also undergo decarboxylation, similar to the case of thermal degradation (cf.Fig. 7). The H-atom in the aldehyde group is also prone to abstraction, and the formed carbonyl radical can further react with oxygen-generating superoxide species, which decompose or abstract H with the formation of carboxyl acid.
Ciolacu et al.121 also aimed at gaining detailed thermo-oxidative (scission driven) mechanistic insights by studying the formation of chromophore groups via FTIR and 1H nuclear magnetic resonance (NMR). They evaluated the changes in the molecular properties on the surface and in bulk, conducting the controlled degradation of PET in the presence of oxygen. These authors pointed out that the oxidation of PET initially takes place at the surface with spreading of the phenomena in the bulk of the melt due to oxygen diffusion, which is facilitated at elevated temperature. In detail, based on the determination of the oxidation products and literature data analysis, the extensive set of reactions is presented in Fig. 14.
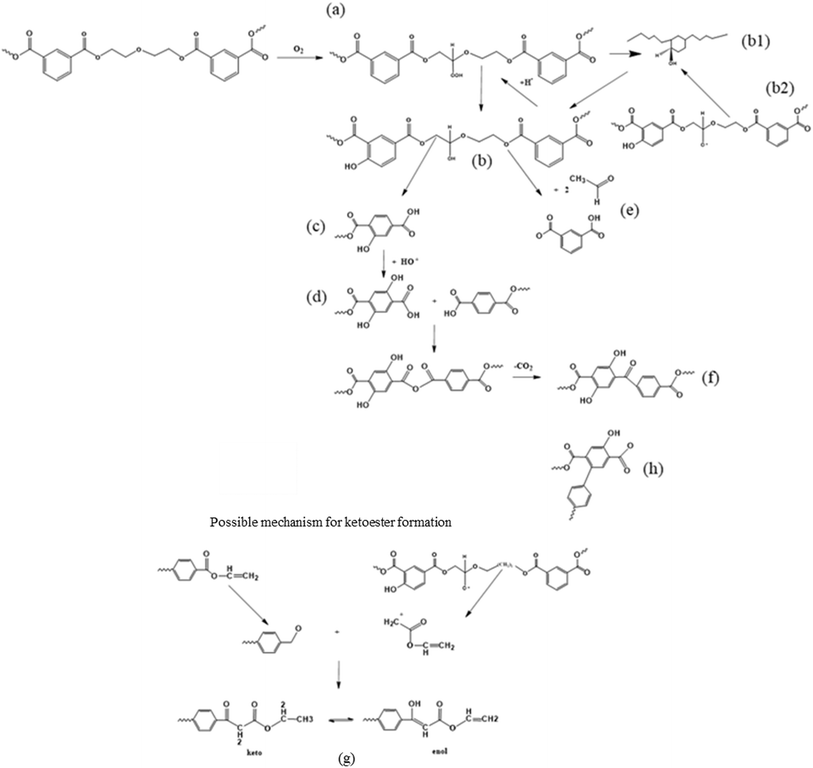 | ||
| Fig. 14 Second mechanism of thermo-oxidative degradation of PET. This mechanism is based on the work by Ciolacu et al.121 | ||
Fig. 14 depicts that the weakest ether link is prone to hydroperoxide formation ((a) label), and that the OH-radical produced via the decomposition of peroxides can not only abstract H from the –CH2- groups of the ester linkage (as in any other polymer) but also react with the phenyl ring ((b1) label). After H-abstraction by another radical, a hydroxylated compound ((c) label) is formed, which is the main source of PET discoloration.122 The hydroperoxide can also undergo chain scission, forming hydroxyl and carboxyl end groups as well as acetaldehyde (label (e)). Further reactions during thermal and thermo-oxidative degradations lead to the formation of new carbonyl functionalities, being ketoesters or hydroxylated ketoesters containing a conjugated system of double bonds (label (f) and (g)). In parallel, the buildup of conjugated aromatic structures has been proposed (label (h)), as further described in the literature.101,122,123
Several authors also mentioned that oxygen plays an important role in the post-condensation reactions of PET, increasing its average chain length, and hence can contribute to crosslinking instead of scission. In particular, de Souza et al.124 linked the thermo-oxidative degradation to the increase in melt viscosity after the drying step. This phenomenon was also reported by Assadi et al.,100 who studied the crosslinking behavior of PET according to the reactions listed in Fig. 15. The presence of oxygen leads to extra radical formation and chain crosslinking when the concentration of oxygen is low. However, once the oxygen concentration is above a certain threshold, the scission of PET is promoted, given that the reactions listed in Fig. 13 and 14 start to be dominant.
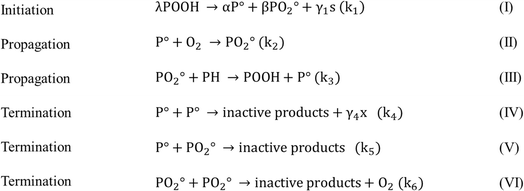 | ||
| Fig. 15 Mechanism of PET crosslinking in the presence of oxygen. POOH is the initiator generated by the oxidation process, PH is a methyl group, and s indicates chain scission and x crosslinking, as reported in the work by Assadi et al.100 | ||
The presence of comonomers also plays an important role in the thermo-oxidative (and thermal degradation) of PET-btg, as shown by Romão et al.125 Particularly, DEG is prone to the attack by molecular oxygen on the methylene protons adjacent to the ether oxygen atom. As shown in Fig. 16, this causes the release of hydroxyl radicals in the polymer matrix, thereby producing mono- and di-hydroxyl substituted species. These authors also pointed out the formation of cyclic oligomers, as also discussed before via thermal means. Similarly, Lecomte and Liggat12 compared the cascade of reactions for pure PET and copolymer-containing DEG units to point out the importance of cyclization toward DEG units, forming cyclic oligomers that are released early in the degradation. Thus, the DEG units are easily pushed out during recycling, given that they are more likely involved in the formation of cyclic oligomers than the rest of the PET backbone due to their chemical structure and flexibility.
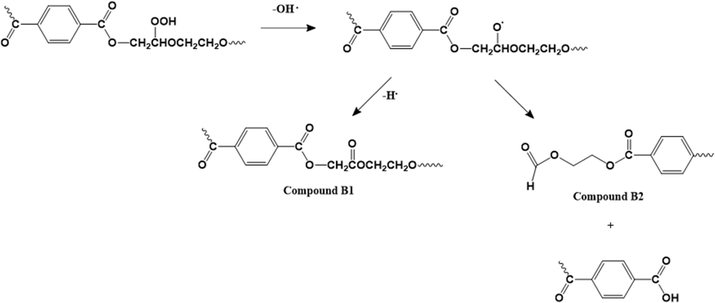 | ||
| Fig. 16 Thermo-oxidative degradation mechanism with a DEG comonomer unit based on the work by Romão et al.125 | ||
The presence of oxygen has also an effect on the reprocessing potential and stability of PET. For instance, this has been highlighted in the study of Badia et al.,126 showing that the reprocessing of partially degraded PET in an inert atmosphere requires more energy due to the (remaining) presence of certain functional groups. However, in case the reprocessing occurs in the presence of oxygen, the decomposition of the resulting oxidized PET proceeds faster. These results are similar to that reported by Das and Tiwari,127 who observed the faster decomposition of PCW PET. The effect of the environment on the recycling of PET was also pointed out by Schyns et al.128 These authors performed melt extrusion under a nitrogen atmosphere instead of an oxygen atmosphere and observed an increase in the PET average chain length by 20%. In the presence of oxygen, they observed chain scission as the predominant degradation mechanism with ca. 8% decrease in the mass average molar mass (Mm) value.
Photo-oxidative degradation
Polymers can undergo faster degradation in contact with UV- and visible light irradiation, implying the role of so-called photo-oxidative degradation next to thermal and thermomechanical degradation. For instance, this contact provokes C–H bond homolysis with subsequent formation of radical species. Consequently, all the reactions typical for thermo(-oxidative) degradation (Fig. 5–16) can accelerate if sunlight is available. A disclaimer is that the effect of photo-oxidative degradation is only noticeable if a sufficiently long irradiation time of weeks or months is applied. Hence, photo-oxidative degradation is only relevant for polymer-based applications with long use-times or waste that stays sufficiently long in open dumps or in the environment, e.g. marine plastics.It has been indicated that multiple polymers release degradation products that might be harmful to the environment if they are exposed to sunlight and atmospheric oxygen. This seems to be especially true if they contain no stabilizer molecules,129 which is more likely toward their end-of-life given that these small molecules tend to degrade and lose their functions during prolonged exposure to irradiation. A special case is microplastics carried out from the water to the sea shore, likely with a strong photodegradation effect due to a polymeric material being in resting mode at high temperature and in contact with air for a long time.130
According to the classification by Rabek,131 PET is moderately photostable, and thus it should be able to be used without a photostabilizer. However, photo-oxidative reactions still take place, for instance, as demonstrated by Abboudi et al.132 considering the degradation of PET water bottles. As shown in Fig. 17, these authors compared the leaching of formaldehyde and acetaldehyde into the water poured in the PET bottles in the presence of sunlight as well as in the dark. It was found that the concentration of acetaldehyde increased up to 100 days of storage, after which saturation was reached. Notably, in the presence of UV, more degradation occurred compared to aging in the dark. Interestingly, PET is claimed to be more photo-oxidative stable than other common plastics such as polystyrene and polypropylene.133
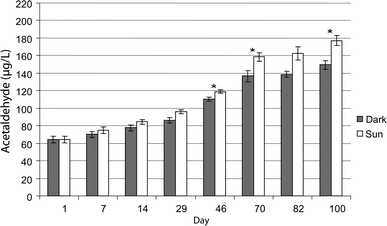 | ||
| Fig. 17 Concentration of acetaldehyde in PET bottled water samples during 100 days of storage in the laboratory (dark) and under sun exposure (UV-light). Under UV-light more acetaldehyde is observed, highlighting the relevance of photo-oxidative degradation at long exposure times. Plot made based on the work by Abboudi et al.132 Reproduced with permission from the copyright holders IWA Publishing. | ||
In PET, its absorbing chromophore is part of its main chain and its ester carbonyl groups absorb light in the wavelength region of 280 to 400 nm,134 and thus its degradation involves chain scission reactions. The detailed mechanism of photo-oxidative degradation has been elaborated by several groups, with the main results reported by Fox and Cozzens135 and Murayama et al.,136 and the overall reactions are presented in Fig. 18 (top).
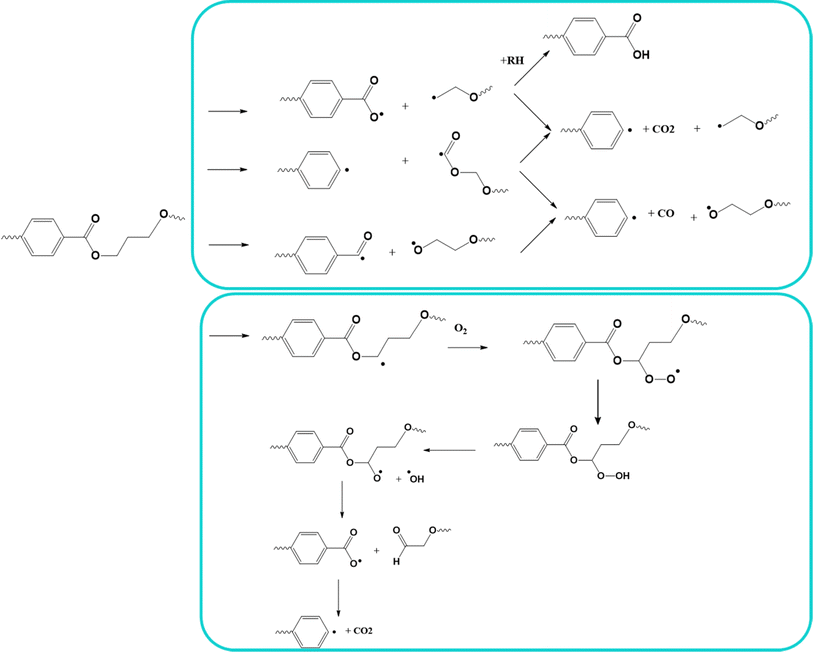 | ||
| Fig. 18 Top: Reported overall mechanisms for photo-oxidative degradation. Bottom: specific mechanism for vacuum photolysis and photo-oxidation. Reactions based on the work by Day et al.133 | ||
As can be seen in Fig. 18 (top), hydroperoxide formation and cleavage occur to form hydroxyl radicals and alkoxyl radicals, with the latter also undergoing several reactions leading to chain scission, the formation of monohydroxy terephthalate groups, and CO and CO2 as volatile products.137 As shown in Fig. 18 (bottom), Day et al.133 proposed a complementary mechanism for both photolysis and photo-oxidation. They verified that the production of COOH end groups was independent from the UV wavelength, as well as the production of CO.
Hydrolytic degradation
Polyesters contain ester groups in their backbone, and thus they are susceptible to hydrolytic degradation.138 As shown in Fig. 19, water reacts with these groups, resulting in the formation of carboxylic acid and hydroxyl functional groups, and hence lowering of the chain length by chain scission.139 In the case of copolyesters, their hydrolytic degradation is faster than the conventional PET because of the more amorphous structure of the former.140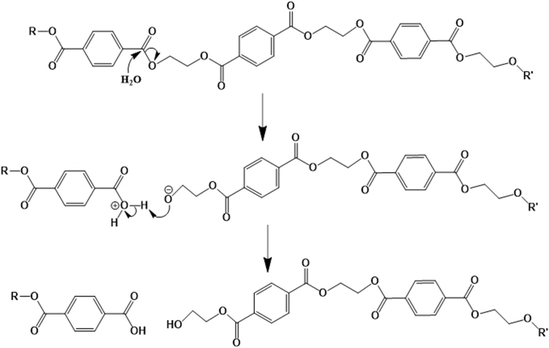 | ||
| Fig. 19 Mechanism of PET hydrolytic degradation based on the work by Sammon et al.139 | ||
The pH of the water has been shown to play an important role in the polyester hydrolytic degradation mechanism.141 As shown in Fig. 20, Woodard et al.140 showed that in a basic environment the ester carbonyl reacts with hydroxide ions, whereas in an acid environment the functional group is protonated before reacting with water. Depending on the level of acidity the degradation rates vary, as shown in the work by Rowe et al.141 An increase in pH increased the mass loss rate of PET compared to the samples in de-ionized water. This was attributed to the addition of KOH, which interferes with the mechanism driven by the acidic medium, stabilizing the carboxylate anion and leading to carbonyl protonation.141 However, many studies have indicated that a dedicated change for the degradation rate of polyesters only happens in extremely acid or basic systems.138
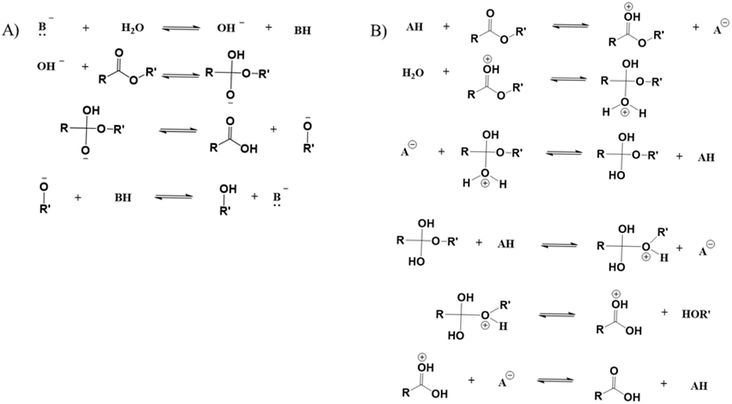 | ||
| Fig. 20 Mechanism of hydrolysis in (A) basic environment and (B) acid environment based on the work by Woodard and Grunlan.140 | ||
It should be noted that the acid and alkaline hydrolysis process have been deliberately exploited for the chemical recycling of polyesters.140,142 For instance, Carta et al.143 highlighted that acidic hydrolysis proceeds via a so-called shrinking core model, meaning that the reaction occurs mainly close to the chain end. As a result, in the presence of excess acid, the final products are TPA, EG and inorganic salts. Alternatively, under basic conditions, random chain scission reactions dominantly occur, eventually leading to the formation of TPA and EG. Hence, the hydrolysis of PET results in the release of the valuable compound TPA, justifying research on chemical recycling technology.143
Enzymatic degradation
More recently, recycling biological methods, which have also been grouped as enzymatic degradation techniques, have been developed for PET, alongside the traditional chemical and mechanical methods (Fig. 6–20), as conceptually shown in Fig. 21.144,145 Biological methods have been postulated to be promising and environmentally friendly solutions for the decomposition of PET waste, provided that appropriate scale up strategies can be developed. Despite the fact that PET is labelled as non-biodegradable, significant research has been devoted to the use of microorganisms or enzymes to break it down via natural means.146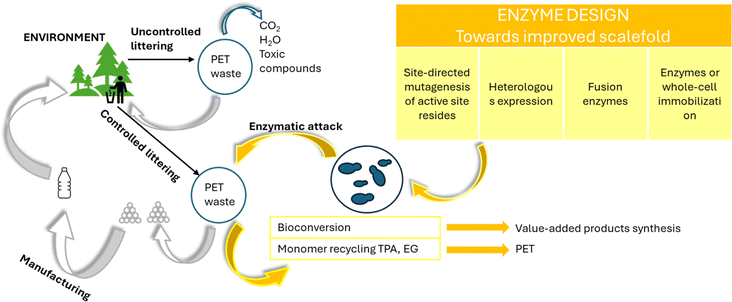 | ||
| Fig. 21 Potential of enzymatic degradation for polyester circularity; overview based on Urbanek et al.144 | ||
Enzymes are biocatalysts that participate in a reaction, act on a particular substrate, and accelerate the process of conversion of that substrate into a valuable (or targeted) product. All the enzymes that are known to degrade polymers belong to the class of hydrolases, which are classified as EC 3 in the EC numbering of enzymes. To date, the enzymes mostly employed for PET depolymerization are cutinase (EC 3.1.1.74), lipase (EC 3.1.1.3), carboxylesterase (EC 3.1.1.1), PETase (EC 3.1.1.101), MHETase (EC 3.1.1.102), and esterase (EC 3.1.1.1).146,147
The most relevant degradation takes place with the help of enzymes that are present in microbial cells (extracellular/intracellular), which breakdown the polymer chains through assimilation within the cells, releasing metabolic products such as CO2, H2O, methane (CH4), and nitrogen (N2).148 The enzymatic degradation occurs in two stages, including (i) adsorption of enzymes on the polymer surface and (ii) hydro-peroxidation/hydrolysis of the bonds.147,149 For illustration purposes, the mechanism of PET degradation, as catalyzed by PETase or cutinase under mild conditions, is highlighted in Fig. 22. The enzyme PETase first converts PET into oligomers and monomers such as BHET, mono(2-hydroxyethyl) terephthalate (MHET), TPA, and EG. Subsequently, MHET is further hydrolyzed by a second enzyme, MHETase, to again yield TPA and EG.147 Once the monomers and constituents are separated, they can be used and repolymerized to create plastics or other petrochemical products.
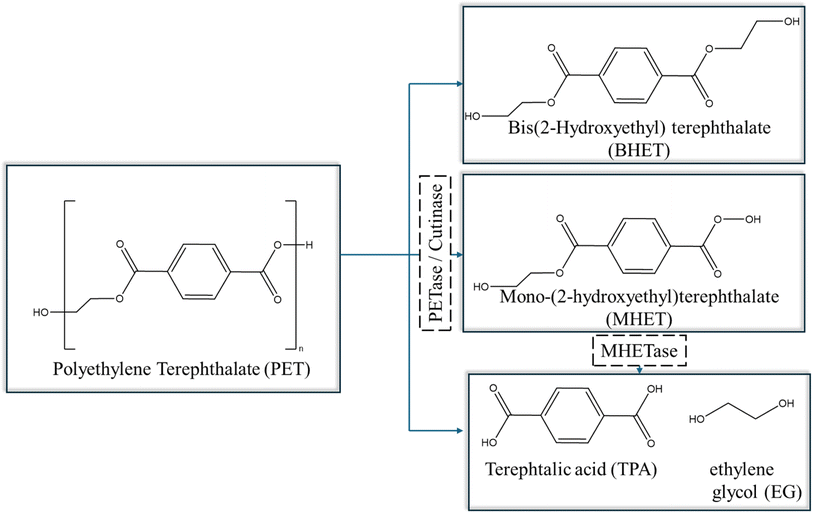 | ||
| Fig. 22 Overall reactions for PET degradation catalysed by PETase or cutinase based on the work by Khairul Anuar.147 | ||
The enzymatic degradation process usually requires less energy and has the potential to extend the life of PET by recycling the polymer multiple times, while producing virgin-like quality. However, in some cases, extensive heat may be needed as a pre-treatment step to prepare the (mixed) plastic waste for the enzymatic reaction. This can negatively impact the life cycle assessment (LCA) and overall emissions, depending on the sources of energy used. Furthermore, the crystallinity (higher being less accessible for enzymes), temperature (higher enabling flexibility, e.g. 343 K, but not too high enabling enzyme stability), pH (more TPA formation with increasing acidity), buffer strength, and the nature of substituent/additives present (as plasticizers) affect the enzymatic degradation efficiency of PET.150 In general, it is necessary to avoid a process design that does not alter the enzyme activity or inhibits the accessibility to the ester linkage.151 Moreover, the necessity of long PET chains penetrating into the active sites of hydrolases, which are often located in rather deep cavities, makes the sufficient mobility of the chains the most important factor controlling the polyester degradability.152 Hence, in the conventional degradation of PET in the melt or solid-state, diffusional limitations are essential to be grasped in a sufficiently fundamental detail.
In addition, the degradation enzymes need to be efficiently produced and their activity needs to increase to ensure the industrial relevance of enzymatic degradation.153 In this context, metabolic engineering provides certain opportunities such as engineering of the substrate binding pocket as well as the hydrolase specificity or relieving the product inhibition of PET hydrolases. Other methods include developing a surface display for PET hydrolases and mutations of enzymes to create more space for the active sites to fit the large, inaccessible polymer particles and to construct more hydrophobic substrate-binding sites.153
Rate coefficients and kinetic parameters
In view of modelling the kinetics for mechanical recycling, one can ideally rely on a library of Arrhenius (and diffusivity) parameters of the elementary reactions of relevance, or at least the representative (apparent) kinetic parameters should be available at the relevant temperature(s). For example, Launay et al.154 analyzed the weight loss over time of PET aged in distilled water at 100 °C to quantify the hydrolytic degradation kinetics. Assuming a random mechanism of chain attack, they deduced a second-order hydrolytic degradation rate coefficient, khydro, of 1.83 × 10⁻⁸ L mol−1 s−1. The dependence of khydro on the percentage of relative humidity (RH) was studied by McMahon et al.,155 with the associated Arrhenius plots provided in Fig. 23.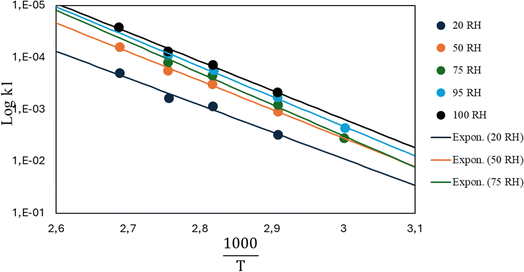 | ||
| Fig. 23 Arrhenius parameter plots for PET hydrolysis at different relative humidity (RH) percentages.155 The figure is constructed based on the data by McMahon et al.155 | ||
However, in many recycling studies, lumped (or apparent) rate coefficients have been determined, with the emphasis on chemical and not mechanical recycling, given that the focus is thermogravimetric analysis (TGA), aiming at the full conversion of the polymer into small molecules. The lumped activation energies (E values) are typically obtained by describing the evolution of the conversion, α, with time, t, as the product of a lumped rate coefficient, k, following the Arrhenius law, and a determined function, f, depending on α. As shown by Moens et al.,156E at a given α can be determined as follows:
For example, Jenekhe et al.88 investigated the pyrolysis of PET in an inert atmosphere through TGA with heating rates ranging from 0.31 to 10 K min−1 and temperatures in the range of 25 K and 600 K, defining at first a mechanism of A to B and then B to C, with A being the polymer, B being a mixture of TPA and vinyl ester oligomers, and C volatile compounds. Also, further lumping could be performed so that only one set of Arrhenius parameters was finally needed. Depending on the heating rate, different Arrhenius parameters were found, further highlighting the apparent nature of this approach. In the case of the slowest and fastest rate, an E of 48.14 kcal mol−1 and 55.56 kcal mol−1 and a pre-exponential factor A of 3.16 1012 s−1 and 7.84 1014 s−1 were obtained, respectively.
A similar study was also performed by Li et al.157 considering differential scanning calorimetry (DSC) analysis. As shown in Fig. 24 two dominant mechanisms could be identified at a heating rate of 10 K min−1, one corresponding to an E of 235 kJ mol−1 and an A of 1.6 1015 s−1 (first step), and one corresponding to an E of 96 kJ mol−1 and an A of 3.53 104 s−1 (second step).
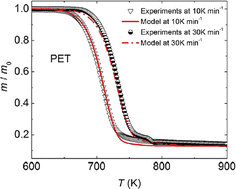 | ||
| Fig. 24 Example of application of TGA to obtain lumped kinetic parameters, typically for chemical recycling (or very strong degradation) of polyesters.157 Reproduced with permission from the publisher Elsevier. | ||
More special TGA treatments are the formal use of f = 1, defining a conversional method, the use of iso-conversional methods according to certain standards, or the use of integrated forms, as also mathematically elaborated by Moens et al.156 For example, Osman et al.158 used the American Society for Testing and Materials (ASTM) method to obtain an E of 165.6 kJ mol−1, whereas the Flynn–Wall and Ozawa method gave an E of 166–180 kJ mol−1 and the iso-conversional method delivered an E of 165–195 kJ mol−1. Additionally, Das et al.127 performed TGA experiments for PET at heating rates between 5 and 50 K min−1 for a temperature range of 303 K to 973 K, as well as isothermal experiments. Using the isoconversional method, they found an E of 203–355 kJ mol−1 and a log(A; s−1) of 33.3–59.3 under a nitrogen atmosphere, whereas in air, they observed a decrease in E to 145–2318 kJ mol−1 and a log(A; s−1) of 28.5–51.8 s−1.
A comparison of the TGA degradation kinetics of PET and its copolymers was performed by Holland et al.101 under an argon atmosphere at temperatures in the range of 473–643 K. The copolymer contained 2–4 mol% DEG and 1.3–2.6 mol% IPA. These authors reported (for simplicity independently assumed) the Arrhenius parameters for the loss of functional groups and bonds, as specified in Table 4. Specifically, higher pre-exponential factors were measured for the copolymer, consistent with the aforementioned results regarding (basic) thermal degradation involving DEG.
| Rate coeff. for loss of C–H (s−1) | Rate coeff. for loss of C![[double bond, length as m-dash]](https://www.rsc.org/images/entities/char_e001.gif) O (s−1) O (s−1) |
Rate coeff. for loss of ester (s−1) | Rate coeff. for loss of ethylene glycol end group (s−1) | |
|---|---|---|---|---|
| PET | ||||
| E (kJ mol−1) | 230 ± 10 | 220 ± 10 | 220 ± 10 | 160 ± 10 |
| A (s−1) | (3.62 ± 0.35) × 1015 | (2.05 ± 0.2) × 1015 | (3.58 ± 0.39) × 1014 | (9.37 ± 1.0) × 109 |
![[thin space (1/6-em)]](https://www.rsc.org/images/entities/char_2009.gif) |
||||
| Copolymer | ||||
| E (kJ mol−1) | 260 ± 10 | 260 ± 10 | 260 ± 10 | 160 ± 10 |
| A (s−1) | (2.56 ± 0.27) × 1016 | (1.16 ± 0.14) × 1018 | (2.92 ± 0.30) × 1017 | (3.77 ± 0.40) × 109 |
In the case of blends, TGA has also been applied, for instance, Jafari et al.159 analyzing PET/PLA blends potentially containing graphene oxide (GO) and exfoliated graphite (xGnP). These authors applied heating rates between 2.5 and 20 K min−1, with the results for the variation in E with mass loss percentage presented in Fig. 25 (top row; a: air and b: N2 atmosphere). Again, it was found that E is lower in air than under inert conditions; in detail, a factor 2 difference was identified. Similar experiments dealing with PET and recycled PET (up to 5 times) were performed by Badia et al.,103 except that instead of air, an O2 atmosphere was applied. Fig. 25 (bottom row) shows a comparison between the TGA results under N2 and O2 atmosphere.103 Consistent with the previous discussion, lower E values were found in the presence of O2. This effect is even more significant if reprocessed materials are considered.
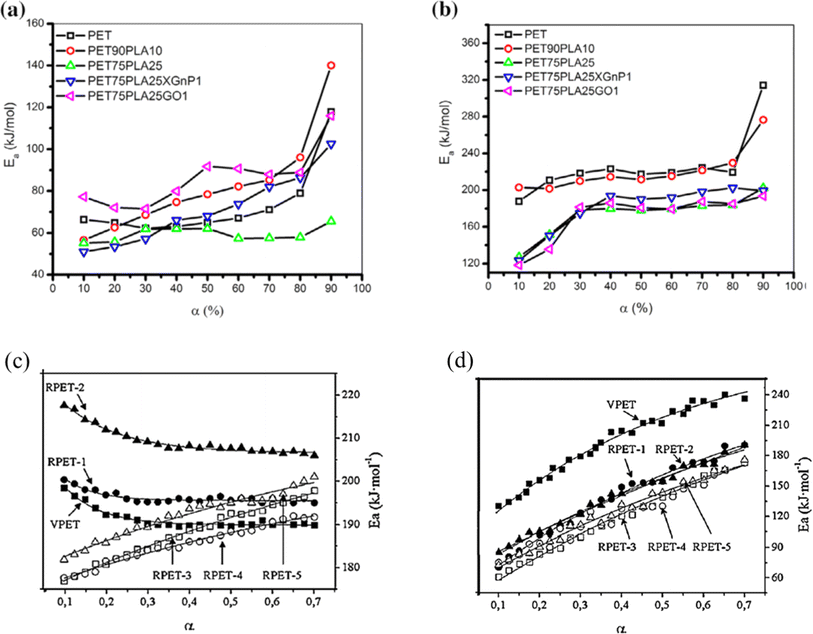 | ||
| Fig. 25 TGA results for blends with PET (top row a and b) and comparison of virgin and recycled PET (bottom row c and d).103,159 Reproduced with permission from the publishers Elsevier and John Wiley & Sons; where α is conversion (either in % (top) or as fraction (bottom)). | ||
It should be stressed that only in more isolated kinetic studies sets of rate coefficients have been reported, and thus a link to a detailed reaction mechanism driven by elementary reactions is within reach. For example, as shown in Fig. 26, Nait-Ali et al.160 reported several kinetic parameters for thermo-oxidative degradation at 280 °C, deriving the rate coefficients from the rheological data, specifically describing changes in the Newtonian viscosity. Hence, the kinetic model was built on a macroscopic property variation, instead of the typical model for chemical kinetics in which (molar) concentration variations are modeled. Similarly, Härth et al.161 conducted an oscillatory rheological study under a nitrogen atmosphere to describe the kinetic changes in zero-shear viscosity, according to a so-called build-up reaction, lumping esterification and transesterification, and the so-called break-down reaction, being a lumped chain scission reaction. Consequently, the E values of 93 kJ mol−1 and 176 kJ mol−1 were reported, respectively.
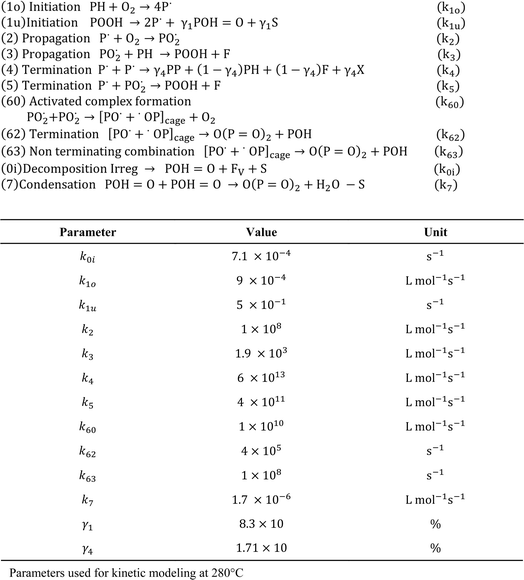 | ||
| Fig. 26 Example of a kinetic study on thermo-oxidative degradation, in which a set of rate coefficients was determined to be linked to a more detailed reaction scheme; example with tuning based on a macroscopic property; based on the work by Nait-Ali et al.160 | ||
Another study treating the degradation kinetics at the level of viscosity variations is that by Launay et al.154 These authors investigated the hydrolytic degradation of PET by exposing it to boiling distilled water at 100 °C for a period of 25 days, after which the samples became brittle. A second-order (apparent) rate coefficient of 1.83 10−8 kg mol−1 s−1 could be determined, assuming random chain scission. Oreski et al.162 further reported a significantly larger drop in average chain length of PET samples exposed to a temperature of 95 °C and a humidity of 85% compared to the samples exposed to 125 °C in a dry environment. This shows that besides thermo-oxidative degradation, hydrolytic degradation should be considered in the presence of water, at least if the temperature is above Tg knowing that the hydrolysis will be mainly relevant in the amorphous part. The authors reported an E of 86 kJ mol−1 and 96 kJ mol−1 depending on the grade but lower than the E value reported by Arhant et al.163 of 115 kJ mol−1.
More recently, Fiorillo et al.16 compared the Arrhenius values for hydrolytic degradation for PETG both based on (molecular) chain length variations via SEC and (macroscopic) rheological variations, including the Newtonian viscosity and shear thinning parameters. It was highlighted that Mn is a key parameter to be considered and that fitting with the relaxation time parameter provided more rheological sensitivity (Fig. 27).
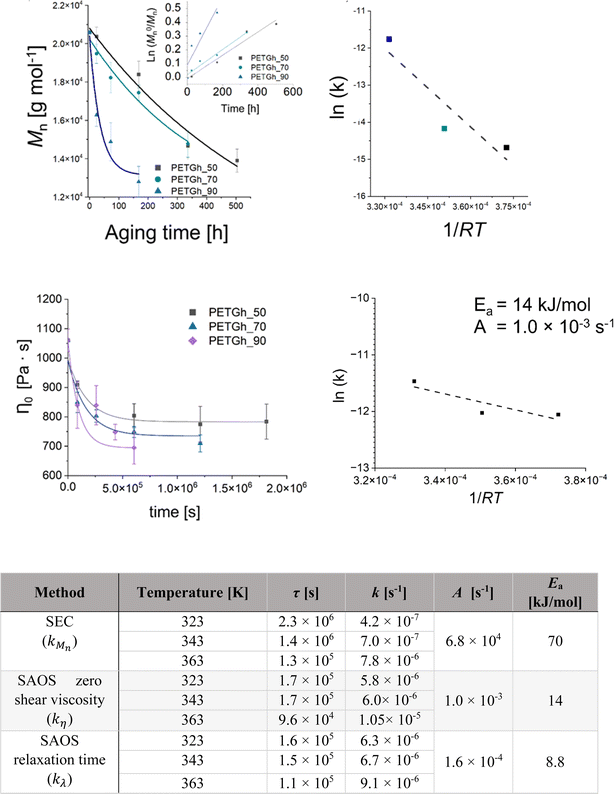 | ||
| Fig. 27 Example of hydrolytic rate coefficient determination for PETG using either a macroscopic or molecular property variation.16 Parameters of the exponential interpolation for degradation at different scales, thus via different measuring techniques: τ is the characteristic time parameter and k is an apparent degradation coefficient for the decrease in the number-average molar mass, viscosity and characteristic relaxation time. Arrhenius parameters for k values are also included. Reproduced with permission from the publisher Elsevier. | ||
In this work by Fiorillo et al.,16 the highest (Newtonian) viscosity drop was observed after aging in water for 7 days at 90 °C. By extrapolation, the khydro of about 3.4 10−6 L mol−1 s−1 was obtained at 25 °C, resulting in a half-life of decomposition of ca. 3 days under storage conditions (excess of water). Employing a similar approach, Jung et al.164 determined khydrovia viscosity measurements together with a variation in pH. In detail, these authors found that the relative viscosity decreased more rapidly with time at a higher pH, as shown in Fig. 28. Coupled with GPC analysis and assuming first-order kinetics, khydro in the presence of acids was assessed to be 0.05 day−1 at 30 °C. The study by Jung et al.164 additionally compared polyester and poly(propylene carbonate) (PPC) water contact, indicating that in a strong acid environment, polyesters are less degraded than PPC.
 | ||
| Fig. 28 Relative viscosity of solution with PLA (left) and PPC (right; 0.5 wt% polymer) at different pH.164 Reproduced with permissions from the publisher Elsevier. | ||
Alternatively, computational chemistry can be applied to assess (or determine) the degradation rate coefficients (or kinetic parameters). Specifically, density functional theory (DFT) calculations have been performed to assess the degradation reaction energies. For example, Huang et al.89 proposed the likelihood of concerted reaction mechanisms, specifically that with a six-membered transition state compared to the cleavage of the C–C and C–O bonds in the main chain.
Hence, the current section highlighted that several methods exist to determine the (apparent) degradation kinetic parameters. This is further illustrated in Table 5, giving an overview of the typical rate coefficients according to the reaction type and method applied. Specifically, a large difference in the E values can be observed, highlighting the use of apparent or lumped methods that are less desirable, given that the molecular scale is not recognized in sufficient detail with many elementary reactions with different relative importances dependent on the boundary conditions at play. Besides, it is clear that the amount of data is limited and efforts should be undertaken to retrieve more elementary driven rate coefficients and kinetic parameters considering the plethora of reactions mentioned in the previous sections.
| Degradation reaction type | (Apparent) kinetic parameter | References |
|---|---|---|
| Thermal | E = 48.14–55.56 kcal mol−1 | 88 |
| A = 3.16 1012–7.84 × 10¹⁴ s−1 | ||
| Thermal | First step | 165 |
| E = 235 kJ mol−1 | ||
| A = 1.6 × 10¹⁵ s−1 | ||
| Second step | ||
| E = 96 kJ mol−1 | ||
| A = 3.53 × 10⁴ s−1 | ||
| Thermal | ASTM method | 158 |
| E = 165.6 kJ mol−1 | ||
| Flynn-Wall-Ozawa method | ||
| E = 166–180 kJ mol−1 | ||
| Iso-conversional method | ||
| E = 165–195 kJ mol−1 | ||
| Thermal | E = 161.23 kJ mol−1 | 166 |
| A = 3.85 × 10⁹ s−1 | ||
| Thermal | Activation energies in Table 4 | 101 |
| Thermo-mechanical | Rate coefficients in Table 4 | 160 |
| Thermo-mechanical | Build-up reaction | 167 |
| E = 93 kJ mol−1 | ||
| Chain scission | ||
| E = 176 kJ mol−1−1 | ||
| Thermal | E = 203–355 kJ mol−1 | 127 |
Log![[thin space (1/6-em)]](https://www.rsc.org/images/entities/char_2009.gif) A = 33.3–59.3 s−1 A = 33.3–59.3 s−1 |
||
| Thermo-oxidative (air) | E = 145–218 kJ mol−1 | 127 |
| Log A = 28.5–51.8 s−1 | ||
| Thermal | Activation energies in Fig. 5b | 159 |
| Thermo-oxidative (air) | Activation energies in Fig. 5a | 159 |
| Thermal | Activation energies in Table 4 | 103 |
| Thermo-oxidative (oxygen) | Activation energies in Table 4 | 103 |
| Hydrolytic | E = 1.83 10−8 kg mol−1 s−1 at 100 °C | 154 |
| Hydrolytic | E = 86–96 kJ mol−1 | 162 |
| Hydrolytic | E = 115 kJ mol−1 | 168 |
Relevance to support life cycle assessment and environmental footprint data
The mechanical recycling process aligns with at least three out of the twelve principles of Green Chemistry,169i.e. “Prevent Waste”, “Avoid Auxiliaries”, and “Energy Efficiency”. Indeed, with the help of mechanical recycling, we can prevent landfilling of polymer products, avoid the use of solvents and achieve energy efficiency compared to other processes such as chemical recycling, at least if the recycled polymer product quality is sufficient. These features can be better demonstrated in the case LCA is applied to evaluate and compare all the possibilities for closing the loop for polymer products from a more environmental point of view.LCA is potentially a powerful approach to identify green technologies in polymer production and processing, comparing industrial processes and technologies. LCA can also recognize PET and bio-based PET as materials with high “adherence to green design principles” and low “life-cycle environmental impacts”, as demonstrated by Tabone et al.170 However, most of the LCA studies on polyesters and PET in particular still focus on overall CO2 equivalents per treated mass of waste, and hence the carbon footprint (CF) calculations are still observed with a certain degree of uncertainty. These LCA studies only consider overall process manipulations; hence, more apparent (lumped) chemical modifications are required, with the overall claim that mechanical recycling can be beneficial in several cases.
For example, for bottle-to-bottle mechanical recycling, Ncube and Borodin171 proposed the use of 3.33 kg CO2 eq. CF instead of the landfill mode of operation with a value as high as 47 CO2 eq. Furthermore, Meys et al.172 indicated that PET chemical recycling could potentially enable improvements up to 4.3 kg CO2 eq. compared to energy recovery. Consequently, Allen and James31 demonstrated that mechanical recycling is preferred over chemical recycling but the latter is still beneficial versus virgin production. In addition, the work by Dormer et al.173 revealed that the CF of PET-based packaging production decreases by 58%, i.e. from 2.1 to 1.6 kg CO2 eq., by manufacturing trays with an 85% recycled content compared to the use of pure virgin material. Furthermore, the CF value could be further reduced by 38%, i.e. from 1.6 to 1 kg CO2 eq., in the case that the fraction of recycled PET was 100%, highlighting an important environmental goal for the PET recycling industry.
It is also well recognized that LCA should be combined with green metrics, e.g. E-factor calculations,174,175 to provide a more complete understanding of the environmental impact of polymer production and disposal, identifying areas for improvement and developing sustainable practices.176–178 E-factor analysis can be linked to the total mass of waste generated by the mass of the product manufactured, e.g. the recent review by Fadlallah and Allais178 tackling the possibilities and limitations of E-factors based analysis. Subsequently, Uekert et al.179 provided an environmental, economic and technical comparison of existing technologies. In particular, they reported an E-factor of 0.8 for the production of virgin PET, 0.9 for mechanical recycling and 0.4 for methanolysis, although a further refinement of calculation methods is still desirable to make more substantial comparisons. Enzymatic hydrolysis likely has a high E-factor, generating ca. 5.5 kg of waste water per 1 kg of PET produced. Other reports have shown that mechanical recycling has lower greenhouse gas emissions than chemical recycling, landfilling, or incineration.180,181
Interestingly, Shen et al.182 studied the relevance of consecutive recycling for bottle-to-fiber recycling. An advantage regarding environmental impact could only be confirmed by up to three generations of waste. These authors also proposed that more data on molecular properties is needed and the link to material properties should be incorporated for the genuine exploitation of the bottle to bottle recycling technique. More fundamentally, the underlying chemical reactions in the mechanical recycling technique result in the modification of the polymer molecules involved. In this case, too severe modification upon mechanical recycling makes it a challenging task to repair the transformations toward the desired material properties (e.g. IV) by performing post-processing steps, e.g. SSP. Thus, the LCA should ideally be linked to the molecular scale and the type of reactions covered in the present work, e.g. differentiating between the use of dry and wetted flakes.
Also, it should be emphasized that the recognition of the molecular scale is not the only challenge in LCA but also the development of more defined boundary conditions to establish the environmental preference of mechanical or chemical recycling, for instance, as indicated in the work by Nakatini et al.183
A more in-depth discussion of the state of the art on LCA analysis is included in our follow-up contribution, also discussing in detail the role of contaminants and the use of alternative bio-based feedstocks.
Material property variations in view of final applications
The impact of reactions is ultimately translated in variations at the material scale. In the present section, we present an overview of the most important rheological, thermal and mechanical properties for polyester materials and applications considering their (mechanical) recycling potential. Examples are included in which an explicit link is made to a molecular-scale variation, as discussed in the previous section, being a key novelty of the present work.Rheological properties
The rheological properties of polymer melts, describing the variations in their flow behavior due to deformations, are essential macroscopic characteristics considering polymer processing and recycling design.184 These properties are typically obtained in offline mode using various equipment tools relying on a well-defined flow pattern in a confined lab-scale environment. The so-called constitutive models are used to describe the experimental observations, enabling better coupling with software packages simulating the flow behavior in actual (industrial) equipment and devices. The packages can be distinguished as follows: (i) computational fluid dynamic (CFD) packages dealing with very fine mesh calculations for the application scale but treating lower scales in lower detail and (ii) molecular scale-driven software packages employed for the application of a more basic mesh but considering a detailed implementation of lower-scale phenomena.The most common lab polymer melt rheological set-up is a rotational rheometer equipped with a parallel plate geometry, as shown in Fig. 29 (top left).184 This set-up consists of two plates, one fixed and the other one rotating, generating a laminar flow defined by a gap that can be altered, defining the shear rate as the product of the angular speed, the (local) radius r and the reciprocal of the gap height H. The upper limit of the shear rate is determined by the ability to reach uniformity of the shear stress in the sample in the shortest time possible, whereas the lower limit is linked to the accuracy of the machine. The gap error is about 30 μm, and thus it is recommended to not go below 200 μm for H. Furthermore, to ensure homogeneity, H should be much smaller than the maximal radius, R, e.g. for R equal to 25 mm, H should be the maximum of 1 mm. Hence, in the presence of particle blends, it is advised that H should be at least 5 times the particle diameter.186
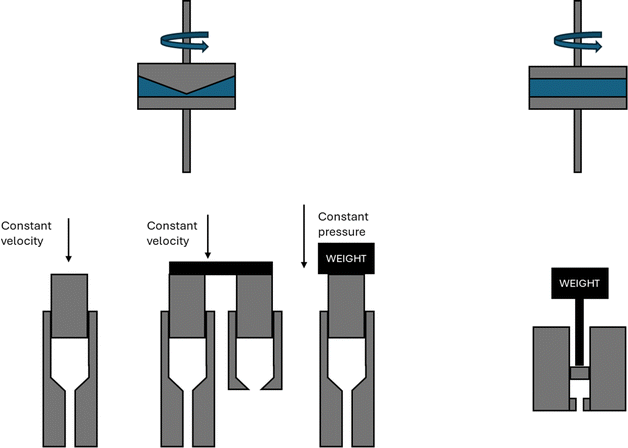 | ||
| Fig. 29 Conceptual design of parallel plate rotational rheometer, cone-plate rotational rheometer, capillary rheometer(s), and melt-flow index device. Figure based on general configurations mentioned in the literature.185 | ||
The cone-plate geometry, as depicted in Fig. 29 (top right), is an alternative to the parallel plate geometry. The advantage is the generation of a shear flow in a gap characterized by a constant shear rate along the radius due to the constant cone-plate angle, α, as a ratio of r and the (local) height. In the case of normal stress difference measurements, the cone-plate geometry is preferred over the parallel plate geometry. However, a disadvantage is the difficulty in the filling the complete system. In any case, rotational rheometers are more restricted to low shear rate data.
A way to obtain shear viscosity data at higher shear rates is by means of a capillary rheometer, as depicted in Fig. 29 (bottom left), where a piston is employed to push the melt through a capillary die, e.g. up to a shear rate of 10−7 s−1 but likely above 1 s−1 to avoid complications such as surface tension and gravity, which can interfere with the measured accuracy.184 Several capillary rheometer configurations exist, e.g. one can distinguish that based on a constant velocity, a twin barrel principle, and a constant pressure (left to right in Fig. 29 (bottom left)). The advantage of capillary rheometer measurements is the possibility to mimic higher shear rate processes such as injection molding.187
Notably, a somewhat related piston configuration also exists for application at very low shear rates, defining a melt-flow index (MFI) device, as shown in Fig. 29 (bottom right). An MFI device allows the measurement of the amount of material exiting for a given period of 10 min, with a larger amount implicitly implying a lower (Newtonian) viscosity. Thus, MFI measurements are very implicit and do not allow for a dedicated rheological analysis.111
Furthermore, one of the most popular rheological testing approaches is based on conducting small amplitude oscillatory sweep (SAOS) analysis, considering the (parallel plate) rotational rheometer at different frequencies (ω values). This dynamic testing under melt conditions allows to obtain information about the elastic and viscous contribution, known as the (shear) storage modulus (G′ or G1) and the (shear) loss modulus (G′′ or G2), respectively. Plotting both G′ and G′′ as a function ω allows to assess the overall material composition, with a possible derived property being a characteristic relaxation time, λ, e.g. defined as ωc−1 with ωc denoting the crossover frequency.
Polymer melts are very likely characterized by both a non-zero G′ and G′′, and for a sufficiently low ω, a linear viscoelastic regime results. Thus, they behave differently, for instance, Newtonian fluid water is a perfectly viscous material (vanishing G′) and a perfectly elastic solid obeying Hooke's law (vanishing G′′). Generally, polymer materials display deformation behavior between that of a purely viscous material and a purely elastic material, as also measurable in the solid state with the swapping of the symbol G into E by the scientific community.184
As shown in Fig. 30a and b, in the case of PET and PETG, G′′ is higher than G′ at any ω, meaning that the viscous behavior is dominant and no ωc is obtained.16,188 As shown in Fig. 30c, for PLA, ωc is obtained at higher frequencies, and thus a dominant viscous contribution is only established at a lower to intermediate ω.189,191 A more branched/crosslinked polymer system has an ωc at lower frequencies, as depicted in Fig. 30d for the multiphase acrylonitrile-butadiene-styrene polymer (ABS).109 With an increase in ω, the material behavior changes from a viscous liquid to that of a solid.
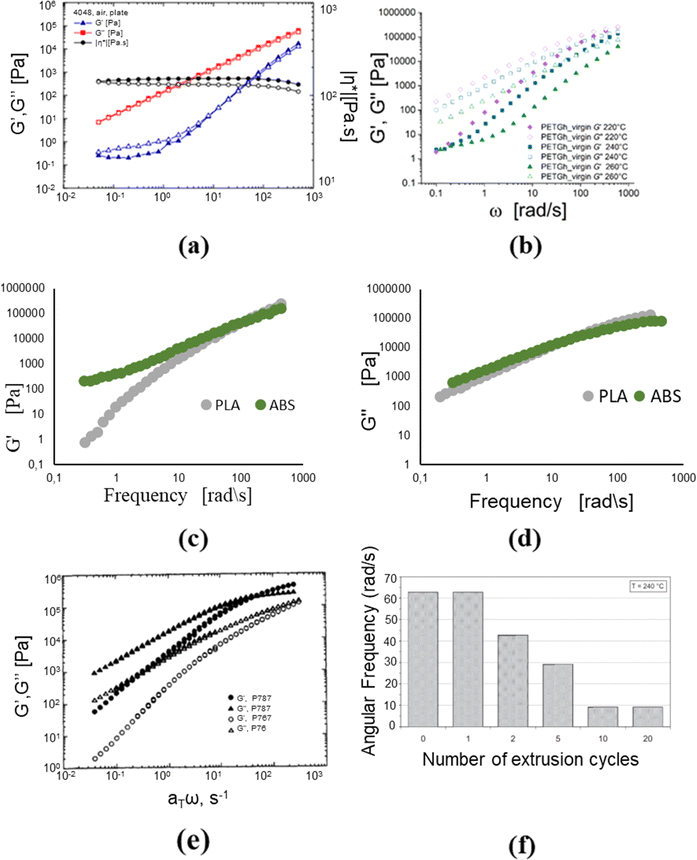 | ||
| Fig. 30 Data on storage and loss (shear) modulus (G′ and G′′) as a function of frequency ω, the so-called frequency sweeps. (a) PET (also depicting the complex viscosity) and PETG (temperature effect).16,188 (c) Data on the storage modulus of PLA and ABS.189 (d) Complementary data on the loss modulus of PLA and ABS. (e) Data on storage and loss (shear) modulus (G′ and G′′) as a function of frequency ω, the so-called frequency sweeps. The material is PCL (100 °C); variation in via number average molar mass: P787 Mn “0.64” and P767 Mn “0.43”, aT: shift factor.190 (f) LDPE only displaying the crossover point for G′ and G′′ for different extrusion cycles.109 Subfigure a, b, e and f reproduced with permission from the publisher: Elsevier, AIP Publishing and John Wiley and Sons, respectively. Data in c and d from Sanchez et al.189 | ||
This relation between macromolecular properties and rheology is further illustrated in Fig. 30e, selecting poly(caprolactone) PCL. After modification of the chains due to scission reactions, Mn decreases (labeling in legend), which is translated as a decrease in the absolute values of the moduli. Furthermore, ωc shifts to a higher ω. Therefore, in the case of a lower average molar mass material, e.g. by dominant scission due to extensive degradation, faster relaxation is expected. Oppositely, if the degradation mainly induces a shift toward higher average molar masses, ωc becomes lower. For example, Jin et al.109 analyzed the degradation of LDPE after multiple reprocessing and revealed the formation of crosslinks, with the storage module increasing along the complete interval of frequencies. The latter increase implies that the material shows an improved elastic behavior. Thus, a delay in the relaxation time was established, as shown in Fig. 30f, based on the shift in ωc to lower frequencies.
A different reaction environment can also imply a different variation in the G values. A comparison between a purely thermal degradation effect and a thermo-oxidative effect on the PET melt behavior was investigated by Kruse et al.188 by comparing the temporal G′ variations in an air and nitrogen atmosphere. Based on the experimental data in Fig. 31, these authors concluded that in the inert atmosphere, chain scission and post-condensation reach a steady-state, giving nearly a zero net effect on the average chain length. However, the behavior in air was totally different, with the post-condensation reaction overcompensating the chain scission, leading to an increase in the elastic contribution.
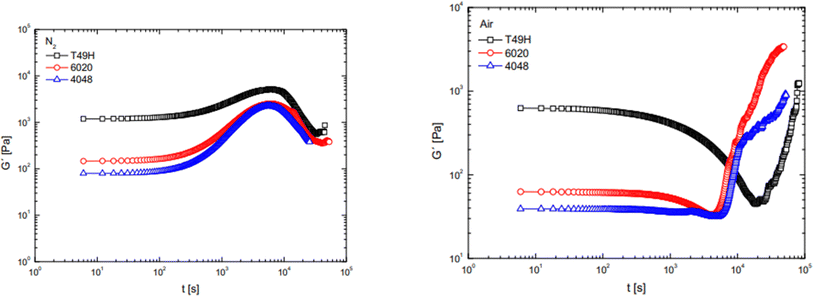 | ||
| Fig. 31 Storage modulus (G′) measured as a function of time in the presence of nitrogen (left) and air (right) of 3 different PET grades: PET T49H (black), 6020 (red) and 4048 (blue). Temperature of 280 °C, frequency of 10 rad s−1 and deformation of 10%.188 Reproduced with permission from the publisher, AIP Publishing. | ||
Additional rheological properties coming from SAOS measurements are the variation in the (absolute value of the) complex modulus |G*| and the phase angle δ, which are defined as follows:
Based on the latter two rheological properties, the so-called van Gurp-Palmen (vGP)-plot can be created.192 This plot displays the variation in δ with |G*| at a given T, with the minimum of the curve denoted as the plateau modulus, G0N. The latter module is linked to the entanglement molar mass, Me, for a given density, ρ, and the universal gas constant, which is denoted as follows:
As shown in Fig. 32 (top), in the case of polystyrene (PS) with a higher average molar mass, the minimum of the vGP plot drops. Furthermore, Yang et al.193 employed the vGP plot to show that PET materials with different molecular properties behave differently in terms of rheological properties, as shown in Fig. 32 (bottom left). In the case of the linear PET (L-PET), the aforementioned minimum is absent, whereas PET modified with long chain branches via reactive extrusion (LCB-PET) revealed a different trend toward the establishment of this minimum. The minimum was actually obtained upon considering PET modified with a crosslinking agent (C-PET).
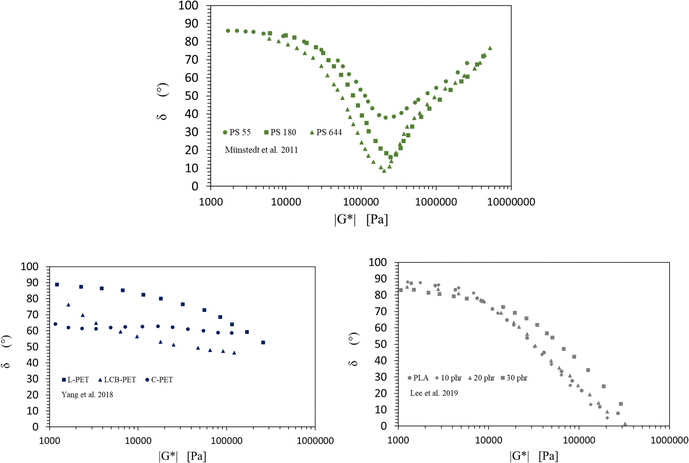 | ||
| Fig. 32 Van Gurp-Palmen (vGP) plots (phase angle δ as a function of complex modulus |G*|) for (top) three polystyrene (PS) samples with different average molar masses; for (bottom left) linear PET (L-PET), branched PET (LCB-PET) and cross-linked PET (C-PET); and for (bottom right) neat PLA and PLA modified with acrylic core–shell rubber (filler content in phr). Data to construct the subfigures taken from ref. 192–194. | ||
An extra example on the molecular variation in vGP configuration is included in Fig. 32 (bottom right), emphasizing the difference in unmodified linear PLA and PLA modified with acrylic core–shell rubber at different concentrations. A lower δ results for a higher filler mass concentration, highlighting the enhancement in the viscous behavior of the material.194
Another important rheological property determined from SAOS measurements is the complex viscosity, in which the absolute value |η*| can be determined as follows:
The majority of polymer melts exhibit shear thinning behavior197 due to the molecular variations, as conceptually highlighted in Fig. 33 (top).197 In the case of low shear stress, as relevant at low frequencies, the chains cannot easily move given that they are too entangled or interactive. In contrast, higher shear forces can free the chains from their constraints, and thus they can undergo reptation diffusion, leading to a pathway of less resistance and a (complex) viscosity decrease. Exemplary curves of shear thinning with PET and PLA materials are depicted in Fig. 33 (bottom),196,198 differentiating between the effect of processing environment, contamination level, and temperature. Accordingly, with greater contamination, the viscosities drop but certain repair by SSP is possible.
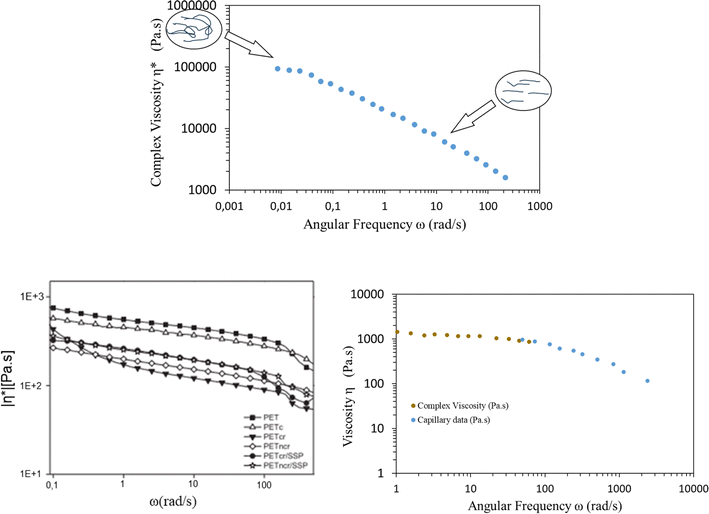 | ||
| Fig. 33 Top: Mechanistic interpretation at the molecular level for the variation in the complex viscosity with frequency ω. Bottom left (reproduced with permission from the publisher Elsevier): actual data blends of PET and chemical contaminants vs. reference PET and with fitting according to a cross model (reference denoted as PET, PETc: contaminated, PETcr: contaminated and reprocessed, PETncr: non-contaminated and reprocessed, PETcr/SSP: contaminated and re-copolymerized with solid state polymerization; PETncr/SSP: non-contaminated and re-copolymerized with solid state polymerization).196 Bottom right: actual data with PLA showing data at lower frequencies and higher shear rates. Data to make top and bottom right subfigure from ref. 197 and 198. | ||
In many cases, through rotational rheological measurements, it is possible to obtain this Newtonian viscosity by directly identifying or by extrapolation accessing the limiting value at a very low (zero) shear rate,199 with the latter exemplified in Fig. 33 (bottom right).198 Interestingly, Münstedt192 highlighted the variation in η0 with Mm (also known as the weight average molecular weight, Mw), as highlighted in Fig. 34 dealing with linear polymers. The overall dependency changes greatly above a certain average molar mass to manifest entanglements. Higher exponents in the associated power law fits, as also included in this figure by lines, imply a more effective restriction by entanglements in the higher average molar mass range.
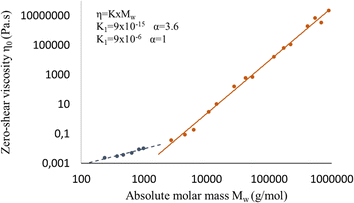 | ||
| Fig. 34 Zero-shear viscosity as a function of mass (weight) average molar mass for linear polyethylenes, considering a wide range of molar masses and dispersity. Data to construct the figure from Münstedt.192 | ||
Notably, Nait-Ali et al.160 used temporal η0 data to study the effect of the presence of oxygen for PET degradation, considering that a more oxygen-rich environment exists in the hopper and die unit, expecting greater scission and less crosslinking. Consistently, Fig. 35 displays that at low oxygen partial pressures, η0 increased as a function of time, indicating the importance of chain coupling. However, once the critical oxygen partial pressure threshold is reached (9%), η0 decreased, meaning that chain scission is more relevant.
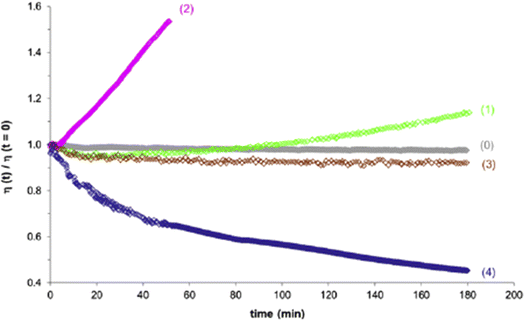 | ||
| Fig. 35 PET zero-shear or Newtonian viscosity as a function of time (divided by the initial value) at oxygen partial pressures of 0%, 0.6%, 1%, 9%, and 21% (at 280 °C).160 Reproduced with permission from the publisher Elsevier. | ||
The results in Fig. 30 to 35 highlight the link between the molecular scale and the rheological properties as measured at the material scale. During degradation or recycling, as explained in the previous section, molecular changes occur, and thus the rheological properties should also change. Consistently, the occurrence of certain reactions during mechanical recycling can be attributed to changes in material properties, as illustrated in the following paragraphs in the current section.
For the first example on connecting the molecular and material scale, the emphasis is the reprocessing of PLA, where it has been indicated that η0 decreases with more recycling steps, as corroborated by the shortening of the chains through a (dominant) chain scission process.200 This shortening of chains is evident from the molecular data in Table 6, highlighting a decrease in Mn and Mm. Although the average molar masses are decreased, the dispersity is increased, highlighting the relevance of the formation of shorter chains. In parallel, the η0 values decrease, as also shown in the same table.
| Extrusion number | M n [g mol−1] | M m [g mol−1] | Dispersity (−) | Zero-shear viscosity η0 (Pa s) |
|---|---|---|---|---|
| Virgin | 85![[thin space (1/6-em)]](https://www.rsc.org/images/entities/char_2009.gif) 000 000 |
110![[thin space (1/6-em)]](https://www.rsc.org/images/entities/char_2009.gif) 000 000 |
1.29 | — |
| 1 | 75![[thin space (1/6-em)]](https://www.rsc.org/images/entities/char_2009.gif) 000 000 |
104![[thin space (1/6-em)]](https://www.rsc.org/images/entities/char_2009.gif) 000 000 |
1.39 | 2729 |
| 2 | 66![[thin space (1/6-em)]](https://www.rsc.org/images/entities/char_2009.gif) 600 600 |
88![[thin space (1/6-em)]](https://www.rsc.org/images/entities/char_2009.gif) 200 200 |
1.32 | 930 |
| 3 | 57![[thin space (1/6-em)]](https://www.rsc.org/images/entities/char_2009.gif) 500 500 |
80![[thin space (1/6-em)]](https://www.rsc.org/images/entities/char_2009.gif) 600 600 |
1.402 | 520 |
| 4 | 45![[thin space (1/6-em)]](https://www.rsc.org/images/entities/char_2009.gif) 800 800 |
68![[thin space (1/6-em)]](https://www.rsc.org/images/entities/char_2009.gif) 600 600 |
1.50 | 314 |
| 5 | 37![[thin space (1/6-em)]](https://www.rsc.org/images/entities/char_2009.gif) 300 300 |
58![[thin space (1/6-em)]](https://www.rsc.org/images/entities/char_2009.gif) 400 400 |
1.55 | 219 |
A second example connecting the molecular and material scale is the activated nature of degradation reactions, as evident upon inspecting the apparent viscosity plots. As shown in Fig. 36, Peinado et al.201 analyzed the recycling of bio-based PLA at three temperatures for several recycling cycles. It was found that after each extrusion cycle, the viscosity decreased; however, at 190 °C, the decrease in viscosity was much more pronounced, and thus it could be postulated that scission reactions are more relevant chemistry wise. This also highlights again the need to have better E values, as mentioned in the discussion of the data in Table 5.
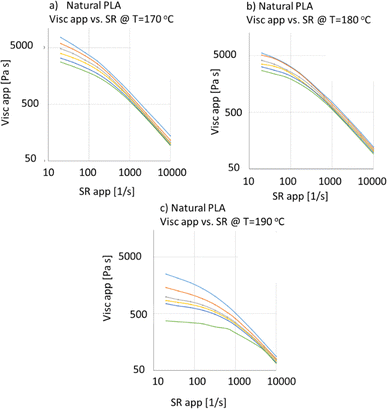 | ||
| Fig. 36 Variation in apparent viscosity with frequency, ω, for neat PLA measured at three different temperatures of 170 °C, 180 °C and 190 °C: light-blue – virgin, orange – 4 extrusions, grey – 8 extrusions, yellow – 12 extrusions, dark-blue – 16 extrusions, green – 20 extrusions.201 | ||
A related third example connecting the molecular and material scale is the work by Kruse et al.202 who analyzed the effect of temperature on the melt properties through time-resolved mechanical spectroscopy (TRMS) in the air, as shown in Fig. 37. These authors found that crosslinking occurs at larger exposure times but that for a decrease in temperature, this phenomenon diminishes, as evident from the more dynamic G′ variations in the right subplot compared to the left one.
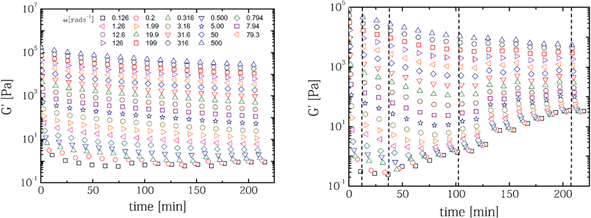 | ||
| Fig. 37 Time-resolved mechanical spectroscopy (TRMS) of the storage modulus, G′, at different frequencies (ω values): left 265 °C and right 288 °C. Measurement performed in the air.202 Reproduced with permission from the publisher Springer Nature. | ||
Using capillary rheometer data, the apparent viscosity variations for PET and recycled PET at different temperatures are highlighted in Fig. 38 (left;203), providing a fourth example on the connection of the molecular and material scale. The decline of the (apparent) viscosity values at a given temperature for recycled PET can be attributed to molecular degradation according to the reactions specified in the upper part of the previous section.
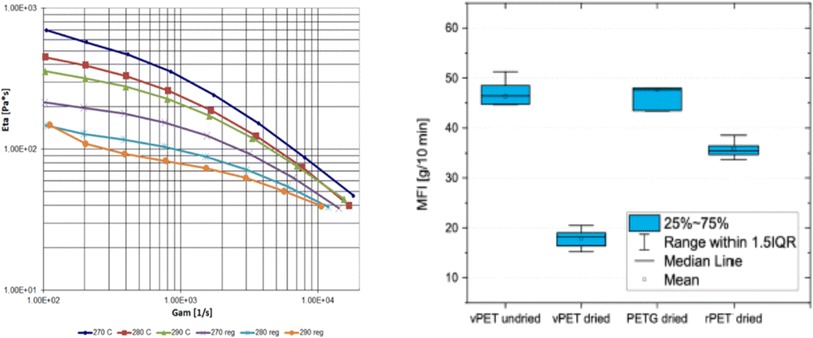 | ||
| Fig. 38 Left: variation in apparent viscosity with frequency, ω, for PET and recycled PET at 270 °C, 280 °C and 290 °C (capillary rheometer).203 Right: melt flow index (MFI) data for PET and recycled PET, dried or not.204 Both subfigures are reproduced in open access redistribution mode. | ||
A fifth example on the connection of the molecular and material scales is devoted to MFI measurements, which are often employed industrially to assess the degradation state of polymers. As explained above, this is a cheaper experimental method employing a heated channel, in which the material is extruded by means of a piston equipped with a known weight to determine the mass in a known interval of time and to assess one relative point of the (apparent) viscosity curve.205 Specifically, for PET, Bustos Seibert et al.204 measured a higher MFI for undried virgin PET versus both dried virgin PET and dried recycled PET, as highlighted in Fig. 38 (right).
Consistently, the effect of hydrolysis on the melt viscosity was studied by Seo et al.,206 showcasing a steeper decrease in melt viscosity for the undried PET samples compared to the dried PET samples, further demonstrating the importance of moisture for the chain scission reaction. Additionally, for the 3D printing of PLA blends, the MFI technique was used for the initial analysis of the flowability for the composite deposition.207 Subsequently, Spinace and De Paoli208 showed that MFI measurements revealed more PET degradation (higher MFI values) consistent with the carboxylic end group trend in Fig. 10.
In parallel, melt flow rate (MFR) measurements have been performed, accounting (in principle) for the flow rate and density compared to MFI measurement. For instance, Badia et al.209 evaluated the relevance of thermo-mechanical degradation on recycled PET and obtained similar results as Spinace et al.208 upon conducting MFI measurements. As highlighted in Fig. 39, a continuous and exponential increase in MFR was observed with consecutive reprocessing cycles, which almost increased by a factor of 4 after the sixth recycling step. This increase in fluidity is related to the progressive diminution of the average molar mass through multiple processing cycles.
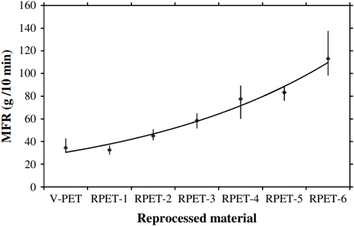 | ||
| Fig. 39 Evolution of melt-mass flow rate (MFR) through reprocessing simulation.209 Reproduced with permission from the publisher Elsevier. | ||
In a broader context, the residence time in a processing unit is also an important related variable. It has been indicated that at a higher (screw) speed, the average molar mass decreases because of the impact of mechanical forces, implying higher shear rates.210 However, higher speeds also imply lower residence times, and thus in this instance, scission reactions are less likely. Overall, the relevance of computational tools has emerged, which are capable of mapping competitive phenomena.211
Thermal properties
In the aforementioned subsection on the determination of rate coefficients, it was highlighted that TGA is a common technique to study to the thermal stability of polyesters. The critical TGA parameters are the heating rate, starting temperature, end temperature, and type of atmosphere.212Complementary to the already covered examples, in the present subsection, the main focus is the work by Baida et al.,103 investigating the differences in virgin PET and recycled PET with(out) oxygen. As shown in Fig. 40, TGA was conducted under an inert atmosphere (case 1) to establish that both materials decompose at around 400 °C. The difference between the virgin and recycled material was only about 5 °C. However, in the presence of oxygen (case 2), the decomposition of the material was faster and the leftover mass was negligible. The second degradation step observed in this case was followed by the greater production of CO2. Although the first decomposition step occurred in both atmospheres, the second decomposition step was only observed in the presence of oxygen, again highlighting the complexity of the environment in studying the relation between material properties and molecular changes.
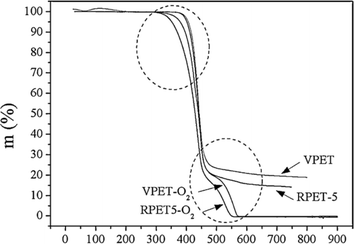 | ||
| Fig. 40 TGA analysis of virgin PET (VPET) and PET reprocessed 5 times (RPET-5). Two cases are considered: an inert atmosphere and under oxygen.103 Reproduced with permission from Elsevier. | ||
An additional example on the relevance of TGA is included in Fig. 41, considering different types of copolyesters that maintain the maximum value of residual mass at a different temperatures (in the presence of oxygen). In the top part of this figure, the beginning of the gravimetric curves are shown for modified polyethylene terephthalate (PETM) and PETg (PETG grade with low amount of modifications), and the bottom part of this figure covers the temperature at which 97.5% of the initial mass is maintained as a function of the residence time.
Small but significant changes can be observed. In the case of PETM, the sample has lost 2.5% of its mass between 335.7 °C and 352.9 °C, 5% between 359.0 °C and 372.4 °C, and 10% between 379.4 °C and 389.0 °C. PETg lost 2.5% of its mass between 325.4 °C and 334.9 °C, 5% between 342.9 °C and 355.8 °C, and 10% between 365.1 °C and 379.0 °C. Moreover, for PETg, a clear trend is visible for each residual mass, where the longer the residence time, the higher the temperature at which the sample lost mass. It can be further deduced that the thermal stability of PETM is higher than for PETg. It should be noted that the higher thermal stability of the acyclic units was also reported by Thompson et al.213 Consistently, the TGA measurements carried out under a nitrogen atmosphere, in which PET was modified with bicyclohexyldimethanol, showed a large weight loss starting from 390 °C.
Another important technique for thermal analysis is differential scanning calorimetry (DSC), where in many cases, the emphasis is the determination of the crystallinity level, Tg and Tm. Specifically, this analysis is crucial for PET, considering that it is a semi-crystalline material with a faster degradation in the amorphous phase. For example, Panowicz et al.86 focused on the effect of thermo-oxidative degradation on the morphological and thermal properties of PET. They reported that the amount of the crystalline phase increases by about 8%, which translates into the properties of the aged material. The Tg and Tm of the lamellar crystals formed during the first and second crystallization also increased with aging.
Furthermore, in the study by Alves et al.,214 their objective was better understanding the structural relaxation of PET as a function of its crystallinity degree. Tg was monitored for a totally amorphous PET (cooled at a rate of 40 °C min−1) and for PET with different degrees of crystallinity. The higher the percentage of crystallinity, the broader the Tg range, implying a broader range of relaxation times. If the amount of crystals is small, the mobility of the amorphous phase is more uniform. However, once this number increases, one can assess the changes in the amorphous phases. For instance, the chains closer to the crystal lamellae have a higher relaxation time.214
In the context of mechanical recycling, several groups investigated how the crystallinity changes during multiple reprocessing.104,215 For example, as shown in Fig. 42, after multiple reprocessing steps, the crystallinity peaks of the first cooling appeared sharper and shifted to higher temperature values. This can be explained through the improved arrangement of the chains after the first heating. The degradation of PET results in a higher number of shorter chains, promoting better mobility during the cooling step.209 Overall, it can be found that chain scission reactions induced under thermo-mechanical degradation may result in a heterogeneous distribution of chain lengths in the molten state, altering the subsequent amorphous and crystalline microstructure in recycled PET after chain rearrangement during cooling.
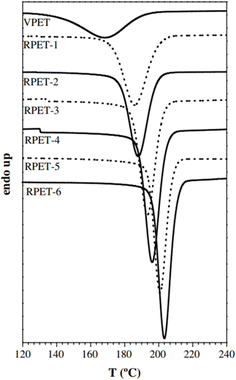 | ||
| Fig. 42 DSC curves of PET during the first cooling cycle.209 Reproduced with permission from the publisher Elsevier. | ||
Thermal analysis has also been applied for the investigation of the onset oxidation peak (OOP), which is a method for the determination of the thermo-oxidative stability of a polymeric material. The procedure follows the ASTM E2009 standard and involves heating the sample at a constant heating rate and registering the temperature when the first exothermic peak appears.216 Specifically, Jabarin and Lofgren120 analyzed the degradation of PET under an air environment. Several PET samples were vacuum dried and kept at a fixed melting temperature in an air atmosphere. This study reported the (absolute) enthalpy difference (ΔH) for oxidative degradation and its evolution with time. As shown in Fig. 43, an S shape was obtained, with a higher induction time if the melting temperature was higher.
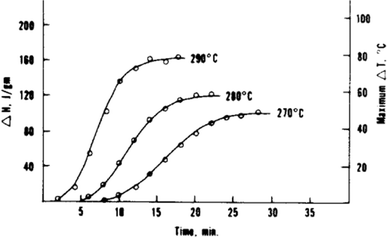 | ||
| Fig. 43 DSC enthalpy data regarding the exothermic peak of PET. The measurements were conducted in isothermal mode for a certain time. The curves are parametric to the melting temperature.120 Reproduced with permission from the publisher John Wiley and Sons. | ||
Analysis of the oxidative offset has also been recently performed for copolyesters, as shown by Trossaert et al.,217 considering PETM and PETg. The oxidation onset temperature (OOT) was found by analysing the DSC signal from the TGA instrument. Fig. 44 (left) shows the relevant part of the DSC curves for PETM. It is clear that the OOT was lower when the sample was exposed to a longer residence time in the extruder. The difference between the pellet and the processed samples is the most striking. The reason for the decrease in OOT can be the presence of shorter chains as result of a longer processing time. In fact, more chain ends are present, and oxygen has more easily accessible sites to attack functional groups prone to oxidation, for instance alcohol groups. Shorter chains also lead to higher chain mobility as a whole, which results in higher reactivity.
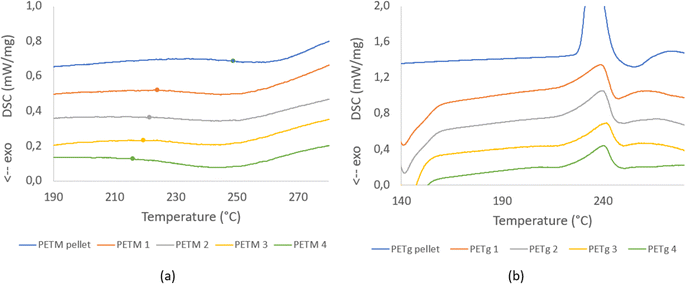 | ||
| Fig. 44 DSC curves for TGA analysis of PETM (a) and PETg (b) sample residence time with the oxidation onset temperature highlighted based on Trossaert et al.217 Both subplots are reproduced in open access redistribution mode. | ||
In the case of PETg, as shown in Fig. 44 (right), the DSC signal was more complex. Given that PETg is a crystalline material, an exothermal cold crystallization peak (left side of the graph) and a melt peak appeared. A drop in the signal is visible just after melting. This means that the OOT occurs at approximately the same time or just after melting. Although no OOT could be determined, a slight trend is visible upon looking at the graph. In the case of pellets, a large drop is situated after the melt peak. However, this drop becomes smaller with an increase in the residence time. Moreover, the melt peak seems to be smaller if the residence time increases. This implies that once the residence time increases, the OOT moves to lower temperatures and has a larger overlap with the melt peak. Thus, the melt peak is somewhat compensated, resulting in a smaller endothermal peak.217
Mechanical properties
Besides rheological and thermal properties, mechanical properties are also important. An overview of the important mechanical properties of PET is presented in Table 7. Depending on the grade of PET, e.g. the presence of comonomers, its mechanical properties can vary, providing more or less stiffness to the material and determining its further applications.| Property | Test method | Value (unit) | References |
|---|---|---|---|
| Breaking strength | Tensile | 50 (MPa) | 218 |
| Tensile strength (Young's modulus) | 1700 (MPa) | 218 | |
| Yield strain | Tensile | 4% | 218 |
| Impact strength | ASTM D256-86 | 90 (J m−1) | 218 |
| Heat of fusion | DSC | 166 (J g−1) | 219 |
| Breaking strength | Tensile | 50 (MPa) | 218 |
| Tensile strength (Young's modulus) | 1700 (MPa) | 218 | |
| Yield strain | Tensile | 4% | 218 |
| Impact strength | ASTM D256-86 | 90 (J m−1) | 218 |
Importantly, to explain most of the properties in this table, a link to lower-scale phenomena is required. Hence, to understand the evolution of the mechanical properties during the simulated extrusion of PET, i.e. repetitive processing, it is necessary to also consider the micro-scale (e.g. crystallinity) and molecular (e.g. chain length) variations.
For example, Badia et al.209 observed a strong increase in the degree of crystallinity during consecutive extrusion cycles for PET, leading to significant embrittlement and complete loss of its plastic deformation properties after four reprocessing cycles. A related example is the variation in the mechanical properties by hydrolytic degradation, leading to chain scission and a decrease in Mn. Due to this degradation, the crystallinity increases, which makes the material more brittle.220
Similarly, as shown in Fig. 45, La Mantia et al.108 reported that together with a decrease in Mm, the elongation at break (EB) diminishes. In addition, Frounchi221 showed that the tensile properties and the impact resistance are affected by degradation with multiple reprocessing in a twin-screw extruder. This author specifically observed more than 50% decrease in Mm (mass average molar mass; also known as Mw) for 5 reprocessing cycles, and a 10% and 12% decrease in the tensile strength and impact strength, respectively.
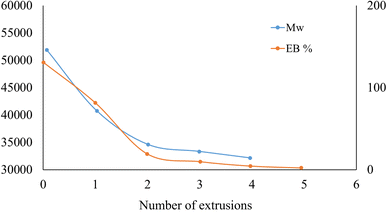 | ||
| Fig. 45 Mass average molar mass (or molecular weight; Mw) and elongation (EB) at break after different extrusion cycles for PET. Data to construct the figure were taken from La Mantia et al.108 | ||
The opposite trend for crystallinity, i.e. a decrease with more recycling, and the same trend for the tensile properties, i.e. loss of tensile strength, was reported by Müller et al.222 for PCW beverage PET bottles. The authors reprocessed virgin pellets and shredded bottles via injection molding under the same conditions and compared the average molar mass, crystallinity with a link to crystallite size and transparency, as well as the tensile properties. The authors observed a 30% smaller value for the average molar mass and a 50% smaller stress at break for the recycled material. Furthermore, brittle behavior for the virgin specimens in contrast to the ductile behavior of the recycled specimens was observed, which was linked to the now opposite evolution of crystallinity. The authors emphasized that the virgin material was initially more crystalline than the post-consumer material due to their different grades. This highlights once again the broadness of the properties that can be achieved for PET.
In addition, Giannotta et al.223 and Torres et al.224 mentioned that contaminants such as PVC and adhesives play a significant role in the material properties of recycled PET. In particular, Giannotta et al.223 listed several factors that can affect the crystallization of PCW PET, as follows: (i) the presence of impurities and increased content of cyclic or linear oligomers, which act as nucleating agents,225 (ii) a decrease in IV and average molar mass, (iii) different thermal and mechanical histories, with the scraps coming from bottles crystallized by mechanical stretching, and the pellets crystallized by heating, (iv) the presence of residual moisture coming in the shape of scraps, and (v) the molecular orientation of the material during injection molding. Specifically, PCW PET, being more contaminated than post-industrial PET, is more sensitive to thermal and hydrolytic degradation, leading to a decrease in IV and average molar mass. This facilitates the spherulitic crystallization of PCW PET, which strongly reduces the elongation at break and the impact strength.
It should be reminded that for the recycling of PCW, the influence of photo-oxidative and hydrolytic degradation needs to be assessed. In this scope, the effect on the PET morphology after UV aging was investigated by Feng et al.,226 who compared the aging of PET with polypropylene and poly(vinyl chloride) through SEM imaging. Increasing the UV irradiation time revealed the physical changes on the surface of the plastics, especially after 84 to 168 days. On the PET surface, the formation of pits, flakes and adhering particles was observed, and hence plastic fragmentation occurred.226 Another example is the increase in crystallinity reported by Panowicz et al.,86 as discussed before in the context of thermo-oxidative degradation, inducing an increase in Young's modulus and a decrease in elongation at break.
Conclusions
Poly(ethylene terephthalate) (PET) is an important polymer in society. Thus, considering its circular use, it is paramount to establish guidelines to decide the most suitable recycling technology. It is essential to establish the boundaries within which mechanical-recycled solutions are fit for use in a variety of applications. Although mechanical recycling is a lower energy process compared to chemical recycling, it is less well-suited to process hard to recycle inputs and the quality of the outputs may not match that of chemically recycled solutions, specifically for multiple recycling generations.The present overview focused on the impact of chemical modifications on PET and polyester materials in general during their (re)processing under melt conditions, ideally in a (lab) extruder with a limited disturbance of contaminations. It was demonstrated that molecular scale variations need to be mapped and preferably linked to variations at the material or application scale. The consideration of a detailed reaction scheme is strongly recommended, considering that degradation reactions not only alter the chain lengths but also the functional groups and potentially the topology of the chains. Depending on the environment and contact time, a wide spectrum of degradation reactions can be active, with influence from temperature, UV light and moisture. Specifically, chain repair relies on the presence of the correct functional groups and chain length reductions should not be too severe to enable more efficient mechanical recycling.
It was explained under which circumstances which reactions (pathways) are dominant and how a consecutive number of extrusion cycles can have an impact on the key molecular and macroscopic parameters defining the polymer material under investigation. Model-based design was proposed as an interesting platform to identify all these variations and facilitate the identification of the optimal processing conditions. The main challenge remaining is the reliable determination of the (input) kinetic parameters at the level of the elementary reaction, given that most current kinetic studies only report the apparent or lumped kinetic parameters. Also, it will be interesting to connect the chemical changes to the material changes to enable a more science-driven evaluation of the best (mechanical) recycling technology.
A follow-up contribution will situate the findings of the present work in a more general industrial framework, in which the emphasis is also the role of contaminants as well as the overall mechanical recycling process, from pre-treatment to finishing, and thus beyond the melt-based processing sections only. Overall, both contributions aim at a representative reflection of the state of the art for polyester mechanical recycling technology, acknowledging both chemistry and transport phenomena, as well as addressing lower and higher Technology Readiness Levels (TRLs).
List of abbreviations
| ABS | Acrylonitrile Butadiene Styrene Polymer |
| ASTM | American Society For Testing And Materials |
| BDB | Butylene Dibenzoate |
| BHET | Bishydroxyethyl Terephthalate |
| CAGR | Compound Annual Growth Rate |
| CF | Carbon Footprint |
| CFD | Computational Fluid Dynamic |
| CHDM | 1,4-Cyclohexanedimethanol |
| C-PET | PET Modified With A Crosslinking Agent |
| DEG | Diethylene Glycol |
| DFT | Density Functional Theory |
| DMT | Dimethyl Terephthalate |
| DSC | Differential Scanning Calorimetry |
| EB | Elongation At Break |
| EDB | Ethylene Dibenzoate |
| EG | Ethylene Glycol |
| FTIR | Fourier Transform Infrared Spectroscopic |
| GO | Graphene Oxide |
| GPC | Gel Permeation Chromatography |
| HDPE | High Density Polyethylene |
| HFIP | 1,1,1,3,3,3-Hexafluoroisopropanol |
| IPA | Isophthalic Acid |
| IV | Intrinsic Viscosity |
| LCA | Life Cycle Assessment |
| LCB-PET | PET Modified With Long Chain Branches Via Reactive Extrusion |
| LDPE | Low Density Polyethylene |
| L-PET | Linear PET |
| MFI | Melt Flow Index |
| MFR | Melt Flow Rate |
| MHET | Mono(2-Hydroxyethyl) Terephthalate |
| MHETase | Enzyme For The Hydrolysis Of MHET |
| NMR | Nuclear Magnetic Resonance |
| OECD | Organization For Economic Cooperation And Development |
| OOP | Onset Oxidation Peak |
| PBT | Polybutylene Terephthalate |
| PCL | Poly(Caprolactone) |
| PCT | CHDM-Modified PET |
| PCTA | CHDM-Modified PET Modified With IPA |
| PCW | Post-Consumer Waste |
| PET | Poly(Ethylene Terephthalate) |
| PET-btg | Bottle Grade PET |
| PETG | Polyethylene Terephthalate Glycol |
| PETg | PETG Grade With Low Amount Of Modifications |
| PETM | Modified Polyethylene Terephthalate |
| PIW | Post-Industrial Waste |
| PLA | Poly(Lactic Acid) |
| PPC | Poly(Propylene Carbonate) |
| PS | Polystyrene |
| PS | Polystyrene |
| RH | Relative Humidity |
| rPET | Recycled PET |
| RPET-5 | PET Reprocessed For 5 Times |
| SAOS | Small Amplitude Oscillatory Sweep |
| SEC | Size Exclusion Chromatography |
| SSP | Solid-State Polymerization |
| TGA | Thermogravimetric Analysis |
| THF | Tetrahydrofuran |
| TMCD | 2,2,4,4-Tetramethyl-1,3-Cyclobutanediol |
| TMP | Trimethylolpropane |
| TPA | Terephthalic Acid |
| TRLs | Technology Readiness Levels |
| TRMS | Time-Resolved Mechanical Spectroscopy |
| VPET | Virgin PET |
| xGnP | Exfoliated Graphite |
Data availability
As this is a review article, data are reported as available in literature.Conflicts of interest
There are no conflicts to declare.Acknowledgements
C. F. and H. O. acknowledge the agency for Flanders Innovation & Entrepreneurship (VLAIO) via the Green AM project. L. T. acknowledges the Research Foundation – Flanders (FWO) via a scholarship: FWO.SPB.2021.0036.01. D. R. D. acknowledges FWO via the project G027122N.References
- Polyethylene Terephthalate Market Size Analysis Report, 2025, https://www.grandviewresearch.com/industry-analysis/polyethylene-terephthalate-market, accessed 8 January 2024.
- PET Bottles Market, https://www.transparencymarketresearch.com/pet-bottles-market.html, accessed 23 July 2024.
- J. A. Glaser, E. Sahle-Demessie and L. R. Teri, Are reliable and emerging technologies available for plastic recycling in a circular economy?, Waste Material Recycling in the Circular Economy-Challenges and Developments, 2022 Search PubMed.
- H. K. Webb, J. Arnott, R. J. Crawford and E. P. Ivanova, Polymers, 2012, 5, 1–18 CrossRef.
- T. Grossetête, A. Rivaton, J. L. Gardette, C. E. Hoyle, M. Ziemer, D. R. Fagerburg and H. Clauberg, Polymer, 2000, 41, 3541–3554 CrossRef.
- T. Meyer and J. T. F. Keurentjes, Handbook of Polymer Reaction Engineering, Wiley-VCH Verlag, 2005 Search PubMed.
- F. Awaja and D. Pavel, Eur. Polym. J., 2005, 41, 1453–1477 CrossRef CAS.
- J. M. Asua, Polym. React. Eng., 2008, 1–367 Search PubMed.
- B. J. Holland and J. N. Hay, Analysis of comonomer content and cyclic oligomers of poly(ethylene terephthalate), Polymer, 2002, 1797–1804 CrossRef CAS.
- S. R. Turner, J. Polym. Sci., Part A: Polym. Chem., 2004, 42, 5847–5852 CrossRef CAS.
- W. Romao, M. F. Franco, Y. E. Corilo, M. N. Eberlin, M. A. S. Spinace and M.-A. De Paoli, Polym. Degrad. Stab., 2009, 94, 1849–1859 CrossRef CAS.
- H. A. Lecomte and J. J. Liggat, Polym. Degrad. Stab., 2006, 91, 681–689 CrossRef CAS.
- S. R. Turner, J. Polym. Sci., Part A: Polym. Chem., 2004, 42, 5847–5852 CrossRef CAS.
- S. Fakirov, I. Seganov and E. Kurdowa, Die Makromolekulare Chem. Macromol. Chem. Phys., 1981, 182, 185–197 CrossRef CAS.
- S. G. Hovenkamp and J. P. Munting, J. Polym. Sci., Part A-1: Polym. Chem., 1970, 8, 679–682 CrossRef CAS.
- C. Fiorillo, H. Ohnmacht, P. Reyes, P. H. M. Van Steenberge, L. Cardon, D. R. D'hooge and M. Edeleva, Polym. Degrad. Stab., 2023, 217, 110511 CrossRef CAS.
- N. Vidakis, M. Petousis, L. Tzounis, A. Maniadi, E. Velidakis, N. Mountakis and J. D. Kechagias, Materials, 2021, 14, 466 CrossRef CAS.
- European Green Deal: Putting an end to wasteful packaging, https://ec.europa.eu/commission/presscorner/detail/en/ip_22_7155, accessed 8 January 2024.
- F. Awaja and D. Pavel, Eur. Polym. J., 2005, 41, 1453–1477 CrossRef CAS.
- Plastic pollution is growing relentlessly as waste management and recycling fall short, says OECD, https://www.oecd.org/environment/plastic-pollution-is-growing-relentlessly-as-waste-management-and-recycling-fall-short.htm, accessed 8 January 2024.
- A. Siddiqua, J. N. Hahladakis and W. A. K. A. Al-Attiya, Environ. Sci. Pollut. Res., 2022, 29, 58514–58536 CrossRef PubMed.
- A. Asadi, M. Miller, R. J. Moon and K. Kalaitzidou, Improving the interfacial and mechanical properties of short glass fiber/epoxy composites by coating the glass fibers with cellulose nanocrystals, eXPRESS Polym. Lett., 2016, 587–597 CrossRef CAS.
- Y.-H. V. Soong, M. J. Sobkowicz and D. Xie, Bioengineering, 2022, 9, 98 CrossRef CAS PubMed.
- A. Vozniak, R. Hosseinnezhad, I. Vozniak and A. Galeski, Sustainable Mater. Technol., 2024, 40, e00886 CrossRef CAS.
- M. H. Ghasemi, N. Neekzad, F. B. Ajdari, E. Kowsari and S. Ramakrishna, Environ. Sci. Pollut. Res., 2021, 28, 43074–43101 CrossRef CAS PubMed.
- S. M. Al-Salem, P. Lettieri and J. Baeyens, Waste Manage., 2009, 29, 2625–2643 CrossRef CAS PubMed.
- N. Singh, D. Hui, R. Singh, I. P. S. Ahuja, L. Feo and F. Fraternali, Composites, Part B, 2017, 115, 409–422 CrossRef CAS.
- E. Barnard, J. J. R. Arias and W. Thielemans, Green Chem., 2021, 23, 3765–3789 RSC.
- A. Aguado, L. Martínez, L. Becerra, M. Arieta-Araunabeña, S. Arnaiz, A. Asueta and I. Robertson, J. Mater. Cycles Waste Manage., 2014, 16, 201–210 CrossRef CAS.
- M. Han, in Recycling of Polyethylene Terephthalate Bottles, Elsevier, 2019, pp. 85–108 Search PubMed.
- R. D. Allen and M. I. James, in Circular Economy of Polymers: Topics in Recycling Technologies, ACS Publications, 2021, pp. 61–80 Search PubMed.
- D. E. Nikles and M. S. Farahat, Macromol. Mater. Eng., 2005, 290, 13–30 CrossRef CAS.
- K. Ragaert, L. Delva and K. Van Geem, Waste Manage., 2017, 69, 24–58 CrossRef CAS.
- C. Nerìn, J. Albiñana, M. R. Philo, L. Castle, B. Raffael and C. Simoneau, Food Addit. Contam., 2003, 20, 668–677 CrossRef.
- D. Damayanti and H.-S. Wu, Polymers, 2021, 13, 1475 CrossRef PubMed.
- P. Benyathiar, P. Kumar, G. Carpenter, J. Brace and D. K. Mishra, Polymers, 2022, 14, 2366 CrossRef CAS PubMed.
- D. Paszun and T. Spychaj, Ind. Eng. Chem. Res., 1997, 36, 1373–1383 CrossRef CAS.
- I. Taniguchi, S. Yoshida, K. Hiraga, K. Miyamoto, Y. Kimura and K. Oda, ACS Catal., 2019, 9, 4089–4105 CrossRef CAS.
- S. Joo, I. J. Cho, H. Seo, H. F. Son, H.-Y. Sagong, T. J. Shin, S. Y. Choi, S. Y. Lee and K.-J. Kim, Nat. Commun., 2018, 9, 382 CrossRef PubMed.
- E. Barnard, J. J. R. Arias and W. Thielemans, Green Chem., 2021, 23, 3765–3789 RSC.
- N. Torres, J. J. Robin and B. Boutevin, Eur. Polym. J., 2000, 36, 2075–2080 CrossRef CAS.
- M. K. Eriksen, J. D. Christiansen, A. E. Daugaard and T. F. Astrup, Waste Manage., 2019, 96, 75–85 CrossRef CAS PubMed.
- A. Elamri, K. Zdiri, O. Harzallah and A. Lallam, Polyethylene Terephthalate: Uses, Properties and Degradation.
- T. Liu, X. Gu, J. Wang and L. Feng, Chem. Eng. Process., 2019, 135, 217–226 CrossRef CAS.
- R. M. R. Wellen and M. S. Rabello, J. Mater. Sci., 2005, 40, 6099–6104 CrossRef CAS.
- R. C. Roberts, Polymer, 1969, 10, 117–125 CrossRef CAS.
- Z. Bashir, I. Al-Aloush, I. Al-Raqibah and M. Ibrahim, Polym. Eng. Sci., 2000, 40, 2442–2455 CrossRef CAS.
- S. N. Vouyiouka, V. Filgueiras, C. D. Papaspyrides, E. L. Lima and J. C. Pinto, J. Appl. Polym. Sci., 2012, 124, 4457–4465 CrossRef CAS.
- J. E. Mark, Polymer Data Handbook, Oxford University Press, New York, 1999 Search PubMed.
- N. B. Sanches, M. L. Dias and E. B. A. V. Pacheco, Polym. Test., 2005, 24, 688–693 CrossRef CAS.
- C. W. Chen, P. H. Liu, F. J. Lin, C. J. Cho, L. Y. Wang, H. I. Mao, Y. C. Chiu, S. H. Chang, S. P. Rwei and C. C. Kuo, J. Polym. Environ., 2020, 28, 2880–2892 CrossRef CAS.
- S. Makkam and W. Harnnarongchai, Energy Procedia, 2014, 56, 547–553 CrossRef CAS.
- S. Farah, T. Tsach, A. Bentolila and A. J. Domb, Talanta, 2014, 123, 54–62 CrossRef CAS.
- S. H. Park and S. H. Kim, Fash. Text., 2014, 1, 1–17 CrossRef.
- W. Thodsaratpreeyakul, P. Uawongsuwan and T. Negoro, Mater. Sci. Appl., 2018, 9, 174–190 CAS.
- M. Del Mar Castro López, A. I. Ares Pernas, M. J. Abad López, A. L. Latorre, J. M. López Vilariño and M. V. González Rodríguez, Mater. Chem. Phys., 2014, 147, 884–894 CrossRef.
- M. R. Milana, M. Denaro, L. Arrivabene, A. Maggio and L. Gramiccioni, Food Addit. Contam., 1998, 15, 355–361 CrossRef CAS PubMed.
- A. Gooneie, P. Simonetti, K. A. Salmeia, S. Gaan, R. Hufenus and M. P. Heuberger, Polym. Degrad. Stab., 2019, 160, 218–228 CrossRef CAS.
- S. Japon, Y. Leterrier and J. A. E. Månson, Polym. Eng. Sci., 2000, 40, 1942–1952 CrossRef CAS.
- M. Xanthos, R. Dhavalikar, V. Tan, S. K. Dey and U. Yilmazer, J. Reinf. Plast. Compos., 2001, 20, 786–793 CrossRef CAS.
- S. Yao, T. Guo, T. Liu, Z. Xi, Z. Xu and L. Zhao, J. Appl. Polym. Sci., 2020, 137, 49268 CrossRef CAS.
- Ł. Pyrzowski and M. Miśkiewicz, International Multidisciplinary Scientific GeoConference: SGEM, 2017, 17, pp. 9–16 Search PubMed.
- T. Y. Liu, P. Y. Xu, D. Huang, B. Lu, Z. C. Zhen, W. Z. Zheng, Y. C. Dong, X. Li, G. X. Wang and J. H. Ji, J. Hazard. Mater., 2023, 446, 130670 CrossRef CAS PubMed.
- H. Ohnmacht, L. Trossaert, M. Edeleva, D. D'hooge and L. Cardon, Faculty of Engineering and Architecture Research Symposium 2022 (FEARS 2022), Abstracts, DOI:10.5281/ZENODO.7400513.
- K. Wang, J. Shen, Z. Ma, Y. Zhang, N. Xu and S. Pang, Polymers, 2021, 13, 452 CrossRef CAS PubMed.
- K. Matyjaszewski and M. Möller, Controlled and living polymerizations: from mechanisms to applications, John Wiley & Sons, 2009 Search PubMed.
- G. J. P. Bex, B. L. J. Ingenhut, T. ten Cate, M. Sezen and G. Ozkoc, Polym. Compos., 2021, 42, 4253–4264 CrossRef CAS.
- J. Kaiser and C. Bonten, AIP Conf. Proc., 2020, 2289(1) DOI:10.1063/5.0028415/597929.
- E. García, P. J. Núñez, M. A. Caminero, J. M. Chacón and S. Kamarthi, Composites, Part B, 2022, 235, 109766 CrossRef.
- F. Adrian Rodriguez Lorenzana, D. Espalin, C. Yirong Lin, A. Lopes and S. L. Crites, Thermal characterization of abs/carbon fiber, abs/glass fiber and petg/glass fiber reinforced composites used in large area additive manufacturing, Master's thesis, The University of Texas at El Paso, 2019.
- Y. Zhou, J. G. P. Goossens, R. P. Sijbesma and J. P. A. Heuts, Macromolecules, 2017, 50, 6742–6751 CrossRef CAS.
- S. Bhagia, K. Bornani, S. Ozcan and A. J. Ragauskas, ChemistryOpen, 2021, 10, 830–841 CrossRef CAS PubMed.
- I. Pillin, S. Pimbert, J. F. Feller and G. Levesque, Polym. Eng. Sci., 2001, 41, 178–191 CrossRef CAS.
- S. V. Levchik and E. D. Weil, Polym. Int., 2005, 54, 11–35 CrossRef CAS.
- Isophthalic Acid - Chemical Economics Handbook (CEH) | S&P Global, https://www.spglobal.com/commodityinsights/en/ci/products/isophthalic-acid-chemical-economics-handbook.html, accessed 9 January 2024.
- J. Zhang, J. Appl. Polym. Sci., 2004, 91, 1657–1666 CrossRef CAS.
- Characteristics of Triexta PTT Carpet Fiber, https://www.thespruce.com/triexta-ptt-carpet-fiber-2908799, accessed 9 January 2024.
- D. P. R. Kint and S. Muñoz-Guerra, Modification of the thermal properties and crystallization behaviour of poly (ethylene terephthalate) by copolymerization, Wiley Online Library, 2003 Search PubMed.
- B. Demirel, A. Yaraş and H. Elcicek, Crystallization behavior of PET materials, 2011 Search PubMed.
- K. Pang, R. Kotek and A. Tonelli, Prog. Polym. Sci., 2006, 31, 1009–1037 CrossRef CAS.
- M. Konstantopoulou, Z. Terzopoulou, M. Nerantzaki, J. Tsagkalias, D. S. Achilias, D. N. Bikiaris, S. Exarhopoulos, D. G. Papageorgiou and G. Z. Papageorgiou, Eur. Polym. J., 2017, 89, 349–366 CrossRef CAS.
- F. Hannay, Rigid Plastics Packaging: Materials, Processes and Applications, iSmithers Rapra Publishing, 2002, vol. 151 Search PubMed.
- H. C. A. Lim, in Brydson's Plastics Materials, Elsevier, 2017, pp. 527–543 Search PubMed.
- T. Chen, W. Zhang and J. Zhang, Polym. Degrad. Stab., 2015, 120, 232–243 CrossRef CAS.
- B. Fayolle, L. Audouin and J. Verdu, Polym. Degrad. Stab., 2000, 70, 333–340 CrossRef CAS.
- R. Panowicz, M. Konarzewski, T. Durejko, M. Szala, M. Łazińska, M. Czerwińska and P. Prasuła, Materials, 2021, 14, 3833 CrossRef CAS PubMed.
- J. L. Gardette, A. Colin, S. Trivis, S. German and S. Therias, Polym. Degrad. Stab., 2014, 103, 35–41 CrossRef CAS.
- S. A. Jenekhe, J. W. Lin and B. Sun, Thermochim. Acta, 1983, 61, 287–299 CrossRef CAS.
- J. Huang, H. Meng, X. Luo, X. Mu, W. Xu, L. Jin and B. Lai, Chemosphere, 2022, 291, 133112 CrossRef CAS PubMed.
- H. Zimmerman and N. T. Kim, Polym. Eng. Sci., 1980, 20, 680–683 CrossRef CAS.
- I. Marshall and A. Todd, The thermal degradation of polyethylene terephthalate, Trans. Faraday Soc., 1953, 67–78 RSC.
- D. V. A. Ceretti, M. Edeleva, L. Cardon and D. R. D’hooge, Molecules, 2023, 28, 2344 CrossRef CAS PubMed.
- T. M. Kruse, S. Woo and L. J. Broadbelt, Detailed mechanistic modeling of polymer degradation: application to polystyrene, Chem. Eng. Sci., 2001, 971–979 CrossRef CAS.
- S. Foti, M. Giuffrida, P. Maravigna and G. Montaudo, J. Polym. Sci., Polym. Chem. Ed., 1984, 22, 1217–1229 CrossRef CAS.
- I. Lüderwald, Pure Appl. Chem., 1982, 54, 255–265 CrossRef.
- K. Yoda, A. Tsuboi, M. Wada and R. Yamadera, J. Appl. Polym. Sci., 1970, 14, 2357–2376 CrossRef.
- I. C. McNeill and M. Bounekhel, Polym. Degrad. Stab., 1991, 34, 187–204 CrossRef CAS.
- G. Montaudo, C. Puglisi and F. Samperi, Polym. Degrad. Stab., 1993, 42, 13–28 CrossRef CAS.
- F. Samperi, C. Puglisi, R. Alicata and G. Montaudo, Polym. Degrad. Stab., 2004, 83, 11–17 CrossRef CAS.
- R. Assadi, X. Colin and J. Verdu, Polymer, 2004, 45, 4403–4412 CrossRef CAS.
- B. J. Holland and J. N. Hay, Polymer, 2002, 43, 1835–1847 CrossRef CAS.
- W. Romao, M. F. Franco, Y. E. Corilo, M. N. Eberlin, M. A. S. Spinace and M.-A. De Paoli, Polym. Degrad. Stab., 2009, 94, 1849–1859 CrossRef CAS.
- J. D. Badia, A. Martinez-Felipe, L. Santonja-Blasco and A. Ribes-Greus, J. Anal. Appl. Pyrolysis, 2013, 99, 191–202 CrossRef CAS.
- H. Wu, S. Lv, Y. He and J.-P. Qu, Polym. Test., 2019, 77, 105882 CrossRef CAS.
- M. A. S. Spinacé and M. A. De Paoli, J. Appl. Polym. Sci., 2001, 80, 20–25 CrossRef.
- K. Weisskopf, J. Polym. Sci., Part A: Polym. Chem., 1988, 26, 1919–1935 CrossRef CAS.
- Z. O. G. Schyns and M. P. Shaver, Macromol. Rapid Commun., 2021, 42, 2000415 CrossRef CAS PubMed.
- F. P. La Mantia, Recycling of PVC and Mixed Plastic Waste. Chem Tec Publishing, 1996, pp. 63–76 Search PubMed.
- H. Jin, J. Gonzalez-Gutierrez, P. Oblak, B. Zupančič and I. Emri, Polym. Degrad. Stab., 2012, 97, 2262–2272 CrossRef CAS.
- P. Oblak, J. Gonzalez-Gutierrez, B. Zupančič, A. Aulova and I. Emri, Polym. Degrad. Stab., 2015, 114, 133–145 CrossRef CAS.
- A. V Shenoy, S. Chattopadhyay and V. M. Nadkarni, Rheol. Acta, 1983, 22, 90–101 CrossRef.
- W. R. Waldman and M. A. De Paoli, Polym. Degrad. Stab., 1998, 60, 301–308 CrossRef CAS.
- F. Cruz, S. Lanza, H. Boudaoud, S. Hoppe and M. Camargo, in 2015 International Solid Freeform Fabrication Symposium, University of Texas at Austin, 2015 Search PubMed.
- F. Bueche, J. Appl. Polym. Sci., 1960, 4, 101–106 CrossRef CAS.
- S. J. Blanksby and G. B. Ellison, Acc. Chem. Res., 2003, 36, 255–263 CrossRef CAS PubMed.
- V. B. Oyeyemi, J. M. Dieterich, D. B. Krisiloff, T. Tan and E. A. Carter, J. Phys. Chem. A, 2015, 119, 3429–3439 CrossRef CAS PubMed.
- A. B. Bestul, Rubber Chem. Technol., 1960, 33, 909–920 CrossRef.
- G. Botelho, A. Queirós, S. Liberal and P. Gijsman, Polym. Degrad. Stab., 2001, 74, 39–48 CrossRef CAS.
- I. Marshall and A. Todd, Trans. Faraday Soc., 1953, 49, 67–78 RSC.
- S. A. Jabarin and E. A. Lofgren, Polym. Eng. Sci., 1984, 24, 1056–1063 CrossRef.
- C. F. L. Ciolacu, N. Roy Choudhury and N. K. Dutta, Polym. Degrad. Stab., 2006, 91, 875–885 CrossRef.
- M. Edge, R. Wiles, N. S. Allen, W. A. McDonald and S. V Mortlock, Polym. Degrad. Stab., 1996, 53, 141–151 CrossRef CAS.
- S. A. Jabbarin, Polymeric Materials Encyclopaedia, 1996, 8, 6114 Search PubMed.
- A. M. C. de Souza, D. S. Leprêtre, N. R. Demarquette, M.-F. Lacrampe and P. Krawczak, J. Appl. Polym. Sci., 2010, 116, 3525–3533 CrossRef.
- W. Romão, M. F. Franco, Y. E. Corilo, M. N. Eberlin, M. A. S. Spinacé and M. A. De Paoli, Polym. Degrad. Stab., 2009, 94, 1849–1859 CrossRef.
- J. D. Badia, A. Martinez-Felipe, L. Santonja-Blasco and A. Ribes-Greus, J. Anal. Appl. Pyrolysis, 2013, 99, 191–202 CrossRef CAS.
- P. Das and P. Tiwari, Thermochim. Acta, 2019, 679, 178340 CrossRef.
- Z. O. G. Schyns, A. D. Patel and M. P. Shaver, Resour., Conserv. Recycl., 2023, 198, 107170 CrossRef CAS.
- M. Abboudi, A. Odeh and K. Aljoumaa, Toxicol. Environ. Chem., 2016, 98, 167–178 CrossRef CAS.
- M. Niaounakis, Management of Marine Plastic Debris, 2017, 127–142 Search PubMed.
- J. F. Rabek and J. F. Rabek, Photostabilization of Polymers: Priciples and Applications, 1990, 1–41 Search PubMed.
- M. Abboudi and A. Odeh, J. Water Supply: Res. Technol.--AQUA, 2015, 64, 149–156 CrossRef.
- M. Day and D. M. Wiles, J. Appl. Polym. Sci., 1972, 16, 203–215 CrossRef CAS.
- J. Scheirs and J.-L. Gardette, Polym. Degrad. Stab., 1997, 56, 339–350 CrossRef CAS.
- R. B. Fox, T. R. Price, R. F. Cozzens and J. R. McDonald, J. Chem. Phys., 1972, 57, 534–541 CrossRef CAS.
- S. Yano and M. Murayama, Polym. Photochem., 1981, 1, 177–190 CrossRef CAS.
- J. E. Potts, Encyclopedia of Chemical Technology, 1984, p. 626 Search PubMed.
- S. Li, J. Biomed. Mater. Res., 1999, 48, 342–353 CrossRef CAS.
- C. Sammon, J. Yarwood and N. Everall, Polym. Degrad. Stab., 2000, 67, 149–158 CrossRef CAS.
- L. N. Woodard and M. A. Grunlan, ACS Macro Lett., 2018, 7, 976–982 CrossRef CAS.
- M. D. Rowe, E. Eyiler and K. B. Walters, Polym. Test., 2016, 52, 192–199 CrossRef CAS.
- T. El Darai, A. Ter-Halle, M. Blanzat, G. Despras, V. Sartor, G. Bordeau, A. Lattes, S. Franceschi, S. Cassel and N. Chouini-Lalanne, Green Chem., 2024 Search PubMed.
- D. Carta, G. Cao and C. D'Angeli, Environ. Sci. Pollut. Res., 2003, 10, 390–394 CrossRef CAS.
- A. K. Urbanek, K. E. Kosiorowska and A. M. Mirończuk, Front. Bioeng. Biotechnol., 2021, 9, 771133 CrossRef PubMed.
- R. Brackmann, C. de Oliveira Veloso, A. M. de Castro and M. A. P. Langone, 3 Biotech, 2023, 13, 135 CrossRef.
- F. Degli-Innocenti, T. Breton, S. Chinaglia, E. Esposito, M. Pecchiari, A. Pennacchio, A. Pischedda and M. Tosin, Biodegradation, 2023, 1–30 Search PubMed.
- N. F. S. Khairul Anuar, F. Huyop, G. Ur-Rehman, F. Abdullah, Y. M. Normi, M. K. Sabullah and R. Abdul Wahab, Int. J. Mol. Sci., 2022, 23, 12644 CrossRef CAS.
- J. Kaushal, M. Khatri and S. K. Arya, Clean. Eng. Technol., 2021, 2, 100083 CrossRef.
- R. Gao, H. Pan and J. Lian, Enzyme Microb. Technol., 2021, 150, 109868 CrossRef CAS.
- S. N. Dimassi, J. N. Hahladakis, M. N. D. Yahia, M. I. Ahmad, S. Sayadi and M. A. Al-Ghouti, J. Hazard. Mater., 2023, 447, 130796 CrossRef CAS.
- A. Maurya, A. Bhattacharya and S. K. Khare, Front. Bioeng. Biotechnol., 2020, 8, 602325 CrossRef PubMed.
- R.-J. Mueller, Process Biochem., 2006, 41, 2124–2128 CrossRef CAS.
- K. N. Fotopoulou and H. K. Karapanagioti, Hazardous Chemicals Associated with Plastics in the Marine Environment, 2019, 71–92 Search PubMed.
- A. Launay, F. Thominette and J. Verdu, Polym. Degrad. Stab., 1994, 46, 319–324 CrossRef CAS.
- W. McMahon, H. A. Birdsall, G. R. Johnson and C. T. Camilli, J. Chem. Eng. Data, 1959, 4, 57–79 CrossRef CAS.
- E. K. C. Moens, K. De Smit, Y. W. Marien, A. D. Trigilio, P. H. M. Van Steenberge, K. M. Van Geem, J. L. Dubois and D. R. D'hooge, Polymers, 2020, 12, 1667 CrossRef CAS PubMed.
- J. Li and S. I. Stoliarov, Polym. Degrad. Stab., 2014, 106, 2–15 CrossRef CAS.
- A. I. Osman, C. Farrell, A. H. Al-Muhtaseb, A. S. Al-Fatesh, J. Harrison and D. W. Rooney, Environ. Sci. Eur., 2020, 32, 1–12 CrossRef.
- S. M. A. Jafari, R. Khajavi, V. Goodarzi, M. R. Kalaee and H. A. Khonakdar, J. Appl. Polym. Sci., 2020, 137, 48466 CrossRef CAS.
- L. K. Nait-Ali, X. Colin and A. Bergeret, Polym. Degrad. Stab., 2011, 96, 236–246 CrossRef CAS.
- M. Härth, J. Kaschta and D. W. Schubert, Macromolecules, 2014, 47, 4471–4478 CrossRef.
- G. Oreski, B. Ottersböck, C. Barretta, P. Christöfl, S. Radl and G. Pinter, Polym. Test., 2023, 108130 CrossRef CAS.
- M. Arhant, M. Le Gall, P. Y. Le Gac and P. Davies, Polym. Degrad. Stab., 2019, 161, 175–182 CrossRef CAS.
- J. H. Jung, M. Ree and H. Kim, Catal. Today, 2006, 115, 283–287 CrossRef CAS.
- J. Li and S. I. Stoliarov, Combust. Flame, 2013, 160, 1287–1297 CrossRef CAS.
- J. M. Encinar and J. F. González, Fuel Process. Technol., 2008, 89, 678–686 CrossRef CAS.
- M. Härth, J. Kaschta and D. W. Schubert, Polym. Degrad. Stab., 2015, 120, 70–75 CrossRef.
- M. Arhant, M. Le Gall, P.-Y. Le Gac and P. Davies, Polym. Degrad. Stab., 2019, 161, 175–182 CrossRef CAS.
- E. J. Lenardão, R. A. Freitag, M. J. Dabdoub, A. C. F. Batista and C. da C. Silveira, Quim. Nova, 2003, 26, 123–129 CrossRef.
- M. D. Tabone, J. J. Cregg, E. J. Beckman and A. E. Landis, Environ. Sci. Technol., 2010, 44, 8264–8269 CrossRef CAS PubMed.
- A. Ncube and Y. Borodin, in 2012 7th International Forum on Strategic Technology (IFOST), IEEE, 2012, pp. 1–6 Search PubMed.
- R. Meys, F. Frick, S. Westhues, A. Sternberg, J. Klankermayer and A. Bardow, Resour., Conserv. Recycl., 2020, 162, 105010 CrossRef.
- A. Dormer, D. P. Finn, P. Ward and J. Cullen, J. Cleaner Prod., 2013, 51, 133–141 CrossRef CAS.
- R. A. Sheldon, Green Chem., 2007, 9, 1273–1283 RSC.
- R. A. Sheldon, Green Chem., 2017, 19, 18–43 RSC.
- S. Fadlallah, P. S. Roy, G. Garnier, K. Saito and F. Allais, Green Chem., 2021, 23, 1495–1535 RSC.
- S. Fadlallah, L. M. M. Mouterde, G. Garnier, K. Saito and F. Allais, in Sustainability & Green Polymer Chemistry Volume 2: Biocatalysis and Biobased Polymers, ACS Publications, 2020, pp. 77–97 Search PubMed.
- H. El Itawi, S. Fadlallah, F. Allais and P. Perré, Green Chem., 2022, 24, 4237–4269 RSC.
- T. Uekert, A. Singh, J. S. DesVeaux, T. Ghosh, A. Bhatt, G. Yadav, S. Afzal, J. Walzberg, K. M. Knauer and S. R. Nicholson, ACS Sustain. Chem. Eng., 2023, 11, 965–978 CrossRef CAS.
- R. Volk, C. Stallkamp, J. J. Steins, S. P. Yogish, R. C. Müller, D. Stapf and F. Schultmann, J. Ind. Ecol., 2021, 25, 1318–1337 CrossRef.
- A. E. Schwarz, T. N. Ligthart, D. G. Bizarro, P. De Wild, B. Vreugdenhil and T. Van Harmelen, Waste Manage., 2021, 121, 331–342 CrossRef CAS PubMed.
- L. Shen, E. Worrell and M. K. Patel, Resour., Conserv. Recycl., 2010, 55, 34–52 CrossRef.
- J. Nakatani, M. Fujii, Y. Moriguchi and M. Hirao, Int. J. Life Cycle Assess., 2010, 15, 590–597 CrossRef CAS.
- T. Osswald and N. Rudolph, Polymer Rheology, Carl Hanser, München, 2015, DOI:10.3139/9781569905234.fm.
- M. R. Mackley and R. P. G. Rutgers, in Rheological Measurement, Springer, 1998, pp. 167–189 Search PubMed.
- G. A. Davies and J. R. Stokes, J. Rheol., 2005, 49, 919–922 CrossRef CAS.
- G. Trotta, B. Stampone, I. Fassi and L. Tricarico, Polym. Test., 2021, 96, 107068 CrossRef CAS.
- M. Kruse, V. H. Rolón-Garrido and M. H. Wagner, in AIP Conference Proceedings, American Institute of Physics, 2013, vol. 1526, pp. 216–229 Search PubMed.
- L. C. Sanchez, C. A. G. Beatrice, C. Lotti, J. Marini, S. H. P. Bettini and L. C. Costa, Int. J. Adv. Manuf. Technol., 2019, 105, 2403–2414 CrossRef.
- D. H. S. Ramkumar and M. Bhattacmya, Steady Shear and Dynamic Properties of Biodegradable Polyesters, 2015 Search PubMed.
- C. Liu, J. He, E. van Ruymbeke, R. Keunings and C. Bailly, Polymer, 2006, 47, 4461–4479 CrossRef CAS.
- H. Münstedt, Soft Matter, 2011, 7, 2273–2283 RSC.
- Z. Yang, C. Xin, W. Mughal, Z. Wang, X. Bai and Y. He, Adv. Polym. Technol., 2018, 37, 2344–2353 CrossRef CAS.
- J. Y. Lee, S. H. Kwon, I.-J. Chin and H. J. Choi, Polym. Bull., 2019, 76, 5483–5497 CrossRef CAS.
- R. Rathner, W. Roland, H. Albrecht, F. Ruemer and J. Miethlinger, Polymers, 2021, 13, 1218 CrossRef CAS PubMed.
- S. A. Cruz, C. H. Scuracchio, L. B. Fitaroni and É. C. Oliveira, Polym. Test., 2017, 60, 236–241 CrossRef CAS.
- J. M. Dealy and J. Wang, Melt Rheology and its Applications in the Plastics Industry, 2013 Search PubMed.
- D. Kanev, E. Takacs and J. Vlachopoulos, Int. Polym. Process., 2007, 22, 395–401 CrossRef CAS.
- P. O. Brunn and J. Vorwerk, Rheol. Acta, 1993, 32, 380–397 CrossRef CAS.
- F. Cruz, S. Lanza, H. Boudaoud, S. Hoppe and M. Camargo, Proceedings - 26th Annual International Solid Freeform Fabrication Symposium - an Additive Manufacturing Conference, SFF, 2020, pp. 1591–1600 Search PubMed.
- V. Peinado, P. Castell, L. García and Á. Fernández, Materials, 2015, 8, 7106–7117 CrossRef CAS.
- M. Kruse and M. H. Wagner, Rheol. Acta, 2016, 55, 789–800 CrossRef CAS.
- A. Bata, G. Toth, D. Nagy and K. Belina, J. Phys.: Conf. Ser., 2018, 1045, 012007 CrossRef.
- M. Bustos Seibert, G. A. Mazzei Capote, M. Gruber, W. Volk and T. A. Osswald, Recycling, 2022, 7, 69 CrossRef.
- S. Yin, R. Tuladhar, F. Shi, R. A. Shanks, M. Combe and T. Collister, Polym. Eng. Sci., 2015, 55, 2899–2909 CrossRef CAS.
- K. S. Seo and J. D. Cloyd, J. Appl. Polym. Sci., 1991, 42, 845–850 CrossRef CAS.
- S. Wang, L. Capoen, D. R. D'hooge and L. Cardon, Plast., Rubber Compos., 2018, 47, 9–16 CrossRef CAS.
- M. A. S. Spinacé and M. A. De Paoli, J. Appl. Polym. Sci., 2001, 80, 20–25 CrossRef.
- J. D. Badia, F. Vilaplana, S. Karlsson and A. Ribes-Greus, Polym. Test., 2009, 28, 169–175 CrossRef CAS.
- T. Villmow, B. Kretzschmar and P. Pötschke, Compos. Sci. Technol., 2010, 70, 2045–2055 CrossRef CAS.
- K. De Smit, T. Wieme, Y. W. Marien, P. H. M. Van Steenberge, D. R. D'hooge and M. Edeleva, React. Chem. Eng., 2022, 7, 245–263 RSC.
- S. M. Al-Salem, P. Lettieri and J. Baeyens, Waste Manage., 2009, 29, 2625–2643 CrossRef CAS PubMed.
- T. N. Thompson, A. S. Coley and M. D. Schulz, Polym. Chem., 2020, 11, 2485–2491 RSC.
- N. M. Alves, J. F. Mano, E. Balaguer, J. M. M. Dueñas and J. L. G. Ribelles, Polymer, 2002, 43, 4111–4122 CrossRef CAS.
- S. D. Mancini and M. Zanin, J. Appl. Polym. Sci., 2000, 76, 266–275 CrossRef CAS.
- J. E. Volponi, L. H. I. Mei, D. dos and S. Rosa, J. Polym. Environ., 2004, 12, 11–16 CrossRef CAS.
- L. Trossaert, M. De Vel, L. Cardon and M. Edeleva, Polymers, 2022, 14, 196 CrossRef CAS PubMed.
- D. B. Jaquiss, W. F. H. Borman and R. W. Campbell, Lifting the sustainability of modified pet-based multilayer packaging material with enhanced mechanical recycling potential and processing, ed. M. Grayson, John Wiley and Sons, New York, 1982, vol. 18, p. 549 Search PubMed.
- O. Olabisi and K. Adewale, Handbook of Thermoplastics, CRC press, 2016, vol. 41 Search PubMed.
- S. J. A. Hocker, W. T. Kim, H. C. Schniepp and D. E. Kranbuehl, Polymer, 2018, 158, 72–76 CrossRef CAS.
- M. Frounchi, in Macromolecular Symposia, Wiley Online Library, 1999, vol. 144, pp. 465–469 Search PubMed.
- A. J. Müller, J. L. Feijoo, M. E. Alvarez and A. C. Febles, Polym. Eng. Sci., 1987, 27, 796–803 CrossRef.
- G. Giannotta, R. Po, N. Cardi, E. Tampellini, E. Occhiello, F. Garbassi and L. Nicolais, Polym. Eng. Sci., 1994, 34, 1219–1223 CrossRef CAS.
- N. Torres, J. J. Robin and B. Boutevin, Eur. Polym. J., 2000, 36, 2075–2080 CrossRef CAS.
- G. Giannotta, R. Po, N. Cardi, E. Occhiello and F. Garbassi, in Proc Int Recyc Congress, Geneva, Switzerland, 1993, p. 225 Search PubMed.
- W. Feng, C. Huang, X. Tan, N. Tang, L. Zhang, H. Li, X. Xu and J. Peng, Ecotoxicology, 2022, 1–10 Search PubMed.
| This journal is © The Royal Society of Chemistry 2024 |


