 Open Access Article
Measured and simulated thermoelectric properties of FeAs2−xSex (x = 0.30–1.0): from marcasite to arsenopyrite structure†
Christopher J.
Perez
 a,
Kasey P.
Devlin
 a,
Callista M.
Skaggs
 b,
Xiaoyan
Tan
 *bc,
Corey E.
Frank
 c,
Jackson R.
Badger
a,
Chang-Jong
Kang
 d,
Thomas J.
Emge
c,
Susan M.
Kauzlarich
 a,
Valentin
Taufour
e,
Gabriel
Kotliar
 d,
Saul H.
Lapidus
f and
Martha
Greenblatt
 *c
*c
aDepartment of Chemistry, University of California, One Shields Avenue, Davis, California 95616, USA
bDepartment of Chemistry and Biochemistry, George Mason University, Fairfax, Virginia 22030, USA. E-mail: xtan6@gmu.edu
cDepartment of Chemistry and Chemical Biology, Rutgers, The State University of New Jersey, Piscataway, New Jersey 08854, USA. E-mail: greenbla@chem.rutgers.edu
dDepartment of Physics and Astronomy, Rutgers, The State University of New Jersey, Piscataway, New Jersey 08854, USA
eDepartment of Physics and Astronomy, University of California, One Shields Avenue, Davis, California 95616, USA
fAdvanced Photon Source, Argonne National Laboratory, Argonne, Illinois 60439, USA
First published on 27th July 2020
Abstract
FeAs2−xSex (x = 0.30–1.0) samples were synthesized as phase pure powders by conventional solid-state techniques and as single crystals (x = 0.50) from chemical vapor transport. The composition of the crystals was determined to be Fe1.025(3)As1.55(3)Se0.42(3), crystallizing in the marcasite structure type, Pnnm space group. FeAs2−xSex (0 < x < 1) was found to undergo a marcasite-to-arsenopyrite (P21/c space group) structural phase transition at x ∼ 0.65. The structures are similar, with the marcasite structure best described as a solid solution of As/Se, whereas the arsenopyrite has ordered anion sites. Magnetic susceptibility and thermoelectric property measurements from 300–2 K were performed on single crystals, FeAs1.50Se0.50. Paramagnetic behavior is observed from 300 to 17 K and a Seebeck coefficient of −33 μV K−1, an electrical resistivity of 4.07 mΩ cm, and a very low κl of 0.22 W m−1 K−1 at 300 K are observed. In order to determine the impact of the structural transition on the high-temperature thermoelectric properties, polycrystalline FeAs2−xSex (x = 0.30, 0.75, 0.85, 1.0) samples were consolidated into dense pellets for measurements of thermoelectric properties. The x = 0.85 sample shows the best thermoelectric performance. The electronic structure of FeAsSe was calculated with DFT and transport properties were approximately modeled above 500 K.
1. Introduction
Thermoelectric generators are regarded as highly reliable systems that provide power in areas where access is restricted, such as remote geological sites or deep space.1 They can also be used to convert waste heat into electricity in applications such as power plants and cars, but widespread use has been hindered by low efficiencies compared to other heat engines due to low material efficiencies which has spurred a decades-long search for more efficient thermoelectric materials.2–5 Thermoelectric generators turn heat directly into electricity by the Seebeck effect. The efficiency of a thermoelectric material is defined by where S is the Seebeck coefficient (μV K−1), T is the absolute temperature (K), ρ is the electrical resistivity (mΩ cm), and κ is the thermal conductivity (W m−1 K−1). Strategies for improving zT have included band structure engineering for Seebeck optimization, substitutional alloying to increase the power factor,
  alloy scattering, and nano-structuring to reduce thermal conductivity.2,6,7
A promising thermoelectric material is FeAs2 which crystallizes in the marcasite (Pnnm) structure (Fig. 1A).8 FeAs2 has a colossal PF of 200 μW K−2 cm−1 at 30 K and peak Seebeck of −7000 μV K−1 at 12 K.9 A PF of over 140 μW K−2 cm−1 is retained at 60 K, but thermal conductivity peaks at 1200 W m−1 K−1 at 20 K and remains over 300 W m−1 K−1 at 60 K, consequently the peak zT is 0.0028 at 30 K.8 This material could be made viable by reducing the thermal conductivity by alloy scattering.
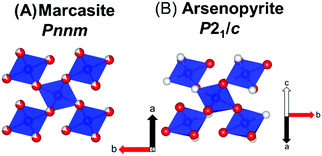 | ||
| Fig. 1 A view of the similar marcasite (A) and arsenopyrite (B) structures. Color code: Fe = blue, As = grey, Se = red. | ||
Wold et al. have shown that FeAs2 can be alloyed with Se.10 The solid solution of FeAs2−xSex (x = 0, 0.06, 0.13) was synthesized. For every Se substituted with As, one extra electron is added to the system and the carrier concentration increases therefore decreasing the Seebeck coefficient (−200 μV K−1, −59 μV K−1, −39 μV K−1).10
The iron dichalcogenides (FeX2, X = S, Se, Te) have also been synthesized. FeS2 crystallizes in the cubic pyrite (Pa3) structure, while FeSe2 and FeTe2 crystallize in the marcasite structure (Pnnm).11 They are all semiconducting and have p–n transitions at 300 K, 500 K and 400 K, respectively.11 FeSe2 has a large Seebeck coefficient of 320 μV K−1 at 300 K.
Inspired by the large Seebeck coefficient observed in FeAs2 and FeSe2, we launched the investigation of FeAsSe and solid-state solutions of FeAs2−xSex (0 < x < 1) with the goal of minimizing the κ and improving the zT. The two end members of the FeAs2−xSex solid-state solution, FeAs2 and FeSe2 crystallize in the marcasite structure type while FeAsSe, crystallizes in the arsenopyrite (P21/c) (Fig. 1B) structure type. In the marcasite structure, As and Se atoms are disordered and occupy the same site (Fig. 1A), but are ordered with distinct sites in the arsenopyrite structure type (Fig. 1B). FeAsSe has a reported bandgap of 0.60 eV, which is encouraging, because narrow bandgap semiconductors such as FeAs2 and FeSb2 have large thermopower at low temperatures.9,12–14
In this paper, we report the synthesis, magnetic, and thermoelectric properties of polycrystalline samples of FeAs2−xSex (x = 0.30–1.0), and single crystals of FeAs1.50Se0.50. First principles calculations were made to compare the theoretical and experimental properties and evaluate the predictive power of current computational tools for this area of research.
2. Experimental section
2.1 Materials
Iron (99.998 wt%, Alfa Aesar), arsenic (99.99 wt%, Alfa Aesar), and selenium powders (99.999 wt%, Alfa Aesar) were used. Starting elements were weighed and mixed in an Ar-filled glove box (O2 < 1 ppm, H2O < 1 ppm).2.2 Polycrystalline synthesis
FeAs2−xSex (x = 0.30–1.0) polycrystalline samples were synthesized by conventional solid-state methods. Iron, arsenic, and selenium powders were ground thoroughly and pressed into a pellet in the ratio of desired Fe![[thin space (1/6-em)]](https://www.rsc.org/images/entities/char_2009.gif) :
:![[thin space (1/6-em)]](https://www.rsc.org/images/entities/char_2009.gif) As
As![[thin space (1/6-em)]](https://www.rsc.org/images/entities/char_2009.gif) :
:![[thin space (1/6-em)]](https://www.rsc.org/images/entities/char_2009.gif) Se composition. The pellet was transferred into a silica tube (I. D. = 7.0 mm) and sealed under vacuum (<10−3 mbar). The ampule was heated in a furnace to 650 °C within 1 day, held at that temperature for 10 days, and then cooled to room temperature within 6 hours. It was noted that a small amount of selenium deposits on the top of the pellet after the reaction.
Se composition. The pellet was transferred into a silica tube (I. D. = 7.0 mm) and sealed under vacuum (<10−3 mbar). The ampule was heated in a furnace to 650 °C within 1 day, held at that temperature for 10 days, and then cooled to room temperature within 6 hours. It was noted that a small amount of selenium deposits on the top of the pellet after the reaction.
CAUTION: Finely divided metals are air and water reactive and should be handled in an inert atmosphere. Arsenic is toxic and should be handled with care and proper personal protective equipment.
2.3 Single crystal growth
The mixture of elements (Fe![[thin space (1/6-em)]](https://www.rsc.org/images/entities/char_2009.gif) :
:![[thin space (1/6-em)]](https://www.rsc.org/images/entities/char_2009.gif) As
As![[thin space (1/6-em)]](https://www.rsc.org/images/entities/char_2009.gif) :
:![[thin space (1/6-em)]](https://www.rsc.org/images/entities/char_2009.gif) Se = 1
Se = 1![[thin space (1/6-em)]](https://www.rsc.org/images/entities/char_2009.gif) :
:![[thin space (1/6-em)]](https://www.rsc.org/images/entities/char_2009.gif) 1
1![[thin space (1/6-em)]](https://www.rsc.org/images/entities/char_2009.gif) :
:![[thin space (1/6-em)]](https://www.rsc.org/images/entities/char_2009.gif) 1, total 500 mg) and 6 mg AlCl3 used as a transport agent were loaded at the end of a silica tube (I. D. = 13 mm, L = 22 cm) sealed under vacuum (<10−3 mbar). The ampule was placed in a horizontal three-zone furnace of which two zones were used as resource zone (T2 = 800 °C) and growth zone (T1 = 765 °C). The furnace was heated to targeting temperatures within 2 days, kept at temperatures for 2 weeks, and cooled to room temperature within 6 hours. Rectangular-like crystals (L ∼ 4 mm, W ∼ 2 mm, H ∼ 1 mm) were grown at the growth zone.
1, total 500 mg) and 6 mg AlCl3 used as a transport agent were loaded at the end of a silica tube (I. D. = 13 mm, L = 22 cm) sealed under vacuum (<10−3 mbar). The ampule was placed in a horizontal three-zone furnace of which two zones were used as resource zone (T2 = 800 °C) and growth zone (T1 = 765 °C). The furnace was heated to targeting temperatures within 2 days, kept at temperatures for 2 weeks, and cooled to room temperature within 6 hours. Rectangular-like crystals (L ∼ 4 mm, W ∼ 2 mm, H ∼ 1 mm) were grown at the growth zone.
2.4 Spark plasma sintering (SPS)
About 1 g of polycrystalline sample was loaded into a 12.7 mm graphite die hermetically sealed with graphite foils and graphite plungers. The sample was consolidated in a Dr Sinter Junior Spark Plasma Sintering system (Fuji Electronic Industrial Co., Ltd) under ∼385 Torr of Ar. The sample was heated to 565 °C over 7 min, then to 615 °C in 1 min, and dwelled at 615 °C for 10 min. The applied pressure was increased from 40 MPa to 87 MPa on the cross section from 240 °C, the onset of self-consolidation, to 530 °C. The result was a black disk that was cut and polished for property measurements. The density of the disk was measured geometrically and was found >95% of crystallographic density for all samples. Sample purity for the FeAsSe sample after SPS was confirmed by powder X-ray diffraction (ESI,† Fig. S1).2.5 Synchrotron and laboratory powder X-ray diffraction (PXRD)
Room temperature synchrotron PXRD (λ = 0.414532 Å) data were collected in the 2θ range from 0.50 to 50° at the 11-BM beamline at the Advanced Photon Source (APS) of Argonne National Laboratory. Laboratory PXRD data were collected on a Bruker D8 Advanced diffractometer (Cu Kα λ = 1.5418 Å). Rietveld refinement of the collected data was carried out with the FullProf package.15 Collected laboratory PXRD patterns of FeAs2−xSex (x = 0.30, 0.50, 0.60, 0.65, 0.75, 0.85, 1.0) are shown in Fig. S2 (ESI†).2.6 Single crystal X-ray diffraction
Room temperature FeAs1.50Se0.50 single crystal X-ray diffraction data were recorded on a Bruker Smart diffractometer with an APEX CCD detector and graphite-monochromatized Mo Kα radiation. The data were corrected for absorption via multi-scan with Bruker SAINT software (SADABS method).16 The crystal structure of FeAs1.50Se0.50 was solved in the Pnnm space group (marcasite structure type) and refined with SHELXL (2016) program.17 During the refinement, the As and Se positions were constrained to be equal, as were the atomic displacement parameters, because As and Se atoms occupy the same site. Based on the composition obtained from energy dispersive spectroscopy, the final occupancy of Se atoms on the As/Se site was 25% of the total site occupancy, which yields the formula FeAs1.50Se0.50. These assignments for As and Se occupancies and the total site electron density are consistent with an initial refinement of the Se occupancy to 24.0(6)% upon fixing the As to 75% of its site occupancy. A summary of selected details of single crystal structural refinement is provided in Table 1 and a table of fractional positional coordinates and anisotropic thermal parameters is provided in Table S1 (ESI†).| a CCDC number 1996184 contains the supplementary crystallographic data for this paper. | |
|---|---|
| Formula | FeAs1.50Se0.50 |
| Temperature | 293 K |
| Mo Kα, λ | 0.71073 Å |
| Space group | Pnnm |
| Unit cell a, b, c, Å | 5.213(2), 5.947(2), 2.9885(8) |
| V, Å3 | 92.65(5) |
| Z | 2 |
| Crystal size, mm3 | 0.16 × 0.065 × 0.035 |
| ρ calc, g cm−3 | 7.445 |
| μ, mm−1 | 43.981 |
| θ max,deg | 32.27 |
| Reflections collected | 1172 |
| R int | 0.026 |
| Unique reflections | 186 |
| Parameters refined | 14 |
| R 1, wR2 [Fo > 4σ(Fo)] | 0.0245, 0.0584 |
| Diff. peak and hole, e Å−3 | 1.017, −1.498 |
| Goodness-of-fit | 1.19 |
2.7 Electron microprobe analysis (EMPA)
EMPA was carried out on FeAs1.50Se0.5 single crystal and FeAsSe pellet. Samples were embedded in epoxy and polished to a 0.25 μm finish for elemental mapping and compositional analysis. A Cameca SX-100 electron microscope with five wavelength dispersive spectrometers was used for the analysis. The Kα1 of a InAs crystal, Kα1 of a Fe single crystal, and Kα1 of a Se crystal were used to calibrate the stoichiometry of Fe, As, and Se, respectively. 10 points were used to calculate the composition of the polycrystalline and single crystal samples. Elemental mapping was conducted to confirm the homogeneity of the samples. X-ray mapping of the FeAsSe pellet is shown in Fig. S3 (ESI†).2.8 Scanning electron microscopy with energy dispersive spectroscopy (SEM-EDS)
Elemental analysis of FeAs2−xSex (x = 0.30, 0.75, 0.85) samples were conducted using SEM-EDS. SEM was performed using a Scios Dual Beam system (SEM and Focused Ion Beam(FIB)) equipped with an Everhart-Thornley secondary electron detector. EDS data were collected with a windowless Oxford instruments X-max 50 equipped with a 50 mm2 Si drift detector. Backscattered electrons (BSE) images of FeAs2−xSex (x = 0.30, 0.75, 0.85) with Fe, As, and Se X-ray elemental maps are shown in Fig. S4 (ESI†).2.9 Low-temperature thermoelectric properties
The Seebeck coefficient and thermal conductivity were measured on the FeAs1.50Se0.50 single crystal using the thermal transport option (TTO) of a Quantum Design (QD) Physical Property Measurement System (PPMS). The FeAs1.50Se0.50 single crystal was attached to two gold-coated copper leads with silver epoxy for measurement. Temperature dependent resistivity data were collected from 2 to 300 K using the PPMS alternating current (AC) transport option. A four-wire geometry was employed with silver epoxy and platinum wires. Experimental data were fit with a sixth order polynomial for zT calculation.2.10 High-temperature thermoelectric properties
Polycrystalline FeAs2−xSex (x = 0.30, 0.75, 0.85, 1.0) samples consolidated by SPS were polished flat and parallel for high temperature measurements. A Netzch LFA 457 laser flash system was used to measure the thermal diffusivity (D). Thermal conductivity (κ) was calculated using the following equation: κ = D × Cp × γ where D is diffusivity, Cp is the heat capacity and γ is the geometric density. Cp was calculated from the Dulong–Petit law and the geometric density was calculated using an analytical balance and a micrometer. The coefficient of thermal expansion for FeSb2 (a similar compound with a similar structure) is available but its inclusion leads to a negligible change in thermal conductivity, so it was left out.18Seebeck measurements were performed with a custom-built apparatus that employed tungsten–niobium thermocouples with the light-pulse method.19 Room-temperature resistivity and Hall coefficient measurements on all polycrystalline samples were done on a custom-built apparatus employing a 0.8 T magnet and the Van-der Pauw method as described in the literature.20 Temperature dependent resistivity and Hall effect measurements were done on the FeAsSe sample. High temperature resistivity measurements on FeAs2−xSex (x = 0.30, 0.75, 0.85) samples were measured on a Linseis LSR-3. Experimental data were fit with a sixth order polynomial for zT calculations and ease of viewing and are provided in Fig. S5 (ESI†).
2.11 Magnetic susceptibility measurements
Magnetic measurements were carried out on a FeAs1.50Se0.50 crystal using QD Magnetic Property Measurement System (MPMS) superconducting quantum interference device (SQUID). Two single crystals of FeAs1.50Se0.50 were weighed in air and placed between two commercial straws for measurement. A 1.0 T field was used for zero field-cooled (ZFC) and field-cooled (FC) temperature-dependent magnetization. The applied magnetic field is parallel to the largest plane of the rectangular crystal. Raw magnetic susceptibility data were converted to molar susceptibility (χm = M/(H × moles of sample)) in emu mol−1.2.12 Density functional theory (DFT) calculations
DFT calculations were performed with the full-potential linearized augmented plane wave method as implemented in the WIEN2k package.21 The experimental crystal structure of the polycrystalline sample FeAsSe was adopted for the calculations. Generalized gradient approximation (GGA) of Perdew–Burke–Ernzerhof (PBE)22 was used for the exchange–correlation functional. The muffin tin radii were chosen to be 2.25, 2.16, and 2.14 Bohr radii for Fe, As, and Se, respectively, and the size of a plane-wave basis set was determined from RmtKmax of 7.0, where Rmt is the smallest atomic muffin tin radius and Kmax is the largest plane-wave vector. To obtain the electronic structure with a precise bandgap, the modified Becke-John (mBJ) exchange potential was utilized, which is sufficiently accurate and computationally cheaper than the GW method.23 The Brillouin zone integration was performed with 2552 k points in an irreducible Brillouin zone. The semiclassical Boltzmann theory as implemented in the transport code BoltzTrap24 was used to compute the transport properties including the electrical resistivity ρ, the Seebeck coefficient S, and electronic thermal conductivity κe. In the irreducible Brillouin zone a denser mesh of 12![[thin space (1/6-em)]](https://www.rsc.org/images/entities/char_2009.gif) 760 k points was used for the transport calculations, with the chemical potential fixed at the middle of the bandgap.
760 k points was used for the transport calculations, with the chemical potential fixed at the middle of the bandgap.
3. Results and discussion
3.1 Crystal structure and chemical analysis of FeAs2−xSex
FeAs2−xSex (x = 0.30, 0.50, 0.60, 0.65, 0.75, 0.85, 1.0) polycrystalline samples were prepared at 650 °C via a conventional solid-state method. The polycrystalline synthesis roughly follows that of Wold, but is performed at lower temperatures and without additional grinding steps.10 Powders were then consolidated by SPS at 615 °C for measurements. Sintering under a partial atmosphere of Ar was found crucial to avoid sample decomposition. PXRD patterns before and after SPS for the FeAs2−xSex (x = 1.0) sample show that the sample has not decomposed at 615 °C (ESI,† Fig. S1).The structures of FeAs2−xSex polycrystalline samples are expected to crystallize in the marcasite structure type (Pnnm) for low x, where the As and Se atoms are disordered on the same site and arsenopyrite structure type (P21/c) for high x, where they reside on distinct sites. A detailed description of the structures and the differences between the Pnnm and P21/c space groups are described in the literature.25 The PXRD patterns of FeAs2−xSex (x = 0.30, 0.50, 0.60, 0.65, 0.75, 0.85, 1.0) indicated that x = 0.30–0.60 samples belong to the marcasite structure, while x ≥ 0.75 crystallize in the arsenopyrite structure type (ESI,† Fig. S2). Small amounts of the arsenopyrite structure phase was observed in FeAs2−xSex (x = 0.50, 0.60) samples, therefore, the crystal structure change from marcasite to arsenopyrite type in FeAs2−xSex occurs when x ∼ 0.65. Due to this impurity, the thermoelectric properties of x = 0.50, 0.60, 0.65 were not measured. Koizumi et al. has reported a change from marcasite to arsenopyrite in the FeAs2−xTex solid solution.26 FeAs2−xTex crystallize in the marcasite structure type for the entire series except for 0.8 ≤ x ≤ 1.2 where the samples are of the arsenopyrite structure type. The authors attribute the deformation of the marcasite structure to arsenopyrite to a low spin d4.8–d5.2 state.26 Wold explains this distortion when plotting the energy band model for FeAs2. The valence orbitals are comprised of two degenerate ‘b’ bonding orbitals, a non-bonding ‘all’ orbital, and two anti-bonding ‘a’ orbitals which originate from Fe's 3d orbitals mixing with As's orbitals. FeAs2 is stable in the marcasite structure because the b orbitals are fully filled, but when Se or Te is substituted for As the extra electron begins to populate the all orbital which adds a destabilizing effect that the structure can compensate until x = 0.8 in the Te system10 and ∼0.65 in the Se system.
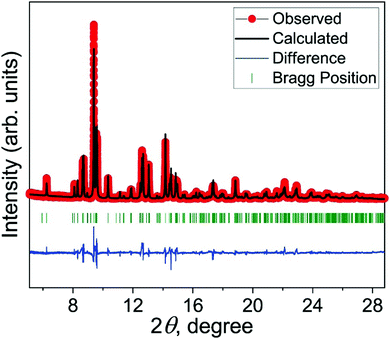
Rietveld refinement of the synchrotron PXRD pattern of FeAsSe is shown as an example where the data are best fit with arsenopyrite structure type (Fig. 2). The refined unit cell parameters of FeAsSe are a = 5.95922(6), b = 5.87517(6), c = 5.99802(7) Å, V = 192.499(4) Å3, which are close to the published values of a = 5.95 Å, b = 5.89 Å, c = 5.95 Å, V = 192.37(4) Å3.8 Rietveld refinement parameters are provided in ESI,† Table S2.
EMPA results of FeAsSe pellet of >95% of crystallographic density show a mostly homogeneous sample with some areas that are slightly rich in As (ESI,† Fig. S3). The calculated composition of FeAsSe pellet is Fe1.023(6)As0.97(3)Se1.00(4) and consistent with a structural model of Fe being fully occupied. Therefore, only Se and As occupancies were refined, and 3% vacancies were observed on Se sites, leading to the formula: FeAsSe0.970(5). Z-Contrast BSE images and EDS maps of the FeAs2−xSex (x = 0.30, 0.75, 0.85) samples are provided in ESI,† Fig. S4 and look mostly homogenous except for some porosity resulting from the sample with densities less than 95% and some Se inhomogeneity in the x = 0.30 and 0.75 samples along with islands of oxide in the x = 0.85 sample. The stoichiometries calculated from EDS for FeAs2−xSex (x = 0.30, 0.75, 0.85) samples are Fe1.05(1)As1.67(1)Se0.26(2), Fe1.02(1)As1.16(2)Se0.80(3), and Fe1.02(5)As1.14(1)Se0.83(1), respectively.
3.2 Crystal structure and chemical analysis of FeAs1.50Se0.50
During the attempt to grow large FeAsSe single crystals, chemical vapor transport (CVT) method was used with a mixture of elements (Fe![[thin space (1/6-em)]](https://www.rsc.org/images/entities/char_2009.gif) :
:![[thin space (1/6-em)]](https://www.rsc.org/images/entities/char_2009.gif) As
As![[thin space (1/6-em)]](https://www.rsc.org/images/entities/char_2009.gif) :
:![[thin space (1/6-em)]](https://www.rsc.org/images/entities/char_2009.gif) Se = 1
Se = 1![[thin space (1/6-em)]](https://www.rsc.org/images/entities/char_2009.gif) :
:![[thin space (1/6-em)]](https://www.rsc.org/images/entities/char_2009.gif) 1
1![[thin space (1/6-em)]](https://www.rsc.org/images/entities/char_2009.gif) :
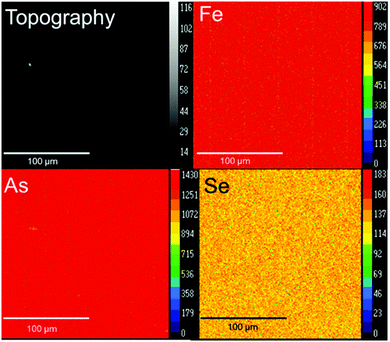
:![[thin space (1/6-em)]](https://www.rsc.org/images/entities/char_2009.gif) 1), and AlCl3 as the transport agent. Large rectangular-like crystals were grown. Single crystal diffraction and EMPA were carried out to determine the structure and composition of those crystals. The composition calculated from EMPA analysis of single crystals was Fe1.025(3)As1.55(2)Se0.41(2). The structural refinements also indicate that the composition of the crystal is FeAs1.50Se0.50. A summary of selected details of single crystal structural refinement is provided in Table 1. Atomic positions, occupancies, and anisotropic thermal parameters are provided in ESI,† Table S1. Fig. 3 shows the crystal topography and elemental X-ray mapping consistent with the homogenous dispersion of the three elements throughout the crystal.
1), and AlCl3 as the transport agent. Large rectangular-like crystals were grown. Single crystal diffraction and EMPA were carried out to determine the structure and composition of those crystals. The composition calculated from EMPA analysis of single crystals was Fe1.025(3)As1.55(2)Se0.41(2). The structural refinements also indicate that the composition of the crystal is FeAs1.50Se0.50. A summary of selected details of single crystal structural refinement is provided in Table 1. Atomic positions, occupancies, and anisotropic thermal parameters are provided in ESI,† Table S1. Fig. 3 shows the crystal topography and elemental X-ray mapping consistent with the homogenous dispersion of the three elements throughout the crystal.
3.3 Magnetism
Magnetic properties measurements were performed on FeAs1.50Se0.50 single crystal sample (Fe1.025(3)As1.55(2)Se0.41(2)). Fig. 4A shows the χmvs. T data and the ZFC and FC data do not differ. Below 17 K there is a sharp increase in susceptibility, which is a typical low temperature divergence from the Curie–Weiss law. μeff was calculated from fitting 1/χm data from 100 K to 300 K with the Curie–Weiss law χ(T) = C/(T − θ) where C is the Curie constant and θ is the Weiss temperature. C was calculated to be 0.124 emu mol−1 K−1 and was used to calculate the effective magnetic moment resulting in a value of μeff = 0.997(9) μB and θ = −73.3(6) K.
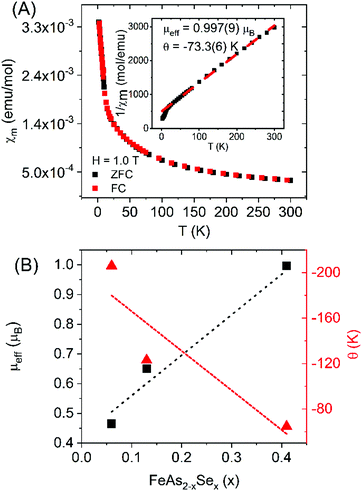 | ||
| Fig. 4 (A) χmvs. T for FeAs1.50Se0.50 single crystals (FC is shown in red, ZFC is shown in black). The inlay shows 1/χmvs. T with the Curie–Weiss fit from 100 K to 300 K. (B) Calculated values of μeff and θ (A) vs. Se fraction (x = 0.06 and 0.13 are from literature).10 | ||
The data are consistent with marcasite structure type (Pnnm) of FeAs2−xSex compositions reported in the literature (x = 0.06, 0.13) summarized in Fig. 4B.10 It was proposed that the substitution of Se for As in diamagnetic d4 FeAs2 (with Fe in a distorted octahedron of As) results in the formation of paramagnetic low-spin d5.10 Increasing Se concentration in the solid solution leads to increased low-spin d5 and increased μeff seen in Fig. 4B. In terms of spin only contribution  where n is the total number of unpaired electrons) 0.41 unpaired electrons from Se should give a μSO = 1.0 μB, which is very close to 0.997(9) μB measured.
3.4 Low-temperature thermoelectric properties
Seebeck coefficient and thermal conductivity of FeAs1.50Se0.50 single crystals were measured with the TTO option, and resistivity was measured using the AC option on a QD PPMS. κl was calculated from the Wiedemann–Franz law where κtot = κe + κl, where ρ is electrical resistivity, T is temperature, and L is the Seebeck dependent Lorenz factor (
 ).5,27κl (Fig. 5A) quickly increases due to defect scattering at low temperatures. At 85 K, there is a maximum in κl and the increase of κtot slows down. The κl maxima is presumably due to the onset of Umklapp scattering which would indicate a 1/T κl temperature dependence which this system does not exhibit presumably due to an underestimation of κe because of inaccurate Lorenz values. Above 85 K, κtot continues to increase as κe becomes a large contributor to thermal conductivity, ultimately contributing at least 47% of κtot at 300 K. The positive slope of the κtot curve after the initial increase is seen in other highly doped thermoelectric systems.28–30
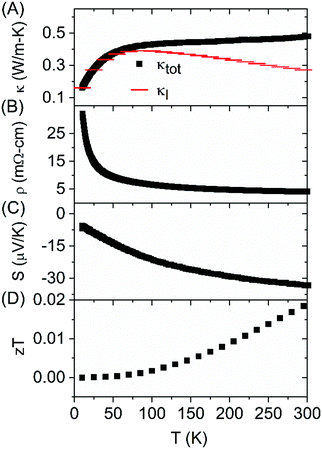 | ||
| Fig. 5 Total thermal conductivity (κtot) and lattice thermal conductivity (κl) (A), resistivity (B), Seebeck coefficient (C), and zT (D) measured on a FeAs1.50Se0.50 single crystal. | ||
The electrical resistivity indicates semiconducting behavior, and the absolute value of the negative Seebeck coefficient increases with temperature. The Seebeck coefficient is in line with the previously published FeAs2−xSex (x = 0.06, 0.13) which decreased as a function of the concentration of Se and had a value of −37 μV K−1 for the x = 0.13 sample at 300 K. The zT of FeAs1.50Se0.50 single crystal is 0.018 at 300 K.10 The Seebeck coefficient is not large, but in line with expectations. While the thermal conductivity does decrease from the FeAs2 samples, there is no significant improvement in thermoelectric performance.
3.5 High-temperature thermoelectric properties and Hall effect measurements
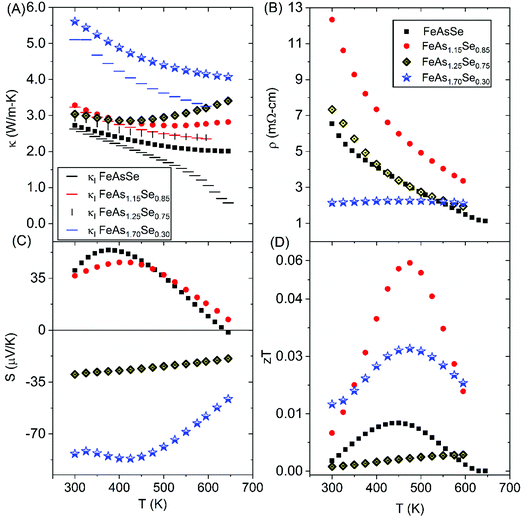
High-temperature thermoelectric properties were measured on the sintered pellets of FeAs2−xSex (x = 0.30, 0.75, 0.85, 1.0) of >95% crystallographic density (experimental data provided in ESI,† Fig. S5). Thermal conductivity (Fig. 6A) was calculated from thermal diffusivity. κl was calculated as in Section 3.4. The thermal conductivity is mostly due to lattice contributions at lower temperatures, but as the temperature increases electrical resistivity and Seebeck coefficient are greatly reduced (Fig. 6B and C) indicating that κe contributes much more to κtot at higher temperatures seen in Fig. 6A. The FeAs2−xSex (x = 0.75, 0.85, 1.0) samples with the arsenopyrite structure type have similar thermal conductivities at room temperature that decrease as a function of increasing x at higher temperatures and as expected the x = 1.0 sample has the lowest thermal conductivity and lowest lattice thermal conductivity due to the higher Se content that leads to more alloy scattering. The marcasite sample (FeAs1.70Se0.30) has the largest κl despite being a more disordered structure presumably because less Se is available for alloy scattering. Due to defects, grain boundaries, and compositional differences, the marcasite polycrystalline sample and single crystal sample cannot be easily compared. The marcasite sample is the most conductive at low temperatures, which could be, because the extra 0.3 added electrons remain free in the all orbital and make the resistivity metallic. The resistivity of the arsenopyrite samples shows semiconducting behavior and decreases as a function of Se.Carrier concentration was calculated from Hall coefficient (RH). Temperature dependent carrier concentration and Hall mobility for FeAsSe and room temperature carrier concentration and Hall mobility values of FeAs2−xSex (x = 0.75, 0.85) are provided in Fig. S6 and S7 (ESI†). For the x = 0.30 sample, the RH value switched between negative and positive value, which indicated that minority carriers were contributing to transport, so a single value could not be obtained and is therefore not shown. FeAs2−xSex samples have negative RH values that indicate n-type semiconductive behavior, while the measured Seebeck coefficients are positive for x = 1.0, 0.85. This discrepancy is also seen in FeSe1−xTex, and skutterudites.31,32 In FeSe1−xTex the discrepancy is thought to come from the compensated multiband nature of the system. For the x = 0.75 sample, the RH value is in agreement with the sign of the Seebeck coefficient.
The Hall carrier mobility for x = 1.0 (Fig. S6, ESI†) is 46.1 cm2 V−1 s−1 at 300 K and has a maximum at 480 K before it sharply decreases. The room temperature Hall mobility for x = 0.85, 0.75 samples is below 1 at room temperature and is unstable for the x = 0.30 sample, which are ascribed to the multiband nature of the compositions and inaccurate Hall effect measurements. The transition from p–n-type Seebeck coefficient is present in the x = 1.0 sample (Fig. 6C), which was also seen in FeX2 (X = S, Se, Te). Overall, the x = 0.85 sample has a max zT of 0.06 at 475 K (Fig. 6D).
3.6 DFT calculations
GGA calculations indicate that FeAsSe is a semiconductor. As shown in Fig. 7A, the top of the valence band and the bottom of the conduction band lie at the X and Γ points, respectively, thereby providing an indirect bandgap of 0.11 eV which is much smaller than the bandgap previously reported from the slope of the Arrhenius plot (0.60 eV) of the resistivity.14 The dominant band character near the Fermi level is Fe d-character as manifested in the density of states in Fig. 7B supporting the energy diagram proposed by Wold.10 The indirect bandgap is slightly enhanced to be 0.17 eV in the mBJ calculations (Fig. 7C and D). Except for the bandgap, band dispersions described by the GGA and mBJ methods are almost identical.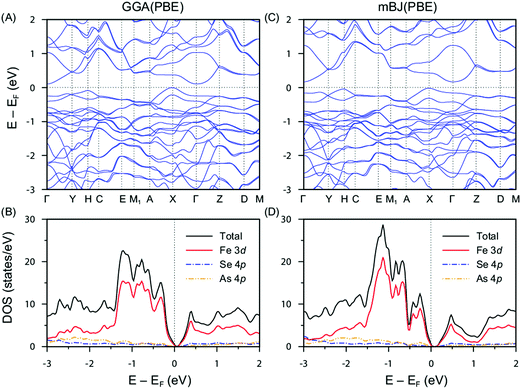 | ||
| Fig. 7 Electronic structure of FeAsSe. (A) Band dispersion and (B) density of states calculated by GGA. (C) Band dispersion and (D) density of states calculated by mBJ. | ||
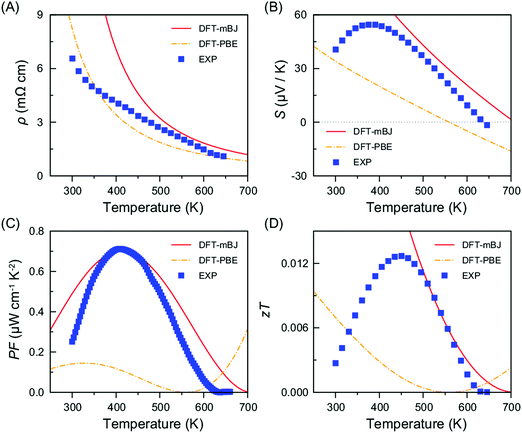
The transport properties of FeAsSe were calculated using the GGA and mBJ methods. For the electrical resistivity, a relaxation time of 3.5 × 10⁻¹⁴ (s) was chosen to match the experimental value around 600 K and kept constant over the whole temperature range, which might induce some deviation between the calculations and the experiment. As shown in Fig. 8, the mBJ method provides better agreement with the experiment than GGA. Thus, only the transport properties calculated by mBJ will be mentioned hereafter.
Fig. 8A shows the calculated and experimental resistivities as a function of temperature. The values increase as the temperature decreases, demonstrating the semiconducting transport behavior. However, the increasing tendency of the calculated resistivity exceeds the experimental data below 500 K. Thus, the calculation describes a larger electrical resistivity than the experiment below 500 K. The computed Seebeck coefficient is well consistent with the experiment over the temperature range between 450 and 650 K (Fig. 6C and 8B). The Seebeck coefficient shows a positive sign, indicating that FeAsSe is a p-type semiconductor.
Based on the values of the resistivity and the Seebeck coefficient, the power factor can be estimated as shown in Fig. 8C together with the experimental data for comparison. The calculated power factor is well comparable with the experiment over the temperature range shown in Fig. 8C even though the calculated resistivity and Seebeck coefficient somewhat deviate from the experiment below 400 K. The figure of merit, zT, is also estimated and shown with experimental data in Fig. 8D. Note that κl is not considered and κe (Fig. S8, ESI†) is only used for the zT calculations. In the experimental data the strong decrease of zT at low temperatures is in large part due to the large thermal conductivity which is mostly due to lattice contributions at the temperature (Fig. 6A). Since the calculation does not consider the lattice thermal conductivity, it does not show the strong decline of zT as observed in the experimental data.
4. Conclusions
We have synthesized FeAs2−xSex (x = 0.30–1.0) polycrystalline samples by conventional solid-state methods. PXRD indicates that the x = 0.30, 0.50, 0.60 samples belong to the marcasite structure with small amount of arsenopyrite structure phase observed for x = 0.50, 0.60. FeAs2−xSex compositions with x = 0.65, 0.75, 0.85, 1.0 crystallize in the arsenopyrite structure type. The structural transition occurs at x ∼ 0.65. EMPA/SEM-EDS shows that the samples are mostly phase pure. Single crystals of FeAs1.50Se0.50 were synthesized by CVT and crystallize in the marcasite structure type with semiconducting transport properties. Magnetic measurements on the FeAs1.50Se0.50 single crystal reveal μeff = 0.997(9) μB and θ = −73.3(6) K, consistent with the expected 0.41 unpaired electrons from Se. FeAs1.50Se0.50 single crystal exhibits an extremely low lattice thermal conductivity value of 0.22 W m−1 K−1 at 300 K. High-temperature thermoelectric property measurements on FeAs2−xSex (x = 0.30–1.0) polycrystalline samples indicate that the x = 0.85 has the best zT of 0.06 at 475 K. While the thermal conductivity does decrease as a function of Se incorporation in comparison to that of FeAs2, the corresponding reduction in Seebeck coefficient resulting from Se substitution leads to a stagnant zT. Additionally, we report the electronic structure of FeAsSe and use it to model the thermoelectric properties. The calculated properties are consistent with experimental properties above 500 K, but deviate considerably below 500 K because κl is not simulated and is a significant contributor to κ at lower temperatures.Conflicts of interest
There are no conflicts to declare.Acknowledgements
C.-J. K., G. K., and M. G. were supported by the U. S. Department of Energy, Office of Science, Basic Energy Sciences as a part of the Computational Materials Science Program through the Center for Computational Design of Functional Strongly Correlated Materials and Theoretical Spectroscopy (DE-FOA-0001276). C. M. S., and X. T. were supported by the George Mason University and COS-Seed Award No. 181283. Use of the Advanced Photon Source at Argonne National Laboratory was supported by the U. S. Department of Energy, Office of Science, Office of Basic Energy Sciences, under Contract No. DE-AC02-06CH11357. C. J. P., K. P. D., and S. M. K. and this research was sponsored by NSF (DMR-1709382). Part of this work was conducted at the Jet Propulsion Laboratory California Institute of Technology under contract with the National Aeronautics and Space Administration with funding from the Science Mission Directorate's Radioisotope Power Systems program. The authors thank Gregory Gerig for Seebeck measurements, Nicholas Botto for assistance with EMPA measurements, Dr V. Ovidiu Garlea for discussion on Rietveld refinement, and Dr Kirill Kovnir for access to the PPMS.References
- G. L. Bennett, Space Power, 1989, 8, 259–284 Search PubMed.
- E. S. Toberer, A. F. May and G. J. Snyder, Chem. Mater., 2010, 22, 624–634 CrossRef CAS.
- C. J. Kang and G. Kotliar, Phys. Rev. Mater., 2018, 2, 034604 CrossRef CAS.
- J. P. Fleurial, JOM, 2009, 61, 79–85 CrossRef CAS.
- G. J. Snyder and E. S. Toberer, Nat. Mater., 2008, 7, 105–114 CrossRef CAS PubMed.
- L. D. Zhao, V. P. Dravid and M. G. Kanatzidis, Energy Environ. Sci., 2014, 7, 251–268 RSC.
- H. H. Xie, H. Wang, Y. Z. Pei, C. G. Fu, X. H. Liu, G. J. Snyder, X. B. Zhao and T. J. Zhu, Adv. Funct. Mater., 2013, 23, 5123–5130 CrossRef CAS.
- H. D. Lutz, M. Jung and G. Waschenbach, Z. Anorg. Allg. Chem., 1987, 554, 87–91 CrossRef CAS.
- S. Peijie, O. Niels, J. Simon, B. I. Bo and S. Frank, Appl. Phys. Express, 2009, 2, 091102 CrossRef.
- A. Baghdadi and A. Wold, J. Phys. Chem. Solids, 1974, 35, 811–815 CrossRef CAS.
- T. Harada, J. Phys. Soc. Jpn., 1998, 67, 1352–1358 CrossRef CAS.
- P. Sun, N. Oeschler, S. Johnsen, B. B. Iversen and F. Steglich, J. Phys.: Conf. Ser., 2009, 150, 012049 CrossRef.
- H. Hahn and W. Klingen, Naturwissenschaften, 1965, 52, 494 Search PubMed.
- V. F. Hulliger, Helv. Phys. Acta, 1959, 32, 615 Search PubMed.
- J. Rodríguez-Carvajal, Phys. B, 1993, 192, 55–69 CrossRef.
- Bruker Advanced X-ray Solutions SMART-SAINT, Bruker AXS Inc., Madison, Wisconsin, USA, 2007.
- G. M. Sheldrick, Acta Crystallogr., Sect. A: Found. Crystallogr., 2008, 64, 112–122 CrossRef CAS PubMed.
- C. Petrovic, Y. Lee, T. Vogt, N. Lazarov, S. Bud’ko and P. Canfield, Phys. Rev. B: Condens. Matter Mater. Phys., 2005, 72, 045103 CrossRef.
- C. Wood, D. Zoltan and G. Stapfer, Rev. Sci. Instrum., 1985, 56, 719–722 CrossRef CAS.
- K. A. Borup, E. S. Toberer, L. D. Zoltan, G. Nakatsukasa, M. Errico, J. P. Fleurial, B. B. Iversen and G. J. Snyder, Rev. Sci. Instrum., 2012, 83, 123902 CrossRef PubMed.
- P. Blaha, K. Schwarz, G. Madsen, D. Kvasnicka and J. Luitz, WIEN2k, An Augmented Plane Wave + Local Orbitals Program for Calculating Crystal Properties, Technische Universität Wien, Wien, Austria, 2001 Search PubMed.
- J. P. Perdew, K. Burke and M. Ernzerhof, Phys. Rev. Lett., 1996, 77, 3865–3868 CrossRef CAS PubMed.
- F. Tran and P. Blaha, Phys. Rev. Lett., 2009, 102, 226401 CrossRef PubMed.
- G. K. H. Madsen and D. J. Singh, Comput. Phys. Commun., 2006, 175, 67–71 CrossRef CAS.
- X. Y. Tan, K. P. Devlin, X. Y. Deng, C. J. Kang, M. Croft, C. E. Frank, C. Pak, S. Lapidus, S. M. Kauzlarich, V. Taufour, G. Kotliar and M. Greenblatt, Chem. Mater., 2018, 30, 4207–4215 CrossRef CAS.
- G. Yamaguchi, M. Shimada and M. Koizumi, J. Solid State Chem., 1976, 19, 63–65 CrossRef CAS.
- H. S. Kim, Z. M. Gibbs, Y. L. Tang, H. Wang and G. J. Snyder, APL Mater., 2015, 3, 041506 CrossRef.
- F. Sui, H. He, S. Bobev, J. Zhao, F. E. Osterloh and S. M. Kauzlarich, Chem. Mater., 2015, 27, 2812–2820 CrossRef CAS.
- C. J. Perez, V. J. Bates and S. M. Kauzlarich, Inorg. Chem., 2019, 58, 1442–1450 CrossRef CAS PubMed.
- J. D. Bryan, N. P. Blake, H. Metiu, G. D. Stucky, B. B. Iversen, R. D. Poulsen and A. Bentien, J. Appl. Phys., 2002, 92, 7281–7290 CrossRef CAS.
- F. Caglieris, F. Ricci, G. Lamura, A. Martinelli, A. Palenzona, I. Pallecchi, A. Sala, G. Profeta and M. Putti, Sci. Technol. Adv. Mater., 2012, 13, 054402 CrossRef PubMed.
- P. Sun, B. Wei, J. Zhang, J. M. Tomczak, A. M. Strydom, M. Sondergaard, B. B. Iversen and F. Steglich, Nat. Commun., 2015, 6, 7475 CrossRef CAS PubMed.
Footnote |
| † Electronic supplementary information (ESI) available: The crystallographic information file (CIF) for FeAs1.50Se0.50 is attached; PXRD before and after SPS for the FeAsSe sample, PXRD patterns for polycrystalline samples, a table containing atomic coordinates and anisotropic displacement parameters, Rietveld refinement parameters for synchrotron data, EMPA mapping for FeAsSe, SEM and X-ray mapping, and experimental high-temperature thermoelectric data for FeAs2−xSex (x = 0.30, 0.75, 0.85), room temperature carrier concentration and carrier mobility for FeAs2−xSex (x = 0.75, 0.85, 1), calculated electronic thermal conductivity of FeAsSe. CCDC 1996184. For ESI and crystallographic data in CIF or other electronic format see DOI: 10.1039/d0ma00371a |
| This journal is © The Royal Society of Chemistry 2020 |

