 Open Access Article
Ferroelectric surface photovoltage enhancement in chromium-doped SrTiO3 nanocrystal photocatalysts for hydrogen evolution†
Samutr
Assavachin
 a,
Benjamin A.
Nail
a,
Renato
V. Goncalves
a,
Benjamin A.
Nail
a,
Renato
V. Goncalves
 b,
Justin R.
Mulcahy
 a,
Sarah E.
Lloyd
a and
Frank E.
Osterloh
 *a
*a
aDepartment of Chemistry, University of California Davis, One Shields Avenue, Davis, California 95616, USA. E-mail: fosterloh@ucdavis.edu
bSão Carlos Institute of Physics, University of São Paulo, PO Box 369, 13560-970, São Carlos, SP, Brazil
First published on 24th July 2020
Abstract
Chromium-doped SrTiO3 nanocrystals of perovskite structure type and 45 nm (±15 nm) edge lengths were obtained by hydrothermal synthesis in water from titanium oxide, strontium hydroxide, and chromium(III) nitrate. According to XPS, the majority of the surface chromium (68.3%) is present in the 3+ state and the remainder (32.2%) in the 6+ state. Optical spectroscopy confirms a broad absorption at 2.3–2.9 eV from Cr(3+) dopant states, in addition to the 3.2 eV band edge of the SrTiO3 host. After modification with Pt nanoparticles, Cr-doped SrTiO3 nanocrystals catalyze photochemical H2 evolution from aqueous methanol under visible light illumination (>400 nm) and with an apparent quantum yield of 0.66% at 435 nm. According to surface photovoltage spectroscopy (SPS), Cr-doped SrTiO3 nanocrystals deposited onto gold substrates are n-type and have an effective band gap of 1.75 eV. SPS and transient illumination experiments at 2.50 eV reveal an anomalous surface photovoltage that increases with prior light exposure to values of up to −6.3 V. This photovoltage is assigned to ferroelectric polarization of the material in the space charge layer at the Au/SrTiO3:Cr interface. The polarization is stable for 24 h in vacuum but disappears after 12 h when samples are stored in air. The electric polarizability of SrTiO3:Cr is confirmed when films are exposed to static electric fields (1.20 MV m−1) in a fixed capacitor configuration. The discovery of a ferroelectric effect in Cr-doped SrTiO3 could be significant for the development of improved photocatalysts for the conversion of solar energy into fuel.
Introduction
Visible light active photocatalysts capable of splitting water have been explored extensively in recent years because hydrogen is a clean and renewable fuel.1–4 SrTiO3 is appealing due to its high chemical stability and band edges that are appropriately positioned for proton reduction and water oxidation.5–10 However, the wide band gap of SrTiO3 (3.2 eV) restricts the absorption of photons to less than 5% of the solar spectrum (UV light only). Doping of SrTiO3 with metal ions (M = Rh, Ru, Cr) adds new states inside the band gap, allowing photochemical H2 evolution under visible light.11–20 Among these dopants, Cr is attractive because it is an earth abundant element.16–23 For example, Pt-decorated SrTiO3:Cr,La nanocrystals promote hydrogen evolution from methanol under visible light (25.6% at 425 nm).20 In this work, we use surface photovoltage spectroscopy to study carrier dynamics in thin films of SrTiO3:Cr nanocrystals on gold substrates. Time-dependent photovoltage measurements reveal an anomalous photovoltage that increases with intermittent illumination and exceeds the maximum photovoltage predicted by the thermodynamics of the Au/SrTiO3:Cr system. Electric polarization experiments confirm that the anomalous photovoltage is due to a ferroelectric effect in the material.Experimental section
Strontium hydroxide octahydrate (99%, Alfa Aesar), titanium(IV) oxide P25 (99.5%, Acros Organics), potassium hydroxide, (≥85%, Sigma-Aldrich), and chromium nitrate nonahydrate (99.99%, Acros Organics) were used as received. Water was purified by a nanopure system (18 MΩ cm).SrTiO3:Cr nanocrystals were synthesized by modification of the published procedure.7,24 First, 0.175 g (2.18 mmol) of P25 TiO2 powder was added to a 45 mL PTFE lined autoclave containing an aqueous solution of 0.598 g (2.25 mmol) of Sr(OH)2 in 35 mL of water. The solution was stirred during the addition of 0.0270 g (0.0675 mmol) Cr(NO3)3·9H2O and then heated at 423 K for 72 h in a sealed stainless-steel autoclave. After natural cooling to room temperature, the resulting solid yellow product was washed several times by centrifugation in ultrapure water until the pH of the supernatant measured below 8.5. The solid was dried under vacuum to produce the yellow powder in approximately 96% yield.
Film samples were prepared by drop-casting suspensions of SrTiO3:Cr particles in water on gold substrates followed by air overnight (for UV/vis), or annealing at 100 °C in air for 20 min (for SPS), or at 300 °C for 2 hours in air (for the electric polarization experiments). Film thicknesses were measured using a stylus-type Veeco DekTak profilometer.
Loading of 0.5 (% wt) Pt co-catalysts onto SrTiO3:Cr nanocrystals was completed by suspending 150 mg of SrTiO3:Cr nanocrystals in 100 mL 20% (vol) MeOH (aq.) solution together with 0.75 mL of a 1.0 mg mL−1 solution of H2PtCl6·H2O. The mixture was illuminated with a 300 W Xe arc lamp for 4 h while stirring after the system was purged with argon gas for 5 cycles. After that, the solid was isolated by centrifugation, washed several times with water and dried overnight under vacuum to yield 120 mg of Pt–SrTiO3:Cr nanocrystals.
Photochemical H2 evolution was measured by irradiating 110 mg of Pt-SrTiO3:Cr photocatalyst dispersed in 100 mL of a 20% aqueous methanol solution at neutral pH. Irradiations were performed in a round bottom quartz flask. The light from a 300 W Xe arc lamp was filtered through an aqueous NaNO2 solution as long-pass filter (λ > 400 nm) and some of the infra-red portion of the spectrum. The intensity at the flask was 600 mW cm−2 measured by GaAsP photodetector for the 250–680 nm interval. The quartz flask was connected to vacuum and to a gas chromatograph (Varian 3800) by an air-tight circulation system that allowed the sample flask to be evacuated and purged with argon before taking measurements. Apparent Quantum Yield (AQE) measurements were completed by using a monochromatic 435 nm LED (light intensity = 19.3 mW cm−2).
Powder X-ray diffraction scans were performed using a Bruker D8 Advance Eco with a Cu Kα X-ray radiation and a monochromatic wavelength of 1.5418 Å. Transmission electron microscopy (TEM) micrographs were collected using a Philips CM-120 TEM instrument at 120 kV accelerating voltage. Samples were prepared by immersing copper TEM grids with carbon film into dilute suspensions of SrTiO3:Cr, followed by drying at room temperature. Scanning electron microscopy (SEM) images were recorded using Philips XL-30 Scanning Electron Microscope. Samples for SEM were prepared by dropcoating aqueous solutions containing the particles onto pieces of an n-silicon wafer and allowed to dry in air while covered. X-ray photoelectron spectroscopy (XPS) were performed using a ScientaOmicron (ESCA+) XPS spectrometer with a high-performance hemispheric analyzer (EAC2000 sphere) with monochromatic Al Kα (hν = 1486.6 eV) radiation source. The operating pressure in the ultra-high vacuum chamber (UHV) during the analysis was 10−9 Pa. The XPS high resolution spectra were recorded at constant pass energy of 20 eV with a 0.05 eV per step, while the survey scan was taken at 50 eV pass energy with a 0.5 eV per step. XPS measurements were carried out using 50 mg of sample placed on a double-sided adhesive tape (5.0 × 5.0 mm), covering completely the surface area, in order to ensure that no XPS signal are due to the tape. The adventitious carbon C1s peak at 284.8 eV was used as reference for calibration. A Shirley background subtraction was performed before the curve fitting for all data. The atomic percentage is calculated on the basis of the relative peak intensities and using appropriate relative sensitivity factors (RSF). Valence band XPS data were calibrated by linear extrapolation of the signal to zero intensity and by equating the zero-intensity point to 0 eV binding energy, which is by definition the Fermi level of the sample. The adventitious carbon C1s peak at 284.8 eV forming on the sample surface during calcination in air was used as reference for calibration. UV-Vis diffuse reflectance spectra were recorded using a Thermo Scientific Evolution 220 Spectrometer equipped with an integrating sphere. The absorption data was converted to diffuse reflectance spectra using the Kubelka–Munk function [f(R) = (1 − R)2/(2R)] to correct for light scattering. Surface Photovoltage Spectroscopy (SPS) measurements were completed using a vibrating gold mesh Kelvin probe (Delta PHI Besocke) controlled with a Kelvin control 07 unit (Delta PHI Besocke, Germany). Samples were mounted inside a home-built vacuum chamber and equipped with quartz window and placed under vacuum (2 × 10⁻⁴ mbar). Illumination was done with monochromatic light from a 150 W Xe lamp filtered through an Oriel Cornerstone 130 monochromator (1–10 mW cm−2). Contact potential difference (CPD) values are quoted relative to the values in the dark. Illumination for the transient photovoltage experiments was performed at 2.50 eV (0.1 mW cm−2). Electric Polarization experiments were conducted as shown in Fig. 6a in air for one hour. For this, SrTiO3/Cr films on gold were prepared as described above and then covered with a 122.94 μm thick mica sheet (Electron Microscopy Sciences) and placed opposite of a gold coated glass slide as counter electrode. The gold substrate and counter electrode were connected to D.C. power source (154 V measured voltage) constructed by connecting sixteen 9 V alkaline batteries in series.
Results and discussion
SrTiO3:Cr nanocrystals were obtained as a brownish-yellow powder (Fig. 1a) in nearly quantitative yield by hydrothermal synthesis from TiO2, Sr(OH)2, and Cr(NO3)3 in water, using a modification of a published process.7,24 Electron microscopy images of SrTiO3:Cr are shown in Fig. 1a and b. The particles form well defined cubic-shaped nanocrystals with a mean diameter of 45 nm (±15 nm), similar to other transition metal-doped SrTiO3 nanoparticles, made by the same hydrothermal reaction.15 The phase purity and crystallinity of SrTiO3:Cr was confirmed by powder X-ray diffraction (Fig. 1c). All peaks can be indexed to the perovskite crystal structure. As expected, chromium doping did not shift the 2θ position of the diffraction peaks of SrTiO3 because the ionic radius of hexa-coordinate Cr3+ (62.0 pm) is very similar to that of Ti4+ (61.0 pm). The chemical surface composition of the SrTiO3:Cr nanostructures was characterized by X-ray photoelectron spectroscopy (XPS). Fig. 2a shows two Ti 2p peaks at 458.6 and 464.3 eV belonging to lattice Ti4+,25 and two peaks at 457.7 and 463.6 eV which are attributed to Ti3+ species. The relative atomic percentages of Ti4+ and Ti3+ are 78.8% and 21.2 at%. The latter is located predominantly at the SrTiO3:Cr surface, based on earlier XPS studies for SrTiO3.26 The Cr 2p spectrum exhibit two doublet peaks which can be assigned to Cr3+ species (586 eV and 576 eV) and Cr6+ (590 eV and 580 eV), respectively. The relative amounts are 68.3% Cr3+ and 31.7% Cr6+. Based on the XPS survey spectrum (Fig. S1, ESI†), the Cr3+ ion concentration on the surface of the sample is estimated as 2.05 at% (based on B lattice sites). Fig. 2c shows the valence band XPS spectrum for the SrTiO3:Cr nanocrystals. The measured VB edge energy position was 1.73 eV relative to its Fermi level, which is close to the reported value (1.69 eV) for SrTiO3.10 This shows that the Cr3+ species does not significantly shift the VB edge, as further supported by the optical data below.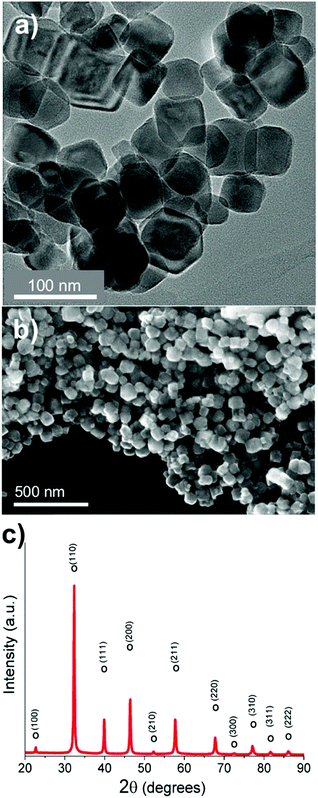 | ||
| Fig. 1 (a) TEM and (b) SEM images, (c) powder X-ray diffraction pattern of SrTiO3:Cr nanocrystals. All observed peaks can be assigned to the perovskite crystal structure (pdf card #01-080-4368). | ||
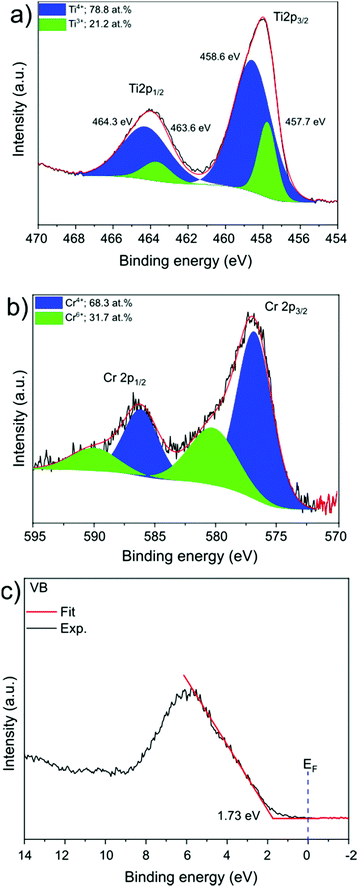 | ||
| Fig. 2 XPS spectra of the core level of the (a) Ti 2p region (b) Cr 2p region, and (c) valence band XPS spectrum. | ||
To investigate the optical properties of the SrTiO3:Cr samples, UV-vis diffuse reflectance spectra were collected for SrTiO3:Cr and plotted as the Kubelka Munk function in (Fig. 3a). The spectrum for the Cr-doped nanocrystals shows two major absorptions with onsets at 2.3 eV (544 nm) and at 3.2 eV. While the latter belongs to the light absorption by the SrTiO3 host,27 the former can be assigned to electronic transition from occupied Cr3+ 3d orbitals to the unoccupied Ti 3d orbitals, as shown in Fig. 3b.16,19,28–30 Spectra also show a weak absorption tail at 1.8–2.3 eV that can be assigned to Cr6+ species which can form as a result of air oxidation of Cr-doped SrTiO3.17 Indeed, prolonged storage in air increases the optical absorption below 2.5 eV (Fig. S2, ESI†). Based on the XPS data in Fig. 2 the Cr6+ ions in fresh samples are concentrated at the nanocrystal surface.
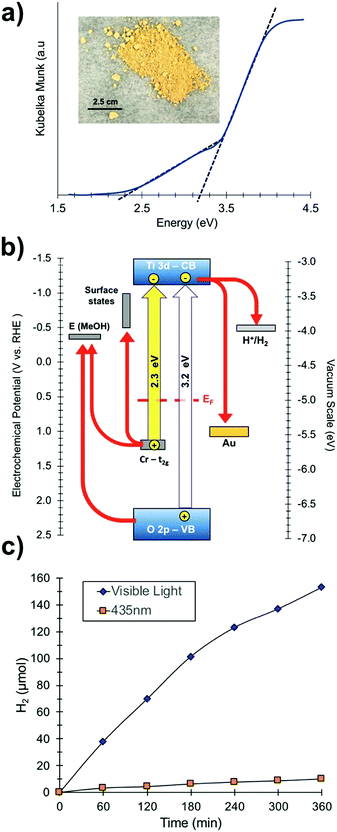 | ||
| Fig. 3 (a) UV-vis diffuse reflectance optical spectra of SrTiO3:Cr films (see also Fig. S2, ESI†). Inset: Optical photograph of SrTiO3:Cr powder. (b) Energy diagram showing band edges and substrate work functions at the point of zero charge (near pH 7). EF (0.55 eV) from UV-PS data in Fig. 2c. Ti3+ states and SrTiO3 band edges from Ma et al.34 Gold workfunction from Lide et al.35 (c) H2 evolution from suspension of Pt-SrTiO3:Cr nanocrystals: 110 mg of photocatalyst in 20% (vol) aqueous methanol solution at pH 7 under visible light irradiation (λ > 400 nm, 270 mW cm−2) or illumination at 435 nm from an LED (19.3 mW cm−2). | ||
To evaluate the photochemical activity for H2 evolution, freshly prepared SrTiO3:Cr nanocrystal powders were modified with 0.5 wt% platinum nanoparticles by photodeposition and dispersed in a 20 vol% aqueous methanol solution (Fig. 3c). Under broad band illumination, steady H2 production is observed over the 5 h interval, with rates declining from 38.02 μmol h−1 during the first hour to 25.53 μmol h−1 during the last hour. In contrast, non-doped SrTiO3 nanocrystals have only minimal activity for H2 evolution under visible light (>400 nm).15 This suggests that the visible light activity of SrTiO3:Cr is due to excitation of Cr states, as shown in Fig. 3b. Under 435 nm illumination (LED, 19.3 mW cm−2), H2 was produced at up to 1.66 μmol h−1 corresponding to an apparent quantum efficiency of 0.66%. The activity drops slightly (to 0.61%) after particles are isolated by centrifugation and re-suspended in aqueous methanol (Fig. S3, ESI†). These values are much lower than what has been reported for La,Cr co-doped SrTiO3 (25.6% at 425 nm) from 5 M KOH/20 vol% MeOH solution.20 The higher activity in that case is attributed equally to the high pH of ∼14.5 and to the presence of the La dopant. Lanthanum ions have been shown to suppress the oxidation of Cr3+ to Cr6+, which is an electron–hole recombination site in SrTiO3.14,31,32 Additionally, the lower pH promotes methanol oxidation.33
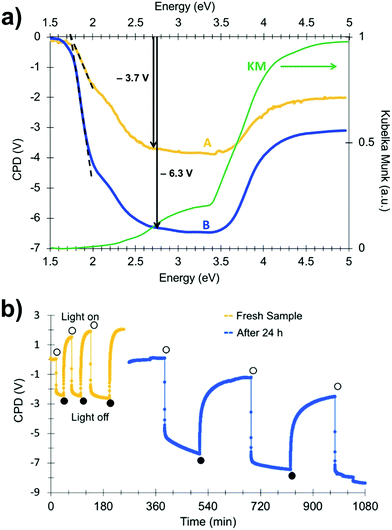
In order to gain more insight into photochemical charge separation in the SrTiO3:Cr particles, surface photovoltage spectroscopy (SPS) experiments were conducted. In SPS, the contact potential difference (CPD) of a sample film on top of a conductive substrate is recorded with a contactless Kelvin probe as a function of the incident photon energy.36–38 The change of the CPD under illumination (the photovoltage) provides information about the majority carrier type, the effective band gap, and defects in the sample.24,39–43 Measurements were conducted under vacuum conditions on SrTiO3:Cr particle films deposited onto gold-coated glass substrates. The SPS data for a fresh sample (A) is shown in Fig. 4a together with an optical absorption spectrum of the material. The negative photovoltage is attributed to transfer of electrons from Cr3+ states into the SrTiO3 conduction band and from there to the gold substrate, as shown in Fig. 3b. Electrons are the majority carriers suggesting that SrTiO3:Cr is an n-type semiconductor despite its Fermi level near the mid gap position. The onset of the photovoltage lies near 1.75 eV, nearly 0.6 eV below the optical absorption from the Cr3+ states. The detailed reasons for this early photovoltage onset are not clear. Tentatively, we attribute it to acceptor states 1.75 eV above the SrTiO3 valence band that are caused by oxygen vacancy complexes {Ti4+, VO} in the material.10 As can be seen from Fig. 4a, the photovoltage reaches approximately −3.7 V at 2.7 eV and increases only mildly upon excitation of the SrTiO3 host at 3.2 eV. At photon energies above 3.5 eV, the photovoltage decays due to decreasing light intensity of the Xe lamp (for Xe emission spectrum see ref. 43) and due to the finite light penetration depth of the sample.
Interestingly, when the spectrum is recorded again for a sample that was illuminated with 2.5 eV light and then kept in the dark under vacuum for 24 h, the photovoltage increases over almost the entire spectral range (spectrum B in Fig. 4a). At 2.7 eV, the photovoltage reaches −6.3 V, a 70% increase over the fresh sample. This increased photovoltage cannot be explained on the basis of the energy diagram in Fig. 3b. According to that diagram, the Au/SrTiO3:Cr configuration can produce a maximum photovoltage of −4.2 V (−2.1 V from electron transfer from the SrTiO3 conduction band into the gold substrate and −2.1 V from hole trapping at Ti3+ surface sites).34 In order to investigate the reason for the abnormally large photovoltage, SPS scans were repeated for a fresh sample under transient monochromatic illumination at 2.50 eV. As can be seen from Fig. 4b, the initial cycle only produces a photovoltage of −2.4 V, but sequential illumination cycles gradually increase the value to −4.2 V. When the sample film is kept under vacuum and in the dark for 24 h and is again exposed to monochromatic light at 2.50 eV, it produces a −5.5 V photovoltage. However, the anomalous photovoltage is quenched entirely when the sample is stored in air for 12 h (Fig. S4, ESI†). Furthermore, the scans in Fig. 4b show that photovoltage generation and decay occur on different timescales. Photovoltage formation is observed on the 10 s timescale, which indicates that electron transfer from SrTiO3:Cr to the gold substrate occurs by an electric field assisted process (drift). Similar drift processes were observed before in samples of CdSe quantum dots44 films of P3HT,45,46 and at the surface of silicon wafers.40 The photovoltage decay, on the other hand is much slower, requiring ∼100 s in the first set of scans (yellow curve), and over 500 s in the second set (blue curve). This slower timescale is typically associated with the diffusion of charge carriers, as previously seen for other nanostructured light absorbers, incl. HCa2Nb3O10 nanosheets,41 Fe2O3 nanowires47 and BiVO4 particles.40 The data in Fig. 4b suggests that charge transport in the dark becomes slower after each illumination cycle.
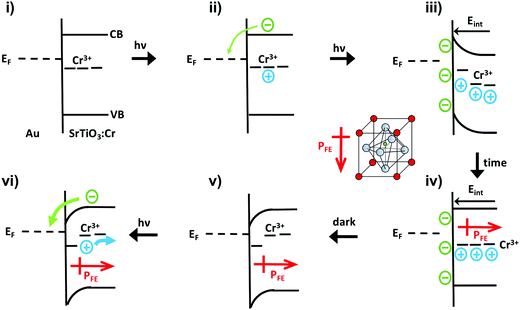
The unusual photovoltage behaviour of the Au/SrTiO3:Cr nanocrystal films can be explained with the ferroelectric (FE) polarization mechanism shown in Fig. 5. In the dark, there is no electric field across the nanocrystal film and the bands stay flat (i). Under illumination, electrons are injected into the gold substrate leaving the nanocrystal film positively charged (ii/iii). The electric field associated with the depletion layer (iii) polarizes the nanocrystals to produce a semi-permanent ferroelectric dipole (iv) that grows over time. When the light is turned off, electrons flow back into the nanocrystal film, but the electric dipole persists and causes the contact potential to increase above the initial value (v).
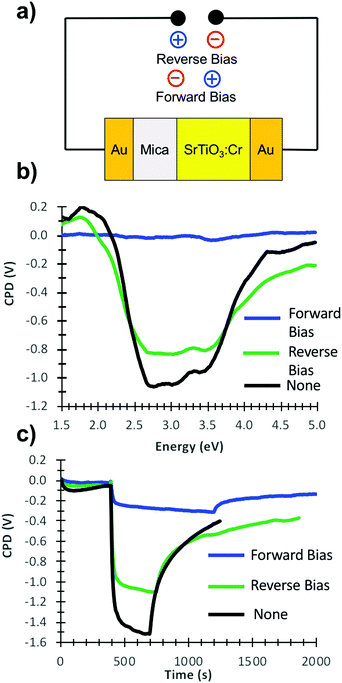
Photoelectrons generated in subsequent illumination cycles now move with or against the electric field of the ferroelectric dipoles (vi), causing the fast abnormal photovoltage signal in Fig. 4 and the increasingly slow baseline recovery in later scans. On the basis of the −5.5 V ΔCPD value, the ferroelectric polarization is estimated as 0.9 × 10⁶ V m−1 across the 6.0 μm thick film. This corresponds to a 41 mV potential difference across a single 45 nm thick SrTiO3:Cr nanocrystal. The presence of the FE dipole also explains why baseline recovery (177 min) takes 16 times longer than photovoltage formation (11 min). This is because electrons under illumination move along the dipole, but have to move against it when the light is turned off. To confirm the ferroelectric polarization in Fig. 5, surface photovoltage spectra and transient photovoltage signals were recorded for Au/SrTiO3:Cr films after polarization in a static electric field in air. Electric polarization was performed as shown in Fig. 6a, in forward or reverse bias, with the polarity of the applied potential (154 V) defined in the figure. Immediately after electric polarization, samples were placed under vacuum and their photovoltage was measured. As the data in Fig. 6b and c shows, forward bias nearly completely quenches the negative surface photovoltage in both the spectral and also in the time resolved domains. This agrees with the model in above. A forward electric bias polarizes the material in the opposite way as during the step iii in Fig. 5. Because the generated ferroelectric dipole opposes the movement of photoelectrons into the gold substrate, it reduces the negative photovoltage. On the other hand, the reverse bias polarizes the films as in step iii in Fig. 5, thereby promoting electron injection into the gold substrate. The lack of a photovoltage enhancement in Fig. 6 compared to a non-polarized film is attributed to the limited stability of the ferroelectric polarization nanocrystals in air, as mentioned above and as shown in Fig. S4 (ESI†). Details of the deactivation mechanism and of the atomic level origin of the effect are subject to ongoing studies. Tentatively, we believe that the FE polarization involves the movement of either Cr3+ or photogenerated Cr4+ cations in the perovskite unit cell, as shown in the inset in Fig. 5.
Conclusion
In summary, cubic SrTiO3:Cr nanocrystals in the perovskite structure type with 2.05% atomic Cr3+ content and an optical band gap of 2.3 eV were synthesized by hydrothermal reaction and observed to catalyse hydrogen evolution from aqueous methanol solution with quantum efficiencies of up to 0.66% at 435 nm. According to surface photovoltage spectroscopy, the SrTiO3:Cr nanocrystals are n-type and have an effective band gap of 1.75 eV. Under transient illumination, SrTiO3:Cr nanocrystal films on gold show an anomalous −6.3 V surface photovoltage that can be explained on the basis of ferroelectric polarization of SrTiO3:Cr in the depletion layer near the Au interface. The polarization is stable for 24 h in vacuum, but degrades within 12 h in air, due to an unknown mechanism. Electric polarization experiments confirm the effect of electric fields (1.20 MV m−1) on the surface photovoltage behaviour of SrTiO3:Cr films. The finding of a ferroelectric effect in SrTiO3:Cr is not unexpected. Ferroelectric effects are commonly observed in SrTiO3 after doping with Sn,48 Ca,28,49 Pr,50 and Fe,51 and are also well documented for BaTiO3 where the electric dipole moment results from the displacement of Ti4+ ions from their equilibrium position.52 Because electric dipoles aid photocarrier separation,52–55 ferroelectric light absorbers are of interest for the construction of photocatalysts56,57 and photovoltaics53,58 with increased open-circuit voltage and potentially higher power conversion efficiency.Author contributions
The experiments were designed by FEO and carried out by SA and BAN with additional contributions by RVG, JRM and SEL. The manuscript was prepared by FO. All authors have given approval to the final version of the manuscript.Conflicts of interest
The author declares no competing financial interests.Acknowledgements
We thank Prof. Adam Moulé (UC Davis) for access to the profilometer and the National Science Foundation for financial support (grant CHE 1464938 and CHE 1900136) of this work.References
- A. J. Bard and M. A. Fox, Acc. Chem. Res., 1995, 28, 141–145 CrossRef CAS.
- D. M. Fabian, S. Hu, N. Singh, F. A. Houle, T. Hisatomi, K. Domen, F. E. Osterloh and S. Ardo, Energy Environ. Sci., 2015, 8, 2825–2850 RSC.
- S. Chen, T. Takata and K. Domen, Nat. Rev. Mater., 2017, 2, 17050 CrossRef CAS.
- F. E. Osterloh, ACS Energy Lett., 2016, 1, 1060–1061 CrossRef CAS.
- J. G. Mavroides, J. A. Kafalas and D. F. Kolesar, Appl. Phys. Lett., 1976, 28, 241–243 CrossRef CAS.
- K. Domen, A. Kudo and T. Onishi, J. Catal., 1986, 102, 92–98 CrossRef CAS.
- T. K. Townsend, N. D. Browning and F. E. Osterloh, ACS Nano, 2012, 6, 7420–7426 CrossRef CAS PubMed.
- F. E. Osterloh, Chem. Mater., 2008, 20, 35–54 CrossRef CAS.
- Y. Goto, T. Hisatomi, Q. Wang, T. Higashi, K. Ishikiriyama, T. Maeda, Y. Sakata, S. Okunaka, H. Tokudome, M. Katayama, S. Akiyama, H. Nishiyama, Y. Inoue, T. Takewaki, T. Setoyama, T. Minegishi, T. Takata, T. Yamada and K. Domen, Joule, 2018, 2, 509–520 CrossRef CAS.
- Z. Zhao, R. V. Goncalves, S. K. Barman, E. J. Willard, E. Byle, R. Perry, Z. Wu, M. N. Huda, A. J. Moulé and F. E. Osterloh, Energy Environ. Sci., 2019, 12, 1385–1395 RSC.
- R. Konta, T. Ishii, H. Kato and A. Kudo, J. Phys. Chem. B, 2004, 108, 8992–8995 CrossRef CAS.
- R. Niishiro, H. Kato and A. Kudo, Phys. Chem. Chem. Phys., 2005, 7, 2241–2245 RSC.
- T. Ohno, T. Tsubota, Y. Nakamura and K. Sayama, Appl. Catal., A, 2005, 288, 74–79 CrossRef CAS.
- Q. Wang, T. Hisatomi, Q. Jia, H. Tokudome, M. Zhong, C. Wang, Z. Pan, T. Takata, M. Nakabayashi, N. Shibata, Y. Li, I. D. Sharp, A. Kudo, T. Yamada and K. Domen, Nat. Mater., 2016, 15, 611–615 CrossRef CAS.
- X. Ma, X. Cui, Z. Zhao, M. A. Melo, E. J. Roberts and F. E. Osterloh, J. Mater. Chem. A, 2018, 6, 5774–5781 RSC.
- H. Kato and A. Kudo, J. Phys. Chem. B, 2002, 106, 5029–5034 CrossRef CAS.
- T. Ishii, H. Kato and A. Kudo, J. Photochem. Photobiol., A, 2004, 163, 181–186 CrossRef CAS.
- R. Abe, K. Sayama and H. Sugihara, J. Phys. Chem. B, 2005, 109, 16052–16061 CrossRef CAS.
- J. W. Liu, G. Chen, Z. H. Li and Z. G. Zhang, J. Solid State Chem., 2006, 179, 3704–3708 CrossRef CAS.
- S. X. Ouyang, H. Tong, N. Umezawa, J. Y. Cao, P. Li, Y. P. Bi, Y. J. Zhang and J. H. Ye, J. Am. Chem. Soc., 2012, 134, 1974–1977 CrossRef CAS PubMed.
- K. Sayama, K. Mukasa, R. Abe, Y. Abe and H. Arakawa, J. Photochem. Photobiol., A, 2002, 148, 71–77 CrossRef CAS.
- K. A. Lehuta and K. R. Kittilstved, Dalton Trans., 2016, 45, 10034–10041 RSC.
- Z. B. Jiao, Y. Zhang, T. Chen, Q. S. Dong, G. X. Lu and Y. P. Bi, Chem. – Eur. J., 2014, 20, 2654–2662 CrossRef CAS PubMed.
- J. Wang, J. Zhao and F. E. Osterloh, Energy Environ. Sci., 2015, 8, 2970–2976 RSC.
- R. P. Vasquez, Surf. Sci. Spectra, 1992, 1, 129–135 CrossRef CAS.
- S. Ferrer and G. A. Somorjai, Surf. Sci., 1980, 94, 41–56 CrossRef CAS.
- K. v. Benthem, C. Elsasser and R. H. French, J. Appl. Phys., 2001, 90, 6156–6164 CrossRef.
- S. A. Basun, U. Bianchi, V. E. Bursian, A. A. Kaplyanskii, W. Kleemann, P. A. Markovin, L. S. Sochava and V. S. Vikhnin, Ferroelectrics, 1996, 183, 255–264 CrossRef CAS.
- J. Wang, T. Fang, S. Yan, Z. Li, T. Yu and Z. Zou, Comput. Mater. Sci., 2013, 79, 87–94 CrossRef CAS.
- R. B. Comes, P. V. Sushko, S. M. Heald, R. J. Colby, M. E. Bowden and S. A. Chambers, Chem. Mater., 2014, 26, 7073–7082 CrossRef CAS.
- Q. Wang, T. Hisatomi, S. S. K. Ma, Y. Li and K. Domen, Chem. Mater., 2014, 26, 4144–4150 CrossRef CAS.
- T. Takata and K. Domen, J. Phys. Chem. C, 2009, 113, 19386–19388 CrossRef CAS.
- P. Wu, J. Wang, J. Zhao, L. Guo and F. E. Osterloh, Chem. Commun., 2014, 50, 15521–15524 RSC.
- X. Ma, Z. Wu, E. J. Roberts, R. Han, G. Rao, Z. Zhao, M. Lamoth, X. Cui, R. D. Britt and F. E. Osterloh, J. Phys. Chem. C, 2019, 123, 25081–25090 CrossRef CAS.
- D. R. Lide, in CRC Handbook of Chemistry and Physics, CRC Press/Taylor and Francis, Boca Raton, FL, 88 (Internet Version 2008) edn, 2008 Search PubMed.
- L. Kronik and Y. Shapira, Surf. Sci. Rep., 1999, 37, 1–206 CrossRef CAS.
- T. Dittrich, S. Fiechter and A. Thomas, Appl. Phys. Lett., 2011, 99, 084105-084101–084105-084103 CrossRef.
- D. Gross, I. Mora-Sero, T. Dittrich, A. Belaidi, C. Mauser, A. J. Houtepen, E. Da Como, A. L. Rogach and J. Feldmann, J. Am. Chem. Soc., 2010, 132, 5981–5983 CrossRef CAS PubMed.
- B. A. Nail, J. M. Fields, J. Zhao, J. Wang, M. J. Greaney, R. L. Brutchey and F. E. Osterloh, ACS Nano, 2015, 9, 5135–5142 CrossRef CAS PubMed.
- Y. Yang, J. Wang, J. Zhao, B. A. Nail, X. Yuan, Y. Guo and F. E. Osterloh, ACS Appl. Mater. Interfaces, 2015, 10, 5959–5964 CrossRef PubMed.
- J. Zhao and F. E. Osterloh, J. Phys. Chem. Lett., 2014, 5, 782–786 CrossRef CAS PubMed.
- J. Zhao, B. A. Nail, M. A. Holmes and F. E. Osterloh, J. Phys. Chem. Lett., 2016, 3335–3340, DOI:10.1021/acs.jpclett.6b01569,.
- M. A. Melo, Z. Wu, B. A. Nail, A. T. De Denko, A. F. Nogueira and F. E. Osterloh, Nano Lett., 2018, 18, 805–810 CrossRef CAS PubMed.
- J. Zhao, B. A. Nail, M. A. Holmes and F. E. Osterloh, J. Phys. Chem. Lett., 2016, 7, 3335–3340 CrossRef CAS PubMed.
- F. E. Osterloh, M. A. Holmes, L. Chang, A. J. Moulé and J. Zhao, J. Phys. Chem. C, 2013, 117, 26905–26913 CrossRef CAS.
- F. E. Osterloh, M. A. Holmes, J. Zhao, L. Chang, S. Kawula, J. D. Roehling and A. J. Moulé, J. Phys. Chem. C, 2014, 118, 14723–14731 CrossRef CAS.
- T. L. Shelton, N. Harvey, J. Wang and F. E. Osterloh, Appl. Catal., A, 2016, 521, 168–173 CrossRef CAS.
- S. Suzuki, A. Honda, N. Iwaji, S. I. Higai, A. Ando, H. Takagi, H. Kasatani and K. Deguchi, Phys. Rev. B: Condens. Matter Mater. Phys., 2012, 86, 060102 CrossRef.
- J. G. Bednorz and K. A. Müller, Phys. Rev. Lett., 1984, 52, 2289–2292 CrossRef CAS.
- A. Durán, E. Martínez, J. A. Díaz and J. M. Siqueiros, J. Appl. Phys., 2005, 97, 104109 CrossRef.
- A. S. Kumar, P. Suresh, M. M. Kumar, H. Srikanth, M. L. Post, S. Kathy, M. Ralf and S. Srinath, J. Phys.: Conf. Ser., 2010, 200, 092010 CrossRef.
- J. L. Giocondi and G. S. Rohrer, Chem. Mater., 2001, 13, 241–242 CrossRef CAS.
- S. Y. Yang, J. Seidel, S. J. Byrnes, P. Shafer, C. H. Yang, M. D. Rossell, P. Yu, Y. H. Chu, J. F. Scott, J. W. Ager, L. W. Martin and R. Ramesh, Nat. Nanotechnol., 2010, 5, 143–147 CrossRef CAS PubMed.
- L. Li, P. A. Salvador and G. S. Rohrer, Nanoscale, 2014, 6, 24–42 RSC.
- N. V. Burbure, P. A. Salvador and G. S. Rohrer, Chem. Mater., 2010, 22, 5823–5830 CrossRef CAS.
- M. A. Khan, M. A. Nadeem and H. Idriss, Surf. Sci. Rep., 2016, 71, 1–31 CrossRef CAS.
- S. Park, C. W. Lee, M.-G. Kang, S. Kim, H. J. Kim, J. E. Kwon, S. Y. Park, C.-Y. Kang, K. S. Hong and K. T. Nam, Phys. Chem. Chem. Phys., 2014, 16, 10408–10413 RSC.
- S. Y. Yang, L. W. Martin, S. J. Byrnes, T. E. Conry, S. R. Basu, D. Paran, L. Reichertz, J. Ihlefeld, C. Adamo, A. Melville, Y. H. Chu, C. H. Yang, J. L. Musfeldt, D. G. Schlom, J. W. Ager and R. Ramesh, Appl. Phys. Lett., 2009, 95, 062909 CrossRef.
Footnote |
| † Electronic supplementary information (ESI) available: XPS survey spectrum, optical absorption spectra, and transient photovoltage data. See DOI: 10.1039/d0ma00463d |
| This journal is © The Royal Society of Chemistry 2020 |

