 Open Access Article
Three-dimensional reduced graphene oxide powder for efficient microwave absorption in the S-band (2–4 GHz)†
Shuai
Fang
ab,
Daqing
Huang
d,
Ruitao
Lv
 *ac,
Yu
Bai
c,
Zheng-Hong
Huang
ac,
Jialin
Gu
c and
Feiyu
Kang
*abc
aState Key Laboratory of New Ceramics and Fine Processing, School of Materials Science and Engineering, Tsinghua University, Beijing 100084, China. E-mail: lvruitao@tsinghua.edu.cn
bEngineering Laboratory for Functionalized Carbon Materials, Graduate School at Shenzhen, Tsinghua University, Shenzhen 518055, China. E-mail: fykang@tsinghua.edu.cn
cKey Laboratory of Advanced Materials (MOE), School of Materials Science and Engineering, Tsinghua University, Beijing 100084, China
dBeijing Institute of Aeronautical Materials AVIC, Beijing 100095, China
First published on 12th May 2017
Abstract
Efficient absorption in the S-band (2–4 GHz) has been a very challenging task for developing high-performance microwave absorption materials. Three-dimensional reduced graphene oxide (3D-rGO) powders were prepared by using a hydrothermal method and subsequent thermal treatment. It is found that as-prepared 3D-rGO could significantly enhance the electromagnetic wave attenuation in 2–4 GHz. When the content in the paraffin matrix is 4%, the 3D-rGO shows the strongest absorption in S-band, and the absorption will get stronger with the increase of coating thickness. When the thickness is 5 mm, the bandwidth of reflection loss less than −5 dB is in the range of 2.3 to 4.1 GHz, that is, it can almost cover the whole S-band. The excellent microwave absorption could be attributed to the honeycomb-like structures and the strong polarization of 3D-rGO powders. Considering the low density and good corrosion resistance, 3D-rGO powders may serve as an excellent component for the design of lightweight electromagnetic wave absorption coatings.
Introduction
Microwave absorption materials have attracted much attention for their crucial applications in the fields of military aircrafts,1 environment protection, and communication equipments.2,3 Since the centimetre-band wave (2–18 GHz) is extremely important for radar detection, most of the shielding research focuses on this field. In particular, an efficient absorption of the S-band (2–4 GHz) wave with a high narrowest beam width is ideal for high-performance radar detection due to the high angular accuracy and angular resolution.4 However, for the microwave absorber, the S-band waves are not easy to be attenuated due to their long wavelengths. Therefore, developing high-performance microwave absorption materials in the S-band range has been a very challenging task. We previously found that the FeCo-filled carbon nanotubes (FeCo@CNTs) demonstrated an excellent absorption in C-band (4–8 GHz), X-band (8–12 GHz) and Ku-band (12–18 GHz), but the absorption in S-band (2–4 GHz) was very weak.5 So far, different materials have been explored as the microwave absorbing materials, such as ferrite,6,7 ultrafine metallic powders,8 and conductive carbon blacks.9 However, it is still a big challenge to develop lightweight and high-performance absorbers with efficient absorption in S-band to meet the increasing demands for wide-band microwave attenuation.In recent years, graphene-based absorbers have attracted much attention for their low density, excellent physical and chemical properties.10 Compared to graphite, two-dimensional (2D) graphene sheets exhibits a little bit better absorption in 2–4 GHz due to its high dielectric loss, and the reflection loss is between −1 to −3 dB in S-band.11 In order to improve magnetic loss properties of graphene, combinations of graphene and magnetic materials (e.g. ferrites) have been widely studied.12,13 For example, barium ferrite nanoparticles have been loaded onto reduced graphene oxide (rGO) sheets, and exhibits excellent absorption in medium-frequency band (6–12 GHz) and high-frequency band (12–18 GHz), but there are almost no absorption in S-band.16 Recently, three-dimensional (3D) graphene structures have attracted increasing research attentions, because they can not only keep the intrinsic properties of graphene, but also demonstrate more advanced features in virtue of their 3D structures.14,15 For microwave applications, highly compressible 3D graphene sponge has shown excellent absorption at the high-frequency bands ranged in 6–18, 26.5–40, and 75–110 GHz.16 However, their absorption in 2–4 GHz is still very weak (−2 to −5 dB).16 Moreover, the 3D sponge-like structures are not very compatible with traditional coating technique due to the foam-like structures, and thus limit their practical applications.
Herein, we report the use of three-dimensional reduced graphene oxide (3D-rGO) powder prepared by a hydrothermal method and subsequent thermal treatment as a good absorber in the S-band range. The honeycomb-like structure can remarkably improve the wave absorption even at a low weight percentage in the paraffin matrix. The excellent absorption in S-band range (2–4 GHz) suggests the great potential of 3D-rGO powder as good component for developing high-performance lightweight microwave absorbers.
Experimental
Preparation of 3D-rGO samples
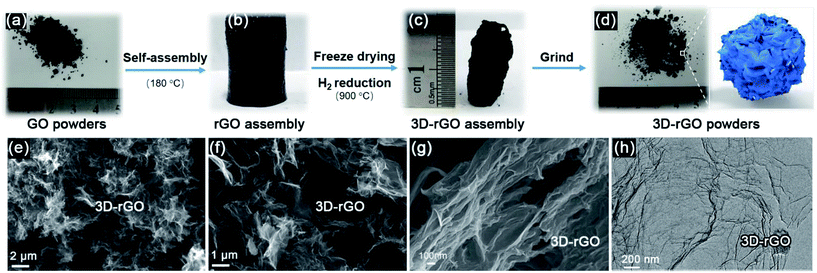
Graphene oxide (GO) was synthesized from natural graphite powders by a modified Hummers' method.17 All chemicals were of reagent grade and used without further treatment. 3D-rGO powders were prepared through hydrothermal method and thermal treatment. A typical run is as below: 200 mg GO was dispersed in 100 ml deionized water by ultrasonication for two hours, then the solution was transferred into a Teflon-lined autoclave reactor. The reactor was heated to 180 °C in 1 hour and maintained for 6 hours to form 3D-rGO assembly. After the samples were cooled down to room temperature, the samples were taken out of the reactor and freeze-dried. The water in 3D-GO assembly can be removed through freeze-drying. Next, the samples were transferred into an alumina crucible and loaded into a tube furnace filled with argon gas (Ar), and then reduced by hydrogen (H2) at 900 °C for 30 min. Finally, 3D-rGO assembly was ground into powders with sizes of ∼100 μm, as illustrated in Fig. 1.rGO powders were prepared as a control samples. The same procedure was followed to prepare a GO dispersion, and then water is removed at 80 °C. After that, the same heat treatment was carried out to obtain rGO powder aborbers.
Sample characterization and microwave absorption evaluation
The rGO and 3D-rGO powders were characterized with scanning electron microscopy (SEM, LEO-1530), transmission electron microscopy (TEM, FEI Talos F200X), X-ray diffraction (XRD, D8 Advance Diffractometer with a Cu Kα source) and Raman spectrometer (LabRAM HR Evolution).Electromagnetic parameters were collected with a vector network analyser (HP8722ES) in the frequency range from 2–18 GHz. The annular samples were prepared with different content of the powder samples in the paraffin matrix and pressed into a toroidal shaped mold with an inner diameter of 3.04 mm, outer diameter of 7.00 mm and thickness of about 2.00 mm.
The reflection loss (RL) of specimens was calculated through the generalized transmission line theory.18 The dependence of RL on the permittivity and permeability can be evaluated by the following equation:
RL = 20![[thin space (1/6-em)]](https://www.rsc.org/images/entities/char_2009.gif) log|(Zin − Z0)/(Zin + Z0)| log|(Zin − Z0)/(Zin + Z0)| | (1) |
 | (2) |
| μr = μ′ − jμ′′ | (3) |
| εr = ε′ − jε′′ | (4) |
Results and discussion
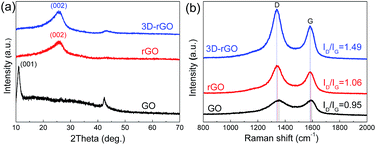
Fig. 1(a–d) illustrate that the process of 3D-rGO powder synthesis. Fig. 1(e–h) are the typical SEM and TEM images of as-synthesized 3D-rGO powder sample. It can be seen from Fig. 1(e–g) that 3D-rGO forms an irregular honeycomb-like structure, which will be beneficial to the efficient microwave absorption. Fig. 1(h) is a TEM image of 3D-rGO sample, which demonstrates the typical features of graphene sheets, such as high transparency caused by their atomic scale thicknesses. Moreover, some wrinkles can be clearly seen in Fig. 1(h), which is also a typical feature of substrate-free corrugated graphene sheets.Fig. 2(a) shows the XRD patterns of the GO, rGO and 3D-rGO. Different with graphite, the GO shows a sharp diffraction peak at 11°, corresponding to a large interplanar spacing of 0.74 nm. In the case of 3D-rGO, the appearance of the (002) peak and disappearance of the diffraction at 11° indicates the reduction of GO nanosheets.20 Moreover, the rGO has the same diffraction peak as well as 3D-rGO, it means rGO nanosheets in 3D-rGO are the same with independent rGO. Fig. 2(b) shows the Raman spectra of different samples. It can be seen that all three samples exhibit a prominent G-band (1582 cm−1) and D-band (1342 cm−1). The ID/IG intensity ratio increase from 0.95 of GO to 1.06 of rGO, and the ratio for 3D-rGO increase to 1.49. It suggests a decrease in the average size of the sp2 domains upon reduction of the exfoliated GO,21 and this indicates the removal of oxygen groups.22 It can be seen from Fig. 2(b) that the peaks of rGO and 3D-rGO show obvious blue shifts to those of GO. It is noteworthy that 3D-rGO shows a greater blue shift than rGO, which also indicates more defects were generated upon hydrothermal treatment of GO.23
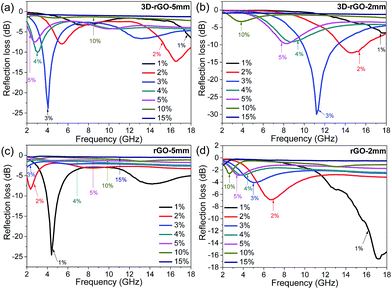
To investigate the effect of absorber content in matrix, the RL curves of 3D-rGO and rGO were evaluated with different content from 1 wt% to 15 wt%. Fig. 3(a) and (b) show the absorption performance for 3D-rGO-P% in the thicknesses of 5 mm and 2 mm respectively. Here P% denotes the content of absorbers in the matrix. It is clear that 3D-rGO-P% shows a better absorption in the thickness of 5 mm than that in the thickness of 2 mm in S-band. For 3D-rGO-5 mm, with the content increases from 1 wt% to 4 wt%, the absorption performance in 2–4 GHz increases. Then, the absorption performance reduces with a higher content absorber, 3D-rGO-5 mm would have the best performance when the content is 4%, the reflection loss peak for 3D-rGO-5 mm is −10.1 dB at 3.0 GHz and bandwidth less than −5 dB is 1.5 GHz (2.5 to 4.0 GHz). Moreover, it is noteworthy that the hydrogen reduction during 3D-rGO synthesis plays an important role in improving their microwave absorption in low-frequency band. Fig. S1† exhibits the reflection loss of 3D-rGO samples without and after hydrogen reduction at 900 °C for 30 min. It can be seen from Fig. S1† that the reflection loss peak moves from 7.5 GHz to 4.0 GHz after the hydrogen reduction treatment. Also, the maximum reflection loss of 3D-rGO after hydrogen reduction is −23.8 dB at 4.0 GHz, which is much stronger than that of 3D-rGO without hydrogen treatment (−19.3 dB at 7.5 GHz). This might be attributed to the improved dielectric property of 3D-rGO (shown in Fig. S2†) after the removal of oxygen-containing functional groups by hydrogen reduction.
Fig. 3(c) and (d) show the microwave absorption performance for rGO-P% with the thickness of 5 mm and 2 mm respectively. For rGO-P%, the absorption performance in 5 mm is superior to 2 mm for rGO in S-band. It exhibits that the microwave absorption performance is closely related to the content of absorber, and rGO-1% shows the strongest attenuation. The maximum reflection loss of rGO-1% in the thickness of 5 mm is −24.9 dB at 4.2 GHz while bandwidth less than −10 dB can reach to 2.7 GHz (from 3.5 to 6.2 GHz). The reflection loss peak gradually shifts toward a lower frequency with a higher content. It is obvious that there are two reflection loss peaks at 1 wt%, when the content exceeds 3 wt%, the peak of main absorption disappeared. With the increase of content, the absorbing ability of rGO is reduced in high frequency (6–18 GHz) band.
The relationship between the coating thickness and the absorption was further investigated. Fig. 4(a) shows the reflection loss of 3D-rGO-4% with different thicknesses of 1 mm, 2 mm, 3 mm, 4 mm, 5 mm. It can be seen that with the thickness increases, the peak of reflection loss moves towards the low frequency, and the absorption bandwidth less than −5 dB gradually narrowed. When the coating thickness is 1 mm, the reflection loss of 3D-rGO-4% in S-band is almost undetectable, as shown in Fig. 4(a). However, when the thickness is up to 4 mm, the reflection loss of 3D-rGO-4% in the S-band is remarkably enhanced and the bandwidth less than −5 dB reaches 2.1 GHz, that is, from 3.0 GHz to 5.1 GHz. Moreover, when the coating thickness is 5 mm, the reflection loss of 3D-rGO-4% reaches −5 dB at 2.4 GHz. It is noteworthy that the bandwidth less than −5 dB reaches 1.7 GHz (i.e. from 2.4 GHz to 4.1 GHz), which almost covers the entire S-band (2.0–4.0 GHz). Fig. 4(b) shows the reflection loss of rGO-1% in different thicknesses. The rGO-1% starts to exhibit detectable absorption when the coating thickness reaches 2 mm. It is obvious that the reflection loss of 3D-rGO-4% and rGO-1% have the same trend with the increase of thickness, but 3D-rGO shows much better absorption performance than that of rGO-1% in S-band. According to the following formula:24 , where fm is the frequency of the maximum reflection loss peak and d is the matching thickness, it is clear that the reflection loss peaks move to low frequency with the increase of thickness, which is consistent with our experimental results. As pointed out by Luo et al.,25 this can be attributed to the electromagnetic wave dimensional resonance with the increase of coating thickness. Therefore, the microwave absorption can be tailored by manipulating the thickness of 3D-rGO coatings for practical application. For 3D-rGO-4%, when the coating thickness reaches 4 mm, another absorption peak could be found in the high frequency (12–18 GHz) in sample.
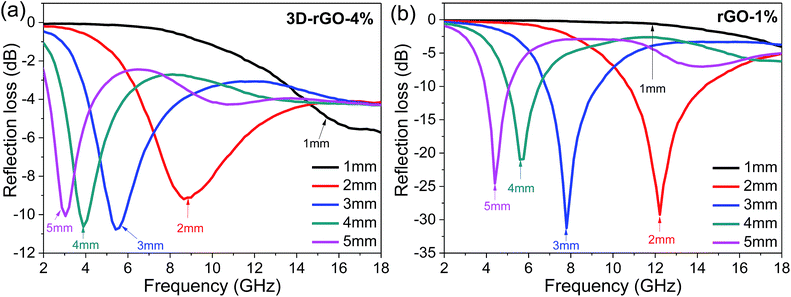 | ||
| Fig. 4 The reflection loss curves of samples with different coating thicknesses. (a) 3D-rGO with 4 wt% content in matrix (b) rGO with 1 wt% content in matrix. | ||
Fig. 5 shows the comparison of 3D-rGO-4% with other reported absorbers in a coating thickness of 4 mm. Remarkably enhanced absorption can be found in S-band (2.0–4.0 GHz). In particular, the 3D-rGO-4% demonstrates a reflection loss of −5 dB at 2.4 GHz, and the bandwidth less than −5 dB reaches 1.7 GHz (2.4–4.1 GHz). Considering its content in matrix is also very low (4 wt%), 3D-rGO powders are promising to serve as highly efficient and lightweight absorbers for aircraft applications.
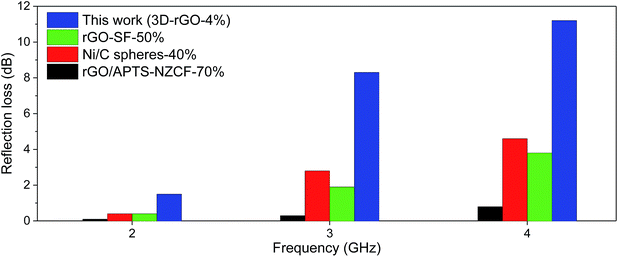 | ||
| Fig. 5 Reflection loss of different samples in S-band with a coating thickness of 4 mm. rGO–SF with 50 wt% content,26 Ni/C spheres with 40 wt% content,27 rGO/APTS–NZCF with 70 wt% content in matrix.28 Here SF, APTS and NZCF denote hollow glass spheres@Fe3O4, aminopropyltriethoxy silane and Ni0.4Zn0.4Co0.2Fe2O4, respectively. | ||
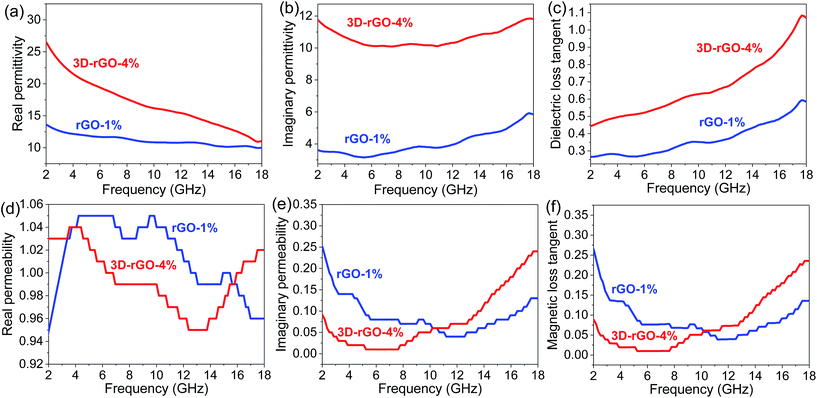
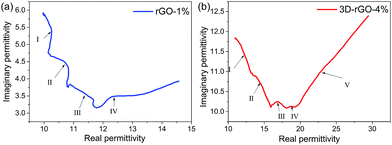
Fig. 6 shows the frequency dependence on the electromagnetic parameters of the rGO-1% and 3D-rGO-4% samples. It can be seen from Fig. 6(a) that the real part (ε′) of rGO-1% and 3D-rGO show obvious fluctuations. This may be attributed to the leakage conductance and lags of polarization in low frequency, and the interfacial polarization and the associated relaxation in high frequency.19,29 According to the free electron theory, higher ε′ means more storage of electric energy,30 and higher ε′′ indicates higher conductivity.2 Therefore, 3D-rGO-4% can store more energy and possess a higher conductivity than that of rGO-1% sample (Fig. 6(b)).
It can be seen from Fig. 6(d) and (e) that the real part μ′ and imaginary part μ′′ of both rGO-1% and 3D-rGO-4% samples show little fluctuation on different frequencies around 1.0 and 0.1, respectively. The value of imaginary part of permeability is lower than 0.3. With the frequency increases, the value has fluctuations around 0.1. This indicates the weak magnetic loss properties of the rGO-1% and 3D-rGO-4%. The residual defects and groups in rGO and 3D-rGO can improve the impedance matching characteristics, it will cause the transition from contiguous states to Fermi level, defect polarization relaxation, and groups' electronic dipole polarization relaxation, all of which will greatly facilitate the microwave penetration and absorption.19,31 The zig-zag edges of graphene are responsible for the magnetic properties, which is also a possible contribution for the magnetic loss.32 It could be found that the imaginary part of permittivity and permeability play important roles in the reflection loss of different samples. In general, the 3D-rGO-4% demonstrates better electromagnetic propagation loss than that of rGO-1% sample.
To study the loss properties of incident electromagnetic wave attenuation as a microwave absorber, the dielectric loss tangent (tan![[thin space (1/6-em)]](https://www.rsc.org/images/entities/char_2009.gif) ε = ε′′/ε′) and magnetic loss tangent (tan
ε = ε′′/ε′) and magnetic loss tangent (tan![[thin space (1/6-em)]](https://www.rsc.org/images/entities/char_2009.gif) μ = μ′′/μ′) of the rGO-1% and 3D-rGO-4% are calculated and shown in Fig. 6(c) and (f), respectively. For the dielectric tangent loss, the value of 3D-rGO-4% is greater than that of rGO-1% in 2–18 GHz. However, the magnetic tangent loss of rGO-1% is slightly higher than that of the 3D-rGO-4% from 2–10 GHz. Considering the contributions of both dielectric loss and magnetic loss, the 3D-rGO-4% would have a better microwave absorption from 2–4 GHz, and the rGO-1% would have a better absorption property from 4–10 GHz. This is also in good agreement with the reflection loss results (Fig. 4(b)).
μ = μ′′/μ′) of the rGO-1% and 3D-rGO-4% are calculated and shown in Fig. 6(c) and (f), respectively. For the dielectric tangent loss, the value of 3D-rGO-4% is greater than that of rGO-1% in 2–18 GHz. However, the magnetic tangent loss of rGO-1% is slightly higher than that of the 3D-rGO-4% from 2–10 GHz. Considering the contributions of both dielectric loss and magnetic loss, the 3D-rGO-4% would have a better microwave absorption from 2–4 GHz, and the rGO-1% would have a better absorption property from 4–10 GHz. This is also in good agreement with the reflection loss results (Fig. 4(b)).
When the dipole and electron polarizations could not match up with the changes of microwave field, it will cause the Debye relaxation, which will contribute to the dielectric loss enhancement and microwave energy dissipation. The process can be described by the Cole–Cole curves. The following formula could be derived by Debye process,33
| (ε′ − ε∞)2 + (ε′′)2 = (εs − ε∞)2 | (5) |
Therefore, ε′′ − ε′ dependence will behave as a semicircle in the Cole–Cole curve. For the relaxation time is constantly changing, and the equation of Debye progress of relaxation time is a fixed value, so the Cole–Cole curve for most of the dielectric materials does not conform to the Debye equation, which lead to the shape of the final curve is an arc instead of a standard semicircle. Fig. 7 shows the Cole–Cole curves of rGO-1% and 3D-rGO-4% samples. Semicircles can be observed in the ε′ − ε′′ curves of the rGO-1% and 3D-rGO-4%, and the diameter of 3D-rGO-4% is larger than that of rGO-1%. Fig. 7 exhibits that both rGO-1% and 3D-rGO-4% have multiple relaxation progresses, which can effectively improve the microwave attenuation. For rGO-1%, the Debye relaxation with four semicircles and 3D-rGO-4% has five Debye relaxation semicircles. In the Cole–Cole diagram, a semicircle means a relaxation progress. Multiple relaxation will cause greater microwave loss.34 In short, the absorbing materials will demonstrate a better performance with the increase of Debye relaxation.35
Based on the previous studies,36,37 it can be concluded that extra high dielectric value is not ideal for improving the microwave absorption, considering impedance matching is also very important.38 3D-rGO and rGO's electromagnetic parameters and reflection losses show that both of the losses are mainly dielectric loss, and both have a weak magnetic loss, so the dielectric value cannot be too high to break the matching. This is also the reason why the content has the upper limit. As shown in Fig. 3(a), 3D-rGO-5 mm has an optimum content in the matrix. The microwave absorption performance will degrade if exceeding this content.
When the incident waves reach the polymer-based coating, part of them are absorbed, while the others are reflected. For rGO, there is a single-direction reflection for rGO flakes, and the reflected waves of different absorption units have interfered absorption at the specifically optical path difference. In the case of 3D-rGO powders, their honeycomb-like structures allow the incident waves producing multiple reflection in an absorption unit and the same direction incident microwaves can produce reflected waves in different directions. In this way, the reflection waves between the different absorption units are more likely to interfere and lead the energy loss of the microwaves. In the range of 2–18 GHz, S-band has a longer wavelength, it means that S-band electromagnetic waves are more prone to be diffracted. In 3D-rGO, the honeycomb-like structure may trap the electromagnetic waves in the absorption unit after diffraction and demonstrate a better absorption performance in S-band that of rGO flakes. In addition, the Raman spectra shows that 3D-rGO sample has more defects that of rGO, the polarization of the defect will enhance the absorption property, which may also contribute to the efficient absorption in S-band.
Conclusions
In conclusion, the honeycomb-like structure of 3D-rGO significantly improves the microwave absorption in S-band (2–4 GHz). Adding 4 wt% 3D-rGO powders in the matrix, the bandwidth of reflection loss below −5 dB (2.3–4.1 GHz) can cover almost the whole S-band with a coating thickness of 5 mm. It is demonstrated that abundant defects produced in 3D-rGO after hydrothermal treatment results in a stronger polarization and thus contribute to a strong absorption in S-band. Owing to the good compatibility of 3D-rGO powders with conventional coating technique, they be used as promising component wave absorber in low-frequency for the practical applications.Acknowledgements
We acknowledge the financial support from the National Natural Science Foundation of China (Grant No. 51372131, 51232005), Beijing Nova Program (Grant No. Z161100004916099) and the Tsinghua University Initiative Scientific Research Program. D. H. acknowledges the program of Beijing Municipal Science and Technology Commission (Grant No. D14110300240000), Y. B. acknowledges the Fund of Key Laboratory of Advanced Materials of Ministry of Education (No. 2016AML02) and the National Natural Science Foundation of China (Grant No. 51602171) for the financial support.References
- T. Wang, Y. Li, L. Wang, C. Liu, S. Geng, X. Jia, F. Yang, L. Zhang, L. Liu, B. You, X. Ren and H. Yang, RSC Adv., 2015, 5, 60114–60120 RSC.
- M.-S. Cao, W.-L. Song, Z.-L. Hou, B. Wen and J. Yuan, Carbon, 2010, 48, 788–796 CrossRef CAS.
- W.-l. Song, M.-s. Cao, Z.-l. Hou, J. Yuan and X.-y. Fang, Scr. Mater., 2009, 61, 201–204 CrossRef CAS.
- S. Liu, J. Liu and X. Dong, Electromagnetic Wave Shielding and Absorbing Material, Chemical Industry Press, 2007, p. 261 Search PubMed.
- R. Lv, F. Kang, J. Gu, X. Gui, J. Wei, K. Wang and D. Wu, J. Appl. Phys., 2008, 93, 223105 Search PubMed.
- M. R. Meshram, N. K. Agrawal, B. Sinha and P. S. Misra, J. Magn. Magn. Mater., 2004, 271, 207–214 CrossRef CAS.
- S. M. Abbas, A. K. Dixit, R. Chatterjee and T. C. Goel, J. Magn. Magn. Mater., 2007, 309, 20–24 CrossRef CAS.
- Y. Feng and T. Qiu, J. Alloys Compd., 2012, 513, 455–459 CrossRef CAS.
- N. Dishovsky and M. Grigorova, Mater. Res. Bull., 2000, 35, 403–409 CrossRef CAS.
- T. Wang, Y. Li, S. Geng, C. Zhou, X. Jia, F. Yang, L. Zhang, X. Ren and H. Yang, RSC Adv., 2015, 5, 88958–88964 RSC.
- C. Wang, X. Han, P. Xu, X. Zhang, Y. Du, S. Hu, J. Wang and X. Wang, J. Appl. Phys., 2011, 98, 072906 Search PubMed.
- M. Zong, Y. Huang, N. Zhang and H. Wu, J. Alloys Compd., 2015, 644, 491–501 CrossRef CAS.
- H. He, F. Luo, N. Qian and N. Wang, J. Alloys Compd., 2015, 117, 085502 Search PubMed.
- Q. Liu, Q. Cao, H. Bi, C. Liang, K. Yuan, W. She, Y. Yang and R. Che, Adv. Mater., 2016, 28, 486–490 CrossRef CAS.
- C. Hu, Z. Mou, G. Lu, N. Chen, Z. Dong, M. Hu and L. Qu, Phys. Chem. Chem. Phys., 2013, 15, 13038–13043 RSC.
- Y. Zhang, Y. Huang, T. Zhang, H. Chang, P. Xiao, H. Chen, Z. Huang and Y. Chen, Adv. Mater., 2015, 27, 2049–2053 CrossRef CAS PubMed.
- C. Chen, Q. Zhang, C. Huang, X. Zhao and B. Zhang, Chem. Commun., 2012, 48, 7149–7151 RSC.
- X. Wang, G. Shi, F.-N. Shi, G. Xu, Y. Qi, D. Li, Z. Zhang, Y. Zhang and H. You, RSC Adv., 2016, 6, 40844–40853 RSC.
- P. Liu, Z. Yao and J. Zhou, RSC Adv., 2015, 5, 93739–93748 RSC.
- G. Wang, J. Yang, J. Park, X. Gou, B. Wang, H. Liu and J. Yao, J. Phys. Chem. C, 2008, 112, 8192–8195 CrossRef CAS.
- S. Stankovich, D. A. Dikin, R. D. Piner, K. A. Kohlhaas, A. Kleinhammes, Y. Jia, Y. Wu, S. T. Nguyen and R. S. Ruoff, Carbon, 2007, 45, 1558–1565 CrossRef CAS.
- Z. Fan, K. Wang, T. Wei, J. Yan, L. Song and B. Shao, Carbon, 2010, 48, 1686–1689 CrossRef CAS.
- K. N. Kudin, B. Ozbas, H. C. Schniepp, R. K. Prud'Homme, I. A. Aksay and R. Car, Nano Lett., 2008, 8, 36–41 CrossRef CAS.
- J. Luo, P. Shen, W. Yao, C. Jiang and J. Xu, Nanoscale Res. Lett., 2016, 11, 141 CrossRef PubMed.
- J. Luo, Y. Xu and D. Gao, Solid State Sci., 2014, 37, 40–46 CrossRef CAS.
- J. Fang, T. Liu, Z. Chen, Y. Wang, W. Wei, X. Yue and Z. Jiang, Nanoscale, 2016, 8, 8899–8909 RSC.
- Z. Su, J. Tao, J. Xiang, Y. Zhang, C. Su and F. Wen, Mater. Res. Bull., 2016, 84, 445–448 CrossRef CAS.
- J. Wang, J. Wang, B. Zhang, Y. Sun, W. Chen and T. Wang, J. Magn. Magn. Mater., 2016, 401, 209–216 CrossRef CAS.
- L. Kong, X. Yin, X. Yuan, Y. Zhang, X. Liu, L. Cheng and L. Zhang, Carbon, 2014, 73, 185–193 CrossRef CAS.
- H. Xing, Z. Liu, L. Lin, L. Wang, D. Tan, Y. Gan, X. Ji and G. Xu, RSC Adv., 2016, 6, 41656–41664 RSC.
- Y.-F. Zhu, Q.-Q. Ni and Y.-Q. Fu, RSC Adv., 2015, 5, 3748–3756 RSC.
- C. N. R. Rao, H. S. S. R. Matte, K. S. Subrahmanyam and U. Maitra, Chem. Sci., 2012, 3, 45–52 RSC.
- R. Zhang, X. Huang, B. Zhong, L. Xia, G. Wen and Y. Zhou, RSC Adv., 2016, 6, 16952–16962 RSC.
- Y. Wang, H. Guan, S. Du and Y. Wang, RSC Adv., 2015, 5, 88979–88988 RSC.
- X. Shuang-Shuang, C. Gong, Z. Hai-Qin, C. Yuan and Z. Yan, Int. J. Inorg. Mater., 2016, 31, 567–574 CrossRef.
- W.-L. Song, X.-T. Guan, L.-Z. Fan, W.-Q. Cao, Q.-L. Zhao, C.-Y. Wang and M.-S. Cao, Mater. Res. Bull., 2015, 72, 316–323 CrossRef CAS.
- X. Sun, J. He, G. Li, J. Tang, T. Wang, Y. Guo and H. Xue, J. Mater. Chem. C, 2013, 1, 765–777 RSC.
- X. F. Zhang, X. L. Dong, H. Huang, Y. Y. Liu, W. N. Wang, X. G. Zhu, B. Lv, J. P. Lei and C. G. Lee, J. Appl. Phys., 2006, 89, 053115 Search PubMed.
Footnote |
| † Electronic supplementary information (ESI) available. See DOI: 10.1039/c7ra03215c |
| This journal is © The Royal Society of Chemistry 2017 |

