New high-Tg bipolar benzimidazole derivatives in improving the stability of high-efficiency OLEDs†
Sheng-Jie
Lin
a,
Yu-Chieh
Cheng
b,
Chia-Hsun
Chen
 ab,
Yong-Yun
Zhang
b,
Jiun-Haw
Lee
 *a,
Man-kit
Leung
 *b,
Bo-Yen
Lin
 *c and
Tien-Lung
Chiu
 *d
*d
aGraduate Institute of Photonics and Optoelectronics and Department of Electrical Engineering, National Taiwan University, Taipei 10617, Taiwan. E-mail: jiunhawlee@ntu.edu.tw
bDepartment of Chemistry, National Taiwan University, Taipei 10617, Taiwan. E-mail: mkleung@ntu.edu.tw
cDepartment of Opto-Electronic Engineering, National Dong Hwa University, Hualien 974301, Taiwan. E-mail: boyenlin@gms.ndhu.edu.tw
dDepartment of Electrical Engineering, Yuan Ze University, Taoyuan 32003, Taiwan. E-mail: tlchiu@saturn.yzu.edu.tw
First published on 25th November 2022
Abstract
Four bipolar molecules, named 1-, 2-, 3-, and 4-3cbzBIZ, composed of tricarbazole (3cbz) substituted benzimidazole, were synthesized and characterized. They not only exhibit good thermal stability with remarkably high glass transition temperatures and decomposition temperatures, especially 4-3CbzBIZ (Tg > 193 °C, Td > 453 °C), but also show superior thermal photoluminescence stability at elevated temperatures. Their morphological stabilities have also been affirmed using atomic force microscopy pictures after 30 min during 80 °C annealing. The FIrpic doped 4-3cbzBIZ organic light-emitting diode (OLED) shows sky-blue electroluminescence from FIrpic with a high external quantum efficiency (ηEQE) of 28.6% with an amazingly small efficiency roll-off (ηEQE = 27.3% at a luminance of 1000 cd m−2). Furthermore, the green OLED with Ir(ppy)3 doped in 4-3cbzBIZ exhibits excellent device thermal stability and a longer operational lifetime than the OLED with CBP as the host. In particular, a significant lifetime improvement by 11.6 times was obtained at an elevated temperature of 80 °C. The high efficiency and high-temperature stability of the OLED were ascribed to the balanced bipolar carrier-transporting properties, high Tg and rigidity of 4-3cbzBIZ. The present work of developing orthogonally linked donor–acceptor hosts provides a strategy of material design to develop high thermal stability OLEDs.
Introduction
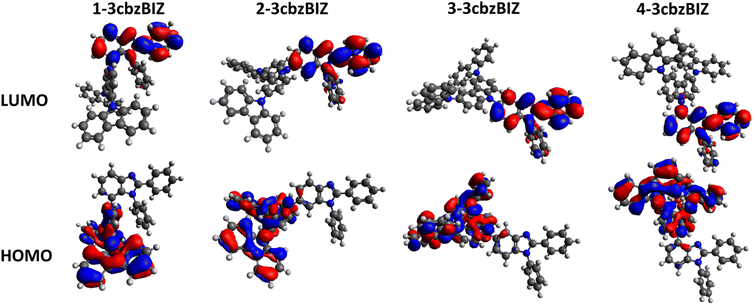
Organic light-emitting diodes (OLEDs) have attracted considerable attention due to their unique features of super thin thickness, light weight, wide viewing angle, fast response time, high brightness and wide color gamut.1–5 In recent years, numerous efforts have been devoted to the development of commercialized OLEDs, which are now being utilized in both flat display and solid-state lighting applications.6–8 The demand for high quality full-color OLEDs is growing, especially for that with a long operational lifetime and long-term device stability.Bipolar hosts that contain both electron donating and accepting units have been commonly used in OLEDs to accommodate various kinds of light emitters. Popular bipolar hosts for blue phosphorescent and/or TADF emitters have a low glass transition temperature (Tg), such as CBP (Tg = 62 °C),9–11 BCP (Tg = 62 °C),12 mCP (Tg = 65 °C),12 mCBP (Tg = 97 °C),9,12 DPEPO (Tg = 93 °C),12etc. Recently, J. Y. Lee et al. summarized lots of new host materials with their Tg values and device performances.13 The Tg value of the most new host materials is below 150 °C. It is rare to find a bipolar and wide bandgap host material with a high Tg close to 200 °C to achieve outstanding device performance. For example, C. Yang et al. reported mBICP (Tg = 84 °C), a bipolar host with a carbazole moiety to connect to benzimidazole,14 which shows superb performance in a FIrpic based OLED with an external quantum efficiency (ηEQE) of 18.7% being achieved. Theoretical calculations revealed that the highest occupied molecular orbital (HOMO) and the lowest unoccupied molecular orbital (LUMO) of mBICP are located separately at the electron donor and electron acceptor units. This observation implies that carbazole and benzimidazole are good molecular pairs to demonstrate the bipolar properties, and hence lots of research regarding carbazole–benzimidazole derivatives have been reported and shown efficient device performance.10,13–17
We recently reported the development and systematic study of four carbazole-substituted benzimidazoles,18 namely 1-CbzBiz, 2-CbzBiz, 3-CbzBiz, and 4-CbzBiz as hosts for FIrpic OLEDs. Although the devices reached a peak luminance of 18760 cd m−2, a peak current efficiency (ηCE) of 64.1 cd A−1, and a peak ηEQE of 30.9%, limited by the low molecular weight, their Tg values are relatively low and fall in the range of 53–90 °C. This might restrict the operating temperature window and hamper the operational lifetime of the OLEDs. Generally speaking, the degradation mechanism of OLEDs can be classified into intrinsic and extrinsic factors.19–21 The intrinsic factors include photochemical and electrochemical degradation in the emitting layer of OLEDs, whereas the extrinsic factors include the penetration of water and oxygen, material purity and also ambient temperature variation. Regarding the factor of device operating temperature, Joule heating typically occurs during device operation, causing an increase of local temperature inside the device; organic materials with a low glass transition temperature (Tg) might experience physical changes such as recrystallization and glass transition, or chemical degradation. Several studies reported that the degradation of OLEDs is due to the morphological changes of organic layers.22,23 Hence, increasing the Tg of organic materials can benefit the thermal stability of the films, suppressing any thermally induced degradation and further improving the device performance.24 For instance, to realize high Tg effects, which dominantly rely on chemical structure design for small organic molecules,25 J. Li et al. used an electron donating unit to synthesize bipolar materials (m-BPyCz and p-BPyCz) that not only successfully demonstrate Tg higher than 125 °C, but also a high ηEQE of 27%.26 This work significantly inspires us the possibility of introducing a 3,6-di(carbazolyl)carbazole moiety to our framework of the material so as to improve the thermal properties.
Hence, a new series of bipolar hosts comprising 3′,6′-bis(carbazol-9-yl)carbazol-9′-yl (3cbz) and benzimidazole moieties, denoted as BIZ, namely 1-3cbzBIZ, 2-3cbzBIZ, 2-3cbzBIZ, and 4-3cbzBIZ, respectively, was successfully synthesized and carefully characterized. The bipolar host compounds were found to exhibit excellent thermal properties with a high Tg value over 179 °C and decomposition temperature (Td) over 453 °C, leading to superior thermal stability. The effect of the thermal stability of hosts on their optical and electrical properties was probed by photoluminescence (PL) methods and atomic force microscopy (AFM) after 30 min of annealing at elevated temperatures. FIrpic based blue OLEDs that employ these compounds as the hosts show superb device performances. The optimized OLED device with 4-3cbzBIZ, as the best host, shows a highest ηEQE of 28.3% and ultralow efficiency roll-off, which are ascribed to the bipolar carrier transporting capability of 4-3cbzBIZ. To prevent the unreliable emitter cause and investigate the thermal stability in EL, green light emitting OLEDs with reliable Ir(ppy)3 emitters were fabricated and operated under various luminance and elevated temperature conditions and their luminance decays have been monitored. The OLED based on 4-3cbzBIZ as the host showed apparently longer operational lifetime when compared with conventional CBP based OLEDs, leading to a significant 11.6 time-enhancement under elevated temperature conditions.
Results and discussion
Preparation of 1-, 2-, 3-, and 4-3cbzBIZ
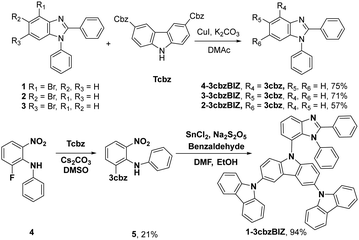
The synthetic routes are summarized in Scheme 1. The target hosts of 1-, 2-, 3-, and 4-3cbzBIZ were prepared by the Ullmann C–N coupling of 3,6-di(carbazolyl)carbazole with the corresponding commercially available 2-, 3-, and 4-bromobenzimidazoles 1–3.18 The reaction proceeds in the presence of CuI and K2CO3 in dimethylacetamide (DMAc) at 180 °C for 16 h to afford the products in 57–75% yields. Compound 1-3cbzBIZ was prepared in a two-step synthetic sequence using the SNAr substitution reaction of 1 with 9H-9,3′:6′9′′-tercarbazole (Tcbz) to give the corresponding intermediate 5, followed by cyclization with benzaldehyde in moderate yields. All spectral data including 1H and 13C NMR, mass spectrometry, and elemental analysis are in good agreement with the proposed structures (Fig. S1–S10, ESI†).X-ray crystallographic analysis
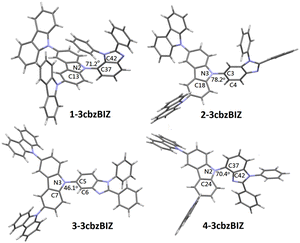
The chemical structures of 1-, 2-, 3-, and 4-3cbzBIZ were further identified by X-ray crystallographic analysis (Tables S1–S4 and Fig. S11–S14, ESI†). Fig. 1 shows the stick structures of 1-, 2-, 3-, and 4-3cbzBIZ obtained by the software Mercury,27 a crystal structure visualisation, exploration and analysis program, according to their X-ray crystallographic data. The orthogonal connection between the carbazole–carbazole units is equivocally confirmed. The dihedral angles between the carbazole–benimidazole units of 1-, 2-, and 4-3cbzBIZ are 72.1°, 78.2°, and 70.4° respectively. However, 3-3cbzBIZ shows a much small dihedral angle of 46.1° for C7–N3–C5–N6. Nevertheless, the dihedral angle is still too large for having a significant π-conjugation effect within this molecule. The nearly orthogonal arrangements of the carbazole and benzimidaole moieties are expected to prevent 3cbzBIZs from intermolecular pi-stacking interactions with the adjacent ones, creating ample interstitial spaces in the crystal lattice. Therefore, it is no wonder that all 3cbzBIZs form single co-crystals with the solvent molecules in the lattice. The presence of large interstitial spaces may also be beneficial for incorporating emitter molecules in the OLEDs.Thermal properties of 1-, 2-, 3-, and 4-3cbzBIZ
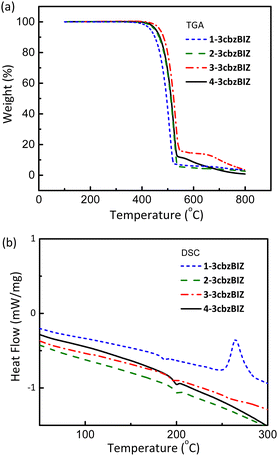
The thermal properties of 1-, 2-, 3-, and 4-3cbzBIZ were investigated by thermogravimetric analysis (TGA) and differential scanning calorimetry (DSC) (Fig. S15 and S16, ESI†). The samples of 1-, 2-, 3-, and 4-3cbzBIZ were first sublimed before measurement in order to remove any solvent molecules from the solids. However, certain extents of crystallinity of the solids can still be confirmed by the observation of the melting temperatures in DSC analysis. TGA was measured under a N2 atmosphere to monitor the weight loss at different temperatures. The decomposition temperature, Td, is typically defined as the temperature for a 5% loss in weight. In DSC measurements, the samples were first preheated from 40 to 300 °C with a heating rate of 10 °C min−1 under a N2 atmosphere and then subjected to fast cooling back to 40 °C to obtain amorphous samples for the second round of DSC analysis at the same heating rate. The reported DSC properties were based on the results of the second round of measurements. Fig. 2(a) and (b) show the TGA and DSC curves, respectively, and the collected data are summarized in Table 1 for comparison against those of the cbzBIZ series.18 Compounds 1-, 2-, 3-, and 4-3cbzBIZ exhibit high Td values of 433, 450, 470, and 453 °C with high Tg values of 179, 193, 187 and 193 °C, respectively, which might be attributable to their rigid structures composed of 3cbz and benzimidazole moieties. The exothermic peak at around 270 °C in the DSC analysis of 1-3cbzBIZ is due to the crystallization of the amorphous 1-3cbzBIZ after Tg. The Tgs are much higher than that of CBP (i.e. 62 °C) and the published carbazole–benzimidazole derivatives.9–11 It is noteworthy to mention that a consistent Tg increment of 100–120 °C is observed in comparison with those of the corresponding mono-carbazole substituted CbzBIZs. The high Tg values of 3cbzBIZs may be beneficial for achieving OLEDs with high thermal stability and long operational lifetimes.| Compound | T m(°C, (K)) | T g(°C, (K)) | T d(°C, (K)) | T g(K)/Tm(K) |
|---|---|---|---|---|
| a Crystallization process was observed at a Tc of 265 °C. b Crystallization process was observed at a Tc of 172 °C. c See ref. 18. | ||||
| 1-3cbzBIZ | 336 (609) | 179 (452)a | 433 (706) | 0.74 |
| 2-3cbzBIZ | 379 (652) | 193 (466) | 450 (723) | 0.71 |
| 3-3cbzBIZ | 293 (566) | 187 (464) | 470 (743) | 0.82 |
| 4-3cbzBIZ | 362 (635) | 193 (466) | 453 (726) | 0.73 |
| 1-CbzBiz | 220 (493) | 53 (326) | 312 (585) | 0.66 |
| 2-CbzBiz | 212 (485) | 83 (356) | 354 (627) | 0.73 |
| 3-CbzBiz | 236 (509) | 86 (359) | 357 (630) | 0.71 |
| 4-CbzBiz | 275 (548)b | 90 (363) | 356 (629) | 0.66 |
In contrast to Tg increment, Tm increases less consistently, which is expected because the melting point is highly dependent on molecular stacking in the crystal lattice. Due to the relatively poor pi-stacking as mentioned before in the X-ray crystallographic studies, the Tm values are expected to be low, and the Tg/Tm ratios are therefore higher for the 3cbzBIZ series. Due to the relatively low melting temperature of 3-3cbzBIZ (Tm = 293 °C), the sample cannot be successfully sublimed under a high vacuum (10−6 torr). Therefore, only 1-, 2-, and 4-3cbzBIZ will be subjected to OLED studies and discussed in the latter sections.
Electrochemical properties
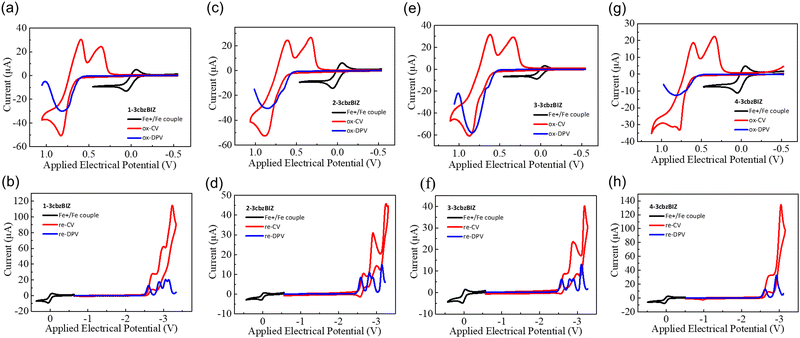
The redox behaviors of 3cbzBIZ's, and two references N-phenyl-3,6-di(N-carbazolyl)carbazole (ph-3cbz) and 1,2-phenylbenzimidazole (BImP), with a concentration of 10−3 M in CaH2 dried dichloromethane (DCM) for oxidation, or in dimethylformamide (DMF) for reduction, were evaluated by cyclic voltammetry (CV) and differential-pulse voltammetry (DPV), with a Ag/AgCl couple as the reference electrode, a Pt wire as the auxiliary electrode, and tetrabutylammonium perchlorate (TBAP, 0.1 M) as the supporting electrolyte. A glassy carbon electrode was used as the working electrode for cathodic reduction, while a platinum disc electrode was adopted as the working electrode for anodic oxidation studies. The samples were degassed by purging N2 for 2 min before measurement in order to avoid excluding the effects of oxygen and moisture. The CV and DPV diagrams are shown in Fig. 3 and the potential values are summarized in Table 2. The measured redox electrical potentials versus ferrocene were then converted to the HOMO/LUMO level according to the following equations reported in the literature:28,29| EHOMO = ΔE + EHOMO(ferrocene) = −1.2 × (EDPVox − EFc+/Fc) + (−4.8) eV |
| ELUMO = ΔE + EHOMO(ferrocene) = −0.92 × (EDPVre − EFc+/Fc) + (−4.8) eV |
| Compound | E DPV ox,a (V) | E DPV re,b (V) | E HOMO/ELUMOc (eV) |
|---|---|---|---|
| a First oxidation wave by the differential pulse voltammetry method. b First reduction wave by the differential pulse voltammetry method. c HOMO level predicted using the Forrest equation; the LUMO level was predicted by ELUMO = EHOMO + Eg. | |||
| 1-3cbzBIZ | 0.82 | −2.60 | 5.78/2.41 |
| 2-3cbzBIZ | 0.85 | −2.59 | 5.82/2.42 |
| 3-3cbzBIZ | 0.84 | −2.58 | 5.81/2.43 |
| 4-3cbzBIZ | 0.82 | −2.60 | 5.78/2.41 |
| BImP | 1.21 | −2.52 | 6.26/2.48 |
| Ph-3cbz | 0.85 | — | 5.82/— |
Photophysical properties
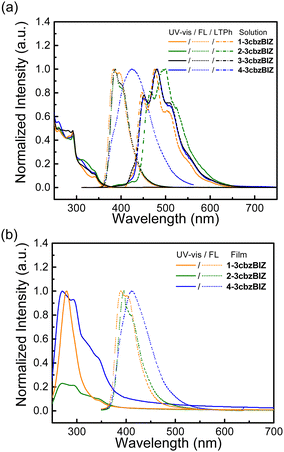
The spectral information in solution and in the film state is collected in Fig. 5 and summarized in Table 3. The solution UV-Vis absorption and fluorescence (FL) spectra of 1-, 2-, 3-, and 4-3cbzBIZ, were collected in tetrahydrofuran (10−5 M, THF), whereas for the low temperature phosphorescence (LTPh) spectra at 77 K, the measurements were carried out in 2-methyltetrahydrofuran (10−5 M, 2MeTHF). The spectra of ph-3cbz and BImP were also collected as references for comparison.18 All 3cbzBIZs show typical UV-vis absorption at 280–300 nm and with a shoulder band at 300–340 nm. The absorption below 300 nm originates from the π–π* electronic transition of 3cbz and the benzimidazole units, whereas absorption above 300 nm originates from the n–π* absorption of the 3cbz moiety. The optical band gap (Eg) of compounds is evaluated by the intersection point of the normalized absorption and the low temperature fluorescence spectra (Fig. S17, ESI†).| Compounds | Absorption (nm) | E g Solution/Film (eV)a | Emission (nm) | QYf | E T (eV) | Energy level (eV) | |||
|---|---|---|---|---|---|---|---|---|---|
| Solution λmax/λonset | Film λonset | Solution λmaxFL/λonsetLTPH | Film λmaxFL | HOMO Solution/Filmc | LUMO Solution/Filmd | ||||
| a Energy band gap is determined by 1240.8/λonset (determined by the cross-over point of the abs and FL spectra, ESI). b Triplet energy is estimated from the phosphorescence spectra by ET = 1240.8/λonsetLTPH at 77 K. c Measured from AC2. d LUMO is calculated from the HOMO and energy band gap (Eg). e Cannot be successfully sublimed. f Using coumarin 1 in THF as the standard (QY = 0.85).30 g From Ref. 18. | |||||||||
| 1-3cbzBIZ | 292/365 | 374 | 3.40/3.32 | 383/427 | 412 | 0.26 | 2.9 | −5.8/−5.7 | −2.4/−2.4 |
| 2-3cbzBIZ | 292/368 | 378 | 3.37/3.28 | 387/438 | 396 | 0.25 | 2.8 | −5.8/−5.7 | −2.5/−2.4 |
| 3-3cbzBIZ | 292/369 | —e | 3.36/—e | 386/424 | —e | 0.25 | 2.9 | −5.8/—e | −2.5/—e |
| 4-3cbzBIZ | 292/367 | 379 | 3.38/3.27 | 424/429 | 389 | 0.18 | 2.9 | −5.8/−5.6 | −2.4/−2.4 |
| 1-CbzBiz | 293/340 | 3.60/—e | 381/427 | — | 0.23 | 2.9 | −5.8/—e | −2.3/—e | |
| 2-CbzBiz | 293/347 | 369 | 3.49/3.36 | 396/440 | — | 0.75 | 2.8 | −5.7/−5.9 | −2.4/−2.5 |
| 3-CbzBiz | 292/347 | 365 | 3.51/3.39 | 401/433 | — | 0.43 | 2.9 | −5.7/−5.9 | −2.4/−2.5 |
| 4-CbzBiz | 293/343 | 359 | 3.53/3.45 | 413/432 | — | 0.24 | 2.9 | −5.7/−5.9 | −2.4/−2.5 |
While being excited with UV light at 290 nm, 1-, 2-, and 3-3cbzBIZs show similar FL emission peaked at 383, 387, and 386 nm, respectively (Fig. 5(a)). Their FL spectral pattern is highly similar to that of ph-3cbz which has an FL emission onset at 360 nm. Since BImp shows the FL emission onset at 320 nm which is higher than that of the ph-3cbz unit at 360 nm, the S0–S1 transition should be governed by the 3cbz unit. In contrast, the FL emission of 4-3cbzBIZ is red-shifted along with the disappearance of the vibronic pattern, suggesting a stronger intramolecular-charge-transfer (ICT) property in the excited state.
The charge transfer (CT) phenomena were further confirmed by their solvatofluorochromic behavior; all 3cbzBIZs exhibit an extra red-shifted emission band along with increasing the polarity of the solvents (Fig. 6). However, the intensities of the red-shifted band are different: while 2-, 3-, and 4-3cbzBIZs display an obvious red-shift band in DMF, 1-3cbzBIZ shows only an emission tail at 450–600 nm. The vibronic pattern disappears in the red-shifted bands, suggesting the charge-transfer behavior in their electronic transitions. It is noteworthy to mention that 4-3cbzBIZ shows a very clear cut vibronic pattern at 77 K without red-shifting being observed. The vibronic pattern is similar to the FL spectrum observed in non-polar cyclohexane.
 | ||
| Fig. 6 Solvatofluorochromic behavior of (a) 1-3cbzBIZ, (b) 2-3cbzBIZ, (c) 3-3cbzBIZ and (d) 4-3cbzBIZ. | ||
On the basis of these observations, we propose that the red-shifted band arises from the charge-transfer transition from the 3cbz moiety to the benzimidazole unit. Restricted by the steric hindrance between 3cbz and the benzimidazole units, these two pi-moieties should be orthogonally aligned in solution, which has been also observed in single-crystal X-ray diffraction analysis. The electron coupling between 3cbz and the benzimidazole units is therefore small. However, the flexibility of 3cbzBIZs can be higher in the excited state and hence the carbazole–benzimidazole C–N bond rotation would become feasible. Twisting back to a smaller dihedral angle would allow stronger charge transfer electronic coupling between the 3cbz and benzimidazole units, giving rise to a red-shifted emission spectrum. This is particularly obvious in highly polar solvents that could stabilize the ICT state.
The LTPh spectra of all four 3cbzBIZs show a similar vibronic pattern in the region of 400–600 nm (Fig. 5(a)) that is similar to that of BImP.18 We tentatively suggest that the T1 to S0 emissive electronic transition is mainly localized in the benzimidazole moiety. The triplet energy (ET) of 3cbzBIZs, determined by the onset of LTPh (λonsetLTPh), was found to be within the range of 2.8–2.9 eV (Table 1).
The photophysical properties of the vapor deposited films of 1-, 2- and 4-3cbzBIZs on a glass substrate have also been examined and are summarized in Fig. 5(b) and Table 3. The UV-vis absorption and emission behavior in neat films consists of that in solution. Overall, the photophysical properties of 1-, 2-, and 4-3cbzBIZs are slightly red-shifted in the neat films relative to that in solutions by about 10 nm. The HOMO values for neat-films 1-3cbzBIZ, 2-3cbzBIZ and 4-3cbzBIZ are 5.7, 5.7 and 5.6 eV, which is confirmed by AC-2 photoelectron spectra (Fig. S18, ESI†). Their LUMO values are about 2.4 eV, respectively, according to the optical gap.
Temperature stability
To further investigate the heat effects on the PL stability of the films, temperature variation PL experiments have been conducted. Thin films of 1-, 2-, and 4-3cbzBIZs and CBP were fabricated by vacuum vapor deposition and then annealed at 80 °C for 30 min in air. CBP was used as the reference for comparison (Fig. 7). While the PL spectral pattern and intensity of 2- and 4-3cbzBIZs remain almost unchanged, the PL intensity of 1-3cbzBIZ slightly drops about 8%. In contrast, the PL spectral intensity of CBP drops significantly along with a spectral change during annealing. All these suggest that 3cbzBIZs should be promising host molecules with high thermal stability. We tentatively attribute the PL change during annealing to the morphological changes of the films, which are correlated with the glass transition properties of the films. The high Tg values of 1-, 2-, and 4-3cbzBIZs would be beneficial for the thermal stability of the films. | ||
| Fig. 7 PL spectra of neat films of (a) 1-3cbzBIZ, (b) 2-3cbzBIZ, (c) 4-3cbzBIZ and (d) CBP without and with annealing of 80 °C for 30 min. | ||
Furthermore, thermal instability of a thin-film device is typically associated with a surficial morphology change of the films,31 which might significantly affect the electrical property (i.e. carrier transporting) in an OLED at a higher temperature. AFM measurement is therefore conducted at 80 °C so as to monitor the surficial morphology variation (Fig. 8) at a high temperature environment. Due to the low Tg value of CBP, the morphology of its film changes seriously in annealed samples. The drastically expansive aggregation was easily observed different from the high Tg value of 3cbzBIZ films. The morphology of the 1-3cbzBIZ, 2-3cbzBIZ and 4-3cbzBIZ films is much more stable, only with a small change after annealing at 80 °C for 30 min with less variation in the roughness Ra in AFM studies. This observation also well agrees with the PL results in the temperature variation experiments, implying that 1-3cbzBIZ, 2-3cbzBIZ and 4-3cbzBIZ exhibit better thermal stability than CBP.
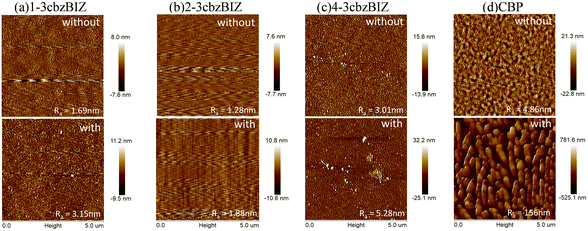 | ||
| Fig. 8 AFM images of (a) 1-3cbzBIZ, (b) 2-3cbzBIZ, (c) 4-3cbzBIZ and (d) CBP films without and with annealing (80 °C for 30 min). | ||
EL device performance
1-3cbzBIZ, 2-3cbzBIZ and 4-3cbzBIZ were used as hosts in FIrpic based blue OLEDs with a typical device structure of ITO/1,1-bis[(di-4-tolylamino)phenyl]cyclohexane TAPC (50 nm)/1,3-bis(N-carbazolyl)benzene mCP (10 nm)/EML/diphenylbis[4-(pyridin-3-yl)phenyl]silane (DPPS)/LiF (1 nm)/Al (100 nm). TAPC, mCP, and DPPS serve as the hole transporting layer (HTL), electron blocking layer (EBL), and electron transporting layer (ETL), respectively. The emitting layer (EML) consists of FIrpic doped 1-3cbzBIZ, 2-3cbzBIZ and 4-3cbzBIZ, respectively. Indium tin oxide (ITO, anode) and LiF/Al (cathode) are used as the hole and electron injection layers, respectively. Both mCP and DPPS exhibit a large optical gap and a high ET value of 2.8 eV and 2.7 eV that could confine effectively the exciton within the EML (FIrpic, ET = 2.7 eV). Also, the appropriate spectral overlap between the emission spectra of 3cbzBIZ and the MLCT absorption spectrum of FIrpic ensures the efficient energy transfer from the host to the dopant (Fig. S19, ESI†). To obtain optimal EL performance, OLED optimization including dopant concentration, carrier transporting layer thickness (i.e. DPPS) and EML thickness was conducted (Fig. S20–S22 and Tables S6–S11, ESI†). The experimental results of the EL performances of the optimal OLEDs are shown in Fig. 9 and Table 4.| Devicea | EML/ETL (%, nm) | V (V) | L (cd m−2) | η CE (cd A−1) | η PE (lm W−1) | η EQE (%) | CIEe (x,y) |
|---|---|---|---|---|---|---|---|
| a HTL thickness = 50 nm and EBL thickness = 10 nm. b Voltage at J = 1 mA cm−2. c Luminance at the maximum value. d Measured at maximum/100/1000/5000 cd m−2. e At 4 and 10 V. | |||||||
| 1-3cbzBIZ | 15%, 30/55 | 4.5 | 17670 | 50.2/49.9/48.5/43.6 | 51.7/41.9/30.8/21.1 | 24.3/24.3/23.5/21/1 | (0.152,0.386)/(0.159, 0.400) |
| 2-3cbzBIZ | 12%, 30/50 | 4.2 | 17750 | 45.8/45.7/43.9/37.8 | 41.1/41.9/28.7/18.8 | 22.8/22.6/21.8/28.8 | (0.148,0.375)/(0.156, 0.391) |
| 4-3cbzBIZ | 12%, 40/55 | 4.9 | 14![[thin space (1/6-em)]](https://www.rsc.org/images/entities/char_2009.gif) 420 420 |
58.7/58.3/55.9/49.8 | 59.3/46.0/32.8/22.1 | 28.6/28.4/27.3/24.2 | (0.156,0.396)/(0.160, 0.406) |
The comparison of the current density–luminance–voltage (J–L–V) characteristics of the 1-3cbzBIZ, 2-3cbzBIZ and 4-3cbzBIZ based devices are shown in Fig. 9(a). The driving voltage (J = 1 mA cm−2) of these devices are 4.5, 4.2, and 4.9 V, respectively. The maximum luminance of 1-3cbzBIZ, 2-3cbzBIZ and 4-3cbzBIZ devices can reach 17![[thin space (1/6-em)]](https://www.rsc.org/images/entities/char_2009.gif) 670, 17
670, 17![[thin space (1/6-em)]](https://www.rsc.org/images/entities/char_2009.gif) 750 and 14
750 and 14![[thin space (1/6-em)]](https://www.rsc.org/images/entities/char_2009.gif) 420 cd/m2. In Fig. 9(b), the peak ηEQE values of 24.3% (ηCE = 50.2 cd A−1; power efficiency, ηPE = 51.7 lm W−1), 22.8% (ηCE = 45.8 cd A−1; ηPE = 41.1 lm W−1) and 28.6% (ηCE = 58.7 cd A−1; ηPE = 59.3 lm W−1) for the 1-3cbzBIZ, 2-3cbzBIZ and 4-3cbzBIZ devices can be seen. Among these devices, the 4-3cbzBIZ device exhibits the best device performance. Indeed, the photoluminescence quantum yield (PLQY) measurement of the 4-3cbzBIZ-doped film was conducted, and the value was found to be as high as 98.6% (Fig. S23, ESI†). In addition, these devices demonstrate small efficiency roll-off at L = 1000 cd m−2 with ηEQE values of 23.5%, 21.8%, and 27.3% for 1-3cbzBIZ, 2-3cbzBIZ and 4-3cbzBIZ devices, indicating that triplet related annihilation and/or the loss of carrier balance, which will typically occur in phosphorescent OLEDs, are less significant in the present devices.32 The efficiency roll-off was found approximately within 5% and particularly for the 4-3cbzBIZ device, a smallest efficiency roll-off of 3.5% was observed.
420 cd/m2. In Fig. 9(b), the peak ηEQE values of 24.3% (ηCE = 50.2 cd A−1; power efficiency, ηPE = 51.7 lm W−1), 22.8% (ηCE = 45.8 cd A−1; ηPE = 41.1 lm W−1) and 28.6% (ηCE = 58.7 cd A−1; ηPE = 59.3 lm W−1) for the 1-3cbzBIZ, 2-3cbzBIZ and 4-3cbzBIZ devices can be seen. Among these devices, the 4-3cbzBIZ device exhibits the best device performance. Indeed, the photoluminescence quantum yield (PLQY) measurement of the 4-3cbzBIZ-doped film was conducted, and the value was found to be as high as 98.6% (Fig. S23, ESI†). In addition, these devices demonstrate small efficiency roll-off at L = 1000 cd m−2 with ηEQE values of 23.5%, 21.8%, and 27.3% for 1-3cbzBIZ, 2-3cbzBIZ and 4-3cbzBIZ devices, indicating that triplet related annihilation and/or the loss of carrier balance, which will typically occur in phosphorescent OLEDs, are less significant in the present devices.32 The efficiency roll-off was found approximately within 5% and particularly for the 4-3cbzBIZ device, a smallest efficiency roll-off of 3.5% was observed.
Fig. 9(c) shows the blue EL spectra of the devices from FIrpic without being modulated by the host emission, indicating that the energy transfer from the hosts to FIrpic is complete. When the applied electrical voltage increases from 4 to 10 V, the intensity of the FIrpic emission band at 510 nm slightly increases due to the optical cavity effect, indicating that the recombination zone shifts toward the anode side.33 Nevertheless, the recombination-zone shifting effect on the spectral Commission Internationale de l'Eclairage (CIE) 1931 coordinates is less significant. For example, when the driving voltage increases from 4 to 10 V, the CIE coordinates of the 4-3cbzBIZ device move from (0.156, 0.396) to (0.160, 0.406), corresponding to a remarkably small CIE coordinate shifting by (0.004, 0.010) with a luminance variation from 100 to 14![[thin space (1/6-em)]](https://www.rsc.org/images/entities/char_2009.gif) 420 cd m−2.
420 cd m−2.
It has been known that FIrpic might decompose when the device was driven by a high electrical voltage. The device lifetime would be limited by the stability of FIrpic. For example, the luminance decay curves of the 3cbzBIZ based FIrpic OLEDs at an initial luminance (L0) of 1000 cd m−2 exhibit a half lifetime (LT50) of about 60–200 min (Fig. S23, ESI†). Hence, we employ tris(2-phenylpyridine)iridium(III) (Ir(ppy)3), a green phosphorescence complex with a longer operational lifetime, as our next target to investigate.
Stability in EL
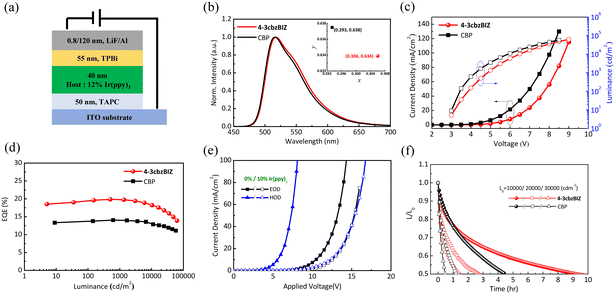
Green OLEDs were fabricated with a device structure of TAPC (50 nm)/10% Ir(ppy)3![[thin space (1/6-em)]](https://www.rsc.org/images/entities/char_2009.gif) :
:![[thin space (1/6-em)]](https://www.rsc.org/images/entities/char_2009.gif) 4-3cbzBIZ or CBP (40 nm)/2,2′,2′′-(1,3,5-benzinetriyl)-tris(1-phenyl-1-H-benzimidazole) TPBi/LiF (0.8 nm)/Al (120 nm), as shown in Fig. 10(a). Fig. 10(b)–(d) show the EL spectra, J–L–V characteristics and efficiency−J curve for the 4-3cbzBIZ and CBP devices. The EL spectra of the Ir(ppy)3 doped 4-3cbzBIZ and CBP devices show typical emission (Fig. 10(b)) from Ir(ppy)3, with the corresponding CIE coordinates of (0.306, 0.634) and (0.293, 0.638), respectively. The driving voltages at J = 20 mA cm−2 of the 4-3cbzBIZ and CBP devices are 6.8 and 5.9 V, respectively, as shown in Fig. 10(c). In addition, as shown in Fig. 10(d), the 4-3cbzBIZ device exhibits a high ηEQE of 19.8%, which is much higher than that of the CBP device (ηEQE = 14.0%).
4-3cbzBIZ or CBP (40 nm)/2,2′,2′′-(1,3,5-benzinetriyl)-tris(1-phenyl-1-H-benzimidazole) TPBi/LiF (0.8 nm)/Al (120 nm), as shown in Fig. 10(a). Fig. 10(b)–(d) show the EL spectra, J–L–V characteristics and efficiency−J curve for the 4-3cbzBIZ and CBP devices. The EL spectra of the Ir(ppy)3 doped 4-3cbzBIZ and CBP devices show typical emission (Fig. 10(b)) from Ir(ppy)3, with the corresponding CIE coordinates of (0.306, 0.634) and (0.293, 0.638), respectively. The driving voltages at J = 20 mA cm−2 of the 4-3cbzBIZ and CBP devices are 6.8 and 5.9 V, respectively, as shown in Fig. 10(c). In addition, as shown in Fig. 10(d), the 4-3cbzBIZ device exhibits a high ηEQE of 19.8%, which is much higher than that of the CBP device (ηEQE = 14.0%).
The charge carrier transport properties of a non-doped 4-3cbzBIZ device and an Ir(ppy)3 doped 4-3cbzBIZ device (10% Irppy3![[thin space (1/6-em)]](https://www.rsc.org/images/entities/char_2009.gif) :
:![[thin space (1/6-em)]](https://www.rsc.org/images/entities/char_2009.gif) 4-3cbzBIZ) were investigated by the space-charge-limited-current (SCLC) method; single charge carrier flows in the hole only device (HOD) and the electron only device (EOD) were therefore compared.34–36 The results are summarized in Fig. 10(e) which shows the J–V characteristics of the corresponding HODs and EODs. In non-doped devices, the hole current density is much higher than the electron current density. Therefore, 4-3cbzBIZ can be considered as an ambipolar material with particularly good hole-transporting properties that overwhelm the electron transporting properties. However, in contrast to the non-doped device, both hole current and electron current densities are in the same order of magnitude in the Ir(ppy)3 doped device. This observation indicates that the balanced carrier transport behavior in the Ir(ppy)3 doped 4-3cbzBIZ device results in high efficiency.
4-3cbzBIZ) were investigated by the space-charge-limited-current (SCLC) method; single charge carrier flows in the hole only device (HOD) and the electron only device (EOD) were therefore compared.34–36 The results are summarized in Fig. 10(e) which shows the J–V characteristics of the corresponding HODs and EODs. In non-doped devices, the hole current density is much higher than the electron current density. Therefore, 4-3cbzBIZ can be considered as an ambipolar material with particularly good hole-transporting properties that overwhelm the electron transporting properties. However, in contrast to the non-doped device, both hole current and electron current densities are in the same order of magnitude in the Ir(ppy)3 doped device. This observation indicates that the balanced carrier transport behavior in the Ir(ppy)3 doped 4-3cbzBIZ device results in high efficiency.
To evaluate the stability of the OLEDs, the luminance decay of the devices was monitored and the data are shown in Fig. 10(f). The luminance decay curves of 4-3cbzBIZ and CBP devices were measured, under constant driven current density with various L0 values. The half-lifetime (LT50) of the device is the time of luminance up to 50% of the initial luminance. The 4-3cbzBIZ device exhibits a longer operational lifetime than the CBP device under all driving conditions, corresponding to 2.1, 2.2 and 3.0-fold enhancement for 10![[thin space (1/6-em)]](https://www.rsc.org/images/entities/char_2009.gif) 000, 20
000, 20![[thin space (1/6-em)]](https://www.rsc.org/images/entities/char_2009.gif) 000 and 30
000 and 30![[thin space (1/6-em)]](https://www.rsc.org/images/entities/char_2009.gif) 000 cd m−2. Besides, the 4-3cbzBIZ device was found to exhibit a slower driving voltage increment when aging as well (Fig. S24, ESI†). The reasons for the significant lifetime improvement at high luminance operation and less driving voltage increase might be ascribed to the higher Tg value of 4-3cbzBIZ and its superb bipolar carrier transporting behavior in EL.
000 cd m−2. Besides, the 4-3cbzBIZ device was found to exhibit a slower driving voltage increment when aging as well (Fig. S24, ESI†). The reasons for the significant lifetime improvement at high luminance operation and less driving voltage increase might be ascribed to the higher Tg value of 4-3cbzBIZ and its superb bipolar carrier transporting behavior in EL.
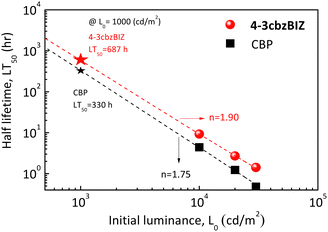
Fig. 11 shows the estimated LT50 under different initial luminance values for 4-3cbzBIZ and CBP devices. According to Fig. 10(f), the LT50 at 1000 cd m−2 of OLEDs can be estimated by a well-known formula,37 as shown below:
| LT × Ln0 = const |
![[thin space (1/6-em)]](https://www.rsc.org/images/entities/char_2009.gif) hr. When 4-3cbzBIZ is employed as the host, the operational lifetime is significantly improved, corresponding to a 2.1-fold enhancement in comparison with that of the CBP host. Besides, acceleration factor n values of 1.90 and 1.75 were obtained for 4-3cbzBIZ and CBP, respectively, from the measurements. The acceleration factor is in general a material dependent characteristic. Apparently, the value of 4-3cbzBIZ is a little bit larger and that is possibly related to the thermal property here.
hr. When 4-3cbzBIZ is employed as the host, the operational lifetime is significantly improved, corresponding to a 2.1-fold enhancement in comparison with that of the CBP host. Besides, acceleration factor n values of 1.90 and 1.75 were obtained for 4-3cbzBIZ and CBP, respectively, from the measurements. The acceleration factor is in general a material dependent characteristic. Apparently, the value of 4-3cbzBIZ is a little bit larger and that is possibly related to the thermal property here.
Thermal stability in EL
To investigate the thermal stability of the present systems in greater depth, an external heat source was coupled to the EL devices so as to control the operation temperature, and hence the temperature effect on the operational lifetime of OLEDs can be monitored. An electric heating pad (10 × 10 mm2) was attached at the back of the OLED to control the device temperature. Fig. S25, ESI† shows the luminance decay curves (L0 = 10![[thin space (1/6-em)]](https://www.rsc.org/images/entities/char_2009.gif) 000 cd m−2) at different heating temperatures (40, 60, and 80 °C) and their LT50versus heating temperature are summarized in Fig. 12(a). In the 4-3cbzBIZ case, the LT50 at RT was approximately as long as 8.4 hrs. When the OLEDs were operated at a higher temperature upon heating at 40, 60, and 80 °C, the LT50 value decreased to 7.1, 5.2, and 2.4 hrs, respectively. However, the LT50 at RT for CBP is much shorter and was found to be 4.7 hrs at RT. The LT50 dramatically reduces upon heating. It is noteworthy to mention that the LT50 value for the CBP device at 80 °C decays to only 0.2 hrs, which could be ascribed to the low Tg of CBP.
000 cd m−2) at different heating temperatures (40, 60, and 80 °C) and their LT50versus heating temperature are summarized in Fig. 12(a). In the 4-3cbzBIZ case, the LT50 at RT was approximately as long as 8.4 hrs. When the OLEDs were operated at a higher temperature upon heating at 40, 60, and 80 °C, the LT50 value decreased to 7.1, 5.2, and 2.4 hrs, respectively. However, the LT50 at RT for CBP is much shorter and was found to be 4.7 hrs at RT. The LT50 dramatically reduces upon heating. It is noteworthy to mention that the LT50 value for the CBP device at 80 °C decays to only 0.2 hrs, which could be ascribed to the low Tg of CBP.
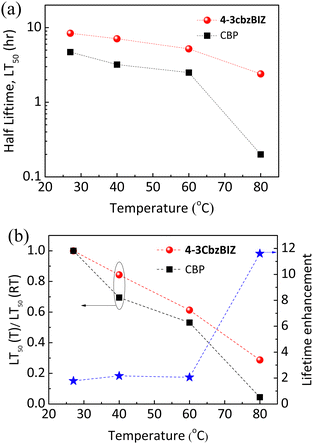 | ||
| Fig. 12 (a) Half lifetime LT50versus different heating temperatures; (b) stability factor and lifetime enhancement versus different annealing temperatures for 4-3cbzBIZ and CBP devices. | ||
To quantitatively investigate the thermal stability, a stability factor defined as LT50(T)/LT50(RT) is employed. The relationships between the stability factor versus temperature are shown in Fig. 12(b). Apparently, the stability factor of 4-3cbzBIZ was found to slowly decline along with increasing the temperature, in comparison to that of CBP. Such observation indicates the fact that the 4-3cbzBIZ device exhibits more stable thermal stability than CBP, which consists of the above-mentioned results (Fig. 7 and 8). Besides, the same result was also obtained from the PL spectra and AFM images of doped films (4-3cbzBIZ and CBP with 10% Ir(ppy)3 dopant, respectively) before and after annealing at elevated temperature (Fig. S26 and S27, ESI†). The lifetime enhancement of the OLED was calculated and is shown in Fig. 12(b) as well. The enhancement gradually increases along with the increasing temperature. Eventually, a maximum enhancement of 11.6 times was obtained at 80 °C.
Experimental
Absorption and PL spectra were recorded using a spectrometer (Hitachi U−4100) and a fluorescence spectrometer (Hitachi F-4500), respectively. A PLQY measurement system comprises a Xenon lamp, two monochromators (Horiba iHR320), an integral sphere (Quanta−φ manual Rev C F-3029), a photomultiplier tube (PMT, Hamamatsu), and a software program (FluorEssence). The surficial morphology of the films was scanned using an AFM (Veeco Dimension Edge). For OLED fabrication, organic and inorganic thin films are deposited using a thermal evaporator under a high vacuum (less than 8 × 10⁻⁶ torr). The pixel size of the device is 2 × 2 mm2. Device performances are measured using a source meter (Keithley 2400), a spectrometer (Minolta CS-1000), and a software program.Conclusions
In summary, three new bipolar host molecules 1-, 2-, and 4-3cbzBIZ with superior thermal properties have been introduced into OLEDs. The blue OLED based on the FIrpic doped 4-3cbzBIZ as the light emitting layer shows high performances with a maximum ηEQE of 28.6% and an extremely small efficiency roll-off being achieved. Such high performances are attributed to the balanced bipolar carrier transport properties of the doped 4-3cbzBIZ device. Besides, the green phosphorescent Ir(ppy)3-doped 4-3cbzBIZ OLED shows not only a higher efficiency but also a longer operational lifetime, when compared with that of the CBP based OLED. Remarkably a significant lifetime improvement over 11 times was obtained at an elevated temperature of 80 °C, owing to the high thermal stability of 4-3cbzBIZ.Author contributions
Mr Sheng-Jie Lin and Dr Chia-Hsun Chen performed the device fabrication and measurements, Prof. Man-kit Leung, Ms Yu-Chieh Cheng and Yong Yun Zhang synthesize the materials and measured their properties, Prof. Bo-Yen Lin joined the result analysis and prepared the manuscript, Prof. Tien-Lung Chiu and Prof. Jiun-Haw Lee instructed the device design and measurement, and Prof. Tien-Lung Chiu also handled the paper writing and submission.Conflicts of interest
There are no conflicts to declare.Acknowledgements
This work was supported by the National Science and Technology Council (NSTC), Taiwan, under Grants NSTC 111-2113-M-002-023, 111-2634-F-002-016, 111-2221-E-155-013, 111-2923-E-155-002-MY3, 110-2113-M-002-009, 110-2622-E-155-010, 110-2222-E-002-003-MY3, 109-2622-E-155-014, 108-2221-E-155-051-MY3, and 108-2811-E-155-504-MY3; the Ministry of Education (MOE) 111L9006; and the MEGA project, which has received funding from the European Union's Horizon 2020 research and innovation programme under the Marie Skłodowska-Curie grant agreement No. 823720.References
- C. W. Tang and S. A. Vanslyke, Appl. Phys. Lett., 1987, 51, 913 CrossRef CAS.
- B. W. D’Andrade and S. R. Forrest, Adv. Mater., 2004, 16, 1585 CrossRef.
- S. Reineke, F. Lindner, G. Schwartz, N. Seidler, K. Walzer, B. Lüssem and K. Leo, Nature, 2009, 459, 234 CrossRef CAS.
- N. Masimukku, D. Gudeika, D. Volyniuk, O. Bezvikonnyi, J. Simokaitiene, V. Matulis, D. Lyakhov, V. Azovskyi and J. V. Gražulevičius, Phys. Chem. Chem. Phys., 2022, 24, 5070 RSC.
- R. Keruckiene, B. Y. Lin, C. H. Chen, C. C. Chu, C. F. Lin, T. L. Chiu, J. H. Lee and J. V. Gražulevičius, Dyes Pigm., 2022, 198, 109956 CrossRef CAS.
- Z. Li, X. Li, X. Lin, H. Wang, Y. Fu, B. Zhang, J. Wu and Z. Xie, Org. Electron., 2019, 75, 105438 CAS.
- Y. Qu, J. Kim, C. Coburn and S. R. Forrest, ACS Photonics, 2018, 5, 2453 Search PubMed.
- Y. Liu, X. Xiao, Y. Ran, Z. Bin and J. You, Chem. Sci., 2021, 12, 9408 CAS.
- S. Gong, X. He, Y. Chen, Z. Jiang, C. Zhong, D. Ma, J. Qin and C. Yang, J. Mater. Chem., 2012, 22, 2894–2899 CAS.
- Z. J. Gao, T. H. Yeh, J. J. Xu, C. C. Lee, A. Chowdhury, B. C. Wang, S. W. Liu and C. H. Chen, ACS Omega, 2020, 5, 10553–10561 CAS.
- T. Zhang, Y. Liang, J. Cheng and J. Li, J. Mater. Chem. C, 2013, 1, 757 CAS.
- B. A. Naqvi, M. Schmid, E. Crovini, P. Sahay, T. Naujoks, F. Rodella, Z. Zhang, P. Strohriegl, S. Bräse, E. Zysman-Colman and W. Brütting, Front. Chem., 2020, 8, 750 CAS.
- Y. Wang, J. Hui Yun, L. Wang and J. Y. Lee, Adv. Funct. Mater., 2021, 31, 2008332 CAS.
- H. Huang, X. Yang, B. Pan, L. Wang, J. Chen, D. Ma and C. Yang, J. Mater. Chem., 2012, 22, 13223 CAS.
- W. H. Hung, L. C. Chi, W. J. Chen, Y. M. Chen, S. H. Chou and K. T. Wong, J. Mater. Chem., 2010, 20, 10113–10119 CAS.
- Y. M. Chen, W. Y. Hung, H. W. You, A. Chaskar, H. C. Ting, H. F. Chen, K. T. Wong and Y. H. Liu, J. Mater. Chem., 2011, 21, 14971–14978 CAS.
- D. Karthik, K. R. Justin Thomas, J. H. Jou and Y. L. Chen, Dyes Pigm., 2016, 133, 132–142 CAS.
- S. Chang, G. T. Lin, Y. C. Cheng, J. J. Huang, C. L. Chang, C. F. Lin, J. H. Lee, T. L. Chiu and M.-K. Leung, ACS Appl. Mater. Interfaces, 2018, 10, 42723 CAS.
- S. Scholz, D. Kondakov, B. Lüssem and K. Leo, Chem. Rev., 2015, 115, 8449 CAS.
- W. Song and J. Y. Lee, Appl. Opt. Mater., 2017, 5, 1600901 Search PubMed.
- M. Penconi, M. Cazzaniga, W. Panzeri, A. Mele, F. Cargnoni, D. Ceresoli and A. Bossi, Chem. Mater., 2019, 31, 2277–2285 CAS.
- S. Y. Chen, T. Y. Chu, J. F. Chen, C. Y. Su and C. H. Chen, Appl. Phys. Lett., 2006, 89, 053518 Search PubMed.
- V. N. Hamanaka, E. Salsberg, F. J. Fonseca and H. Aziz, Org. Electron., 2020, 78, 105509 CAS.
- X. Guo, Z. Tang, W. Yu, Y. Wang, Z. Zhao, J. Gu, Z. Liu, B. Qu, L. Xiao and Z. Chen, Org. Electron., 2021, 89, 106048 CAS.
- Y. Kuwabara, H. Ogawa, H. Inada, N. Noma and Y. Shirota, Adv. Mater., 1994, 6, 677 CAS.
- F. Wang, D. Liu, J. Li and M. Ma, ACS Appl. Mater. Interfaces, 2017, 9, 37888 CAS.
- For checking the software, see https://www.ccdc.cam.ac.uk/solutions/csd-core/components/mercury, date: August 2022.
- B. W. D’Andrade, S. Datta, S. R. Forrest, P. Djurovich, E. Polikarpov and M. E. Thompson, Org. Electron., 2005, 6, 11–20 Search PubMed.
- P. I. Djurovich, E. I. Mayo, S. R. Forrest and M. E. Thompson, Org. Electron., 2009, 10, 515–520 CAS.
- C. Würth, M. Grabolle, J. Pauli, M. Spieles and U. Resch-Genger, Nat. Protoc., 2013, 8, 1535–1550 Search PubMed.
- J. Yun, J. Kim, B. J. Jung, G. Kim and J. Kwak, RSC Adv., 2019, 9, 16252 CAS.
- S. Reineke, T. C. Rosenow, B. Lüssem and K. Leo, Adv. Mater., 2010, 22, 3189 CAS.
- J. H. Lee, B. Y. Lin, Y. H. Lan, T. L. Chiu, P. Y. Lee and C. F. Lin, Org. Electron., 2015, 24, 182 CAS.
- T. Ogawa, D. C. Cho, K. Kaneko, T. Mori and T. Mizutani, Thin Solid Films, 2003, 438–439, 171 CAS.
- P. N. Murgatroyd, J. Phys. D: Appl. Phys., 1970, 3, 1488 CAS.
- S. Alam, P. Fischer, C. Kästner, C. R. Singh, U. S. Schubert and H. Hoppe, J. Mater. Res., 2018, 33, 1860–1867 CAS.
- J. H. Lee, C. H. Chen, P. H. Lee, H. Y. Lin, Mk Leung, T. L. Chiu and C. F. Lin, J. Mater. Chem. C, 2019, 7, 5874 CAS.
Footnote |
| † Electronic supplementary information (ESI) available. CCDC 2206984–2206987. For ESI and crystallographic data in CIF or other electronic format see DOI: https://doi.org/10.1039/d2tc04143j |
| This journal is © The Royal Society of Chemistry 2023 |


