Bio-inspired Janus gold nanoclusters with lipid and amino acid functional capping ligands: micro-voltammetry and in situ electron transfer in a biogenic environment†
Nirod Kumar Sarangi and
Archita Patnaik*
Department of Chemistry, Indian Institute of Technology Madras, Chennai-600 036, India. E-mail: archita59@yahoo.com; Fax: +91-44-2257-4200; Tel: +91-44-2257-4217
First published on 9th June 2014
Abstract
This investigation reports the design and synthesis of bio-inspired interfacial Janus gold quantum clusters with DPPC lipid and amino acid tyrosine ligand functionalities. The lipid, anchored through steric and charge stabilization, nanoengineered the size and spatial requirements of the 2D Janus cluster array. In situ quantum charging and electron transfer in this biogenic environment revealed the role of tyrosine towards enhanced electron transfer across the Janus cluster and provided a direct clue in understanding nanoparticle-mediated interactions in a microenvironment. This work is the first report of quantized electron transfer dynamics in a Janus cluster, and it clearly depicts the role of tyrosine ligand and inter-cluster coupling during the single-electron charging of the Janus clusters, which may be extended towards understanding electron transfer at alveolar interfaces.
1. Introduction
The advancement in controlled synthesis has brought a facelift to the geometry of Janus nanoparticle structures. Beginning from the joined hemispherical lobes, the structure has extended from dot-like to rod-like and disk-like particles.1 Electrochemical and photochemical reduction and surfactant-aided growth have given rise to diverse Janus structures.2–5 In a recent study, Iwashita and Kimura studied 2D silica Janus colloid phases by controlling the inter-patch attractive potential.6 With weak attraction, small micellar clusters behaved as unit structures with two valences. A recent review by Song and Chen detailed the syntheses and applications of interfacially engineered Janus particles.7A new type of bio-hybrid Janus particle with one hemisphere exhibiting spatially controlled affinity towards human endothelial cells and the other hemisphere resistant to cell binding has been reported.8 The functional bipolarity was realized by selective surface modification to create polymer particles with two biologically distinguishable hemispheres. Recently, phosphatidylcholine-based liposomes have been used as advanced drug-delivery vehicles for carrying Au nanoparticles towards the target cell9–12 and lipid-coated Au nanoparticles have attracted considerable attention.13–15 The essential interaction between Au nanoparticles and lipids have depended on the nanoparticle size and surface curvature-modulated accommodation of the nanoparticles.16–18 Sánchez et al. reported Janus gold-mesoporous silica NPs by selectively functionalizing them with bio-inspired ligands to design an integrated electrochemical biorecognition-signaling platform.19
The structure–function relationships in Janus particles, in view of their anisotropy in shape, size, and composition, have ranged from controlled gas storage and release to applications in biomedicine, catalysis, sensing and in photovoltaics. Because boron nitride (BN) and carbon (C) are isoelectronic and have similar structures, Wu et al. integrated them for tubular Janus nanostructures and have reported their electronic structure, HOMO–LUMO gaps and transport properties with strong dependence on chirality.20 Janus particles of electron donor–acceptor structures have been exploited as nanoscale machinery in solar energy conversion.21 Using their electrical anisotropy, Nisisako et al.4 used Janus particles as switchable screens while placing them as a thin layer between the cathode and the anode. The reversal of the field resulted in a change of both the orientation and the color of the display. Charge transfer between the two oxidic components in SnO2–CuO Janus nanorods has improved their electrochemical performance as electrode materials in lithium-ion batteries.22 Rigid S-functionalized Pd complexes as metallo-ligands were used to pair Janus Au-coated silica microspheres for providing stable molecular interconnects, in which the choice of a suitable molecular spacer was essential for studying room temperature molecular electronics.23
Despite a number of studies on Janus particle synthesis and properties, multifunctional bio-inspired nanoclusters are scarce and reports on electron transport across are clearly missing. Recently, we have reported a one-pot 2D synthesis of Janus nanoparticles, in which in situ reduction of Au3+ in a sprayed micellar electrostatic complex was accomplished by subphase tryptophan, which acted as a capping ligand.24 By adaptive surface chemistry, the present investigation uses a bi-functional strategy for the synthesis of Janus Au quantum clusters with DPPC lipid and tyrosine amino acid as ligand functionalities, and aims towards a versatile biosensor platform for future nano-bioelectronic devices. In situ synthesized 2D Janus gold clusters and the preformed architectures were tapped through real-time angle-dependent polarized FT-IRRAS spectroscopy upon detecting the orientation-dependent vibrational changes in the adsorbed ligand functionalities that provided the geometrical orientation of the ligands on the Janus gold nanocluster surface. A three-atom model Au cluster with DPPC and tyrosine ligand functionalities were used in DFT calculations towards deciphering the prevailing binding in the cluster. In situ microelectrode voltammetry revealed quantum charging of the 2D condensed phase of the Janus clusters, attributing them as quantum capacitors. The tyrosine ligand played a definite role in the inter-cluster coupling across the anisotropic Janus array and enhanced electron-transfer kinetics in reference to a mono-functionalized DPPC-anchored gold cluster. The study provides a direct clue for understanding nanocluster-mediated charge transfer in a biogenic microenvironment.
2. Experimental
Materials and methods
Chloroauric acid, HAuCl4·3H2O (98% Aldrich), 1,2-dipalmitoyl-sn-glycero-3-phosphocholine, DPPC (99% Aldrich, St. Louis, MO) and tetraoctylammonium bromide, TOAB (98% Aldrich) were used as received for the synthesis of Janus Au NP. The Langmuir subphase was modified by L-tyrosine (98% Merck, SSEA Mumbai), and the basic pH was adjusted by KOH (98% Merck) using ultrapure water (Millipore Academic, Resistivity, 18.2 MΩ cm). Chloroform (HPLC grade) was used as the solvent for complex formation, as well as the spreading solvent.Acquisition of Janus cluster Langmuir isotherms
Surface pressure versus monomolecular area isotherms were recorded using a KSV LB Trough 5000 (KSV Ltd., Finland) controlled by KSV 5000 software. The system was equipped with a Wilhelmy balance, and a platinum sensor of 0.1 mN m−1 accuracy was used to measure the interfacial surface pressure. Water with or without tyrosine was used as the sub-phase at relevant pH. Prior to spreading, a time lag of 20 min was maintained for solvent evaporation, and the monolayer compression followed at a constant speed of 5 cm2 min−1, and the temperature of the subphase was controlled with a Julabo F-36 temperature controller with an accuracy of ±0.2 °C.Polarization-modulated Fourier transform infrared reflection–absorption spectroscopy (IRRAS)
IRRAS spectra were acquired with a Bruker Optics Inc (Germany) instrument customized for Langmuir monolayers with a Vertex 70 FTIR spectrometer equipped with a mercury–cadmium telluride (MCT) detector (spectral resolution ∼0.1 cm−1) coupled to the air–water reflection unit A-511 and a custom-designed Langmuir trough (R&K, Germany). The IR beam was directed with varied angles of incidence with an angular accuracy of ±1°. The mirror alignment was aided with an NIR source along with a glass-beam splitter. The beam was polarized using a KRS-5 polariser with a >98% degree of polarisation. The spectrometer, optical arms and mercury–cadmium telluride (MCT) detector housing were purged with dry HP-N2 gas before spectral acquisition with a resolution of 4 cm−1.Fabrication of potential Janus electrodes
3. Results and discussion
3.1 Interfacial synthesis of Janus Au clusters
The 1![[thin space (1/6-em)]](https://www.rsc.org/images/entities/char_2009.gif) :1 TOA–AuCl4− complex in chloroform extracted the aqueous Au3+ ions into the organic layer. Subsequently, a stock solution of mixed DPPC (1 mM)–(TOA–AuCl4− (1 mM)) surfactant complex was prepared with an optimum 4:1 volume ratio. Note that a much larger DPPC volume content was chosen with a sole aim of anchoring the formed Au clusters exclusively with the DPPC lipid after the tyrosine reduction of Au3+ ions on a 2D TOA template in the course of the Langmuir experiment. To continue with the 2D Janus nanocluster formation, 50 μl of the above mentioned mixed precursor amphiphile in chloroform was spread at the air–water interface. While it was straightforward to vary the ratio of hydrophobic TOA–Au3+:DPPC and the hydrophilic ligand tyrosine, the amphiphilic Janus cluster formation and accumulation at the interface was maximal for the hydrophobic ligand ratio near 4:1 with a subphase tyrosine concentration 0.01 mg ml−1 at pH = 10. The characteristic pressure–area (π–A) isotherms for pure DPPC and TOA+ shown in Fig. 1a comply with our previously reported experiments.24,28 The π–A isotherms of the mixed precursor amphiphile (DPPC/TOA–AuCl4− complex) at pure water and at the tyrosine-modified subphase at a basic pH = 10 depict enhanced interfacial tension and molecular area for the latter, evidencing cluster formation. Fig. 1e encompasses the unified view of the interfacial synthesis of the amphiphilic Janus cluster with its functional ligands over a TOA template (Fig. 1b and c) along with the FT-IRRAS set up for real-time structure determination (Fig. 1d).
:1 TOA–AuCl4− complex in chloroform extracted the aqueous Au3+ ions into the organic layer. Subsequently, a stock solution of mixed DPPC (1 mM)–(TOA–AuCl4− (1 mM)) surfactant complex was prepared with an optimum 4:1 volume ratio. Note that a much larger DPPC volume content was chosen with a sole aim of anchoring the formed Au clusters exclusively with the DPPC lipid after the tyrosine reduction of Au3+ ions on a 2D TOA template in the course of the Langmuir experiment. To continue with the 2D Janus nanocluster formation, 50 μl of the above mentioned mixed precursor amphiphile in chloroform was spread at the air–water interface. While it was straightforward to vary the ratio of hydrophobic TOA–Au3+:DPPC and the hydrophilic ligand tyrosine, the amphiphilic Janus cluster formation and accumulation at the interface was maximal for the hydrophobic ligand ratio near 4:1 with a subphase tyrosine concentration 0.01 mg ml−1 at pH = 10. The characteristic pressure–area (π–A) isotherms for pure DPPC and TOA+ shown in Fig. 1a comply with our previously reported experiments.24,28 The π–A isotherms of the mixed precursor amphiphile (DPPC/TOA–AuCl4− complex) at pure water and at the tyrosine-modified subphase at a basic pH = 10 depict enhanced interfacial tension and molecular area for the latter, evidencing cluster formation. Fig. 1e encompasses the unified view of the interfacial synthesis of the amphiphilic Janus cluster with its functional ligands over a TOA template (Fig. 1b and c) along with the FT-IRRAS set up for real-time structure determination (Fig. 1d).
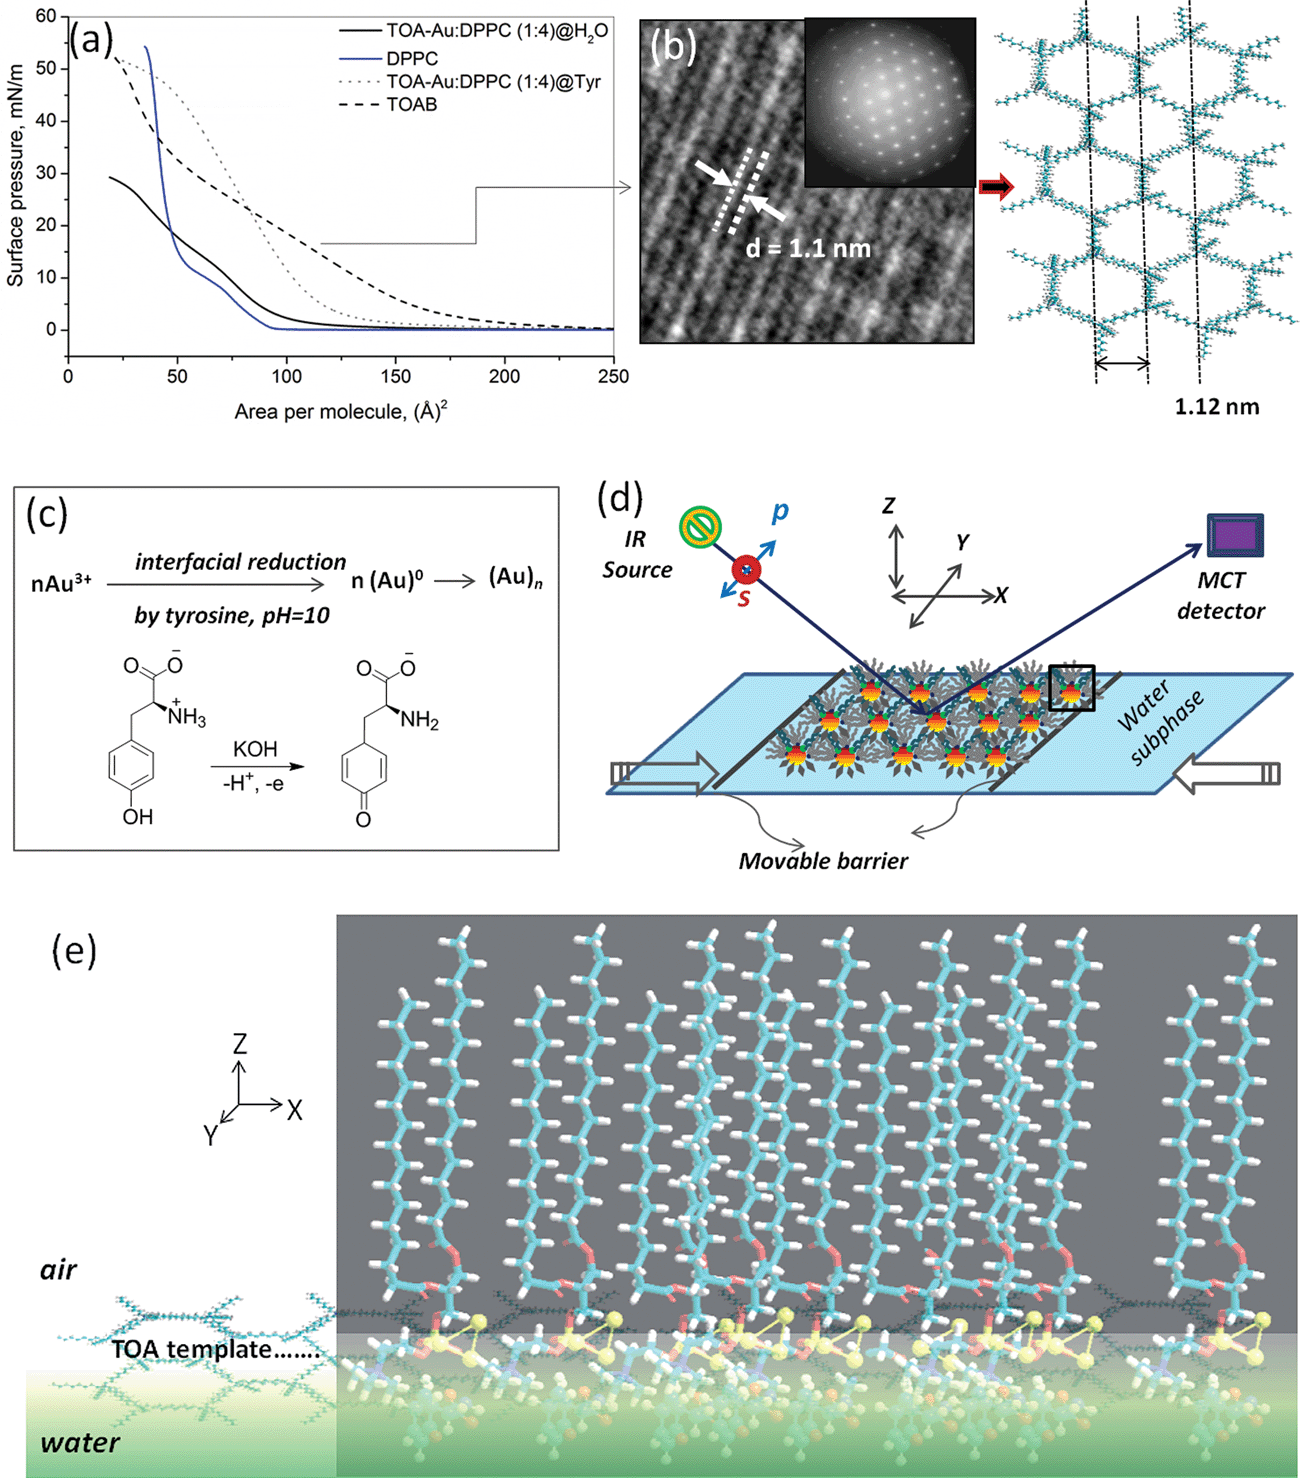 | ||
| Fig. 1 (a) Surface pressure-area isotherms of DPPC (solid blue line), TOAB (dashed black line), TOA–Au/DPPC complex (solid black line) on pure water and 0.01 mg ml−1 tyrosine modified subphase at pH = 10 (dotted grey line). (b) HRTEM image of the TOAB monolayer template and the computed/molecular-modeled arrangement of TOAB molecules complying with the experimental interlayer lattice spacing of 1.1 nm. (c) Schematic showing interfacial reduction of Au3+ by tyrosine at pH = 10. (d) Experimental set up for in situ infrared reflection absorption spectroscopy (IRRAS) depicting the Janus cluster orientation in the XY plane. (e) The most probable representation of TOA-templated Janus Au clusters at the air–water interface was obtained from an initial (1:1:1::DPPC:Au3:Tyr) geometry optimization adopting DFT-B3LYP approach with a mixed-basis set, i.e., 6-31g(d)ULANL2DZ. | ||
In a basic medium at pH = 10, ionization of the tyrosine phenolic group effectuated the reduction of Au3+ to Au0 (cf. Fig. S1a, ESI†) and behaved as the thermodynamically favorable reducing agent, as well as the protecting ligand,29–31 for the Janus cluster formation. The zwitterionic DPPC provided both steric and charge stabilization, yielding anisotropic growth that led to the formation of monodispersed clusters with average sizes of ∼3–4 nm in the condensed phase region of the monolayer (cf. Fig. 2(a and b). The characteristic surface plasmon band is shown in Fig. 2c.
 | ||
| Fig. 2 (a) and (b) represent TEM image and particle-size distribution, respectively, of the TOA template Janus clusters. The inset shows the expanded region of the selected area of the clusters. (c) A UV-vis absorption spectrum of 30 layered LB-transferred cluster films transferred from the tyrosine-modified subphase at pH = 10 compared with the bulk DPPC and tyrosine-protected Au NP spectra showing a characteristic surface plasmon band at 549 nm. At pH = 6.4, no cluster formation was observed (cf. Fig. S1b, ESI†). | ||
3.2 Validation of Janus structure: potential binding modes of DPPC and tyrosine ligands with Au cluster from real-time polarization and angle-dependent FT-IRRAS spectroscopy
IRRAS detects changes in the adsorbed chemical groups and provides information on the geometrical orientation of the adsorbed molecules relative to the surface. Interaction of amino acids with metals has been elucidated via either the (NH)x (amino) or COO− (carboxylate) end groups depending on the conditions of interaction and/or the nature of the substrate, in which the side chain of the amino acid played a crucial role.32 In the present investigation, the Janus cluster formation was monitored in real time by IRRAS. Fig. S2 (ESI†) shows p-polarized IRRAS spectra of the complex TOA–Au and DPPC/TOA–Au at pure water, as well as tyrosine-modified subphases with time evolution, along with pure DPPC and TOA spectra. The most prominent band observed near ∼1048 cm−1 arose from ν(C–N) stretching for pure TOAB monolayers, which was absent for the TOA–Au complex, evidencing the formation of the electrostatic complex. For pure DPPC monolayers, important bands observed at ∼1736, ∼1238, ∼1094, ∼972, ∼2918 and 2850 cm−1 could be assigned to ν(C![[double bond, length as m-dash]](https://www.rsc.org/images/entities/char_e001.gif) O), νa(PO2−), νs(PO2−), ν(C–N+–C), νas(CH2) and νs(CH2) vibrations, respectively.33 The phosphate- and carbonyl-stretching bands, being sensitive to H-bonding and hydration environment, are greatly affected by the presence of amino acids, as we recently reported.34
O), νa(PO2−), νs(PO2−), ν(C–N+–C), νas(CH2) and νs(CH2) vibrations, respectively.33 The phosphate- and carbonyl-stretching bands, being sensitive to H-bonding and hydration environment, are greatly affected by the presence of amino acids, as we recently reported.34
The Janus characteristics were confirmed by angle- and polarization-dependent FT-IRRAS. At a basic pH, the anionic nature, i.e., the neutral amine and the carboxylate anion of the amino acid tyrosine, predominated over its zwitterionic (protonated amine, carboxylate anion) counterpart at a neutral pH (see chemical structure in Fig. 3b).35 The resulting bands showed the characteristic vibrational frequencies of symmetric νs(COO−) and antisymmetric νa(COO−) stretching bands of the carboxylate, in addition to the symmetric NH2 bending mode (βs (NH2)) in the basic medium. Accordingly, the in situ-formed Janus NP for the p-polarized 40° angle of incidence spectrum shows characteristics of both the capping ligands in Fig. 3a (red line). The νa(COO−) band is observed at 1558 cm−1 with a shoulder at 1522 cm−1, whereas νs(COO−) is observed at 1380 cm−1. At a neutral pH, the protonated amine's δ (NH3+) bending is observed at 1502 cm−1 (Fig. 3b(i)), whereas at a basic pH, the band observed at 1318 cm−1 arose from neutral βs (NH2) group, discarding the presence of zwitterionic tyrosine. The binding of neutral amine –NH2 with an Au cluster was confirmed by the appearance of a less intense, red-shifted band at 1295 cm−1 in reference to the pristine tyrosine βs (NH2) at pH = 10 (see Fig. 3b(ii)). The s-polarized spectra for the present sets of experiments have been found to be insensitive in the region of interest and yielded baselines only at two extreme angles (25° and 65°) of incidence with respect to surface normal, whereas the p-polarized spectra showed finite intensity (see Fig. 3c and d). At a grazing incidence 65° (p-pol, blue line, Fig. 3d), a characteristic vibrational feature from the –NH2-bonded Au cluster with finite intensity, along with a least intense band from the unbound/unreacted (βs (NH2)) tyrosine at a much lower 25° incident angle was observed. In contrast, the intensities of the characteristic DPPC ester carbonyl band, ν(CO) at 1736 cm−1 in Fig. 3d exhibited the opposite trend, providing concrete proof for the orientational requirements of the Janus cluster.
 | ||
| Fig. 3 (a) p-Polarized FT-IRRAS spectra of the Janus clusters synthesized at the air–water interface along with pristine DPPC vibrational features. (b) Tyr δ (NH3+) vibrational band at pH = 6.4 (i), and comparison of interfacial βs (NH2) bands from Tyr at pH = 10 and Janus NP(II). (c) Polarization (p- and s-pol) and angle-dependent (25° and 65°) FT-IRRAS spectra of Janus NPs acquired at the air–water interface in the frequency range 3200–800 cm−1. (d) Baseline corrected βs (NH2) and ν(CO) vibrational spectral characteristics in the frequency range of 1350–1260 cm−1, establishing the Janus characteristics. | ||
3.3 The Janus structure: a computational perspective
In order to obtain an insight into the Janus structure and the prevalent bonding of the ligands with the Au core, DFT computations were carried out (see Experimental section). Preferential and selective binding modes of the DPPC head group and tyrosine side chain with the Au3 cluster are shown in Fig. 4a. Note that the alkyl chain of the DPPC was restricted to –C2H5. Furthermore, an Au3 model gold cluster was adopted to serve as a simple catalytic model for gold nanoparticles.36,37 The HOMO and LUMO in the bifunctional cluster reside mostly over Au3 (Fig. 4c and d), indicating the electron exchange to be exclusively from the Au3 part. The isosurface of HOMO extending over both of the ligands further confirms the bifunctionality and composite nature of the Janus cluster. Fig. 4e shows the HOMO–LUMO energy gaps for the Janus cluster (DPPC/Au3/Tyr) and the uncomplexed pristine moieties in which we find the gap to decrease upon complexation/binding. The HOMO of the pristine tyrosine is more localized on the amine nitrogen (cf. Fig. S3, ESI†) and in basic conditions; moreover, nitrogen is less electronegative than oxygen, making it a better nucleophile. | ||
| Fig. 4 (a) DFT-B3LYP optimized energy minimized structure with a mixed-basis set 6-31g(d)ULANL2DZ Janus cluster composed of DPPC:Au3:Tyr (1:1:1) and plausible interactions of DPPC and Tyr with Au3 along with their bond distances in Å. (b) Electrostatic potential mapped over the isodensity surface for TyrAu3DPPC cluster. The isovalue for the image is 0.0004 a.u. The alkyl chains of DPPC were restricted to –C2H5. (c) and (d) represent the HOMO and LUMO of the Janus cluster, respectively. (e) The electronic energy-level diagrams of the Janus cluster and the pristine Tyr, DPPC and Au3, and their corresponding HOMO–LUMO energy gaps. | ||
The higher nucleophilicity of the amine terminal demonstrates the electrophilic attack by the Au3 cluster. Furthermore, the highly reduced HOMO–LUMO gap of the Janus cluster causes it to behave as a better conductor. Table 1 shows important parameters from atoms-in-molecule (AIM) analysis suited for the nature of the interaction in terms of properties of electron density and its derivatives. The bond interaction energy, ∇2ρ(r), is the indicative tool for the nature of interaction. A negative value of ∇2ρ(r) indicates a charge density concentrated at the center of the nuclear region, a case of covalent interaction.38 However, in the present case, the positive ∇2ρ(r) values at bond critical points (BCP) in Table 1 are indicative of the existence of ionic interaction as the depletion of electronic charge density along the bond. The electronic charge density, H(r), at BCP is defined as, H(r) = G(r) + V(r), where G(r) and V(r) represent the kinetic and potential energy densities, respectively.39 Table 1 indicates negative values for H(r) in most of the cases implying a stabilization effect due to accumulation of charge at BCP as the case of covalent interaction except DPPC phosphate oxygen (O1, Fig. 4a) that shows a positive value, a case of ionic interaction.
| Site of interaction | BCP | ρ | ∇2ρ | G(r) | V(r) | H(r) | E kJ mol−1 |
|---|---|---|---|---|---|---|---|
| PO2− | O1Au1 | 0.068 | 0.324 | 0.086 | −0.005 | 0.081 | −7.32 |
| Gold | Au1Au2 | 0.054 | 0.105 | 0.043 | −0.059 | −0.017 | −78.64 |
| Au1Au3 | 0.059 | 0.095 | 0.043 | −0.063 | −0.019 | −83.68 | |
| Au2Au3 | 0.052 | 0.131 | 0.048 | −0.063 | −0.015 | −82.78 | |
| Tyr | Au3O5 | 0.057 | 0.239 | 0.065 | −0.07 | −0.005 | −92.03 |
| N2Au2 | 0.070 | 0.259 | 0.076 | −0.087 | −0.011 | −111.9 |
The above mentioned results show that the interacting ligand binding with the gold core should be both partially ionic and partially covalent in nature. Furthermore, a higher interaction energy as more negative for the amine terminal (N2Au2) in comparison with the carboxyl terminal (Au3O5) of tyrosine indicates a greater interaction from the amine group, consistent with the FT-IRRAS results. The Mulliken charge analysis (cf. Fig. S4, ESI†) reveals an extra charge to reside over the Au3 cluster even when the electron is removed from it. This interesting feature justifies the type of functional groups studied here towards creating such an exotic Janus cluster for probable future device applications.
3.4 Quantum charging in the anisotropic 2D Janus cluster array
Electron transport in the anisotropic interfacial Janus gold nanocluster arrays in this study was undertaken by adopting in situ micro-voltammetry, which was pioneered by Fujihira and Araki,40 and further developed by Majda and coworkers.41,42 Fig. 5a and b illustrate in situ differential pulse voltammetric response of the Janus cluster monolayer at surface pressures of 20 and 40 mN m−1, respectively, corresponding to two phase states. The current peaks observed at the formal potentials of nanocluster charge-state couples reflect the discretization and spacings of its electronic energy levels. The Janus clusters in the monolayer array could thus be viewed as mixed-valent ensembles of clusters, in which the quantized double-layer charging was diffusion-controlled and obeyed the Nernst equation.43–45 The formal redox potential (E0′), which is the peak potential observed in the DPV trace for each z/(z ± 1) charge-state couple where the single electron charging event was prominent, could be described by the equation, E0′z/(z+1) = EPZC + (z − 1/2)e/CCLU, where EPZC is the potential of zero charge (PZC), e is the electronic charge and CCLU is the Janus cluster capacitance. Apart from PZC, the other charge states observed for one electron core oxidation (z > 0) and reduction (z < 0) currents in the DPV traces are marked in Fig. 5a and b. In Fig. 5c, the linear z plot of E0′ versus the reduced charge state (z < 0) yielded the Janus cluster capacitance, CJanus, which amounts to 0.68 aF at 40 mN m−1 and 1.11 aF at 20 mN m−1 for two different phase states of the Janus cluster. | ||
| Fig. 5 In situ differential pulse voltammetric response of Janus Au quantum clusters obtained at surface pressures of (a) 20 mN m−1 and (b) 40 mN m−1 on a Pt UME electrode (10 μm). The −1/0 and 0/+1 charge steps are marked by red stars and other oxidation and reduction processes by grey stars. (c) z plot for Janus clusters observed at two different 2D phase states (20 and 40 mN m−1) with linear fits. (d) Experimental set-up for in situ microelectrode voltammetry of Janus clusters at the air–water interface. | ||
The observed surface pressure-induced capacitance is believed to be associated with cluster core–core separation, dielectric environment and electrostatic principles. Accordingly, the electrochemical HOMO–LUMO energy gap reduced from 1.15 V in a less-ordered 2D phase at 20 mN m−1 to 0.5 V for an anisotropic Janus 2D-condensed phase at 40 mN m−1. For the pristine tyrosine and DPPC-protected Au NPs (for synthetic procedure and characterization, see Fig. S5, ESI†), the QDL charging was investigated from voltammetry and are shown in Fig. S6(a and b), ESI,† respectively. From the DPV plots, almost similar HOMO–LUMO energy gaps (∼0.8 V) were evaluated. The electronic band gap's dependence on the cluster core size and its insensitivity toward the ligand shell has been well documented.46 Note that for Au25(SR)18, Au38(SR)24 and Au75(SR)40 clusters, the HOMO–LUMO gaps have amounted to ∼1.65, 1.2 and 0.74 V, respectively.47–50
The Janus nanocluster self-capacitance CJanus was calculated using eqn (1) as follows:
 | (1) |
Here, C1, C2 define the capacitances CDPPCM and CTyrM, respectively, which are given by eqn (2) and (3) as follows:
 | (2) |
 | (3) |
This dissimilarity in the CJanus evidences for a substantial contribution from the classical electrostatic intercluster coupling across the Janus nanocluster array. Table 2 lists the characteristic single electron-charging parameters. Irregularities in ΔV and fewer numbers of charging peaks in the positive potential region could be attributed to arise from the probable inadequacy of the QDL model. Predictions of the concentric sphere capacitor model have been critically analyzed over a broad range of experimental parameters concerning the cluster's geometrical and electrostatic characteristics by Morales and Mafé.51 Hicks et al. while experimenting with hexane thiolate monolayer-protected gold nanoclusters have attributed peak split/peak broadening as indicative of probable cluster polydispersity in the medium.52 Although there have been extensive reports on small-diameter (1.1–3 nm) monolayer-protected clusters showing QDL behavior,43–45,53–56 the present investigation is the first of its kind in dealing with bifunctional Janus cluster-quantized charging, which was explored via in situ micro-voltammetry.
| Surface pressure (mN m−1) | Charge state (z) | Formal potential (E0, V) | ΔV (V) | CCLU (exp.) (aF) | CCLU (cal.) (aF) |
|---|---|---|---|---|---|
| 20 | 0/+1 | 0.783 | 0.106 | 1.12 | 0.55 |
| −1/0 | −0.364 | 0.167 | |||
| −2/−1 | −0.509 | 0.137 | |||
| −3/−2 | −0.653 | 0.099 | |||
| −4/−3 | −0.707 | 0.061 | |||
| 40 | +3/+4 | 0.372 | 0.122 | 0.68 | |
| +2/+3 | 0.250 | 0.111 | |||
| +1/+2 | 0.149 | 0.100 | |||
| 0/+1 | 0.054 | 0.090 | |||
| −1/0 | −0.453 | 0.132 | |||
| −2/−1 | −0.553 | 0.074 | |||
| −3/−2 | −0.628 | 0.069 | |||
| −4/−3 | −0.691 | 0.064 | |||
| −5/−4 | −0.760 | 0.068 |
3.5 Electron transfer kinetics at the Janus cluster-modified electrode and electrochemical detection of dopamine
Fig. 6a shows the diffusion-controlled cyclic voltammograms of the Fe (CN6)3−/4− redox couple on bare glassy carbon (GC), TOA–Au/DPPC complex and Janus cluster-modified GC electrodes fabricated via the Langmuir–Schaefer method. The CV of TOA–Au/DPPC complex modified GC electrode is featureless in comparison with the bare GC electrode, supporting that the modified electrode is electrochemically inert. However, an ideal well-resolved CV was restored for the Janus-modified electrode. This observation is in good accordance with metal–SAM-redox couples that behaved inert to interfacial electron transfer (ET), while promoting ET with Au or Pt NPs anchored onto the SAM.57–61 | ||
| Fig. 6 (a) CV of bare GC (black line), TOA–Au/DPPC (1:4) complex transferred from pure water subphase (red line) and from the tyrosine (blue line)-modified electrodes in 1 mM Fe(CN6)3−/4− and 0.1 M KCl electrolyte. Scan rate: 0.05 V s−1, surface pressure: 40 mN m−1. | ||
The electronic attributes of the Janus cluster-modified electrodes were further investigated through electrochemical impedance spectroscopy (EIS). In the Nyquist plot in Fig. 6b, the presence of Janus-modified architecture suppresses the resistance to many folds in reference to complex-modified GC electrode. The anodic and cathodic currents observed for the Janus NP-modified electrode are close to the bare GC electrode. A similar effect has been observed by Gooding et al., in which identical voltammograms (for hexamine ruthenium(II)/(III) redox couple) of NP-modified SAM to that on a bare Au electrode were obtained.62 The peak-to-peak cathodic and anodic potential difference, ΔEp > 180 mV in Fig. 6a, indicated the quasi-reversible nature of electron transfer across the modified electrode.
In Fig. 7, scan-rate variation reveals a greater influence on the anodic (Ep,a) and cathodic (Ep,c) peak currents as the potential is shifted towards more positive and negative potentials, respectively. The Janus cluster-mediated electron-transfer rate was estimated from kapp, the apparent electron-transfer rate for the redox couple Fe(CN6)3−/4− at the modified electrode using Laviron's method at varied scan rates (0.1–0.5 V s−1).63 The electrochemical transfer coefficient α was estimated from the slopes of Ep,a and Ep,c versus ln ν linear plots (see Fig. 7, right panel and Table 3). With n as the number of electrons transferred, ν as the sweep rate, and F as Faraday's constant, kapp was estimated to be 2.83 × 10⁻³ s−1. Table 3 lists the ET rate constants for pristine tyrosine and DPPC-protected Au NPs, and it unequivocally shows enhanced electron-transfer kinetics for the Janus cluster-mediated electrode.
 | ||
| Fig. 7 (a) Cyclic voltammograms obtained for 1 mM Fe(CN6)3−/4− redox probe in a 0.1 M KCl-supporting electrolyte at a GC electrode modified by (a) Janus Au NP, (c) pristine DPPC Au NP and (e) pristine Tyr-capped Au NPs at different scan rates (0.1–0.5 V s−1). (b), (d) and (f) depict the scan rate-dependent peak potentials, Ep. | ||
| System | α | kapp, s−1 |
|---|---|---|
| Janus cluster | 0.49 | 2.8 × 10⁻³ |
| DPPC Au NPs | 0.44 | 5.6 × 10⁻⁴ |
| Tyrosine Au NPs | 0.51 | 4.7 × 10⁻³ |
Dopamine (DA) as a neurotransmitter has been given extensive attention in clinical research, whereas ascorbic acid (AA) has been used as a potential antioxidant.64,65 Electrochemical methods have proven to be highly sensitive for DA sensing.66–69 Due to surface fouling caused by the absorption of the oxidized product of the analyte in the bare-metal electrode, various chemically modified electrodes have been fabricated,70,71 of which NP-modified electrodes have been extensively studied.72–74 Note that the present Janus cluster-modified electrode's electro-catalytic activity towards the oxidation of DA has been examined.
Fig. 8a shows the DPV response of the modified and bare GC (dotted line) electrodes recorded in the presence of 1 μM AA in a 0.1 M PBS buffer. As shown in the figure, a dramatic enhancement of the anodic peak current at 0.126 V for the modified electrode (solid curves, iii–ix) is observed upon addition of DA in 5 μM increments with peak maximum shifting to more positive potentials. However, only a slight increase in the anodic current was observed at 0.103 V for the bare GC electrode even after the addition of 25 μM DA (curve, i), which is attributed to electrode fouling from the strongly adsorbed oxidized products. The calibration graph in Fig. 8b shows linearly increased peak currents with an increasing in the DA concentration in the range 1–30 μM. The DA sensitivity deduced from the slope upon linear regression75 amounted to 0.023 μA μM−1 with a detection limit 0.05 μM (curve ii). In Scheme 1, the affinity of dopamine toward the Janus cluster discards antifouling via intramolecular H-bonding between the –OH group of DA and the –COO− functionality of tyrosine, complying with DFT (M06-2X/6-31g++) computations and encouraged directed electron transport.
 | ||
| Fig. 8 (a) Differential pulse voltammograms (DPV) demonstrating the electrocatalytic oxidation of dopamine at (i) bare GC electrode (dotted line) and (iii–ix) for Janus-modified electrode in the DA concentration range 1–30 μM with fixed AA concentration (1 μM) in the 0.1 M PBS buffer. (b) Linear calibration plot for DA estimation with sensitivity 0.025 μA μM−1. | ||
 | ||
| Scheme 1 (a) Schematic representing electrocatalytic oxidation of DA at the Janus cluster-modified electrode. (b) Depiction of DFT (M06-2X/6-31g++)-computed favorable hydrogen bonding interaction between DA and tyrosine. | ||
Electronic communication between the redox-active Janus Au cluster and the GC electrode enhances the electro-catalytic oxidation of DA via through-space tunneling along the DPPC alkyl chain.76 The amperometric sensing performance of the fabricated Janus cluster electrode, bearing bioactive molecules at both sides of the nanocluster surface, promises to be employed in biogenic environments.
4. Conclusion
The current investigation chose a liquid–air interfacial microenvironment as a versatile bioinspired platform for the synthesis of exotic Janus gold quantum clusters with low dielectric constant biomolecular protective cappings such as DPPC and tyrosine. Real-time polarized FT-IRRAS spectroscopy and in situ microvoltammetry confirmed the templated Janus structure anisotropy, in which the phospholipid acted as an excellent capping ligand, providing steric and charge stabilization to the Janus cluster. DFT calculations provided the binding modes of the bifunctional Janus cluster. In situ tracking of the confined quantum cluster's single electron charging events revealed the HOMO–LUMO gap and the attofarad capacitance; thus, the Janus clusters can be considered as quantum capacitors. A larger kapp for the Janus cluster in reference to the lipid-only protected Au cluster evidenced the prominent contribution of tyrosine towards the enhanced electron transfer rate. A biosensor platform could be achieved with the Janus cluster-supported GC electrode, showing selective dopamine sensing. The approaches adopted in this investigation mimicked characteristic electron transfer events at the biogenic alveolar interfaces and can, in principle, be applicable to other protecting biocompatible ligand(s) as that of anionic and/or cationic lipids. The lipid–amino acid-based Janus cluster, which is the first of its kind, may provide a biologically inspired route towards designing therapeutic agents while reducing nanoparticle toxicity.Acknowledgements
The authors thank the Department of Science and Technology, New Delhi, India, for the financial support (Grant no. SR/S2/CMP-57/2006). N.K.S. acknowledges the Senior Research Fellowship from IIT Madras.References
- A. Walther, M. Drechsler, S. Rosenfeldt, L. Harnau, M. Ballauff, V. Abetz and A. H. E. Müller, J. Am. Chem. Soc., 2009, 131, 4720–4728 CrossRef CAS PubMed.
- S. C. Glotzer, Science, 2004, 306, 419–420 CrossRef CAS PubMed.
- Z. Nie, W. Li, M. Seo, S. Xu and E. Kumacheva, J. Am. Chem. Soc., 2006, 128, 9408–9412 CrossRef CAS PubMed.
- T. Nisisako, T. Torii, T. Takahashi and Y. Takizawa, Adv. Mater., 2006, 18, 1152–1156 CrossRef CAS.
- T. Nisisako and T. Torii, Adv. Mater., 2007, 19, 1489–1493 CrossRef CAS.
- Y. Iwashita and Y. Kimura, Soft Matter, 2013, 9, 10694–10698 RSC.
- Y. Song and S. Chen, Chem.–Asian J., 2014, 9, 418–430 CrossRef CAS PubMed.
- M. Yoshida, K.-H. Roh, S. Mandal, S. Bhaskar, D. Lim, H. Nandivada, X. Deng and J. Lahann, Adv. Mater., 2009, 21, 4920–4925 CrossRef CAS PubMed.
- J. Zheng, G. Perkins, A. Kirilova, C. J. Allen and D. A. Jaffray, Invest. Radiol., 2006, 41, 339–348 CrossRef PubMed.
- A. Verma and F. Stellacci, Small, 2010, 6, 12–21 CrossRef CAS PubMed.
- A. E. Nel, L. Mädler, D. Velegol, T. Xia, E. M. V. Hoek, P. Somasundaran, F. Klaessig, V. Castranova and M. Thompson, Nat. Mater., 2009, 8, 543–557 CrossRef CAS PubMed.
- A. Verma, O. Uzun, Y. Hu, Y. Hu, H.-S. Han, N. Watson, S. Chen, D. J. Irvine and F. Stellacci, Nat. Mater., 2008, 7, 588–595 CrossRef CAS PubMed.
- S. Ahmed, Z. Nikolov and S. L. Wunder, J. Phys. Chem. B, 2011, 115, 13181–13190 CrossRef CAS PubMed.
- L. Paasonen, T. Sipilä, A. Subrizi, P. Laurinmäki, S. J. Butcher, M. Rappolt, A. Yaghmur, A. Urtti and M. Yliperttula, J. Controlled Release, 2010, 147, 136–143 CrossRef CAS PubMed.
- M. R. Rasch, E. Rossinyol, J. L. Hueso, B. W. Goodfellow, J. Arbiol and B. A. Korgel, Nano Lett., 2010, 10, 3733–3739 CrossRef CAS PubMed.
- N. C. M. Tam, B. M. T. Scott, D. Voicu, B. C. Wilson and G. Zheng, Bioconjugate Chem., 2010, 21, 2178–2182 CrossRef CAS PubMed.
- M. R. Mackiewicz, H. L. Hodges and S. M. Reed, J. Phys. Chem. B, 2010, 114, 5556–5562 CrossRef CAS PubMed.
- J. A. Yang and C. J. Murphy, Langmuir, 2012, 28, 5404–5416 CrossRef CAS PubMed.
- A. Sánchez, P. Díez, P. Martínez-Ruíz, R. Villalonga and J. M. Pingarrón, Electrochem. Commun., 2013, 30, 51–54 CrossRef.
- M. M. Wu, X. Zhong, Q. Wang, Q. Sun, R. Pandey and P. Jena, J. Phys. Chem. C, 2011, 115, 23978–23983 CAS.
- M. Yoshida, K. H. Roh and J. Lahann, Biomaterials, 2007, 28, 2446–2456 CrossRef CAS PubMed.
- S. H. Choi and Y. C. Kang, Nanoscale, 2013, 5, 4662–4668 RSC.
- C. Fliedel, V. Faramarzi, V. Rosa, B. Doudin and P. Braunstein, Chem.–Eur. J., 2014, 20, 1263–1266 CrossRef CAS PubMed.
- P. Biji, N. K. Sarangi and A. Patnaik, Langmuir, 2010, 26, 14047–14057 CrossRef CAS.
- P. J. Hay and W. R. Wadt, J. Chem. Phys., 1985, 82, 270–283 CrossRef CAS.
- M. J. Frisch, et al. Gaussian 09, Revision C. 01, Gaussian, Inc., Wallingford CT, 2010 Search PubMed.
- R. F. W. Bader, AIM2000 Program Package, Ver. 2.0, McMaster University, Hamilton Ontario, Canada, 2002 Search PubMed.
- N. K. Sarangi and A. Patnaik, ChemPlusChem, 2012, 77, 898–907 CrossRef CAS.
- J. Jen-Jung, L. Cheng-Xun and J. Jeng-Shiung, J. Nanosci. Nanotechnol., 2012, 12, 2802–2809 CrossRef.
- P. R. Selvakannan, A. Swami, D. Srisathiyanarayanan, P. S. Shirude, R. A. Pasricha, B. Mandale and M. Sastry, Langmuir, 2004, 20, 7825–7836 CrossRef CAS PubMed.
- J. D. S. Newman and G. J. Blanchard, Langmuir, 2006, 22, 5882–5887 CrossRef CAS PubMed.
- H. M. Zakaria, A. Shah, M. Konieczny, J. A. Homann, A. J. Nijdam and M. E. Reeves, Langmuir, 2013, 29, 7661–7673 CrossRef CAS PubMed.
- M. L. Mitchell and R. A. Dluhy, J. Am. Chem. Soc., 1988, 110, 712–718 CrossRef CAS.
- N. K. Sarangi and A. Patnaik, J. Phys. Chem. B, 2011, 115, 13551–13562 CrossRef CAS.
- E. C. Griffith and V. Vaida, J. Am. Chem. Soc., 2012, 135, 710–716 CrossRef PubMed.
- D. Krüger, H. Fuchs, D. Rousseau, D. Marx and M. Parrinello, Phys. Rev. Lett., 2002, 89, 186402 CrossRef.
- A. H. Pakiari and Z. Jamshidi, J. Phys. Chem. A, 2007, 111, 4391–4396 CrossRef CAS PubMed.
- R. F. W. Bader, Chem. Rev., 1991, 91, 893–928 CrossRef CAS.
- D. Cremer and E. Kraka, Angew. Chem., Int. Ed. Engl., 1984, 23, 627–628 CrossRef.
- M. Fujihira and T. Araki, Chem. Lett., 1986, 921–922 CrossRef CAS.
- R. J. Forster, T. E. Keyes and M. Majda, J. Phys. Chem. B, 2000, 104, 4425–4432 CrossRef CAS.
- D. H. Charych, E. M. Landau and M. Majda, J. Am. Chem. Soc., 1991, 113, 3340–3346 CrossRef CAS.
- S. Chen, R. S. Ingram, M. J. Hostetler, J. J. Pietron, R. W. Murray, T. G. Schaaff, J. T. Khoury, M. M. Alvarez and R. L. Whetten, Science, 1998, 280, 2098–2101 CrossRef CAS PubMed.
- S. Chen, R. W. Murray and S. W. Feldberg, J. Phys. Chem. B, 1998, 102, 9898–9907 CrossRef CAS.
- D. T. Miles and R. W. Murray, Anal. Chem., 2003, 75, 1251–1257 CrossRef CAS.
- J. Kim, K. Lema, M. Ukaigwe and D. Lee, Langmuir, 2007, 23, 7853–7858 CrossRef CAS PubMed.
- B. M. Quinn, P. Liljeroth, V. Ruiz, T. Laaksonen and K. Kontturi, J. Am. Chem. Soc., 2003, 125, 6644–6645 CrossRef CAS.
- D. Lee, R. L. Donkers, G. Wang, A. S. Harper and R. W. Murray, J. Am. Chem. Soc., 2004, 126, 6193–6199 CrossRef CAS PubMed.
- R. L. Donkers, D. Lee and R. W. Murray, Langmuir, 2008, 24, 5976 CrossRef CAS.
- R. Balasubramanian, R. Guo, A. J. Mills and R. W. Murray, J. Am. Chem. Soc., 2005, 127, 8126–8132 CrossRef CAS PubMed.
- V. G. Morales and S. Mafé, J. Phys. Chem. C, 2007, 111, 7242–7250 Search PubMed.
- J. F. Hicks, D. T. Miles and R. W. Murray, J. Am. Chem. Soc., 2002, 124, 13322–13328 CrossRef CAS PubMed.
- S. K. Haram, B. M. Quinn and A. J. Bard, J. Am. Chem. Soc., 2001, 123, 8860–8861 CrossRef CAS PubMed.
- Z. Ding, B. M. Quinn, S. K. Haram, L. E. Pell, B. A. Korgel and A. J. Bard, Science, 2002, 296, 1293–1297 CrossRef CAS PubMed.
- Y. Yang and S. Chen, Nano Lett., 2003, 3, 75–79 CrossRef CAS.
- J. J. Pietron, J. F. Hicks and R. W. Murray, J. Am. Chem. Soc., 1999, 121, 5565–5570 CrossRef CAS.
- M. Brust, D. Bethell, C. J. Kiely and D. J. Schiffrin, Langmuir, 1998, 14, 5425–5429 CrossRef CAS.
- K. C. Grabar, K. J. Allison, B. E. Baker, R. M. Bright, K. R. Brown, R. G. Freeman, A. P. Fox, C. D. Keating, M. D. Musick and M. J. Natan, Langmuir, 1996, 12, 2353–2361 CrossRef CAS.
- G. Liu, E. Luais and J. J. Gooding, Langmuir, 2011, 27, 4176–4183 CrossRef CAS.
- G. P. Kissling, D. O. Miles and D. J. Fermin, Phys. Chem. Chem. Phys., 2011, 13, 21175–21185 RSC.
- G. Le Saux, S. Ciampi, K. Gaus and J. J. Gooding, ACS Appl. Mater. Interfaces, 2009, 1, 2477–2483 CAS.
- J. B. Shein, L. M. H. Lai, P. K. Eggers, M. N. Paddon-Row and J. J. Gooding, Langmuir, 2009, 25, 11121–11128 CrossRef CAS PubMed.
- E. Laviron, J. Electroanal. Chem., 1979, 100, 263–270 CrossRef CAS.
- C. André, I. Castanheira, J. M. Cruz, P. Paseiro and A. Sanches-Silva, Trends Food Sci. Technol., 2010, 21, 229–246 CrossRef.
- R. M. Wightman, L. J. May and A. C. Michael, Anal. Chem., 1988, 60, 769A–779A CrossRef CAS.
- S. R. Ali, R. R. Parajuli, Y. Balogun, Y. F. Ma and H. X. He, Sensors, 2008, 8, 8423–8452 CrossRef CAS.
- D. Lakshmi, M. J. Whitcombe, F. Davis, P. S. Sharma and B. B. Prasad, Electroanalysis, 2011, 23, 305–320 CrossRef CAS.
- Z. Dursun, L. Pelit and I. Taniguchi, Turk. J. Chem., 2009, 33, 223–231 CAS.
- J. Ping, J. Wu, Y. Wang and Y. Ying, Biosens. Bioelectron., 2012, 34, 70–76 CrossRef CAS PubMed.
- A. A. Ensafi, M. Taei, T. Khayamian and A. Arabzadeh, Sens. Actuators, B, 2010, 147, 213–221 CrossRef CAS.
- S. A. Kumar, S. F. Wang, T. C. K. Yang and C. T. Yeh, Biosens. Bioelectron., 2010, 25, 2592–2597 CrossRef CAS PubMed.
- S. H. Huang, H. H. Liao and D. H. Chen, Biosens. Bioelectron., 2010, 25, 2351–2355 CrossRef CAS PubMed.
- F. A. Armstrong and G. S. Wilson, Electrochim. Acta, 2000, 45, 2623–2645 CrossRef CAS.
- D. Li, M. B. Müller, S. Gilje, R. B. Kaner and G. G. Wallace, Nat. Nanotechnol., 2008, 3, 101–105 CrossRef CAS PubMed.
- Y. Hayashi, R. Matsuda, K. Ito, W. Nishimura, K. Imai and M. Maeda, Anal. Sci., 2005, 21, 167–179 CrossRef CAS PubMed.
- N. K. Sarangi and A. Patnaik, ChemPhysChem, 2012, 13, 4258–4270 CrossRef CAS PubMed.
Footnote |
| † Electronic supplementary information (ESI) available: Experimental procedure for the synthesis of pristine DPPC and Tyr Au NPs. Additional IRRAS and electrochemical data. See DOI: 10.1039/c4ra01869a |
| This journal is © The Royal Society of Chemistry 2014 |