Monitoring of hydrogen sulfide via substrate-integrated hollow waveguide mid-infrared sensors in real-time
João
Flávio da Silveira Petruci
ab,
Paula Regina
Fortes
bc,
Vjekoslav
Kokoric
b,
Andreas
Wilk
b,
Ivo Milton
Raimundo
Jr.
c,
Arnaldo Alves
Cardoso
a and
Boris
Mizaikoff
*b
aSão Paulo State University, Department of Analytical Chemistry, UNESP, CEP 14800-970, Araraquara, SP, Brazil
bUniversity of Ulm, Institute of Analytical and Bioanalytical Chemistry, 89081, Ulm, Germany. E-mail: boris.mizaikoff@uni-ulm.de
cUniversity of Campinas, Department of Analytical Chemistry, UNICAMP, Campinas, SP, Brazil
First published on 25th October 2013
Abstract
Hydrogen sulfide is a highly corrosive, harmful, and toxic gas produced under anaerobic conditions within industrial processes or in natural environments, and plays an important role in the sulfur cycle. According to the U.S. Occupational Safety and Health Administration (OSHA), the permissible exposure limit (during 8 hours) is 10 ppm. Concentrations of 20 ppm are the threshold for critical health issues. In workplace environments with human subjects frequently exposed to H2S, e.g., during petroleum extraction and refining, real-time monitoring of exposure levels is mandatory. Sensors based on electrochemical measurement principles, semiconducting metal-oxides, taking advantage of their optical properties, have been described for H2S monitoring. However, extended response times, limited selectivity, and bulkiness of the instrumentation are common disadvantages of the sensing techniques reported to date. Here, we describe for the first time usage of a new generation of compact gas cells, i.e., so-called substrate-integrated hollow waveguides (iHWGs), combined with a compact Fourier transform infrared (FTIR) spectrometer for advanced gas sensing of H2S. The principle of detection is based on the immediate UV-assisted conversion of the rather weak IR-absorber H2S into much more pronounced and distinctively responding SO2. A calibration was established in the range of 10–100 ppm with a limit of detection (LOD) at 3 ppm, which is suitable for occupational health monitoring purposes. The developed sensing scheme provides an analytical response time of less than 60 seconds. Considering the substantial potential for miniaturization using e.g., a dedicated quantum cascade laser (QCL) in lieu of the FTIR spectrometer, the developed sensing approach may be evolved into a hand-held instrument, which may be tailored to a variety of applications ranging from environmental monitoring to workplace safety surveillance, process analysis and clinical diagnostics, e.g., breath analysis.
Introduction
Over recent decades, hydrogen sulfide has been identified as a highly relevant molecule within a variety of research fields ranging from environmental analysis to clinical diagnostics.10,11 For example, the release of H2S into the atmosphere has been related to natural sources such as the degradation of organic matter via bacterial reduction of sulfur compounds and volcanic activities,12 and to industrial activities including petroleum extraction, fuel burning, production of detergents, and processes in the pulp and paper industry.8 Besides, H2S is endogenously synthesized via the L-cysteine metabolism, and is involved in several biological functions ranging from enzymatic and transport anomalies to oral malodor.9,13,14Next to its presence in various environmental, industrial, and clinical scenarios, H2S is a highly toxic, flammable, odorous, and corrosive gas.15 Corrosion of pipe walls (e.g., in petroleum and natural gas pipelines) is a serious issue in petroleum industries.16 Moreover, recent studies have attributed H2S as the second most common cause of death related to gas inhalation in workplace environments,17 in particular within confined spaces.18
The U.S. Occupational Safety and Health Administration has established a hydrogen sulfide concentration of 10 ppm as an 8 hour exposure limit.19 Furthermore, concentrations ranging from 15 to 100 ppm are considered to cause severe damage to human health including digestive upset, loss of appetite, olfactory paralysis, and eye and/or lung irritation.20 In terms of toxicity, the concentration of H2S is extremely more important than the exposure time.18 1000 ppm is sufficient to cause an immediate collapse within 1 or 2 breathing cycles. If compared with other inhaled toxic gases, this ‘knock down’ effect renders H2S a toxic gas with a minute margin of safety.21 From this point of view, reliable real-time monitoring of H2S is an essential demand.
Despite a variety of online monitoring options for gaseous hydrogen sulfide, its quantitative reliable determination still remains a challenge in the field of chemical sensors. The high reactivity and the ability to adsorb at many types of surfaces are the most common sources of errors during the detection of H2S.22 Gas chromatography is frequently used as the ‘gold standard’ for H2S quantification with remarkable sensitivity and precision.23 However, this type of analysis involves multiple sample preparation and analysis steps, and therefore, does not provide real-time results or short-term elevated exposures or concentration variations. Furthermore, the rather bulky dimensions and cost of instrumentation renders in situ monitoring via GC techniques less feasible. A variety of (physico-)chemical sensors providing real-time response are described in the literature, and are usually based on semiconducting metal-oxides,1,2 electrochemical sensing principles3,4 and optical sensing techniques.5,6,7 While these sensors have some apparent advantages including rapid response, high sensitivity, low cost, and ease of operation, their drawbacks include their limited selectivity, potential of interference under real-world measurement conditions, and effects of environmental parameters such as temperature and humidity.
Optical sensors appear particularly advantageous in terms of equipment cost, simplicity, ease of operation, and potential for miniaturization. Indirect chemical sensing methods, which are usually based on chemical reactions with dyes immobilized within polymeric matrices have shown remarkable sensitivity.24 However, extended response times render such devices less feasible for field usage. Direct optical sensing techniques including mid-infrared sensing concepts utilizing intrinsic optical properties of the analyte (e.g., fluorescence or absorption) are not widely described in the literature,25 whereas the near infrared (NIR) spectral range has been utilized to determine H2S at ppb levels using diode laser-based technology.26,27 This may be attributed to the rather weak absorption signature of H2S in the mid-infrared regime. A potential solution to mitigate this problem is the conversion of hydrogen sulfide to sulfur dioxide.
Hydrogen sulfide may readily convert to sulfur dioxide and other sulfur compounds (e.g., sulfate) using oxidative compounds, e.g., for the removal of H2S from the atmosphere.28 Despite the fact that this reaction is not instantaneous (H2S has a resident time of approx. 24 hours under environment conditions), several conversion-based procedures are described in the literature using temperature, pressure, metal oxides, and UV-Vis radiation to catalyze this conversion process.29,30 Larsen et al.31 described an approach to determine H2S using FTIR spectroscopy after UV-assisted conversion to SO2, which has a very strong absorption within the 1400–1300 cm−1 band. Using an optical path length of 26 m, hydrogen sulfide was detectable at concentrations of 32 ppm. While this study does not provide the opportunity of continuous in-flow conversion along with rather bulky instrumentation, and without evaluation of the analytical-figures-of-merit, it certainly demonstrated the utility of MIR spectroscopy for the detection of H2S after conversion.
Hollow waveguides may fundamentally be considered highly miniaturized light-pipes with a coaxial hollow core usually made from dielectric materials that enable radiation propagation by reflection at the inside wall.32 If gaseous samples are injected into the hollow core, the hollow waveguide (HWG) may simultaneously act as an extremely low volume gas cell with a well-defined optical absorption path length facilitating miniaturized MIR gas sensing strategies.33 The utility and adaptability of HWGs coupled to FTIR spectrometers operating at the 3–20 μm band for gas sensing applications have extensively been described in the literature.34–36
The so-called substrate-integrated hollow waveguide (iHWG) represents a fundamentally new generation of hollow waveguides pioneered by the research team of Mizaikoff and collaborators.37 The compact dimensions of the waveguide substrate (75 × 50 × 12 mm; made from aluminum), the adaptable (i.e., designable) optical path length via integration of meandered hollow waveguide structures at virtually any desired geometry into an otherwise planar substrate, the minute volume of the gas sample required for analysis, and the short transient time of such small volumes (few hundred microliters) through the active transducer region facilitating real-time monitoring are the most remarkable features of this innovation.
As previously demonstrated, iHWG-based sensing devices provide a compact, robust, and simply assembled system enabling real-time monitoring of relevant gas phase constituents.38 In the present study, we show for the first time the potential for real-time online analysis of hydrogen sulfide at low ppm concentration levels using a compact FTIR spectrometer coupled to the iHWG. H2S is quantitatively converted to SO2 using UV irradiation within a flow-through cell without any delay of the sensor response time, thus providing an excellent alternative to conventional analysis techniques for H2S reported to date.
Results and discussion
Conversion of H2S to SO2
As hydrogen sulfide has an inherently very weak MIR absorption signature, direct detection by IR techniques is usually limited to high concentrations or long-path multi-pass gas cells. For confirmation, a concentration of 1000 ppm of H2S was directly injected into the iHWG-IR sensor, and no signal was detectable. The conversion of H2S into SO2 involves a hydroxyl radical, which may be formed by irradiation with UV light. The process is hypothesized as:31,39| H2O + HO˙ → HS˙ + H2O | (1) |
| HS˙ + O2 → SO + HO˙ | (2) |
| SO + 1/2O2 → SO2 | (3) |
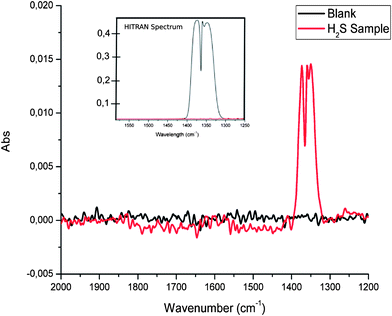
The flow-through conversion system was operated using a H2S concentration of 100 ppm (in synthetic air), a gas flow rate within the glass tubing wrapped around a UV lamp of 5 mL min−1, and a UV radiation exposure path length of 95 cm. 50 spectra were averaged for each IR measurement at a spectral resolution of 4 cm−1 at a measurement interval of 3.5 seconds between each measurement. Thus obtained SO2 spectra are exemplarily illustrated in Fig. 1 along with a comparison of a simulated sulfur dioxide spectrum calculated using the HITRAN simulator.40 The most intense band within the SO2 spectrum relates to the asymmetric SO stretching vibration, and is located in the spectral range 1400–1300 cm−1. A typical signal-to-noise ratio (SNR) obtained during such measurements is 45.
Effects of the gas flow rate on the conversion efficiency
In order to achieve an optimum UV irradiation time at constant light intensity, different gas flow rates were evaluated at a concentration of 100 ppm H2S in synthetic air, again averaging 50 IR spectra per measurement. As evident in Fig. 2, the optimum flow rate was determined at 10 mL min−1 providing a signal-to-noise ratio of 83 for such measurements. The decrease of the SO2 absorption signal for further increased flow rates indicates that more irradiation time is required to achieve optimum conversion efficiency. Furthermore, a significant decrease of the SO2 signal was observed at gas rates <10 mL min−1. This may be explained by two effects; (i) the photodissociation of sulfur dioxide by ultraviolet radiation according to| SO2 + hv(<218 nm) → ˙SO + O˙, | (4) |
| SO2 + HO˙ → ˙HSO3 | (5) |
| ˙HSO3 + O2 → SO3 + ˙HO2 | (6) |
| SO3 + H2O → H2SO4 | (7) |
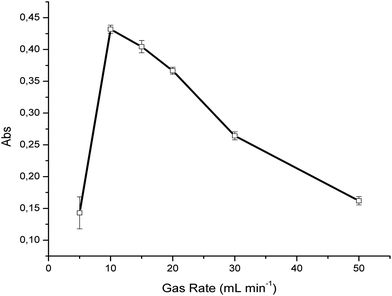 | ||
| Fig. 2 Evaluation of the effect of the gas sample flow rate through the UV-assisted conversion device (H2S ⇒ SO2). | ||
In the present study, synthetic air containing trace amounts of water was used as the background matrix. Therefore, the flow rate was optimized for the present sample conditions. In the case of samples containing higher levels of moisture, which may adversely affect the conversion time31 the flow rate must accordingly be optimized. Baseline fluctuations were previously described at extended irradiation times, and relate to the formation of elemental sulfur and sulfate particles.29 However, this behavior was not observed during the experiments reported here, which is again beneficially attributed to the flow-through conversion. For all further experiments, a conversion flow rate of 10 mL min−1 was therefore used.
Effects of synthetic air on the conversion efficiency
The presence of oxygen is a fundamental requirement to initiate the conversion reaction. Hence, effects of the percentage of synthetic air on the conversion of 100 ppm H2S were evaluated and plotted in Fig. 3. Variations of the composition of synthetic air and H2S were prepared using nitrogen. Evidently, values higher than 20% synthetic air result in no significant increase of SO2 production, thereby indicating that sufficient oxygen is present for a quantitative conversion.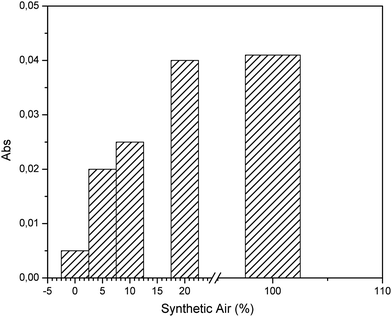 | ||
| Fig. 3 Evaluation of the effect of the synthetic air composition for preparation of H2S gas samples at a concentration of 100 ppm. | ||
Conversion reproducibility and real-time response
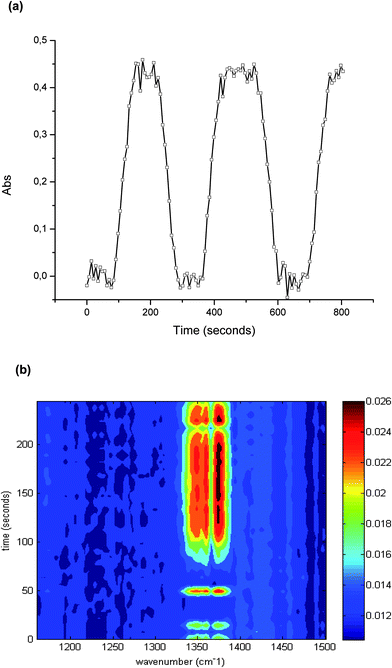
As discussed, the irradiation of H2S, O2, and H2O simultaneously present in a gas sample with UV radiation may cause several reactions and molecular rearrangements. Next to the optimum conversion efficiency, the reproducibility of the conversion was investigated, as this is crucial for quantitative analysis. The precision was evaluated via the peak area at 1374 cm−1 during 60 independent measurements of the conversion of 100 ppm hydrogen sulfide. The obtained relative standard deviation (RSD) was 2.21%.The capabilities of the developed iHWG-IR sensor system for online monitoring were evaluated by continuously monitoring the sample after conversion. For this purpose, the UV lamp was switched off at intervals of 2 min for instantaneously interrupting the H2S–SO2 conversion, and then switched back on after 2 min again enabling the conversion. After 80 seconds, the maximum signal was again obtained, which results from the dead volume of the conversion device. The obtained results are shown in Fig. 4 confirming excellent reproducibility of the peak height, and of the transient signal for 100 ppm of hydrogen sulfide.
Analytical figures-of-merit
A calibration function based on the evaluation of the peak area from 1395 to 1321 cm−1versus the H2S concentration was established for quantitative data evaluation. For each concentration, the mean value of five replicate measurements was calculated. The proposed method revealed excellent linearity over the concentration of 10, 25, 50, 75 and 100 ppm of H2S (r2 > 0.998) selected for the present study. The obtained calibration equation was A = 0,0057 [H2S] – 0,0056, where A represents the peak area (1395–1321 cm−1), and [H2S] is the hydrogen sulfide concentration in ppm. The calculated limit of detection (LOD) was considered as three times the standard deviation of the blank signal, and was determined at 3 ppm. The obtained results are summarized in Table 1.| Parameter | Value |
|---|---|
| Limit of detection (3 × SD of blank) | 3 ppm |
| Limit of quantification (10 × SD of blank) | 11 ppm |
| Correlation coefficient | 0.9905 |
| Conversion repeatability | 2.21% |
| Linear range | 10–100 ppm |
| Regression equation | A = 0.0057 [H2S] – 0.0056 |
Experimental
Materials and standards
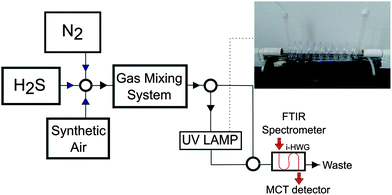
Hydrogen sulfide, synthetic air, and nitrogen were purchased from MTI Industriegase AG (Neu-Ulm, Germany). The H2S–SO2 conversion was performed by exposing H2S–synthetic air mixtures to ultraviolet radiation @ 185 nm (UV Technik, Germany) using a custom quartz tube flow device with the tubular conversion cell coiled around the UV lamp (length of coiled segment: 95 cm). This device enables the interaction between the sample gas and UV radiation, as schematically illustrated in Fig. 5. A gas mixing prototype based on mass flow controllers developed by the Institute of Analytical and Bioanalytical Chemistry, University of Ulm and Lawrence Livermore National Laboratory (USA) was used for preparing and delivering hydrogen sulfide samples of various percentages in synthetic air at a flow rate of 10 mL min−1.FTIR spectrometry
All measurements reported herein were performed using a compact FTIR spectrometer (IR cube, Bruker Optics Inc, Ettlingen, Germany) equipped with a liquid nitrogen cooled mercury–cadmium–telluride (MCT) detector (Infrared Associates, Stuart/FL, USA). An aluminum iHWG providing an integrated hollow waveguide channel (i.e., absorption path length) of 42 cm at device dimensions of 75 × 50 × 12 mm (length × width × depth) was coupled to the spectrometer using off-axis parabolic mirrors with a focal length of 2′′ (Thorlabs, Germany). The IR spectra were recorded in the wavelength range of 4000–650 cm−1, and at a spectral resolution of 4 cm−1; 100 spectra were averaged per measurement unless stated otherwise at a measurement interval of 7 seconds between each measurement. The OPUS 6.5 software package (Bruker Optics Inc, Ettlingen, Germany) was used for data acquisition. The hydrogen sulfide standards were injected into the UV-iHWG system at a constant flow rate of 10 mL min−1.Conclusions
In this study, we described for the first time the utility of a new generation of hollow waveguides – the so-called substrate-integrated hollow waveguide (iHWG) – coupled to a FTIR spectrometer for real-time monitoring of hydrogen sulfide in gaseous samples. While H2S inherently provides a weak absorption pattern in the mid-infrared regime, a flow-through system has been developed providing real-time conversion into SO2, which provides an exceptionally strong and distinct MIR signature. Given the rapid and efficient conversion of H2S into SO2via UV irradiation at 185 nm, the reaction may be performed in a flow-through mode, thereby enabling the real-time determination of H2S with a limit of detection of 3 ppm. Consequently, the developed method is suitable for sensing applications where concentration fluctuations or short-term elevated exposure levels of hydrogen sulfide must be rapidly detected (e.g., workplace environments such as petroleum extraction platforms, etc.).In future, a significant reduction of the physical dimensions of the developed sensing device is anticipated by replacing the FTIR spectrometer with a suitable tunable quantum cascade laser (QCL) light source.41,42 Furthermore, the usage of appropriate solid-phase preconcentration techniques is currently investigated for additionally improving the sensitivity, which is relevant for analyzing environmentally and clinically relevant H2S levels in the ppb concentration range.
Acknowledgements
J. F. S. P, P. R. F, I. M. R. Jr and A. A. C thank the Brazilian agencies CAPES (Coordenação de Aperfeiçoamento de Pessoal de Nível Superior), CNPq (Conselho Nacional de Desenvolvimento Científico e Tecnológico), and FAPESP-BEPE (2012/05573-6) for fellowships and financial support. This work was performed in part under the auspices of the U.S. Department of Energy by Lawrence Livermore National Laboratory (LLNL) under Contract DE-AC52-07NA27344. This project was in part funded under LLNL sub-contract Nos. B598643 and B603018.References
- G. J. Fang, Z. L. Liu, C. Q. Liu and K. L. Yao, Sens. Actuators, B, 2000, 66, 46–48 CrossRef CAS.
- A. Chowdhuri, V. Gupta and K. Sreenivas, Sens. Actuators, B, 2003, 93, 572–579 CrossRef CAS.
- Y. Wang, H. Yan and E. F. Wang, Sens. Actuators, B, 2002, 87, 115–121 CrossRef CAS.
- C. B. Yu, Y. J. Wang, K. F. Hua, W. Xing and T. H. Lu, Sens. Actuators, B, 2002, 86, 259–265 CrossRef CAS.
- A. A. Cardoso, H. Liu and P. K. Dasgupta, Talanta, 1997, 44, 1099–1106 CrossRef CAS.
- U. Willer, D. Scheel, I. Kostjucenko, C. Bohling, W. Schade and E. Faber, Spectrochim. Acta, Part A, 2002, 58, 2427–2432 CrossRef.
- G. A. Tarver and P. K. Dasgupta, Atmos. Environ., 1995, 29(11), 1291–1928 CrossRef CAS.
- F. Saunders, L. Larson and V. Tatum, AIHA J., 2002, 63(3), 317–325 CAS.
- C. Toombs, M. Insko, E. Wintner, T. L. Deckwerth, H. Usansky, K. Jamil, B. Goldstein, M. Cooreman and C. Szabo, Br. J. Clin. Pharmacol., 2010, 69(6), 626–636 CrossRef CAS PubMed.
- N. S. Lawrence, J. Davis and R. G. Compton, Talanta, 2000, 52, 771–784 CrossRef CAS.
- L. Ciaffoni, R. Peverall and G. A. D. Ritchie, J. Breath Res., 2011, 5(2), 1–11 CrossRef PubMed.
- J. F. S. Petruci and A. A. Cardoso, Microchem. J., 2013, 106, 368–372 CrossRef CAS PubMed.
- M. A. Insko, T. L. Deckwerth, P. Hill, C. F. Toombs and C. Szabo, Br. J. Pharmacol., 2009, 157(6), 944–951 CrossRef CAS PubMed.
- J. Springfield, F. Suarez, G. Majerus, P. A. Lenton, J. K. Furne and M. D. Levitt, J. Dent. Res., 2001, 80(5), 1441–1444 CrossRef CAS PubMed.
- L.-F. Wang and T.-R. Sharples, Chin. Phys. Lett., 2011, 28(6), 067805 CrossRef.
- T. Mori, M. Koga, Y. Hikosaka, T. Nonaka, F. Mishina, Y. Sakai and J. Koizumi, Water Sci. Technol., 1991, 23(7–9), 1275–1282 CAS.
- R. G. Hendrickson, A. Chang and R. J. Hamilton, Am. J. Ind. Med., 2004, 45, 346–350 CrossRef CAS PubMed.
- T. L. Guidotti, Int. J. Toxicol., 2010, 29(6), 569–581 CrossRef CAS PubMed.
- T. L. Guidotti, Occup. Med., 1996, 46(5), 367–371 CrossRef CAS PubMed.
- F. Simon, R. Giudici, C. N. Duy, H. Schelzig, S. Oetter, M. Groeger, U. Wachter, J. Vogt, G. Speit, C. Szabo, P. Radermacher and E. Calzia, Shock, 2008, 30(4), 359–364 CrossRef CAS PubMed.
- M. G. Prior, A. K. Sharma, S. Yong and A. Lopez, Can. J. Vet. Res., 1988, 52(3), 375–379 CAS.
- A. A. Cardoso, Quim. Nova, 1990, 14, 19–21 Search PubMed.
- S. K. Pandey and K.-K. Kim, Environ. Sci. Technol., 2009, 43, 3020–3029 CrossRef CAS.
- K. Toda, S.-I. Ohira, T. Tanaka, T. Nishimura and P. K. Dasgupta, Environ. Sci. Technol., 2004, 38, 1529–1536 CrossRef CAS.
- S. K. Pandey, K.-H. Kim and K.-A. Tang, Trends Anal. Chem., 2012, 32, 87–99 CrossRef CAS PubMed.
- W. Chen, A. A. Kosterev, F. K. Tittel, X. Gao and W. Zhao, Appl. Phys. B: Lasers Opt., 2008, 90, 311–315 CrossRef CAS PubMed.
- A. Varga, Z. Bozoki, M. Szakall and G. Szabo, Appl. Phys. B: Lasers Opt., 2006, 85, 315–321 CrossRef CAS PubMed.
- T. F. Berglen, T. K. Berntsen, I. S. A. Isaken and J. K. Sundet, J. Geophys. Res., 2004, 109, D191310 CrossRef.
- X. Lan-Yan, G. Ding-Hong, T. Jing, D. Wen-Bo and H. Hui-Qi, Chemosphere, 2008, 71, 1774–1780 CrossRef PubMed.
- M. Moradi, J. T. Daryan and A. Mohamadalizadeh, Fuel Process. Technol., 2013, 109, 163–171 CrossRef CAS PubMed.
- E. S. Larsen, W. W. Hong and M. L. Spartz, Appl. Spectrosc., 1997, 51(11), 1656–1667 CrossRef CAS.
- C. M. Frey, F. Luxenburger, S. Droege, V. Mackoviak and B. Mizaikoff, Appl. Spectrosc., 2011, 65, 1269–1273 CrossRef CAS PubMed.
- C. M. Charlton, A. Inberg, N. Croitoru and B. Mizaikoff, IEE Proc.-J: Optoelectron., 2003, 150, 306–310 CrossRef CAS.
- C. Young, N. Menegazzo, A. E. Riley, C. H. Brons, F. P. DiSanzo, J. L. Givens, J. L. Martin, M. D. Disko and B. Mizaikoff, Anal. Chem., 2011, 83(16), 6141–6147 CrossRef CAS PubMed.
- R. L. Kozodoy, R. H. Micheels and J. A. Harrington, Appl. Spectrosc., 1996, 50(3), 415–419 CrossRef CAS.
- S. J. Saggese, J. A. Harrington and G. H. Sigel Jr, Opt. Lett., 1991, 16, 27–31 CrossRef CAS.
- A. Wilk, J. C. Carter, M. Chrisp, A. M. Manuel, P. Mirkarimi, J. B. Alameda and B. Mizaikoff, Anal. Chem., 2013 DOI:10.1021/ac402391m.
- J. F. S. Petruci, P. R. Fortes, V. Kokoric, A. Wilk, I. M. Raimundo-Jr, A. A. Cardoso and B. Mizaikoff, Sci. Rep., 2013, 3, 3174 Search PubMed.
- R. A. Cox and D. Sheppard, Nature, 1980, 284, 330–331 CrossRef CAS.
- L. S. Rothman, I. E. Gordon, A. Barbe, D. C. Benner, P. E. Bernath, M. Birk, V. Boudon, L. R. Brown, A. Campargue, J. P. Champion, K. Chance, L. H. Coudert, V. Dana, V. M. Devi, S. Fally, J. M. Flaud, R. R. Gamache, A. Goldman, D. Jacquemart, I. Kleiner, N. Lacome, W. J. Lafferty, J. Y. Mandin, S. T. Massie, S. N. Mikhailenko, C. E. Miller, N. Moazzen-Ahmadi, O. V. Naumenko, A. V. Nikitin, J. Orphal, V. I. Perevalov, A. Perrin, A. Predoi-Cross, C. P. Rinsland, M. Rotger, M. Simeckova, M. A. H. Smith, K. Sung, S. A. Tashkun, J. Tennyson, R. A. Toth, A. C. Vandaele and J. V. Auwera, J. Quant. Spectrosc. Radiat. Transfer, 2009, 110, 533–572 CrossRef CAS PubMed.
- C. Young, S.-S. Kim, Y. Luzinova, M. Weida, D. Arnone, E. Takeuchi, T. Day and B. Mizaikoff, Sens. Actuators, B, 2009, 140(1), 24–29 CrossRef CAS PubMed.
- K. Wörle, F. Seichter, A. Wilk, C. Armacost, T. Day, M. Godejohann, U. Wachter, J. Vogt, P. Radermacher and B. Mizaikoff, Anal. Chem., 2013, 8, 2697–2702 CrossRef PubMed.
| This journal is © The Royal Society of Chemistry 2014 |

