Structural characterization of glycerophospholipids by combinations of ozone- and collision-induced dissociation mass spectrometry: the next step towards “top-down” lipidomics†
Huong T.
Pham‡
a,
Alan T.
Maccarone
a,
Michael C.
Thomas§
a,
J. Larry
Campbell
b,
Todd W.
Mitchell
*c and
Stephen J.
Blanksby
*a
aARC Centre of Excellence for Free Radical Chemistry and Biotechnology, School of Chemistry, University of Wollongong, NSW, Australia. E-mail: blanksby@uow.edu.au; toddm@uow.edu.au
bAB SCIEX, Concord, Ontario, Canada
cSchool of Health Sciences, University of Wollongong, NSW, Australia
First published on 23rd October 2013
Abstract
The complete structural elucidation of complex lipids, including glycerophospholipids, using only mass spectrometry represents a major challenge to contemporary analytical technologies. Here, we demonstrate that product ions arising from the collision-induced dissociation (CID) of the [M + Na]+ adduct ions of phospholipids can be isolated and subjected to subsequent gas-phase ozonolysis – known as ozone-induced dissociation (OzID) – in a linear ion-trap mass spectrometer. The resulting CID/OzID experiment yields abundant product ions that are characteristic of the acyl substitution on the glycerol backbone (i.e., sn-position). This approach is shown to differentiate sn-positional isomers, such as the regioisomeric phosphatidylcholine pair of PC 16:0/18:1 and PC 18:1/16:0. Importantly, CID/OzID provides a sensitive diagnostic for the existence of an isomeric mixture in a given sample. This is of very high value for the analysis of tissue extracts since CID/OzID analyses can reveal changes in the relative abundance of isomeric constituents even within different tissues from the same animal. Finally, we demonstrate the ability to assign carbon–carbon double bond positions to individual acyl chains at specific backbone positions by adding subsequent CID and/or OzID steps to the workflow and that this can be achieved in a single step using a hybrid triple quadrupole-linear ion trap mass spectrometer. This unique approach represents the most complete and specific structural analysis of lipids by mass spectrometry demonstrated to date and is a significant step towards comprehensive top-down lipidomics.
Introduction
Glycerophospholipids play numerous important roles in cellular function. Most commonly, glycerophospholipids are primary constituents of cell membranes that act as semi-permeable barriers for all cells and organelles. They also act as signaling molecules or their precursors,1 and are intimately involved in membrane protein structure and function.2 The moniker of glycerophospholipid encompasses a broad range of structurally related compounds that differ based on the combination of various headgroups and fatty acids (FAs) esterified to a glycerol backbone. There are six common phospholipid headgroups, phosphatidic acid (PA), phosphatidylcholine (PC), phosphatidylethanolamine (PE), phosphatidylserine (PS), phosphatidylglycerol (PG), and phosphatidylinositol (PI),1 and numerous FAs that differ in carbon chain length as well as the double bond number, position and stereochemistry. The structures of these lipids, such as the type of polar headgroup or the presence of double bonds, are known to have pronounced effects on the physical properties and structural organization of cell membranes.3,4 For instance, the length and degree of unsaturation of lipid acyl constituents can determine the thickness of membrane bilayers.3 Furthermore, the alteration of the relative position of acyl chains on the glycerol backbone results in positional isomers (sn-regioisomerism). The relative position of the two esterified fatty acids is also important to the biological role of certain membrane lipids. Two classes of enzymes, phospholipase A1 (PLA1) and phospholipase A2 (PLA2), are involved in the hydrolysis of glycerophospholipids at the sn-1 and sn-2 positions, respectively.5 The actions of these enzymes result in the production of specific lipid mediators of cellular signaling, highlighting the importance of regulating sn-regioisomerism. Work over several decades has shown that sn-positional distribution in vivo varies with age, type and location of tissues in the body.6,7 For example, two isomers of phosphatidylcholine, PC 22:6/16:0 and PC 16:0/22:6, were both found to be abundant in mouse brain. In contrast, 22:6 was found almost exclusively at the sn-2 position, i.e. PC 16:0/22:6 in mouse heart and liver.6Modern mass spectrometry techniques allow us to delve much deeper into lipid molecular structure than other individual techniques and, as such, have become methods of choice in modern lipidomic analyses. Nevertheless, mass spectrometry is unable to discern many of the structural isomers commonly found among lipids. More specifically, isomerism arising from the sn-position and the double bond position, and stereochemistry about the double bond or the glycerol backbone are difficult, if not impossible, to resolve by mass spectrometry alone. Accordingly, a “bottom-up” approach involving numerous separation, degradation, and derivatization steps is required if one wishes to achieve a comprehensive structural analysis of lipids. This is a massive undertaking and has only been successfully demonstrated for the analysis of a small number of lipids,8 with the application to large-scale lipidomic studies being impractical. Moreover, the amount of sample required for such a bottom-up approach is often beyond that available in many biological studies. The development of a “top-down” approach utilising mass spectrometry only would overcome such impediments and is therefore highly desirable.
At present there are two top-down approaches that go some way to achieving this. The first is high-energy collision-induced dissociation (CID), operating in the keV range. The domain of now-antiquated sector instruments,9,10 high-energy CID, has encountered a renaissance with the recent development of commercial tandem time-of-flight (ToF-ToF) mass spectrometers.11,12 This technique produces specific ions that can identify the sn-position and the double bond position but does not allow the double bond position to be assigned to a specific FA at a specific sn-position. The second approach is multistage mass spectrometry (i.e., MSn, where n ≥ 3) that, in some cases, allows such details to be ascertained.13 A limitation of this technique is that, in most instances, product ions are not specific to the sn-position and as such assignments are made based on a ratio of product ion abundances. The ratios used in such structural assignments are based on the mass spectral behaviour of synthetic phospholipids that often contain contributions of more than one isomer due to complexities in controlling regioisomeric purity during synthesis.14 Product ion abundance ratios are also influenced by instrument type and experimental configuration and, as a result, the high likelihood of isomeric mixtures in naturally derived lipid extracts is often overlooked based on these data.15 Both of these techniques are simple to implement and can be extremely valuable approaches in cases where isomerism is low and the lipids of interest are of high abundance. The main limitation of both high-energy and multistage CID, however, is that their fragmentation is untargeted. That is, the initial precursor ion population is dissociated into numerous fragment channels, with the structurally diagnostic product ions most often being of low abundance.16 When a complex biological mixture containing several regioisomers and double bond positional isomers is analyzed using these approaches, the spectra can become complex and diagnostic ions, or changes in ion abundance ratios arising from low abundance isomers may go undetected. In such cases, the untargeted approaches lack the sensitivity to identify all isomers present.
Here, we describe a targeted top-down lipidomics approach that combines CID with ozone-induced dissociation (OzID)17 in specific combinations. This strategy resolves many of the limitations mentioned above and allows for the unambiguous assignment of FA double bond position(s) and sn-position in glycerophospholipids thus representing a major advance towards the goal of full lipid structure elucidation by mass spectrometry alone.
Experimental methods
Materials
Methanol, chloroform (HPLC grade) and sodium acetate (analytical grade) were purchased from APS Chemicals (Sydney, Australia). Industrial-grade compressed oxygen (99.5%) and ultrahigh-purity helium (99.999%) were obtained from BOC (Cringila, Australia). All glycerophospholipid standards, i.e., PC 16:0/18:1(9Z), PC 18:1(9Z)/16:0, PC 16:0/18:2(9Z,12Z), PA 16:0/18:1(9Z), PE 16:0/18:1(9Z), PG 16:0/18:1(9Z), PS 16:0/18:1(9Z) and soy bean PI 16:0/18:2(9Z,12Z) were purchased from Avanti Polar Lipids (Alabaster, Alabama, USA) and used without further purification. TG 16:0/18:1(9Z)/16:0 was purchased from Larodan Fine Chemical AB (Malmö, Sweden). Cow brain and cow kidney tissues were collected from the Wollondilly Abattoir (Picton, NSW, Australia).Lipid extraction
Sections from cow brain and kidney were homogenized in 2![[thin space (1/6-em)]](https://www.rsc.org/images/entities/char_2009.gif) :
:![[thin space (1/6-em)]](https://www.rsc.org/images/entities/char_2009.gif) 1 chloroform–methanol containing 0.01% butylated hydroxytoluene and total lipids were extracted as previously described.18 Lipid extracts were stored at −80 °C until analyzed. Sample solutions were prepared in methanol at concentrations between 5 and 10 μM of glycerophospholipids in the presence of 50 μM sodium acetate to aid the formation of sodium or acetate adducts.
1 chloroform–methanol containing 0.01% butylated hydroxytoluene and total lipids were extracted as previously described.18 Lipid extracts were stored at −80 °C until analyzed. Sample solutions were prepared in methanol at concentrations between 5 and 10 μM of glycerophospholipids in the presence of 50 μM sodium acetate to aid the formation of sodium or acetate adducts.
Mass spectrometry
Experiments were performed on two separate platforms each of which has been modified for OzID. The first was a modified linear ion-trap mass spectrometer (LTQ, Thermo Fisher Scientific, San Jose, CA, USA) described previously.17,19 For OzID experiments, an ozone–oxygen mixture was introduced into the flow of UHP helium via a gas-mixing manifold. Briefly, ozone was generated by an ozone generator (HC-30, Ozone Solutions, Sioux Center, Iowa, USA) and collected in a 10 mL plastic syringe. The ozone–oxygen mixture was introduced at a flow rate of 20–30 μL min−1 into the helium collision gas. The helium collision gas was supplied via a variable leak valve (Granville-Phillips, Boulder, CO) to maintain an ion gauge pressure of ca. 0.8 × 10⁻⁵ Torr. The lipids were ionized using electrospray ionization (ESI) under the following conditions: capillary voltage 45 V; ionization spray voltage 4 kV; capillary temperature 200 °C; tube lens voltage 180 V. Nitrogen gas served as the sheath gas, auxiliary gas and sweep gas and helium as the bath gas. CID spectra were typically obtained with normalized collision energy of 30–35 (arbitrary units). Combinations of CID and OzID were performed sequentially in the linear ion trap. For example, CID/OzID spectra were acquired by two sequential steps: (i) performing CID on the [M + Na]+ species using an isolation width of 3 Da and normalized collision energy of 30–35, (ii) subsequent isolation of a CID fragment ion with an increased activation time for OzID (typically 1–5 seconds) with normalized collision energy set to zero. Different combinations of CID energies and OzID reaction times were investigated by varying the selection of product ions and activation sequences. Typically, 50 scans were acquired and averaged to obtain mass spectra with satisfactory signal-to-noise ratios.[M + Na]+ ions have been selected for this workflow because they are more reactive towards ozone than [M + H]+ ions,20 and produce abundant [M + Na – 183]+ ions upon CID.21 In contrast, CID of [M + H]+ ions results in a diminishingly low abundance of [M + H – 183]+ ions.22
The second instrument employed was a hybrid triple quadrupole linear ion-trap mass spectrometer (QTRAP2000, AB SCIEX, Concord, ON, Canada) previously modified to incorporate ozone generated online by an ozone generator (Titan, Absolute Ozone, Alberta, Canada).23 Ions were generated by direct infusion ESI with nitrogen serving as the nebulizing gas. The following source conditions were used: 4.5 kV ion spray voltage, 120 V declustering potential, and 10 V for the entrance potential. Typical OzID experimental conditions utilized an oxygen flow rate through the generator of 250 mL min−1 with the ozone generator power output at 40% to obtain approximately 180 g Nm−3 of ozone (8.4% v/v) as measured immediately downstream of the generator using an ozone monitor (Mini-HiCon, IN USA, Norwood, MA, USA). The gas flow from the generator was split to direct the majority through an ozone destruct catalyst (IN USA, Norwood, MA, USA). The remainder passed through a variable leak valve (VSE Vacuum Technology, Lustenau, Austria) for regulated mixing of ozone (in oxygen) with the nitrogen collision gas supply prior to entering the collision cell (q2). CID/OzID spectra were acquired by mass-selecting precursor ions in the first quadrupole (Q1) and accelerating them into q2 with a collision energy of 30 eV. Ions were accumulated in q2 for 20 ms after which time they were trapped in the presence of ozone for 5 s. Product ions were then transferred to the linear ion trap (Q3) and cooled prior to mass analysis. Spectra are reported here as a summation of 10–50 scans. Further details regarding the implementation and application of OzID can be found in a recent review.24
Nomenclature
In general, we endeavor to conform to the recent recommendations for lipid nomenclature,25–27 while in some instances, we employ the traditional nomenclature “n − x” where “n” refers to the number of carbon atoms in the chain and subtracting “x” provides the location of the double bond, for example, PC 16:0/18:2 (9Z,12Z) is represented as PC16:0/18:2(n − 9,n − 6).28 This nomenclature is instructive in OzID analysis as the observed neutral losses are common to all lipids with double bonds in the same position relative to the highest numbered carbon on the alkyl chain.Results and discussion
CID analyses of synthetic phosphatidylcholines
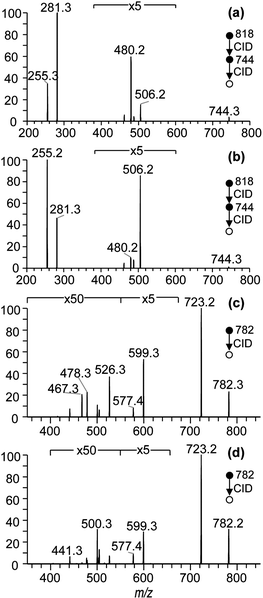
The level of sn-isomeric impurity, i.e., the percentage of the sn-positional isomer contained in commercially available synthetic PC standards has been reported to be around 10–15% based on both selective enzymatic digestion and mass spectrometry protocols.29,30 In the latter instance, MS3 fragmentation in negative ion mode was used to identify and quantify sn-regioisomerism in PC standards.30 This approach was employed here to estimate the isomeric impurity in two commercially obtained PC standards. Electrospray ionization of methanolic solutions of putative PC 16:0/18:1 and PC 18:1/16:0 samples gave rise to abundant [M + OAc]− anions at m/z 818. Mass-selection of these acetate adduct ions and application of CID resulted predominately in an [M – 15]− product ion at m/z 744 (data not shown). The product ions at m/z 744 were then isolated for subsequent MS3 fragmentation. The MS3 mass spectra resulting from the two sn-positional PC isomers are shown in Fig. 1(a) and (b) and the product ions seen at m/z 255 and 281 correspond to the acyl anions of 16:0 and 18:1, respectively. Ekroos et al. have previously demonstrated that the fatty acid ketene losses occur exclusively from the sn-2 position of PCs.30 Therefore, the ions formed at m/z 480 (i.e., 18:1 ketene loss) and m/z 506 (16:0 ketene loss) are assigned explicitly to PC 16:0/18:1 and PC 18:1/16:0, respectively. Therefore, the abundances of m/z 506 in Fig. 1(a) and m/z 480 in Fig. 1(b) represent the presence of the partner sn-positional isomer (i.e., the impurity) in each standard, as summarized in Table 1. The possible identification of regioisomerism in PC standards in positive-ion mode using alkali metal adduct ions was also examined. CID spectra of [M + Na]+ precursor ions found at m/z 782 for two PC isomers are shown in Fig. 1(c) and (d). The three major product ions observed at m/z 723, 599 and 577 in Fig. 1(c) and (d) correspond to partial or complete losses of the phosphocholine headgroup. Other minor fragment ions are assigned to losses of fatty acids (as either RCO2H or RCO2Na) from the precursor ion. For instance, product ions at m/z 526 and 500 correspond to the neutral loss of fatty acids [M + Na – 16:0]+ and [M + Na – 18:1]+, respectively, while the ions observed at m/z 504 and m/z 478 correspond to the neutral loss of the sodiated fatty acids. Product ions arising due to neutral loss of the 16:0 and 18:1 fatty acids from [M + Na – 59]+ were also observed at m/z 467 and 441, respectively. It is likely that the neutral losses of fatty acids from the precursor ions are sn-position dependent as analogous processes have been used for quantifying sn-regioisomerism in triacylglycerol lipids.31 Using the relative percentages of the characteristic ion pairs in both the positive- and negative-ion CID spectra, the presence of the partner isomer can be identified and the level of isomeric impurities can be estimated. These results are summarized in Table 1. Together, these data confirm that commercially obtained standards contain significant amounts of sn-isomeric impurity at approximately 21–23% for PC 16:0/18:1 and 10–16% for PC 18:1/16:0. While similar CID product ion abundances have been used as an indication of phospholipid substitution for some time, due care must be exercised. This is because the information-bearing product ions are often of low abundance (note the magnifications indicated in Fig. 1) while the abundance ratios themselves are dependent upon the headgroup structure,13,32 differences in acyl chain length and the degree of unsaturation;33 and can even vary between instruments and selected collision energies.15CID/OzID analysis of synthetic phosphatidylcholines
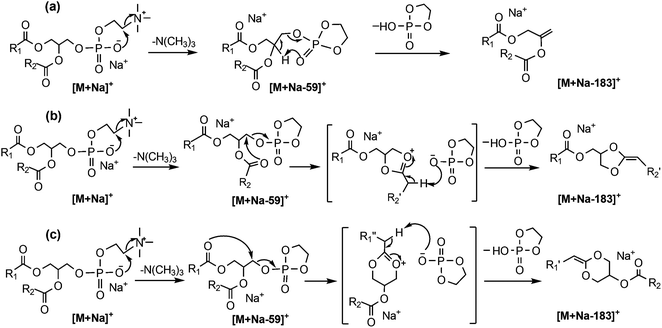
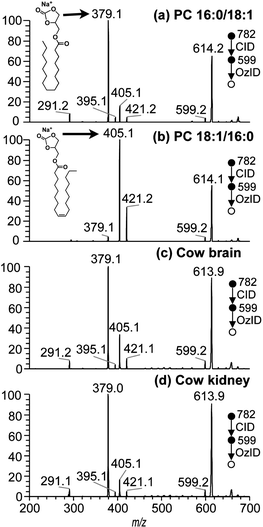
Given the drawbacks of the aforementioned CID-based methods, it is desirable to develop alternative approaches for PC regioisomer identification where information on the relative position of acyl substitution is carried by abundant product ions and is largely independent of other structural features. However, there are features within the CID mass spectra of PCs that can be used to advantage in an alternative workflow. For example, in addition to the product ions associated with the acyl chains, CID spectra of the [M + Na]+ ions of PCs yield product ions associated with the phosphocholine headgroup at m/z 723 and m/z 599 in substantially greater abundance (see Fig. 1(c) and (d)). The CID product ion at m/z 599 results from loss of the entire phosphocholine moiety (Scheme 1). Initially, an elimination mechanism was proposed for the production of this ion (Scheme 1a), where a backbone hydrogen is removed by the departing phosphocholine headgroup to form a new double bond on the glycerol backbone.21 Later, deuterium labeling experiments on PC lipids disproved this mechanism and indicated that the proton was instead lost from the acyl chains.22 Based on these findings, a substitution mechanism was proposed whereby the removal of an acyl α-hydrogen occurs from a five-membered ring intermediate (Scheme 1b), resulting in a new carbon–carbon double bond connecting the sn-2 fatty acyl chain to the backbone. This new double bond is an attractive target for ozone and would produce fragmentation indicative of the sn-2 acyl chain structure. However, there was no evidence to exclude the analogous process occurring via a six-membered ring intermediate (Scheme 1c) driven by the sn-1 substituent and introducing a new carbon–carbon double bond into the sn-1 fatty acid.Since OzID experiments can be conducted in an MSn capable ion-trap mass spectrometer, CID can be performed prior to OzID34,35 allowing the determination of double bond location in these CID fragment ions. Within the CID/OzID experiment, the m/z 599 ions were isolated and subjected to ozonolysis. The resulting CID/OzID spectra obtained from two synthetic sn-regioisomeric PC standards, i.e., PC 16:0/18:1 and PC 18:1/16:0, are shown in Fig. 2(a) and (b), respectively. It is noteworthy that the selected m/z 599 ion was found to react extremely efficiently with ozone as it is near-completely consumed after trapping for only 1 s. In comparison, conventional OzID spectra of sodiated PCs obtained on the same platform give product ions at only ∼5% relative abundance even after 10 s of trapping time.17 Significantly, the CID/OzID spectra also show a significant difference in major product ions depending upon the putative acyl chain position; for example, m/z 379 is the base peak in the spectrum shown in Fig. 2(a) while m/z 405 dominates in Fig. 2(b). The major product ion at m/z 379 in Fig. 2(a) represents a neutral loss of 220 Da and is assigned to the aldehyde ion arising from ozonolysis of an n − 17 double bond formed during CID of PC 16:0/18:1. Similarly, the m/z 405 product ion in Fig. 2(b) corresponds to a loss of 194 Da and is indicative of ozonolysis of an n − 15 double bond formed in the CID fragmentation of PC 18:1/16:0. Additional CID/OzID product ions are also observed at m/z 395 and 421 and are 16 Da heavier than their aldehyde counterparts (m/z 379 and 405, respectively) and are assigned to Criegee ions.17 The location of the newly formed n − 17 and n − 15 double bonds clearly implicates the 18:1 and 16:0 acyl chains, respectively, as derived from the OzID reaction products of the m/z 599 ions formed upon CID of the [M + Na]+ from PC 16:0/18:1 and PC 18:1/16:0. The striking difference between the CID/OzID spectra of each sample suggests this protocol could be used to discern the isomeric composition of a given PC sample.
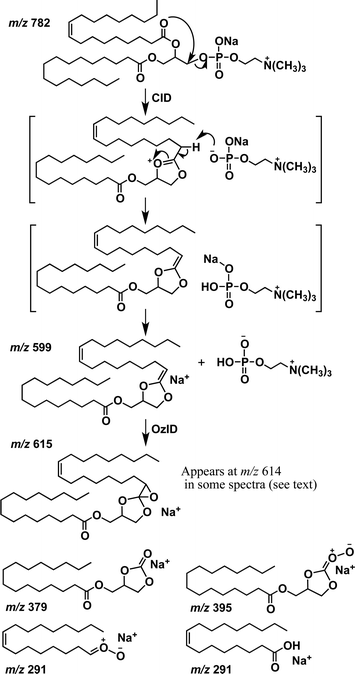
Other CID/OzID product ions present in low abundances in the mass spectra of synthetic PC standards, such as, m/z 405 and 421 in Fig. 2(a) and m/z 379 and 395 in Fig. 2(b), may arise from either (i) sn-isomeric impurity in each synthetic PC standard fragmenting via the five-membered ring pathway (Scheme 1b) or (ii) from the main sn-isomer via the six-membered ring pathway as shown in Scheme 1(c), where the sn-1 substituent is involved in the loss of the complete phosphocholine headgroup. Notably, the relative abundances of these minor fragment ions are similar to the levels of the sn-positional isomer impurities present in these samples established by CID alone (cf.Table 1). This suggests that the five-membered substitution mechanism shown in Scheme 1(b) occurs exclusively. The relatively fast reaction rates observed in CID/OzID (compared with conventional OzID) can be attributed to activation of the new double bond by the two vinylic oxygens. The mechanism for CID/OzID is illustrated in Scheme 2, demonstrating that selective ozonolysis of the nascent CID product ion of m/z 599 retains the sn-1 acyl chain exclusively on the glycerol backbone. Further support for assignment of the five-membered ring structure to the m/z 599 ion (cf.Scheme 2) was obtained from OzID analysis of the analogous CID product ion at m/z 599 from the sodiated triacylglycerol, TG 16:0/18:1/16:0. In the corresponding CID/OzID spectrum of this regio-pure standard, only product ions at m/z 379 and 395 were observed (see ESI Fig. S-1b†) demonstrating that the initial CID event (the 16:0 acyl chain loss) is driven exclusively by the adjacent 18:1 substituent (Scheme S-1†). This observation points to an identical 5-membered ring structure for the m/z 599 ion and explicitly excludes a CID-mechanism invoking a six-membered ring intermediate (cf.Scheme 1c).
Given that the major product ions observed in the CID/OzID spectra in Fig. 2(a) and (b) are diagnostic for a specific sn-positional PC isomer, they enable the rapid and sensitive characterization of both synthetic samples as isomeric mixtures. Qualitatively, the ratio of the two characteristic ion pairs arising in the CID/OzID spectra is consistent with the relative abundance of two sn-regioisomers determined from other tandem mass spectral approaches. That is, comparing the ion abundances of m/z 379 and 395 with those of m/z 405 and 421 in Fig. 2(a) and (b) suggests mixtures of regioisomeric impurities of 17% and 3% in synthetic standards of PC 16:0/18:1 and PC 18:1/16:0, respectively. Comparing these values with those derived from CID approaches (Table 1) shows good agreement for PC 16:0/18:1 and only a slight underestimation of the isomeric impurity for PC 18:1/16:0.
Application of CID/OzID to identify phospholipid regioisomers from biological samples
Analogous CID/OzID of the [M + Na]+ adduct ions of PC 34:1 detected in lipid extracts from bovine brain and kidney are shown in Fig. 2(c) and (d), respectively. The positive-ion ESI-MS spectra obtained from these extracts are provided in the ESI (Fig. S-2†) and demonstrate that these ions are the most abundant in both extracts. CID analysis of the [M + Na]+ cations in each extract (data not shown) reveals that the fatty acid composition is predominantly 16:0 and 18:1 in both biological samples. The OzID spectra in Fig. 2(c) and (d) reveal two characteristic pairs of ozonolysis product ions at m/z 379, 395 and m/z 405, 421. These ions were also observed as major product ions in the CID/OzID spectra of the synthetic standards, PC 16:0/18:1 and PC 18:1/16:0, respectively (Fig. 2(a) and (b)). The observation of both ion pairs in the CID/OzID spectra from the biological lipid extracts suggests that both sn-positional isomers are present in these samples. The abundance of the m/z 405 and 421 ions accounts for 35% of the diagnostic product ions (i.e., m/z 379, 395, 405 and 421) in the cow brain extract (Fig. 2(c)) while the analogous percentage calculated for cow kidney was 18% (Fig. 2(d)). These ion ratio differences observed between the bovine brain and kidney extracts were measured from samples obtained from different animals and were found to be highly reproducible (see Fig. 6). This suggests that the relative abundance of the two sn-positional isomers, PC 16:0/18:1 and PC 18:1/16:0, in the cow brain extract is clearly distinct from those in the kidney. This finding is consistent with prior work demonstrating the presence of both sn-positional PC isomers in a range of biological extracts30 and variability in the relative abundance of sn-positional isomers in different tissue types.6 While further work is required to benchmark the quantitative accuracy of CID/OzID fully, it is clear from these preliminary results that this is a fast and sensitive method for (i) detecting the presence of sn-positional isomers in a given sample, (ii) indicating the approximate proportions of each regioisomer, and (iii) highlighting changes in relative proportions between sample sets.CID/OzID analysis of other phospholipid classes
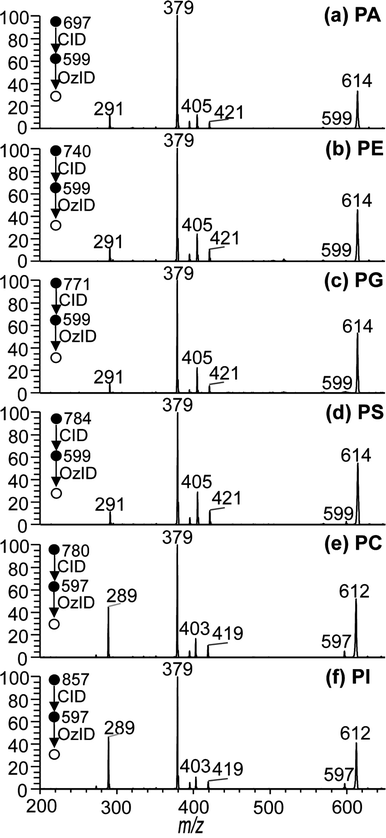
To examine the generality of the approach, CID/OzID experiments were conducted for lipids of other glycerophospholipid subclasses. The ESI mass spectra of methanolic solutions of PA, PE, PG, PS and PI lipids in the presence of sodium acetate were found to give rise to abundant [M + Na]+ ions that, upon CID, generated an abundant product ion resulting from the loss of the complete phospholipid headgroup (data not shown). Subsequent OzID of the targeted CID fragments produced the CID/OzID spectra shown in Fig. 3. Where the acyl chain compositions of the phospholipid are the same, the CID/OzID spectra revealed identical product ions to those observed for the PC standards discussed above. That is, the PA, PE, PG and PS samples, all having a putative 16:0/18:1 composition, yield the CID fragment ion m/z 599 upon loss of the headgroup; subsequent OzID of this ion provides product ions at m/z 379, 395, 405 and 421 (see Fig. 3(a)–(d), respectively) in abundances similar to that for synthetic PC 16:0/18:1 (Fig. 2(a)). In all four of these examples, the base peak at m/z 379 reflects that the dominant regioisomer bears the 18:1 acyl chain at the sn-2 position on the glycerol backbone, while the lesser abundant m/z 405 ions reveal the presence of a smaller proportion of the alternate 18:1/16:0 isomer in the samples. CID/OzID experiments were also performed on glycerophospholipids with different acyl chain composition. CID of the sodium adduct ions of synthetic standards labeled as PC 16:0/18:2 and PI 16:0/18:2 present in a soybean extract both resulted in formation of the m/z 597 product ions by neutral loss of the respective headgroups. Ozonolysis of the ion population at m/z 597 produced the spectra shown in Fig. 3(e) and (f). Here too, the OzID spectra are dominated by m/z 379, indicative of the selective removal of the 18:2 acyl chain from the sn-2 position consistent with the expected 16:0/18:2 substitution. Less abundant product ions at m/z 403 and 419 indicate that a small amount of alternative 18:2/16:0 regioisomer is likely present in both the PC and PI synthetic standards. Interestingly, an abundant product ion appears at m/z 289 in the CID/OzID spectra of both polyunsaturated phospholipids, while an analogous ion appears at m/z 291 for phospholipids with 16:0/18:1 composition (e.g., Fig. 2(a)–(d)). In both cases, the mass of the ion corresponds to that of the aldehyde formed from ozonolysis of the n − 17 double bond formed during CID when the 18-carbon chain is at sn-2 (see Schemes 2 and S-2†). The greater abundance of this signal for the 18:2-bearing phospholipids suggests a higher sodium affinity of the polyunsaturated chain. Indeed, where the sn-2 substituent is saturated, such as for PC 18:1/16:0, no equivalent ion is observed i.e., no equivalent aldehyde ion is observed at m/z 265 in Fig. 2(b). Regardless, this reaction channel does not diminish the analytical utility of the CID/OzID analysis. Taken together, the data presented in Fig. 3 indicate that the structural identification of sn-positional isomers by the CID/OzID method is independent of (i) the phospholipid headgroup class and (ii) fatty acid composition, thus allowing for the sensitive and selective analysis of sn-regioisomerism in most classes of glycerophospholipids. This consistency represents a significant advantage over existing approaches based solely on the relative abundance of CID generated ions.Explicit assignment of carbon–carbon double bond and sn-position
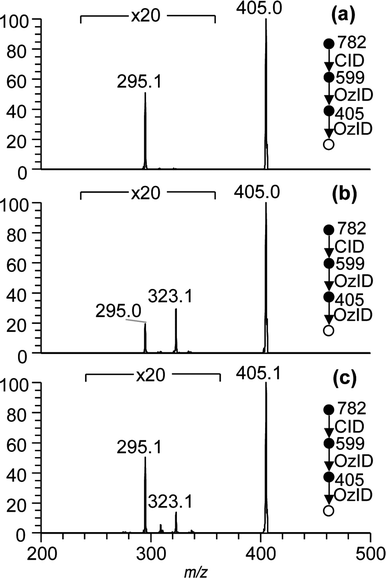
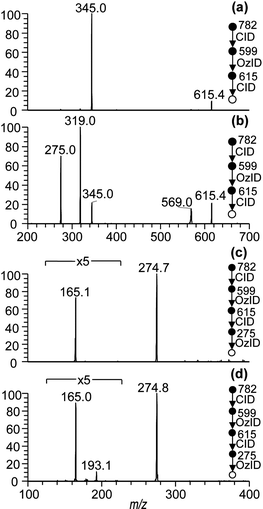
The CID/OzID experiments described above demonstrate that the five-membered ring substitution mechanism is dominant during CID fragmentation of sodium adduct ions of glycerophospholipids (Scheme 1b). The loss of the headgroup is driven by the sn-2 substituent, which is then selectively removed by subsequent ozonolysis leaving only the sn-1 substituent remaining on the glycerol backbone after the CID/OzID procedure (Scheme 2). When the FA at sn-1 is unsaturated, these characteristic ions can be subjected to further ozonolysis (i.e., OzID) to determine carbon–carbon double bond position(s) that are specific to the sn-1 FA. Fig. 4 shows examples of such CID/OzID2 spectra – formally an MS4 spectrum – obtained from a synthetic PC 18:1(n − 9)/16:0 standard and a PC 34:1 ion identified in the bovine brain and kidney extracts. These spectra correspond to ozonolysis of the m/z 405 ions present in the CID/OzID spectra shown in Fig. 2(b)–(d) and represent a selective analysis of the position of unsaturation in the 18:1 acyl chains located at the sn-1 position. Fig. 4(a) reveals one significant product ion at m/z 295 corresponding to a neutral loss of 110 Da and indicative of unsaturation at the n − 9 position and consistent with the expected PC 18:1(n − 9)/16:0 structural assignment. Analogous CID/OzID2 spectra from the biological extracts (Fig. 4(b) and (c)) also show product ions at m/z 295 (−110 Da) indicating an n − 9 double bond. In addition, ions at m/z 323 (−82 Da) point to the presence of n − 7 isomers. These results indicate that both PC 18:1(n − 9)/16:0 and PC 18:1(n − 7)/16:0 are present in the bovine brain and kidney. Significantly, the relative abundances of m/z 295 and m/z 323 ions shown in Fig. 4 differ between the brain and kidney extracts, suggesting a difference in the distribution of n − 9 and n − 7 double bond positional isomers within these tissues.Additional combinations of CID and OzID steps were investigated in an effort to assign the carbon–carbon double position in unsaturated acyl moieties explicitly at the sn-2 position. In so doing, we returned to the CID/OzID product ion observed at m/z 614 that had been noted in the spectra of all phospholipids with 16:0 and 18:1 acyl chains regardless of the relative position of substitution (see Fig. 2 and 3). The unusual broad structure and peak-fronting of this spectral feature suggest that this ion undergoes dissociation upon mass-selective ejection from the ion-trap and is thus likely to be unstable with respect to fragmentation.36 Another marker for the metastable nature of these ions is a shift in the apparent mass37 and this could be demonstrated here by isolating the m/z 614 product ion with a 10 Th isolation window and subjecting it to CID. Representative CID/OzID/CID spectra are shown in Fig. 5(a) and (b) and reveal a sharp peak at m/z 615 suggesting that upon activation, some part of this ion population rearranges to a more stable isomeric form. More importantly, this identifies the actual mass of the original CID/OzID product ions as m/z 615 not 614, which is consistent with oxygen addition (+16 Da) during ozonolysis. Interestingly, the CID/OzID/CID spectra of m/z 615 differ significantly depending on the predominant sn-substitution in the synthetic standard analyzed. For example, the base peak for PC 18:1/16:0 was observed at m/z 345 (Fig. 5(a)), while product ions at m/z 319 and 275 are more abundant for PC 16:0/18:1 (Fig. 5(b)). The m/z 275 peak in the latter spectrum can be assigned to a sodium adduct ion of a 17-carbon monounsaturated aldehyde and, importantly, is selectively liberated from the 18:1 chain only when it is at the sn-2 position (see ESI, Scheme S-3†). As a result, subjecting this ion to further ozonolysis should yield the position(s) of unsaturation specific to that substitution. Spectra resulting from this MS5 sequence, namely CID/OzID/CID/OzID or (CID/OzID)2, are shown in Fig. 5(c) and (d). Fig. 5(c) was obtained from the PC 16:0/18:1(n − 9) synthetic standard and consistent with this, only a characteristic −110 Da neutral loss is observed. In contrast, the analogous spectrum generated from a cow brain extract shows two major ozonolysis product ions at m/z 165 and m/z 193, diagnostic of both n − 9 (−110 Da) and n − 7 (−82 Da) double bonds. These data suggest that the PC(16:0/18:1) present in this extract is made up of both PC 16:0/18:1(n − 9) and PC 16:0/18:1(n − 7) isomers.
Unlike the CID/OzID experiment, the combination CID/OzID2 and (CID/OzID)2 workflows locate both the original (i.e., existent prior to CID) and CID-derived carbon–carbon double bonds and thus, longer reaction times of 10 s were used. Despite the longer acquisition times, these experiments elucidate detailed structural information of the isomers present within complex mixtures that are not accessible by other technologies and can reveal relative changes in the regioisomer populations. Comparison of the abundance of characteristic product ions in all three MSn combination experiments performed on the m/z 782 precursor ions across replicate extracts from bovine brain and kidney tissues is presented in Fig. 6. This figure reveals that while PC 16:0/18:1(n − 9) is the major isomer in both tissues as expected, it is not as dominant in brain (∼60%) as in kidney (∼72%). It is also interesting to note that this difference corresponds to the relatively high proportion of PC 18:1(n − 7)/16:0 in the cow brain extract, where it is approximately 6 times more abundant than in the cow kidney. It should be noted that this figure shows relative ion abundances and that the reactivity of different double bond positions is not identical,23 meaning that these representations are indicative of changes in isomer populations but should not be considered absolutely quantitative. Nevertheless, the difference between tissues is clear and obtaining this level of information from lipids in such a complex pool using traditional techniques has never previously been demonstrated.
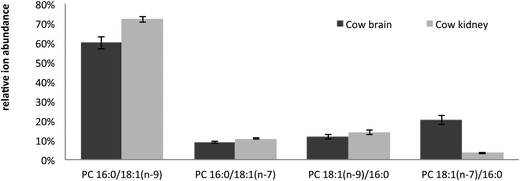 | ||
| Fig. 6 Plot of the relative abundance of the four PC 34:1 isomers identified in cow brain and cow kidney lipid extracts. The relative proportion of PC 18:1/16:0 to PC 16:0/18:1 was calculated as the abundance (area under the peak, Am/z) of [A405 + A421]/[A405 + A421 + A379 + A395] obtained from CID/OzID spectra (cf.Fig. 2). This number was then multiplied by the abundance of A323/[A323 + A295] in CID/OzID2 spectra to determine the relative proportions of PC 18:1(n − 7)/16:0 and PC 18:1(n − 9)/16:0 (cf.Fig. 4). To determine the relative proportions of PC 16:0/18:1(n − 7) and PC 16:0/18:1(n − 9) the relative abundance of PC 16:0/18:1 was multiplied by A193/[A193 + A165] in (CID/OzID)2 spectra (cf.Fig. 5). Mean and standard deviations are shown for triplicate measurements of two samples of cow brain and five samples of cow kidney extracts. | ||
Single stage acquisition of combined CID/OzID spectra
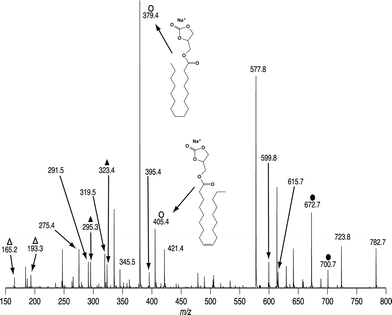
All experiments previously described were performed step-wise on a linear ion trap instrument (LTQ), however all the diagnostic fragments obtained in these MSn experiments can be obtained in a single scan using a hybrid triple quadrupole-linear ion trap mass spectrometer (QTRAP). On such an instrument mass-selected ions can be accelerated towards the collision cell that contains both nitrogen (i.e., an inert CID target gas) and ozone (see the methods section) producing ions from both CID and OzID processes. An example of such a spectrum obtained from [PC 34:1 + Na]+ (m/z 782.7) mass selected from a cow brain lipid extract is shown in Fig. 7. Typical primary CID ions are seen at m/z 723, 599 and 577 and confirm the phosphocholine head group. The ions labeled with closed circles are OzID products from the [M + Na]+ ion and indicate the presence of both n − 9 (m/z 672) and n − 7 (m/z 700) double bonds. Importantly all ions previously identified as arising from CID/OzID (open circles), CID/OzID2 (closed triangles) and (CID/OzID)2 (open triangles) processes are also present in this spectrum and confirm the presence of PC 16:0/18:1(n − 9), PC 16:0/18:1(n − 7), PC 18:1(n − 9)/16:0 and PC 18:1(n − 7)/16:0 in the cow brain extract.Conclusions
By performing OzID on selected product ions from CID of phospholipid [M + Na]+ ions, we have discovered a powerful method for the determination of the relative position of acyl chains on the glycerol backbone. Importantly, CID/OzID spectra can rapidly identify the presence of two sn-positional isomers for all six common glycerophospholipid classes from abundant and predictable marker ions that are unaffected by changes in the headgroup or acyl chain composition. The activated double bond present in the targeted CID product ion allows reaction times to be substantially reduced over conventional OzID analysis. The spectra presented here utilized a 1 s reaction time, which results in complete quenching of the selected precursor (e.g., m/z 599 abundance in Fig. 2). If desirable, further reduction in reaction time could be achieved without significantly diminishing the signal-to-noise ratio of the diagnostic marker ions. Thus, acquisition times compatible with liquid chromatography time scales or even direct surface sampling methods are conceivable. Moreover, the results reported herein are consistent with the mechanistic CID proposals of Hsu and Turk (Scheme 1(b) and (c))22 and further indicate that only the ester at the sn-2 position drives substitution of the phosphate (i.e., Scheme 1b only). In such a manner one could conceive of future applications of OzID in interrogating the structure of CID product ions to resolve questions surrounding competing mechanisms for unimolecular dissociation (e.g., SN2 versus E2 reactions).Alternative combinations of CID and OzID allowed for identification of (i) the fatty acid position on the glycerol backbone and (ii) the correlation between double bond position(s) and sn-position. The data obtained for complex extracts from two bovine tissues demonstrated that PC 34:1 was present as a mixture of at least four isomers with direct evidence for PC 16:0/18:1(n − 9), PC 16:0/18:1(n − 7), PC 18:1(n − 9)/16:0 and PC 18:1(n − 7)/16:0. All of this information may also be obtained in a single, combined CID/OzID spectrum on a hybrid triple quadrupole-linear ion trap mass spectrometer. The existence of such structural variation within the ion population at a single m/z would be difficult, if not impossible to elucidate by other approaches. Further variation arising from stereochemistry about the carbon–carbon double bond (i.e., cis and trans isomers) is also possible but cannot currently be resolved by our approach.
Fig. 6 provides direct evidence for the modulation of the relative proportions of phospholipid isomers in different tissue types and is consistent with our recent demonstration of variation in isomer populations in triacylglycerols from very low-density lipoprotein extracted from different patient groups.38 The biological implications of such modulation are, as yet, unknown but suggest that superficial assignment of lipid structure might conceal subtle but important dynamics within the lipidome. The CID/OzID methods presented represent a major improvement in our ability to obtain complete structural assignment of lipids by mass spectrometry alone and are a significant step towards true top-down lipidomics.
Acknowledgements
H.T.P. was supported by matching scholarship from the Australian Research Council Discovery Program (DP0986628) and the University of Wollongong. M.C.T. is grateful for an Australian Postgraduate Award and T.W.M. is an Australian Research Council Future Fellow (FT110100249). S.J.B. and T.W.M. acknowledge project funding from the Australian Research Council and AB SCIEX (Concord, Ontario, Canada) through the Linkage Program (LP110200648). J.L.C. acknowledges support from Drs Gary Impey, Yves Le Blanc, Eva Duchoslav, and Jim Hager. We thank Dr Jessica Hughes (UOW) for provision of the bovine extracts used in this study.References
- W. Dowhan, M. Bogdanov and E. Mileykovskaya, in Biochemistry of Lipids, Lipoproteins and Membranes, ed. E. V. Dennis and E. V. Jean, Elsevier, San Diego, 2008, 5th edn, pp. 1–37 Search PubMed.
- S. H. J. Brown, T. W. Mitchell, A. J. Oakley, H. Pham and S. J. Blanksby, J. Am. Soc. Mass Spectrom., 2012, 23, 1441–1449 CrossRef CAS PubMed.
- P. A. Janmey and P. K. J. Kinnunen, Trends Cell Biol., 2006, 16, 538–546 CrossRef CAS PubMed.
- H. Martinez-Seara, T. Róg, M. Pasenkiewicz-Gierula, I. Vattulainen, M. Karttunen and R. Reigada, Biophys. J., 2008, 95, 3295–3305 CrossRef CAS PubMed.
- D. C. Wilton, in Biochemistry of Lipids, Lipoproteins and Membranes, ed. E. V. Dennis and E. V. Jean, Elsevier, San Diego, 2008, 5th edn, ch. 11, p. 305 Search PubMed.
- H. Nakanishi, Y. Iida, T. Shimizu and R. Taguchi, J. Biochem., 2010, 147, 245–256 CrossRef CAS PubMed.
- W. Stern and M. E. Pullman, J. Biol. Chem., 1978, 253, 9 Search PubMed.
- K. Shinzawa-Itoh, H. Aoyama, K. Muramoto, H. Terada, T. Kurauchi, Y. Tadehara, A. Yamasaki, T. Sugimura, S. Kurono, K. Tsujimoto, T. Mizushima, E. Yamashita, T. Tsukihara and S. Yoshikawa, EMBO J., 2007, 26, 1713–1725 CrossRef CAS PubMed.
- N. J. Jensen, K. B. Tomer and M. L. Gross, Lipids, 1986, 21, 580–588 CrossRef CAS.
- N. J. Jensen, K. B. Tomer and M. L. Gross, Lipids, 1987, 22, 480–489 CrossRef CAS.
- E. Pittenauer and G. Allmaier, J. Am. Soc. Mass Spectrom., 2009, 20, 1037–1047 CrossRef CAS PubMed.
- A. Kubo, T. Satoh, Y. Itoh, M. Hashimoto, J. Tamura and R. Cody, J. Am. Soc. Mass Spectrom., 2013, 24, 684–689 CrossRef CAS PubMed.
- F. F. Hsu and J. Turk, J. Chromatogr., B: Anal. Technol. Biomed. Life Sci., 2009, 877, 2673–2695 CrossRef CAS PubMed.
- A. Plückthun and E. A. Dennis, Biochemistry, 1982, 21, 1743–1750 CrossRef.
- W. Hou, H. Zhou, M. B. Khalil, D. Seebun, S. A. L. Bennett and D. Figeys, Rapid Commun. Mass Spectrom., 2011, 25, 205–217 CrossRef CAS PubMed.
- F.-F. Hsu and J. Turk, J. Am. Soc. Mass Spectrom., 2008, 19, 1681–1691 CrossRef CAS PubMed.
- M. C. Thomas, T. W. Mitchell, D. G. Harman, J. M. Deeley, J. R. Nealon and S. J. Blanksby, Anal. Chem., 2008, 80, 303–311 CrossRef CAS PubMed.
- J. R. Nealon, S. J. Blanksby, T. W. Mitchell and P. L. Else, J. Exp. Biol., 2008, 211, 3195–3204 CrossRef CAS PubMed.
- M. C. Thomas, T. W. Mitchell and S. J. Blanksby, in Lipidomics: Methods and Protocols, ed. D. Armstrong, Springer, Totowa, 2009, ch. 21, pp. 413–441 Search PubMed.
- H. Pham, A. Maccarone, J. L. Campbell, T. Mitchell and S. Blanksby, J. Am. Soc. Mass Spectrom., 2013, 24, 286–296 CrossRef CAS PubMed.
- P. Domingues, M. R. M. Domingues, F. M. L. Amado and A. J. Ferrer-Correia, Rapid Commun. Mass Spectrom., 2001, 15, 799–804 CrossRef CAS PubMed.
- F. F. Hsu and J. Turk, J. Am. Soc. Mass Spectrom., 2003, 14, 352–363 CrossRef CAS.
- B. L. J. Poad, H. T. Pham, M. C. Thomas, J. R. Nealon, J. L. Campbell, T. W. Mitchell and S. J. Blanksby, J. Am. Soc. Mass Spectrom., 2010, 21, 1989–1999 CrossRef CAS PubMed.
- S. H. J. Brown, T. W. Mitchell and S. J. Blanksby, Biochim. Biophys. Acta, 2011, 1811, 807–817 CrossRef CAS PubMed.
- E. Fahy, W. Shaw, D. W. Russell, M. S. VanNieuwenhze, T. Shimizu, G. van Meer, R. C. Murphy, J. A. H. Merrill, C. K. Glass, C. R. H. Raetz, S. H. White, J. L. Witztum, F. Spener, E. A. Dennis, S. Subramaniam, H. A. Brown and Y. Seyama, J. Lipid Res., 2005, 46, 839–861 CrossRef CAS PubMed.
- E. Fahy, S. Subramaniam, R. C. Murphy, M. Nishijima, C. R. H. Raetz, T. Shimizu, F. Spener, G. van Meer, M. J. O. Wakelam and E. A. Dennis, J. Lipid Res., 2009, 50, S9–S14 CrossRef PubMed.
- G. Liebisch, J. A. Vizcaíno, H. Köfeler, M. Trötzmüller, W. J. Griffiths, G. Schmitz, F. Spener and M. J. O. Wakelam, J. Lipid Res., 2013, 54, 1523–1530 CrossRef CAS PubMed.
- Hoffmann-Ostenhof, W. E. Cohn, A. E. Braunstein, H. B. F. Dixon, B. L. Horecker, W. B. Jakoby, P. Karlson, W. Klyne, C. Liebecq and E. C. Webb, Eur. J. Biochem., 1977, 79, 11–21 CrossRef.
- E. A. A. M. Vernooij, J. F. H. M. Brouwers, J. J. Kettenes-Van den Bosch and D. J. A. Crommelin, J. Sep. Sci., 2002, 25, 285–289 CrossRef CAS.
- K. Ekroos, C. S. Ejsing, U. Bahr, M. Karas, K. Simons and A. Shevchenko, J. Lipid Res., 2003, 44, 2181–2192 CrossRef CAS PubMed.
- L. C. Herrera, M. A. Potvin and J. E. Melanson, Rapid Commun. Mass Spectrom., 2010, 24, 2745–2752 CrossRef CAS PubMed.
- R. C. Murphy and P. H. Axelsen, Mass Spectrom. Rev., 2011, 30, 579–599 CrossRef CAS PubMed.
- E. Hvattum, G. Hagelin and Å. Larsen, Rapid Commun. Mass Spectrom., 1998, 12, 1405–1409 CrossRef CAS.
- J. M. Deeley, M. C. Thomas, R. J. W. Truscott, T. W. Mitchell and S. J. Blanksby, Anal. Chem., 2009, 81, 1920–1930 CrossRef CAS PubMed.
- T. W. Mitchell, H. T. Pham, M. C. Thomas and S. J. Blanksby, J. Chromatogr., B: Anal. Technol. Biomed. Life Sci., 2009, 877, 2722–2735 CrossRef CAS PubMed.
- J. E. McClellan, J. P. Murphy, J. J. Mulholland and R. A. Yost, Anal. Chem., 2002, 74, 402–412 CrossRef CAS.
- J. P. Murphy III and R. A. Yost, Rapid Commun. Mass Spectrom., 2000, 14, 270–273 CrossRef.
- M. Ståhlman, H. T. Pham, M. Adiels, T. W. Mitchell, S. J. Blanksby, B. Fagerberg, K. Ekroos and J. Borén, Diabetologia, 2012, 55, 1156–1166 CrossRef PubMed.
Footnotes |
| † Electronic supplementary information (ESI) available: Additional mass spectra and reaction schemes are provided. See DOI: 10.1039/c3an01712e |
| ‡ Department of Chemistry, University of California, Riverside, CA, USA. |
| § Independent Marine Biochemical Research, Dunwich, Queensland, Australia. |
| This journal is © The Royal Society of Chemistry 2014 |

