A graphene-enhanced molecular beacon for homogeneous DNA detection
Fan
Li
a,
Yan
Huang
b,
Qing
Yang
a,
Zentao
Zhong
b,
Di
Li
a,
Lihua
Wang
*a,
Shiping
Song
a and
Chunhai
Fan
*a
aLaboratory of Physical Biology, Shanghai Institute of Applied Physics, Chinese Academy of Sciences, Shanghai, 201800, China. E-mail: fchh@sinap.ac.cn; wanglihua@sinap.ac.cn
bNanjing Agricultural University, Nanjing, 213017, Jiangsu Province, China
First published on 11th May 2010
Abstract
In this work, we report the design of a novel graphene-based molecular beacon (MB) that could sensitively and selectively detect specific DNA sequences. The ability of water-soluble graphene oxide (GO) to differentiated hairpin and dsDNA offered a new approach to detect DNA. We found that the background fluorescence of MB was significantly suppressed in the presence of GO, which increased the signal-to-background ratio, hence the sensitivity. Moreover, the single-mismatch differentiation ability of hairpin DNA was maintained, leading to high selectivity of this new method.
Introduction
Biomolecular detection plays an important role in molecular diagnostics, industrial and environmental monitoring etc.,1,2 which has attracted significant interest to develop rapid, simple, sensitive and selective biosensors for proteins, nucleic acids and small molecules.3–7 Fluorogenic oligonucleotide probes are often used in the homogeneous detection of target molecules due to their operation convenience, rapid binding kinetics and high robustness. A probe containing a fluorophore–quencher pair is often designed to form a Förster resonance energy transfer (FRET) pair that can be coupled with DNA hybridization events (e.g. via stem-loop structures in fluorescent molecular beacons). Oligonucleotide probes such as Taqman probes,8 protease probes,9 and molecular beacons (MBs)4,10,11 have attracted great attention in molecular biological studies and bioanalysis.Molecular beacons (MBs) are elaborately designed DNA hairpin structures which are dual-labelled by a fluorophore (e.g. FAM) and a quencher (e.g. Dabcyl) at the two opposite ends. The target DNA molecule opens the stem-loop structure that separates the fluorophore–quencher pair, leading to the fluorescence enhancement of the probe. Compared with linear probes, MBs provide new opportunities to detect DNA targets with high selectivity due to their inherent structural constraint.12–14 Up to now MBs have been widely applied in genetic screening,4,15–17 biosensor design,18,19 biochip construction,18,20,21 detection of single-nucleotide polymorphisms16,22–24 and mRNA monitoring in living cells.25–29 Despite such rapid progress, MBs remain to be improved in many facets including sensitivity and stability improvement.25
Recently, several kinds of nanomaterials have been employed to serve as either quenchers or fluorophores. It was reported that gold nanoparticles (AuNPs) and single walled carbon nanotubes (SWNTs) were highly efficient nano-quenchers that could increase the sensitivity of MBs.30–34 Very recently, graphene was reported as a super-quencher with a long-range nanoscale energy transfer property, and was used to detect DNA, proteins and other small molecules35,36 Graphene is a one-atom-thick two-dimensional (2D) nanomaterial with extraordinary electronic, thermal and mechanical properties,37,38 and is one of the most important nanomaterials and is widely used in nanoelectronics,39,40 nanocomposites,41–45 as well as bioanalysis.46–48 We recently studied, systematically, the interaction between GO and different DNA structures via theoretical simulation and experiment performance, and developed a convenient and versatile strategy for multi-colour fluorescent DNA analysis.30 We found that GO could bind and quench dye-labelled ssDNA probe; and the formation of dsDNA by hybridization with target DNA led to the release of the probe from GO and then the fluorescence was recovered.35 By using the mix-and-detect assay format, the GO-based sensing platform offered a very simple and sensitive method for various kinds of analytes. In this work, we further studied the interactions between GO and MBs and aimed to develop an enhanced MB with improved performance (Scheme 1).
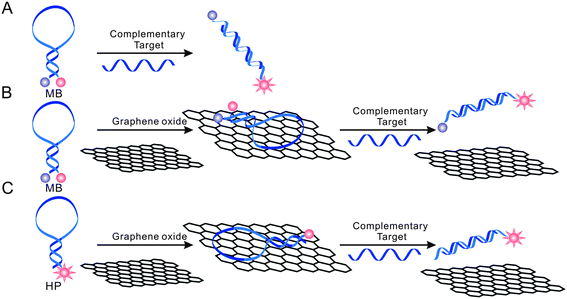 | ||
| Scheme 1 Schematic presentation of nano-MBs with GO-enhanced quenching efficiency. The hairpin-structured DNA has stronger infinity with GO than dsDNA. | ||
Results and discussion
Discrimination of hairpin structure and dsDNA by GO
Earlier studies have shown that GO could bind dye-tagged ssDNA and quench its fluorescence with high efficiency,35 we further testified that GO could differentiate ssDNA, dsDNA and other dsDNA structures due to their different affinity with GO,36 which led to the different quenching efficiency and various fluorescence signals. The ssDNA molecule could be stably adsorbed by the GO due to the π-stacking interaction between the ring of nucleobases and the hexagonal cells of the graphene, while dsDNA departed from GO because nucleobases were shielded inside the phosphate backbone. Therefore, the unpaired nucleobases play a dominant role in their adsorption to the GO surface. For MBs probes with stem-loop regions and target-induced partial dsDNA structures, both random unpaired bases and rigid paired bases coexisted, which raised a question whether GO could discriminate MB from dsDNA. We tested 20 nM dye-tagged hairpin structure (Table 1, sequence 1) with certain amounts of GO first. As shown in Fig. 1, the fluorescence of 1 was quenched with 98% efficiency, which implied Oligo 1 tightly binding on the surface of GO, and GO served as a super-quencher of dye-tagged hairpin structures.| Type | Sequences |
|---|---|
| a Hairpin-structured probe. b Molecular beacon. c Perfectly complementary target. d Single-base-mismatched target. | |
| FAM-labeled HP (1)b | 5′-FAM-CGC TCT GGT GTG GTT GGG CTG AGC G -3′ |
| FAM-labeled MB (2)a | 5′-FAM-CGC TCT GGT GTG GTT GGG CTG AGC G-TAMRA-3′ |
| ssDNA (3)c | 5′-AGC CCA ACC ACA CCA-3′ |
| sm-ssDNA-1 (4)d | 5′-AGC CCA ACG ACA CCA-3′ |
| sm-ssDNA-2 (5)d | 5′-AGC CCA ACA ACA CCA-3′ |
| sm-ssDNA-3 (6)d | 5′-AGC CCA ACT ACA CCA-3′ |
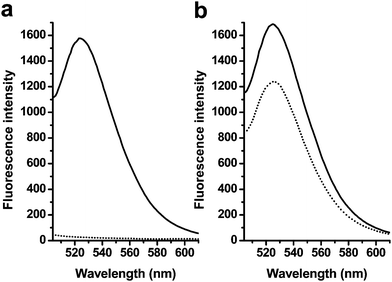 | ||
| Fig. 1 Changes in the fluorescence emissions of 1 in the phosphate buffer caused by GO and/or the ssDNA target 3. (a) Fluorescence emission spectra of solutions of 1 in the absence (solid lines) and presence (dotted lines) of GO, (b) Fluorescence emission spectra of dsDNA (1/3 hybrid) in the absence (solid lines) and the presence (dotted lines) of GO. The concentrations of 1 were 20 nM, and the excitation wavelength was 494 nm. | ||
Also of note, earlier studies have shown that GO performed as a super-quencher for dyes by both theoretical calculation49,50 and experiments.36 The organic fluorescent dyes (e.g. FAM, ROX, Cy5) can be efficiently quenched due to their strong hydrophobic adsorption at the GO surface. In our study of GO with fluorophores and dye-tagged linear ssDNA, we found that their fluorescence was nearly completely quenched by GO because of the strong hydrophobic interaction and tight binding of ssDNA with GO. Here, in our experiment, 20 nM of 2 was completely quenched by 2.5 μg mL−1 of GO, which suggested tight binding of the hairpin structures to the surface of GO and the fluorescence energy of the dye was efficiently transferred to GO.
Upon the addition of target 3, the complementary sequence to the loop region of 2, DNA 2 hybridized with 3 and changed from a hairpin structure to dsDNA with 6 unpaired bases at the 5′ and 3′ ends. The interaction of GO with this dsDNA structure was studied by monitoring their fluorescence spectrum. Fig. 1b shows that only about 27% of the partial dsDNA was quenched by using the same amounts of GO, which is much lower than ssDNA (98%). This dramatic fluorescence difference arose from the efficient differentiation ability of GO between them. As is known, the GO/DNA interaction mainly depends on the freedom nucleobases in DNA structures, so the valuation of GO's differentiation ability of hairpin and dsDNA should fully considering the single base pair in both DNA structures. By analyzing the structure change of probe 2 after hybridization with target 3, the number of paired bases increased from 6 to 15, while unpaired bases from 15 to 12. The ratio of Nunpaired bases/(Nunpaired bases + Nbase pair) was introduced to definite the structure change, and the hybridization led to the ratio change from 71.4% to 44.4%, which largely contributed to the differentiation ability of GO and the fluorescence quenching efficiency from 98% to 27%. However, from our earlier studies, the linear probe with 17 bases hybridized with 47mer sequences led to 24% of fluorescence recovery, which was lower than dsDNA led by a hybridization of 2 and 3 (73% of recovery). So the specific stem-loop structure was another important factor that contributed to the high affinity to GO. The hairpin structure is well known to offer much higher thermostability than a linear sequence, and the continuous freedom loop bases bind efficiently on the surface of GO.13,51 Here, we can conclude that GO possesses a high fluorescence quenching ability as well as different affinities toward hairpin structures and dsDNA.
Importantly, we found that GO could significantly reduce the background fluorescence of MB (Table 1, sequence 2) that arose from incompletely quenched FAM by Dabcyl.52 As demonstrated in Fig. 2a, in the absence of a target, the background fluorescence signals of 2 in the phosphate buffer decreased from 50 to 20 upon addition of GO solution. In the presence of a target, the fluorescence quenching is also observed (Fig. 2b), indicating the GO could interaction with dsDNA structure and adsorb them. This phenomenon was due to the fact that ssDNA and dsDNA showed different kinetics and absorption ability to GO.36 We further evaluated the influence of GO to the detection by analyzing the signal-to-background ratio (S/B), defined as S/B = (Fhybrid − Fbuffer)/(Fprobe − Fbuffer), where Fprobe, Fbuffer and Fhybrid are the fluorescence intensities of the probe without target, the plain buffer solution, and the probe-target hybrid, respectively. As shown in Fig. 2c, there was an increase in S/B because of the decreased background signals of the 2. In the absence of GO, the fluorescence intensity of 2 was increased and the S/B generated by the 6-fold excess of 3 was 25.1 for 2. The stronger background fluorescence from 2 led to smaller S/B compared with the results of the MB assay. In contrast, the presence of GO reduced the background signals and thus led to large S/B. For example, the S/B for 2 generated by the 6-fold excess of 3 in the presence of GO were 53.7, which is a significant improvement compared to that in the absence of GO. This comparison clearly demonstrates that the GO greatly improved the S/Bs and, consequently, the sensitivity of the fluorogenic MBs.
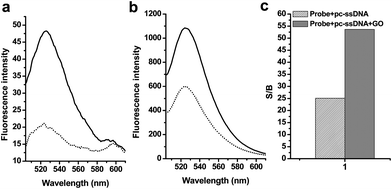 | ||
| Fig. 2 Changes in the fluorescence emissions of 2 in the phosphate buffer caused by graphene oxides and/or the ssDNA target 3. (a) Fluorescence emission spectra of solutions of 2 in the absence (solid lines) and presence (dotted lines) of GO, (b) Fluorescence emission spectra of solutions 2 containing a 6-fold excess of 3 in the absence (solid lines) and the presence (dotted lines) of GO. The concentrations of 2 were 20 nM, and the excitation wavelength was 494 nm. (c) Comparisons of the signal-to-background ratio (S/B) of the fluorescent oligonucleotides generated by a 6-fold excess of the pc-ssDNA target 3 in the absence (dense bars) and presence (grey bars) of GO. The concentrations of 2 were 20 nM, and the excitation and emission wavelengths were 494 and 524 nm, respectively. | ||
Fig. 3 shows the typical fluorescence emission response of 2-GO to increasing concentrations of 3. A dramatic increase in the FAM fluorescence intensity was observed as the DNA concentration was increased from 1.0 to 120 nM. The detection limit was 1.0 nM (estimated from 3 times the standard deviation in the blank solution), which is 20-fold lower than that of 2. The sensitivity could be improved to 0.1 nM by tuning the probe concentration to 5 nM, and the highest sensitivity will be obtained by adjustment of the MB probe to be lowest detection of the fluorometer. These results suggest that the proposed approach is appropriate for sensitive quantification of nucleic acids.
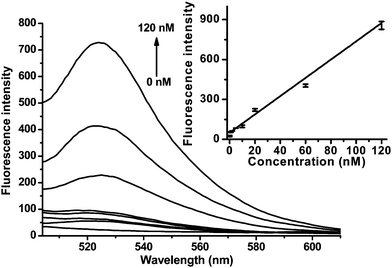 | ||
| Fig. 3 Fluorescence emission spectra of 2-GO (20 nM, λex = 494 nm) in the presence of different concentrations of 3. Inset: the fluorescence intensity plotted against the concentration of 3. | ||
DNA detection specificity
MBs can recognize target sequences with high specificity due to the presence of stems. With this performance, the 2-GO complex might show similar ability to discriminate the perfect target from the mismatched one.The ssDNA target 3 and the sm-ssDNA target 4, 5 and 6 were used to compare the DNA detection specificities of 2-GO. Fig. 4 (right) displays fluorescence emission spectra of 2 (20 nM) in the presence of 3 or 5, 6, 7 (40 nM). Both targets increased the fluorescence emission of 2, and the fluorescence enhancement by the sm target 4 was 68–73% of that by the pc target 3. For 2 (Fig. 4 left), the enhancement by 4 was only 65–67% of that by 3. These results revealed the ability of 2-GO to detect a single-base mismatch. We further tuned the probe concentration to 5 nM as well as usage of GO and analyzed 1 nM of the single-base mismatch DNA (smDNA1). Moreover, our study showed that the addition of non-complementary DNA with the same concentration had little effect on the fluorescence of 2-GO, confirming the high specificity of the hairpin structure.
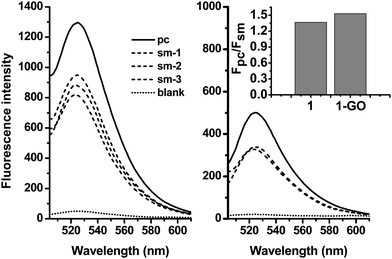 | ||
| Fig. 4 Fluorescence spectra in the presence of the ssDNA target 3 (solid), the sm-ssDNA target 4, 5 and 6 (short dash), and no target (short dot), demonstrating the abilities of 2 (left) and 2-GO (right) to distinguish perfectly complementary and single-base-mismatched DNA targets. Inset: the fluorescence intensity ratio Fpc/Fsm (where Fpc and Fsm are the fluorescence intensities of 2 or 2-GO in the presence of 3 and 4). The concentrations of 1 was 20 nM, and the target concentrations were 40 nM. The excitation wavelength was 494 nm. | ||
Kinetics and thermodynamics
As reported in our earlier studies, in which both “pre-mixing” and “post-mixing” strategies were used and the latter proved more convenient to detection. Here we use the “post-mixing” method for our DNA detection and the targets should be hybridized with probes first and then followed by mixing the DNA samples with GO. There are several advantages including: (1) the hybridization process is separated from detection and can be performed under optimized conditions without disturbance of other materials; (2) the homogeneous assay type makes it easy to automate by standard robotic manipulation of microwell plates; (3) the kinetics of interaction between GO and DNA is fast; less than 1 min is enough and we usually detect fluorescence after mixing GO and DNA samples for 15 s.Melting-temperature measurements were then conducted to study the thermostability of the GO complex. For MBs, there are three states: free in the stem-loop conformation (status A), free as a random coil (status B), and hybridized with a target (status C).25 As shown in Fig. 5, by monitoring the fluorescence of MB (2) incubated at different temperatures, we found that the MB was in a closed state (status A) and only weakly fluorescence at lower temperatures. However, at high temperatures, the helical order of the stem melted and turned to a random-coil (status B), separating the fluorophore from the quencher and restoring a higher degree of fluorescence (Fig. 5a, square). The S/B ratio was 1 (Fig. 5b) in the absence of target. After hybridization with target 3 at 25 °C, the hairpin changed to status C and the S/B ratio highly increased to 23.5. However, if the temperature changed to 75 °C, the hairpin was melted and existed as a random-coil structure, the fluorescence was recovered due to the departure of fluophores from quenchers, which led to the high background signals, and the S/B ratio recovered to 1.1. These data implied that the detection of target by traditional MBs was dependent on the temperatures.
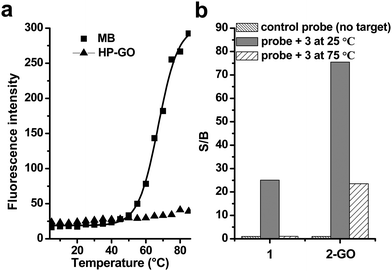 | ||
Fig. 5 (a) Temperature effects on the fluorescence emission intensities of (a) 2 and (b) 1-GO. The concentrations of 1 and 2 were 10 nM. (b) Signal enhancement of both 2 and 1-GO in the phosphate buffer after hybridization with the target 3 at 25 and 75 °C. The final probe/target concentration ratio was 1![[thin space (1/6-em)]](https://www.rsc.org/images/entities/char_2009.gif) : :![[thin space (1/6-em)]](https://www.rsc.org/images/entities/char_2009.gif) 6. The excitation and emission wavelengths were 494 and 524 nm, respectively. 6. The excitation and emission wavelengths were 494 and 524 nm, respectively. | ||
When the 1-GO mixture was exposed to different temperatures between 5 and 85 °C in 5 °C increments, and the fluorescence of 1-GO complex was monitored, we found that the 1-GO complex displayed excellent thermostability even at high temperatures, as indicated by the minimal changes in fluorescence intensity at temperatures above 60 °C (Fig. 5, triangle). The S/B ratio was 1 (Fig. 5b) in the absence of the target. After hybridization with target 3 at 25 °C, the hairpin changed to status C and the S/B ratio highly increased to 75.5. This high S/B ratio was contributed to the high quenching efficiency of GO to MBs as described above. By increasing the temperature to 75 °C, the hairpin changed into random-coil that adsorbed on the surface of GO; the low background was kept. The S/B ratio was calculated to be 23.5, which means the 1-GO complex hybridized to its target at 75 °C and had an S/B of 23.5 that is significantly higher than the S/B of MBs (1.1) observed for hybridized 2 at this temperature. The reduction in the S/B of 1-GO at 75 °C compared with its S/B at 25 °C is due to the decrease of fluorescence intensity of the DNA hybrids at the higher temperature. This unusual behaviour suggests that the GO surface with adsorbed ssDNA strands is much less dependent on temperature than a conventional MB, where DNA is observed to melt. This implies that exceptionally strong affinity between ssDNA/hairpin DNA and GO exists. Such tight binding between them makes 1-GO, as well as 2-GO, function well at both room temperature and relatively high temperatures with much lower background. This high thermostability of 1-GO/2-GO also allows their use in real-time PCR studies under normal temperature-cycling conditions.
Conclusion
In conclusion, a novel MB with GO was developed that could sensitively and selectively detect specific DNA sequences. The GO-based DNA sensor has several important advantages, for example, GO was easily synthesized in large quantities, the DNA assays were operated within several minutes in a mix-and-detect manner, as well as homogeneous and at low cost. Here, the ability of GO to differentiate hairpin and dsDNA not only offers a new approach to detect DNA but may find applications in detecting a wide spectrum of analysts when complemented with the use of functional nucleic acid structures. The present approach can be engineered in ways that offer unique advantages and capabilities that are not available from conventional molecular systems. The GO-based MB probe has better sensitivity and higher thermal stability as compared to conventional MBs. High thermostability combined with the excellent affinity for a complementary sequence makes this GO–MB probe especially useful under stringent experimental conditions. Moreover, the fluorescence quenching scheme utilized in GO–MB probes can also be applied to different types of fluorophores. Finally, this approach can be extended to develop a variety of fluorescent biological probes by designing different DNA strands. We thus expect that the graphene-based strategy presented here could open new opportunities for the design and engineering for sensor applications.Experimental
Materials
Graphite powder and other chemical reagents were purchased from China National Pharmaceutical Group Corporation (Shanghai, China). All other chemicals were of analytical grade. All chemicals were used without further purification. Milli Q Water was used for the whole procedure. DNA oligonucleotides were synthesized and purified by HPLC (Sangon Biotechnology Inc., Shanghai). The sequences of the involved oligonucleotides are listed in Table 1. Fluorescence spectroscopy was performed on Hitachi F-4500 Fluorescence spectrophotometer. AFM measurement was carried out on Nanoscope IIIa (Digital Instrument, USA) under tapping mode, with a Pt/Ti coated tip (force constant of 4 N m−1, MicroMasch). A droplet of GO dispersion was cast onto a freshly cleaved mica surface and the sample was maintained at room temperature for several minutes to allow water evaporation. The image was obtained at 20 °C and with humidity of 30%.Preparation of GO
Based on Hummer's method, GO was synthesized from graphite powder.53 Briefly, a conical flask equipped with a magnetic stirring bar was charged with 20 mL concentrated H2SO4 containing K2S2O8 (8 g), and P2O5 (8 g). Then graphite power (4 g) was added into the solution at 80 °C. After stirred over 6 h, the resulting dark blue mixture was thermally isolated and slowly cooled to room temperature. The mixture was poured into 300 mL of water, and the solution was filtrated with a filter membrane of 0.22 μm (Generay Biotech Co., Ltd., Shanghai, China) and dried overnight at 60 °C. The pre-oxidized graphite powder (2 g) was added to 92 mL of cold H2SO4 (0 °C), to which KMnO4 (12 g) was gradually added under continuous stirring in an ice-bath. After 15 min, NaNO3 (2 g) was added to the mixture. The solution was further stirred for 2 h at 35 °C and distilled water (200 mL) was added. The mixture was poured into 560 mL of water, after which 10 mL of H2O2 (30%) was slowly added. The product was washed with HCl (1![[thin space (1/6-em)]](https://www.rsc.org/images/entities/char_2009.gif) :
:![[thin space (1/6-em)]](https://www.rsc.org/images/entities/char_2009.gif) 10) and then filtered. The material was re-dispersed in water and washed with water until the pH of the filtrate was neutral. The brown dispersion was extensively dialyzed to remove residual metal ions and acids, and then exfoliated via sonication for 1.5 h (300 W). Unexfoliated graphite oxide was removed by centrifugation (3000 rpm, 5 min) using Centrifuge himac-CF 16RX (Hitachi, Japan). The as-prepared GO samples (0.5 mg mL−1) was then characterized with tapping-mode atomic force microscope (AFM).
10) and then filtered. The material was re-dispersed in water and washed with water until the pH of the filtrate was neutral. The brown dispersion was extensively dialyzed to remove residual metal ions and acids, and then exfoliated via sonication for 1.5 h (300 W). Unexfoliated graphite oxide was removed by centrifugation (3000 rpm, 5 min) using Centrifuge himac-CF 16RX (Hitachi, Japan). The as-prepared GO samples (0.5 mg mL−1) was then characterized with tapping-mode atomic force microscope (AFM).
AFM measurement was carried out on Nanoscope IIIa (Digital Instrument, USA) under tapping mode, with a Pt/Ti coated tip (force constant of 4 N m−1, MicroMasch). A droplet of GO dispersion was cast onto a freshly cleaved mica surface and the sample was maintained at room temperature for several minutes to allow water evaporation. The image was obtained at 20 °C and with humidity of 30%.
Fluorescence assays
In the fluorescence quenching and hybridization assays, the fluorescent probe 1 (20 nM) and probe 2 (20 nM) were hybridized with the target 3 in the buffer (100 mM NaCl, 10 mM PB, 10 mM MgCl2, pH 7.4) for 10 min. In the nucleic acid detection method of conventional MB 1, the fluorescence of hybridization solution was directly measured by Hitachi F-4500 Fluorescence spectrophotometer with excitation at 494 nm and emission range from 504 to 610 nm. Spectrometer slits were set for 5 nm band-pass. And in the nucleic-acid detection methods of self-assembled graphene oxide complex of 1 (1-GO) and 2 (2-GO), GO of 5 μL (0.5 mg mL−1) were added into hybridization solutions. After 15 s incubation, fluorescence measurement were performed with Hitachi F-4500 Fluorescence spectrophotometer with excitation at 494 nm and emission range from 504 to 610 nm.In the concentration gradient assay, the fluorescent probe 1 (20 nM) were hybridized with the different concentration target 3 of 1 nM, 2 nM, 5 nM, 10 nM, 20 nM, 60 nM and 120 nM for 10 min, to which GO of 5 μL (0.5 mg mL−1) added. After 15 s incubation, fluorescence measurement were performed with a fluorescence spectrophotometer.
In the specific DNA detection assay, the fluorescent probe 1 (20 nM) were hybridized with the target 3 of 40 nM and single base mismatch targets of probe 4, probe 5 and probe 6 of 40 nM. All other operation steps in the nucleic-acid detection methods of conventional MB 1 and self-assembled grapheme oxide complex of 1 (1-GO) were similar to those in the fluorescence quenching and hybridization assay.
In the thermodynamics assay, GO of 5 μL (0.5 mg mL−1) were added into solutions of 1 (10 nM) and 2 (10 nM) in the absence of 3. After 10 min incubation, the fluorescence of solutions containing 1 or 2 and GO were measured at temperature intervals of 5 °C from 5–85 °C. At every temperature point, the temperature must be kept for 5 min to allow for an equilibrium state.
Acknowledgements
This work was financially supported by the National Natural Science Foundation (20704043, 20805055, 20873175), the Shanghai Municipal Commission for Science and Technology (08QA14078, 0952nm04600), the Ministry of Health (2009ZX10004-301) and K. C. Wong education foundation, Hong Kong.References
- M. J. Heller, Annu. Rev. Biomed. Eng., 2002, 4, 129–153 CrossRef CAS.
- R. C. McGlennen, Clin. Chem., 2001, 47, 393–402 CAS.
- S. J. Park, T. A. Taton and C. A. Mirkin, Science, 2002, 295, 651–1506 CrossRef.
- S. Tyagi and F. R. Kramer, Nat. Biotechnol., 1996, 14, 303–308 CrossRef CAS.
- C. H. Fan, S. Wang, J. W. Hong, G. C. Bazan, K. W. Plaxco and A. J. Heeger, Proc. Natl. Acad. Sci. U. S. A., 2003, 100, 6297–6301 CrossRef CAS.
- R. Elghanian, J. J. Storhoff, R. C. Mucic, R. L. Letsinger and C. A. Mirkin, Science, 1997, 277, 1078–1081 CrossRef CAS.
- W. H. Tan, K. M. Wang and T. Drake, Curr. Opin. Chem. Biol., 2004, 8, 547–553 CrossRef CAS.
- P. M. Holland, R. D. Abramson, R. Watson and D. H. Gelfand, Proc. Natl. Acad. Sci. U. S. A., 1991, 88, 7276–7280 CAS.
- E. Matayoshi, G. Wang, G. Krafft and J. Erickson, Science, 1990, 247, 954–958 CrossRef CAS.
- C. Y. Yang, C. D. Medley and W. H. Tan, Curr. Pharm. Biotechnol., 2005, 6, 445–452 CAS.
- S. A. E. Marras, Methods Mol. Biol., 2006, 335, 3–16 CAS.
- G. Bonnet, S. Tyagi, A. Libchaber and F. R. Kramer, Proc. Natl. Acad. Sci. U. S. A., 1999, 96, 6171–6176 CrossRef CAS.
- A. Tsourkas, M. A. Behlke, S. D. Rose and G. Bao, Nucleic Acids Res., 2003, 31, 1319–1330 CrossRef CAS.
- G. Bonnet, O. Krichevsky and A. Libchaber, Proc. Natl. Acad. Sci. U. S. A., 1998, 95, 8602–8606 CrossRef CAS.
- A. Tyagi, S. A. Marras and F. R. Kramer, Nat. Biotechnol., 2000, 18, 1191–1196 CrossRef CAS.
- S. Tyagi, D. P. Bratu and F. R. Kramer, Nat. Biotechnol., 1998, 16, 49–53 CrossRef CAS.
- P. Zhang, T. Beck and W. H. Tan, Angew. Chem., Int. Ed., 2001, 40, 402–405 CrossRef.
- X. H. Fang, X. J. Liu, S. M. Schuster and W. H. Tan, J. Am. Chem. Soc., 1999, 121, 2921–2922 CrossRef CAS.
- J. Li, W. H. Tan, K. M. Wang, D. Xiao, X. H. Yang, X. X. He and Z. W. Tang, Anal. Sci., 2001, 17, 1149–1153 CAS.
- G. Yao and W. H. Tan, Anal. Biochem., 2004, 331, 216–223 CrossRef CAS.
- H. Wang, J. Li, H. P. Liu, Q. J. Liu, Q. Mei, Y. J. Wang, J. J. Zhu, N. Y. He and Z. H. Lu, Nucleic Acids Res., 2002, 30, 61e CrossRef.
- M. M. Mhlanga and L. Malmberg, Methods, 2001, 25, 463–471 CrossRef CAS.
- A. S. Piatek, S. Tyagi, A. C. Pol, A. Telenti, L. P. Miller, F. R. Kramer and D. Alland, Nat. Biotechnol., 1998, 16, 359–363 CrossRef CAS.
- L. G. Kostrikis, S. Tyagi, M. M. Mhlanga, D. D. Ho and F. R. Kramer, Science, 1998, 279, 1228–1229 CrossRef CAS.
- K. M. Wang, Z. W. Tang, C. J. Yang, Y. M. Kim, X. H. Fang, W. Li, Y. R. Wu, C. D. Medley, Z. H. Cao, J. Li, P. Colon, H. Lin and W. H. Tan, Angew. Chem., Int. Ed., 2009, 48, 856–870 CrossRef CAS.
- D. P. Bratu, B. J. Cha, M. M. Mhlanga, F. R. Kramer and S. Tyagi, Proc. Natl. Acad. Sci. U. S. A., 2003, 100, 13308–13313 CrossRef CAS.
- J. Perlette and W. H. Tan, Anal. Chem., 2001, 73, 5544–5550 CrossRef CAS.
- C. D. Medley, T. J. Drake, J. M. Tomasini, R. J. Rogers and W. Tan, Anal. Chem., 2005, 77, 4713–4718 CrossRef CAS.
- P. J. Santangelo, B. Nix, A. Tsourkas and G. Bao, Nucleic Acids Res., 2004, 32, e57 CrossRef.
- S. P. Song, Z. Q. Liang, J. Zhang, L. H. Wang, G. X. Li and C. H. Fan, Angew. Chem., Int. Ed., 2009, 48, 8670–8674 CrossRef CAS.
- B. Dubertret, M. Calame and A. J. Libchaber, Nat. Biotechnol., 2001, 19, 365–370 CrossRef CAS.
- D. S. Seferos, D. A. Giljohann, H. D. Hill, A. E. Prigodich and C. A. Mirkin, J. Am. Chem. Soc., 2007, 129, 15477–15479 CrossRef CAS.
- D. J. Maxwell, J. R. Taylor and S. M. Nie, J. Am. Chem. Soc., 2002, 124, 9606–9612 CrossRef CAS.
- R. H. Yang, J. U. Jin, Y. Chen, N. Shao, Z. W. Tang, Y. R. Wu, Z. Zhou and W. H. Tan, J. Am. Chem. Soc., 2008, 130, 8351–8358 CrossRef CAS.
- C. H. Lu, H. H. Yang, C. L. Zhu, X. Chen and G. N. Chen, Angew. Chem., Int. Ed., 2009, 48, 4785–4787 CrossRef CAS.
- S. J. He, B. Song, D. Li, C. F. Zhu, W. P. Qi, Y. Q. Wen, L. H. Wang, S. P. Song, H. P. Fang and C. H. Fan, Adv. Funct. Mater., 2010, 20, 453–459 CrossRef.
- K. S. Novoselov, A. K. Geim, S. V. Morozov, D. Jiang, Y. Zhang, S. V. Dubonos, I. V. Grigorieva and A. A. Firsov, Science, 2004, 306, 666–669 CrossRef CAS.
- D. Li and R. B. Kaner, Science, 2008, 320, 1170–1171 CrossRef CAS.
- X. Wang, L. Zhi and K. Mullen, Nano Lett., 2008, 8, 323–327 CrossRef CAS.
- Z. Y. Yin, S. X. Wu, X. Z. Zhou, X. Huang, Q. C. Zhang, F. Boey and H. Zhang, Small, 2010, 6, 307–312 CrossRef CAS.
- D. Li, M. B. Müller, S. Gilje, R. B. Kaner and G. G. Wallace, Nat. Nanotechnol., 2008, 3, 101–105 CrossRef CAS.
- S. Stankovich, D. A. Dikin, G. H. B. Dommett, K. M. Kohlhaas, E. J. Zimney, E. A. Stach, R. D. Piner, S. T. Nguyen and R. S. Ruoff, Nature, 2006, 442, 282–286 CrossRef CAS.
- D. A. Dikin, S. Stankovich, E. J. Zimney, R. D. Piner, G. H. B. Dommett, G. Evmenenko, S. T. Nguyen and R. S. Ruoff, Nature, 2007, 448, 457–460 CrossRef CAS.
- X. Huang, X. Zhou, S. Wu, Y. Wei, X. Qi, J. Zhang, F. Boey and H. Zhang, Small, 2010, 6, 513–516 CrossRef CAS.
- X. Zhou, X. Huang, X. Qi, S. Wu, C. Xue, F. Y. C. Boey, Q. Yan, P. Chen and H. Zhang, J. Phys. Chem. C, 2009, 113, 10842–10846 CrossRef CAS.
- X. M. Sun, Z. Liu, K. Welsher, J. T. Robinson, A. Goodwin, S. Zaric and H. J. Dai, Nano Res., 2008, 1, 203–212 Search PubMed.
- N. Mohanty and V. Berry, Nano Lett., 2008, 8, 4469–4476 CrossRef CAS.
- Z. Wang, X. Zhou, J. Zhang, F. Boey and H. Zhang, J. Phys. Chem. C, 2009, 113, 14071–14075 CrossRef CAS.
- S. Srivastava, J. K. Basu, M. Sprung and J. Wang, J. Chem. Phys., 2009, 130, 174718 CrossRef CAS.
- R. S. Swathi and K. L. Sebastian, J. Chem. Phys., 2008, 129, 054703 CrossRef CAS.
- A. Tsourkas, M. A. Behlke and G. Bao, Nucleic Acids Res., 2002, 30, 4208–4215 CrossRef CAS.
- A. Tsourkas, M. A. Behlke and G. Bao, Nucleic Acids Res., 2002, 30, 5168–5174 CrossRef CAS.
- W. S. Hummers and R. E. Offeman, J. Am. Chem. Soc., 1958, 80, 1339 CrossRef CAS.
| This journal is © The Royal Society of Chemistry 2010 |
