
 Open Access Article
 This Open Access Article is licensed under a Creative Commons Attribution-Non Commercial 3.0 Unported Licence
Supramolecular bidentate rhodium(I) or iridium(I) phosphine and oxazoline amino acid bioconjugates as selective catalysts for enantioselective reactions†
Marija
Bakija
 a,
Saša
Opačak
a,
Berislav
Perić
a,
Soumyadeep
Chakrabortty
b,
Andrea
Dell'Acqua
b,
Eszter
Baráth
b,
Johannes G.
de Vries
b,
Sergey
Tin
*b and
Srećko I.
Kirin
*a
a,
Saša
Opačak
a,
Berislav
Perić
a,
Soumyadeep
Chakrabortty
b,
Andrea
Dell'Acqua
b,
Eszter
Baráth
b,
Johannes G.
de Vries
b,
Sergey
Tin
*b and
Srećko I.
Kirin
*a
aRuđer Bošković Institute, Bijenička c. 54, HR-10000 Zagreb, Croatia. E-mail: Srecko.Kirin@irb.hr
bLeibniz Institut für Katalyse e.V., Albert-Einstein-Straße 29A, DE-18059 Rostock, Germany. E-mail: Sergey.Tin@catalysis.de
First published on 15th November 2024
Abstract
This publication describes monodentate phosphine and oxazoline ligands attached to an amino acid ester and the application of their supramolecularly assembled rhodium(I) or iridium(I) complexes in asymmetric catalysis. The major feature of these complexes is the transmission of chirality from distant hydrogen bonded amino acids to the prochiral catalytic metal center (“backdoor induction”). The in situ generated homoleptic and heteroleptic rhodium(I) or iridium(I) precatalysts were studied by NMR, UV-VIS and CD spectroscopy as well as X-ray single crystal diffraction. In asymmetric hydrogenation of methyl α-acetamidocinnamate, rhodium(I) and iridium(I) complexes afforded complete conversions with enantioselectivities up to 85%, while iridium complexes proved to be more sensitive to the variation of reaction conditions, including catalyst loading, metal to ligand ratio and temperature. The hydrogenation of four other dehydroamino acid substrates resulted in similar conversion and selectivity as obtained with methyl α-acetamidocinnamate. The influence of the phosphine/oxazoline heteroleptic mixtures in catalysis was studied using both rhodium(I) and iridium(I) complexes. Finally, a homoleptic phosphine rhodium(I) complex was successfully applied in asymmetric hydroformylation of styrene and 1-octene with complete conversions and selectivity up to 40% ee for the branched styrene product.
Introduction
The application of numerous phosphorus based ligands in hydrogenation catalysis remains unmatched, having BINAP and MeDuPhos derivatives established as the well-known “privileged” ligands on the turn of this century (Fig. 1a),1 with the number of published articles growing to this day.2–5 In addition, the popularity of iridium catalysts in asymmetric hydrogenation increased in the last two decades, especially regarding their application to challenging substrates.6–9 Although the very first rhodium and iridium catalysts used in non-asymmetric10,11 and asymmetric hydrogenation12,13 were monodentate, the bidentate ligands quickly overtook the focus of research for the next 30 years due to their excellent efficiency. This includes a plethora of purely P-donor based ligands,14 but also hybrid ligands15 such as PHOX ligands (Fig. 1b).16 Many of these ligands had a common characteristic of integrating either central or axial chirality as close as possible to the metal center,17 including monodentate ligands when they reemerged in the early 2000s with newfound efficiency (Fig. 1c).18,19 | ||
| Fig. 1 Types of ligands applied in enantioselective hydrogenation. Bidentate: (a) “privileged” ligands, (b) hybrid ligands. Monodentate: (c) ligands with axial chirality near the donor atom, (d) ligands with capacity for supramolecular interactions. | ||
An interesting feature of monodentate ligands is the use of ligand mixtures to achieve enhanced selectivity. The rationale for using heteroleptic catalysts emphasizes synthesis simplification and precursor availability. This simplification also transmits to the complexity of modifying ligands if the chiral coordination sphere does not produce the desired results, where modifying ligands with large molecular weights might not be trivial. This is especially important if the goal is a very minor modification to the coordination sphere. Instead of reconstructing and modifying the whole ligand, using mixtures of monodentate ligands that are already at disposal with the intention of reaction screening can be considered. An exemplary work was reported by Lefort et al. where high throughput experimentation methods were used in additive screening for Monophos-catalyzed enantioselective hydro-genation.20 Additionally, when using mixtures of ligands, the number of obtainable results is no longer equal to the number of ligands synthesized. Rather, if all combinations of n prepared ligands were to be tested and equivalent combinations excluded, the new number of results amounts to n!/(2(n − 2)!) (e.g. for n = 6, the number of unique combinations is equal to 15), a point well illustrated in work reported by Peña et al.21 Not only was selectivity enhancement21 and reversal of selectivity achieved,22 but the influence of various parameters was also explored. This includes the influence of ligand ratios used,23 addition of achiral P- or N-ligands,24,25 configurationally fluxional achiral ligands,26 diastereoisomeric ligands,27 integration of negatively charged structural units28 and various additives.20
In addition, attaching structural units with capacity for supramolecular interactions to purely monodentate or bridging monodentate ligands enabled self-assembly upon complexation, in turn giving rise to selective supramolecular bidentate catalysts (Fig. 1d).29–31 Less common structural units among these catalysts are comprised of a second coordinating site, for example, crown ether or porphyrin derivatives,32–34 where the coordination of the site facilitates spatial reorganization of the molecule, enabling selective catalysis. More commonly, the structural units successful in “locking” the catalyst into optimal position utilize π–π stacking and hydrogen bonding. These ligands are often bioconjugates composed of amino acid moieties (SupraPhanePhos, Fig. 1d),35 nucleobase-like derivatives36 or carbamides (UREAPhos, SupraBOX)37–40 attached to aromatic rings or linkers. However, if SupraPhanePhos or UREAPhos derivatives with and without coordinating groups containing central or axial chirality incorporated close to the metal atom are compared, clearly better results are obtained with the former; e.g. 99% vs. 32% ee,35 96% vs. 0%,37 respectively. Several groups reported catalysts which utilize only the supramolecular interactions to induce chirality around the metal atom upon complexation (“backdoor induction” of chirality). The coordinating unit of these ligands is commonly an achiral triphenyl/diphenylpyridyl phosphine, covalently attached to the chiral moiety;35,41,42 including our previous work.43–46 Remarkably, several examples of successful selectivity enhancement by using mixtures of ligands41,47 and additives42,48 have been reported.
Ligand development for hydroformylation follows an analogous pattern as demonstrated above for hydrogenation. The first enantioselective hydroformylation reaction49 was carried out just a couple of years after the first rhodium catalyzed hydrogenation reaction, and in the following decades vast ligand libraries, dominated by phosphorus-based bidentate ligands have been synthesized.50,51 A common characteristic of integrating either central or axial chirality can be found among these ligands as well, especially the biphenyl bisphosphinite and BINOL motifs.50,51 However, hydroformylation of terminal alkenes requires control of both regioselectivity and enantioselectivity, unlike hydrogenation where only enantioselectivity is focused on. This brings an additional challenge, as linear aliphatic terminal alkenes are often more inclined towards the formation of linear aldehydes, which are non-chiral compounds.52 Rare examples of ligands, like Ph-BPE53 and BOBPHOS,54 have been reported to give good branched selectivity and high enantioselectivity with these types of substrates. Some terminal alkenes, for example vinyl arenes or vinyl acetate, are more prone to the formation of branched aldehydes during hydroformylation compared to other unfunctionalized ones.55 Therefore, there are more catalysts reported (most of which are based on bidentate phosphorous ligands) that are able to perform enantioselective hydroformylation of those substrates, although a combination of high branched regioselectivity and enantioselectivity is still rarely achieved.51 Conversely, monodentate ligands have not shown equal versatility in hydroformylation in comparison to the results obtained in asymmetric hydrogenation. Apart from some selected examples with certain bisphenol-based phosphoramidite ligands and phosphine ligands conjugated to methylated cyclodextrins (HUGPHOS), very poor or no enantioselectivity is typically observed.51,56,57 Several applications of supramolecular bidentate catalysts in hydroformylation reactions with similar results have been reported as well.58,59 Notably, the largest contributions were imparted by research in the groups of Breit and Reek, both in achieving regioselectivity and enantioselectivity.58,60,61 Additionally, design of ligands to facilitate optimal self-assembly of different ligands in a heteroleptic catalyst in order to increase reaction selectivity has also been studied.47,62
We have previously reported on non-BINOL derived rhodium metal catalysts applied in asymmetric hydrogenation,43–46 where the chirality at the catalytic metal in homoleptic ML2 complexes was induced by non-covalent interactions of the ligands. Herein, monodentate triphenylphosphine and oxazoline ligands with distant chiral amino acids, as well as corresponding homoleptic and heteroleptic precatalysts, have been synthesized and characterized using spectroscopic methods, namely 1H, 13C, 31P, COSY, HSQC NMR, UV-VIS and CD (circular dichroism), in addition to X-ray crystallography of one rhodium complex. Rhodium and iridium complexes of the prepared monodentate ligands that exhibit “backdoor induction” of chirality have been used as catalysts in the enantioselective hydrogenation of trisubstituted olefin derivatives; and rhodium complexes in hydroformylation of benchmark olefins.
Results and discussion
Synthesis
Amino acid bioconjugate ligands have the advantage of readily available and enantiopure precursors. In order to explore and compare the selectivity of homoleptic and heteroleptic rhodium and iridium complexes with “backdoor induction” of chirality, one phosphine- and five oxazoline-containing amino acid bioconjugates have been prepared using previously reported procedures, while ligands 1b, 1d, and 1p are described in the literature.45,63 Ligand 1a is achiral and has no amino acid substituents, ligands 1b and 1p contain chirality several bonds away from the coordinating atoms, and ligands 1c, 1c* and 1d contain chirality both near and several bonds away from the coordinating atoms (Fig. 2, Schemes S1 and S2, Charts S1 and S2†). | ||
| Fig. 2 Ligands used in this study. | ||
Bioconjugate ligands 1b–1d and 1p are composed of three structural units; the coordinating unit (Fig. 2, blue), the central aromatic unit (Fig. 2, black) and the hydrogen bonding unit (Fig. 2, red). The ligands are designed to induce chirality around the metal in the metal complex through formation of supramolecular interactions between ligands, a concept first successfully utilized by the groups of Reek and Breit.35–37 Depending on the hydrogen bonding motif formed (or the lack thereof), three resulting structures are possible, which were previously described on 1,n′-amino acid-disubstituted ferrocenes (Fig. 3).64 The main distinction between these structures is in the motif of intramolecular hydrogen bonding and the presence or absence of helical chirality. Analogous hydrogen bonding motifs could be obtained in metal complexes with ligands reported in this publication, through stacking of the two disubstituted phenyl rings (Fig. 2, structural units depicted in black in ligands 1b–d and 1p).46
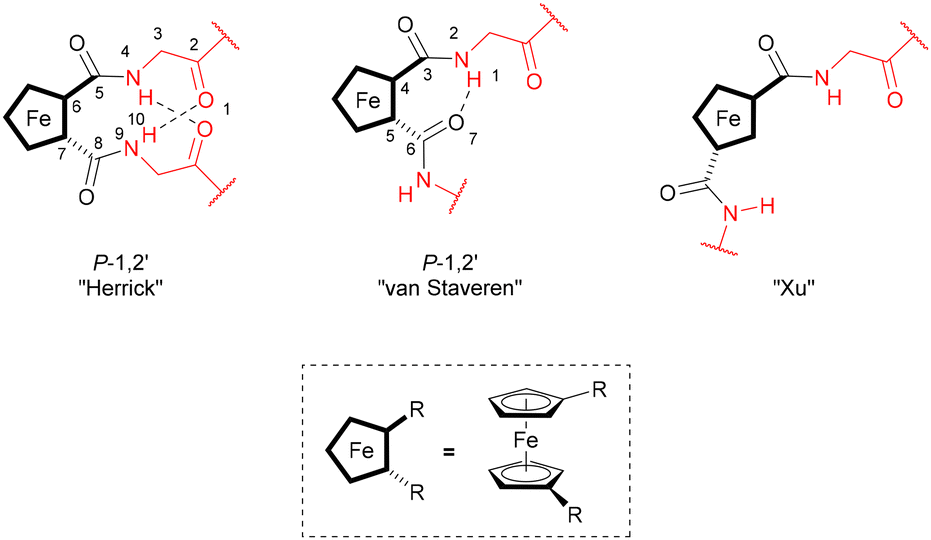 | ||
| Fig. 3 Hydrogen bonding motifs in disubstituted ferrocene peptides. This image is a modified representation of a picture from ref. 64. | ||
Structural characterization
 | ||
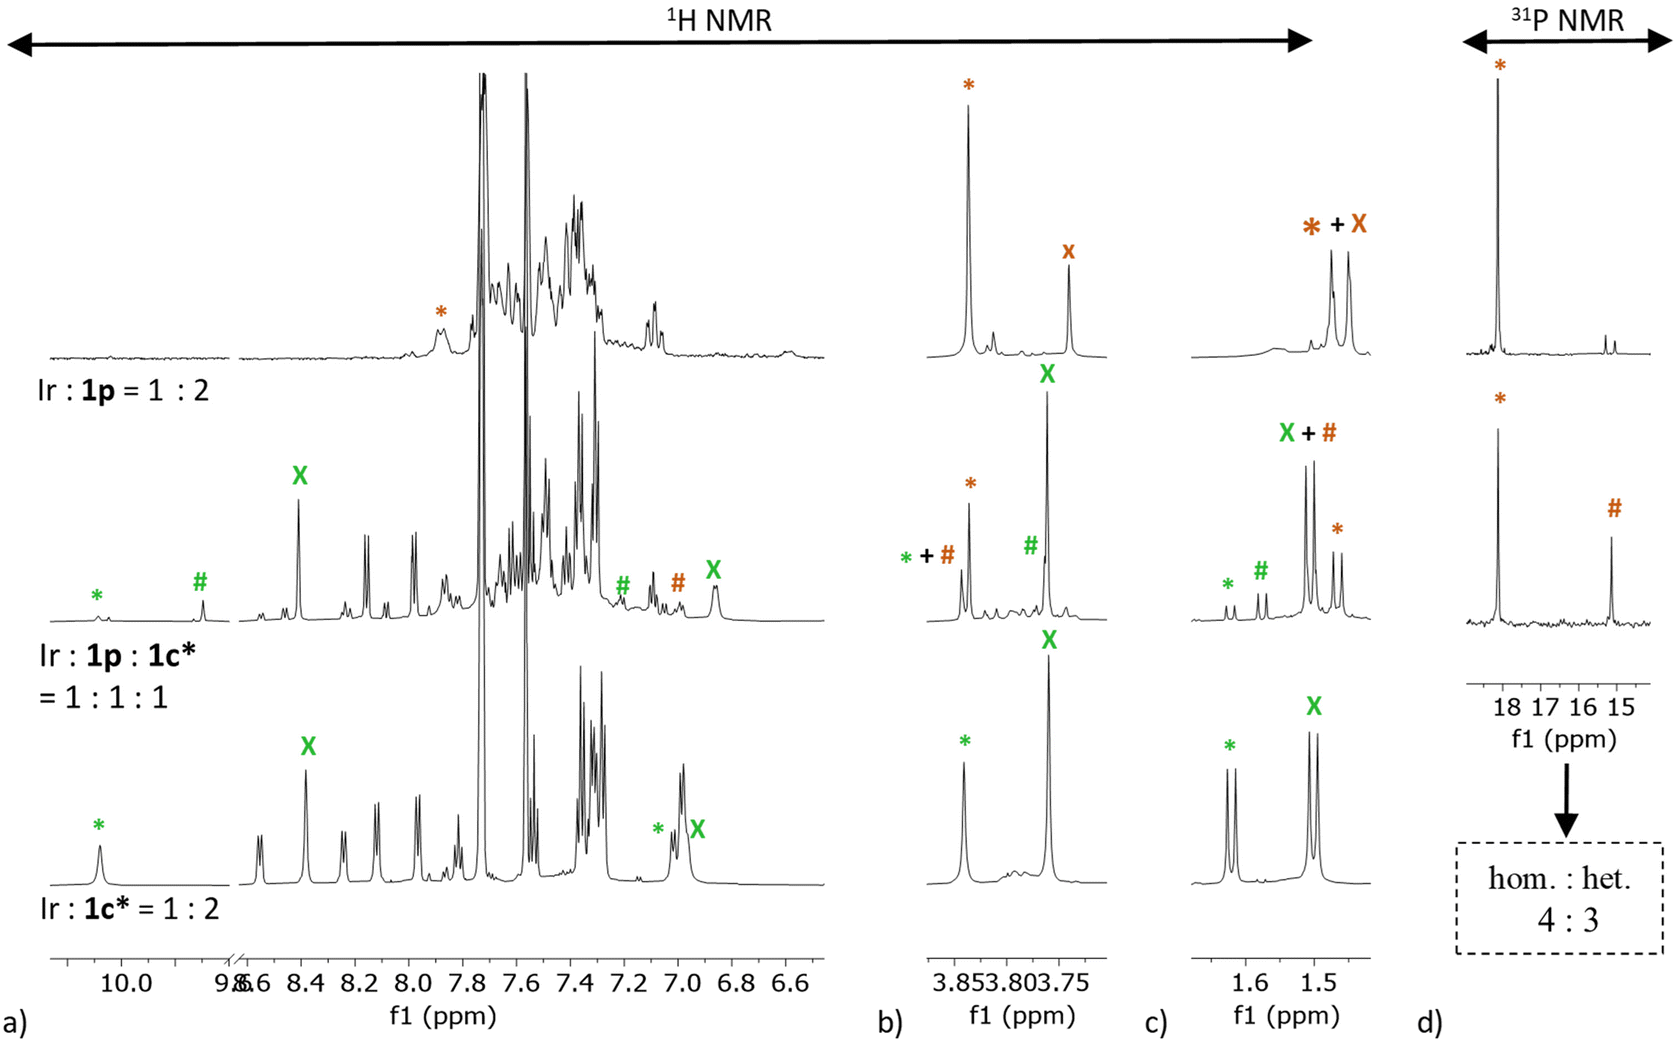
| Fig. 4 Stacked 1H NMR spectra (CD2Cl2) of homoleptic and heteroleptic solutions of [Rh(COD)2]BF4 precursor and 1p ligand (orange) or/and 1c* ligand (green): (a) aromatic region, (b) functional group region, (c) aliphatic region. (d) Stacked 31P NMR spectra. The homoleptic peaks are indicated by an asterisk (*) and the heteroleptic peaks are indicated by a hash sign (#). Abbreviations: hom.-homoleptic species; het.-heteroleptic species. | ||
 | ||
| Fig. 5 Stacked 1H NMR spectra (CD2Cl2) of homoleptic and heteroleptic solutions of [Ir(COD)2]BArF precursor and 1p ligand (orange) or/and 1c* ligand (green): (a) aromatic region, (b) functional group region, (c) aliphatic region. (d) Stacked 31P NMR spectra. The homoleptic peaks are indicated by an asterisk (*), the heteroleptic peaks are indicated by a hash sign (#), the free ligand peaks are indicated by the letter (X). Abbreviations: hom.-homoleptic species; het.-heteroleptic species. | ||
For non-coordinated ligands, NMR spectra indicate no significant supramolecular interactions (neither hydrogen bonding nor aromatic stacking) under given conditions, since their amide and aromatic peaks appear below and above 7.00 ppm, respectively (ESI sections 3.1 and 3.2†). In precatalyst complexes, the number of ligand equivalents was determined by comparison of ligand peak integrals with the integrals of coordinated cyclooctadiene peaks, indicating the prevalence of [M(COD)L2]+ species, Fig. 4 and 5 (for integrals see ESI section 3.3 and 3.4†). In addition, the presence of the non-coordinated cyclooctadiene peaks confirms that the ligands indeed displace one cyclooctadiene in the precatalytic complex. The shifts of the alanine methyl ester and alanine aliphatic methyl groups, as well as the oxazoline isolated hydrogen atom of the central aromatic unit were crucial in aiding spectral assignation (Table S1†). On the other hand, 31P NMR spectroscopy was utilized to characterize complexes containing the 1p ligand, both with rhodium and iridium. More specifically, a doublet with J (103Rh, 31P) ≈ 145 Hz, supports a C2-symmetric cis-isomer with RhL2 stoichiometry.46,65 In the case of iridium, however, only a singlet was obtained.
1H NMR spectra of the homoleptic 1p and homoleptic 1c* rhodium complexes (Rh![[thin space (1/6-em)]](https://www.rsc.org/images/entities/char_2009.gif) :1p = 1:2 and Rh:1c* = 1:2, Fig. 4, first and third row, respectively) strongly indicate complexation. In both cases, there is only one set of ligand peaks, in line with C2-symmetric complexes, which simplifies the analysis. The spectra exhibit significant downfield shifts of the alanine amide peaks (Δδ(1p) ∼ 1.18 ppm and Δδ(1c*) ∼ 0.74 ppm), supporting the presence of hydrogen bonding in both [Rh(COD)(1p)2]+ and [Rh(COD)(1c*)2]+ complexes.64 Interestingly, a very strong influence of complexation can be seen in the spectra of the homoleptic 1c*. The hydrogen atoms on the central aromatic unit are shifted downfield, by up to Δδ = 1.67 ppm, and the hydrogen atom on the chiral oxazoline carbon atom is shifted upfield by 1.43 ppm. The methylene hydrogen atoms are shifted upfield by 0.79 and 0.61 ppm, respectively (Table S1†).
:1p = 1:2 and Rh:1c* = 1:2, Fig. 4, first and third row, respectively) strongly indicate complexation. In both cases, there is only one set of ligand peaks, in line with C2-symmetric complexes, which simplifies the analysis. The spectra exhibit significant downfield shifts of the alanine amide peaks (Δδ(1p) ∼ 1.18 ppm and Δδ(1c*) ∼ 0.74 ppm), supporting the presence of hydrogen bonding in both [Rh(COD)(1p)2]+ and [Rh(COD)(1c*)2]+ complexes.64 Interestingly, a very strong influence of complexation can be seen in the spectra of the homoleptic 1c*. The hydrogen atoms on the central aromatic unit are shifted downfield, by up to Δδ = 1.67 ppm, and the hydrogen atom on the chiral oxazoline carbon atom is shifted upfield by 1.43 ppm. The methylene hydrogen atoms are shifted upfield by 0.79 and 0.61 ppm, respectively (Table S1†).
The homoleptic complex of rhodium and oxazoline 1c* proved to be rather stable; the 1H NMR spectrum of the same sample recorded after 7 days showed only minimal changes in the spectrum (ESI section 3.7†). The stability of the [Rh(1c*)2]BF4 complex was further corroborated by the successful crystallization and subsequent single crystal X-ray analysis (see X-ray chapter below). An NMR spectrum of Rh:1c* = 1:1 with a ligand 1c* concentration of c(1c*) = 8 mM, which is 6.25 times lower concentration of ligand 1c* than in the solution used for obtaining the NMR spectrum of Rh:1c* = 1:2, was recorded in an attempt to synthesize the Rh:1c* = 1:1 metal complex in situ (ESI section 3.3.12 and 3.9†). Only one set of oxazoline peaks could be observed in the spectrum with chemical shifts of peaks almost completely matching that of the Rh:1c* = 1:2 spectrum, with integral ratios to the coordinated COD amounting to 1c*:coord. COD = 2:1. Moreover, cyclooctadiene peaks from the unreacted metal precursor with significant intensity can also be detected in the spectrum, further confirming Rh:1c* = 1:2 metal complex formation at these conditions (ESI section 3.3.12†).
The 1H NMR spectrum of the rhodium 1p/1c* heteroleptic complex (Rh:1p:1c* = 1:1:1, Fig. 4, second row; Table S1, ESI section 3.3.14†) shows different chemical shifts of all hydrogen atoms in comparison to the corresponding homoleptic analogues as well as the free ligands. Although there are many peak overlaps, the heteroleptic species is the most abundant one. The shifts of the amide peaks in relation to the analogous peaks in the spectra of the free ligands are shifted downfield by Δδ(1p) ∼ 0.69 ppm and Δδ(1c*) ∼ 0.68 ppm, respectively. Both the 1p and 1c* isolated aromatic hydrogen atoms of the central aromatic unit are shifted more downfield than the analogous peaks in the corresponding homoleptic spectra (Δδ(1p) ∼ 0.57 ppm and Δδ(1c*) ∼ 1.90 ppm). The percentage ratio of coordinated ligand 1p in the homoleptic to heteroleptic species can be estimated by comparing integrals of the homoleptic and heteroleptic 1p peaks in the quantitative 31P NMR spectrum, obtaining a percentage ratio of 13:87 ≈ 1:9 of ligand 1p in the homoleptic to ligand 1p in the heteroleptic complex (ESI section 3.3.16†).
NMR spectra of the homoleptic and heteroleptic iridium complexes were recorded under the same conditions as the rhodium analogues (Table S1,†Fig. 5, ESI sections 3.3 and 3.4†). Analyzing the spectra of the iridium complexes proved to be more challenging due to incomplete coordination observable in all of the collected spectra, particularly in the spectra containing oxazolines. Therefore, before performing the NMR analysis, the time necessary to establish an equilibrium for the formation of iridium precatalyst complexes was monitored by UV-Vis spectroscopy (Fig. S5–S8†). The UV-VIS absorbance was measured in CH2Cl2 in 5 minutes intervals, starting immediately after injecting one equivalent of iridium precursor to the ligand solution. In the case of Ir:1p = 1:2, approximately 45 minutes were necessary for the reaction to reach a plateau, i.e. for the in situ formation of the complex to reach equilibrium. With this in mind, NMR spectra of all iridium complexes were measured after equilibrating the precatalyst solution for 1 h.
The 1H NMR spectrum of the homoleptic 1p iridium complex (Ir:1p = 1:2, Fig. 5, first row) reveals incomplete complexation. The percentage ratio of all the species, including the coordinated and non-coordinated ligand 1p, derived from integral peaks in quantitative 31P NMR spectrum is 7:59:8:4:23, where 59:23 ≈ 3:1 corresponds to the ratio of coordinated to non-coordinated ligand, respectively (ESI section 3.3.2 and 3.3.17†). Excess ligand addition to the mixture mainly increases intensity of the non-coordinated 1p peaks (ESI sections 3.3 and 3.4†). The homoleptic iridium 1p complex spectrum exhibits a large downfield shift of the alanine amide peak (Δδ ∼ 1.30 ppm) and a smaller downfield shift of the ester methyl group peak (∼0.10 ppm).
The 1H NMR spectrum of the homoleptic 1c* iridium complex (Ir:1c* = 1:2, Fig. 5, third row) also reveals incomplete complexation, with an integral ratio 1:2 of coordinated to non-coordinated ligand, based on integral values of the isolated hydrogen atom of the central aromatic unit. In contrast to the homoleptic rhodium analogue, the homoleptic iridium complex with 1c* did not show equivalent stability, i.e. the spectra of the same sample recorded after 7 days shows complete loss of the complexed species peaks (ESI section 3.8†). The homoleptic iridium 1c* complex spectrum shows a very small downfield shift of the alanine amide peak (Δδ ∼ 0.15 ppm) and a downfield shift of the ester methyl group peak (Δδ ∼ 0.08 ppm), similar to the 1p homoleptic derivative. Although the amide peak shift is comparably smaller than in the rhodium analogue, all of the aromatic and oxazoline peaks exhibit very similar changes to the corresponding shifts as in the rhodium 1c* homoleptic complex spectrum.
In the 1H NMR spectrum of the heteroleptic Ir:1p:1c* = 1:1:1, many peaks overlap and not all peaks of the heteroleptic species could be assigned. From Table S1† it is apparent that all peaks shift to a smaller degree in comparison to their homoleptic iridium variants, even less so in comparison to their rhodium analogues. Despite the very high overlap of peaks in the 1H NMR spectrum, the percentage ratio of ligand 1p in the homoleptic to heteroleptic species can still be estimated by comparing integrals of all the present species, including the homoleptic and heteroleptic 1p peaks in the quantitative 31P NMR spectrum, obtaining a ratio of 13:14:43:30, where 43:30 ≈ 4:3 corresponds to the ratio of coordinated to non-coordinated ligand, respectively (ESI section 3.3.10 and 3.3.18†).
So far, metal complexes of ligand 1c*, featuring an amino acid and an additional chiral center at the oxazoline, have been discussed. In this paragraph, we describe metal complexes with ligand 1b (without chirality at the oxazoline), 1a (without amino acid and without chirality at the oxazoline) as well as with PPh3, namely 1p/PPh3, 1b/1b, 1b/1p, 1a/1p, 1a/PPh3, 1b/PPh3. Unexpectedly, similar NMR spectra were obtained for rhodium and iridium complexes prepared in situ with M:1p:PPh3 = 1:1:1 ligand ratio (ESI sections 3.4.12–3.4.13, 3.4.30 and 3.4.31†). In both cases, a mixture of roughly 1:1 homoleptic 1p and PPh3 metal complexes were obtained, along with unidentified species indicated by the presence of other peaks, one of which can be attributed to the heteroleptic species. An interesting change can be seen in the spectrum of Ir:1b = 1:2 (ESI section 3.3.4†) as well. The dimethyl group of the non-coordinated 1b ligand shows as a singlet peak at 1.28 ppm (ESI section 3.2,†1b), while the same group shows up as two peaks in the metal complex solution, at 1.41 and 1.43 ppm, respectively (ESI section 3.3.4†). This indicates that the oxazoline faces in the complex are no longer equivalent. A similar observation has been reported in our previous article for a similar oxazoline bioconjugate.63 However, in that report no such observations have been made for ligand 1b, even at elevated concentrations of 60 mM. To confirm that this phenomenon is facilitated by the formation of supramolecular interactions in the complex, additional spectra of iridium heteroleptic precatalyst complexes of the chiral/achiral combinations 1b/1p, 1a/1p, 1a/PPh3, 1b/PPh3 with an M:L1:L2 = 1:1:1 ratio were recorded. The oxazoline dimethyl group peak in the latter three cases (ESI section 3.4†) shows no splitting, while 1b/1p does exhibit peak splitting and in the case of 1b/PPh3 peak broadening is apparent. This emphasizes the importance of the alanine moieties in both ligands and their capability to facilitate supramolecular interactions. It is interesting to note that an addition of a second equivalent of 1b (Ir:1b:1p = 1:2:1; ESI section 3.4†) can partially push out ligand 1p from the complex.
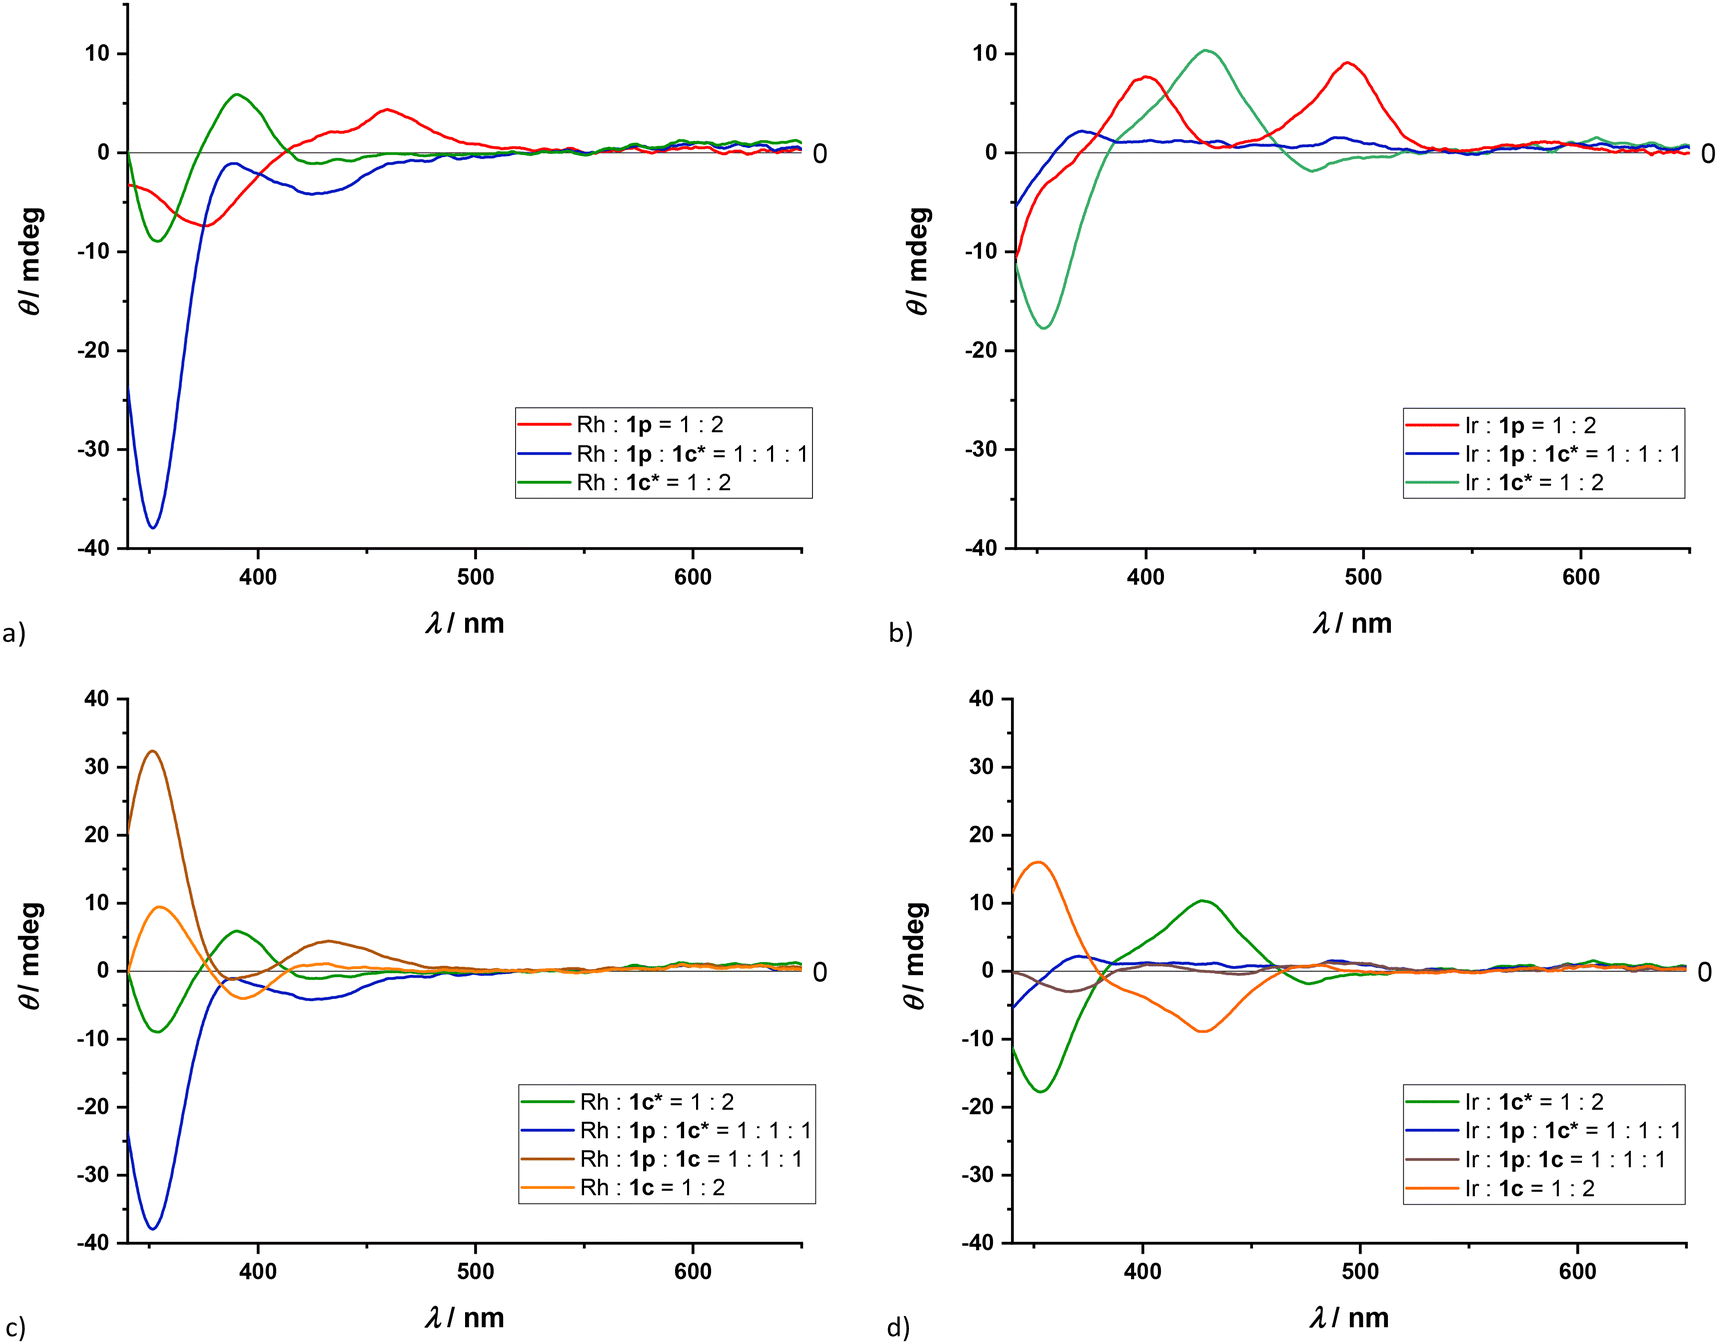 | ||
| Fig. 6 CD spectra (CH2Cl2) of rhodium(I) (a, c) and iridium(I) (b, d) complexes with selected ligands, see intercepts. In all cases the concentration of the metal cation is c(M+) = 0.38 mM. | ||
For complexes of 1p/1c* with both rhodium and iridium (Fig. 6a and b, respectively), there is a notable difference between the homoleptic and heteroleptic spectra. Moreover, the CD spectra of both rhodium and iridium heteroleptic solutions are evidently not a result of a simple addition of the corresponding homoleptic CD spectra. Another pronounced difference when comparing the heteroleptic spectra to their homoleptic variants is that in the spectrum of the heteroleptic rhodium solution an almost four-fold enhancement of the intensity of the peak at 350 nm can be observed (Fig. 6a and c). On the other hand, there seems to be a decrease of intensity of peaks in the spectrum of the heteroleptic iridium solution in comparison to their homoleptic variants (Fig. 6b and d). This finding is in agreement with the NMR results, where it was shown that barely 30% of the ligands in solution coordinate to the iridium cation heteroleptically.
The main contribution to induced chirality in oxazoline containing complexes is governed by the chirality at the oxazoline. This is evidenced by CD spectra of 1c and 1c* diastereisomeric derivatives that roughly correspond to spectra that two enantiomers would have (Fig. 6c and d). In contrast, the CD spectra of the heteroleptic 1c and 1c* iridium complexes do not show enantiomeric-like behavior, with diminished peak intensities.
For comparison, CD spectra of precatalytic rhodium complexes with two commercially available bisoxazoline ligands, (–)-2,2′-isopropylidenebis[(4S)-4-phenyl-2-oxazoline] and (+)-2,2′-isopropylidenebis[(4R)-4-benzyl-2-oxazoline] (BOX1 and BOX2), have been recorded (Fig. S53, S54, S56 and S57†). Notably, ellipticity for these ligands either has only positive values (BOX1) or negative values (BOX2) in the visible region of the spectrum (Fig. S53 and S54†). These spectra do not correspond to any of the spectra collected for our monodentate ligands, indicating that the chiral coordination sphere around the rhodium atom created by the bisoxazoline ligands is not analogous to the coordination sphere created by these monodentate ligands. This can be explained by the fact that in bisoxazoline ligands the two oxazolines are nearly coplanar, while monodentate ligands 1b–1d cannot assume coplanarity due to the bulky 2-(m-alanyl)phenyl substituents. However, this also excludes the possibility that the chiral environment around the metal is dependent only on the chiral center on position 4 of the oxazolines.
 | ||
| Fig. 7 ORTEP-3 molecular structure of [Rh(1c*)2COD]BF4 with atom numbering scheme and 30% ellipsoid probability level. The asymmetric unit of the structure consists of three residues (two C2-symetric [Rh(L)2COD]+ complexes and a [BF4]− anion; fully shown on Fig. S74†) and only symmetry-unique atoms are labelled, C2 symmetry related ligands 1c*i, 1c*ii and atoms from COD groups are not labelled and they are shown in the lighter tone. Symmetry codes (i): −x, y, −z; (ii): 1 − x, y, −z. | ||
The asymmetric unit of the obtained crystal structure contains parts of two crystallographically independent metal complex molecules, with their relative positions reflecting the I2 space group of the crystal lattice (Fig. S72†). Both 2-phenyl groups in individual ligands are offset from coplanarity with their directly attached oxazolines by 24.69°. This value is negligibly different from the 5°–22° torsion angle range found in crystal structures of similar, previously reported non-coordinated oxazoline bioconjugate ligands.63
In individual complex molecules no intramolecular hydrogen bonding is found, however, several other noncovalent interactions are present. In particular, the two ligands are positioned in a way that the two 2-phenyloxazoline groups within the complex are stacked in a C2-symmetric manner, with chiral 4-phenyl substituents facing outwards, but in plane with the square planar coordination of rhodium. The oxazoline planes are not coplanar with the square-planar coordination of the rhodium atom, rather, they are both twisted from this plane by 45.93° in a C2-symmetric manner, inducing a (P)-helical structure (Fig. S73 and S77a†). Although the (M)-helical version of this molecular structure can be envisioned, further structural considerations suggest that (4R)-phenyl substituents prevent formation of the (M)-helical analogue due to severe sterical issues. This type of relative placement of the two oxazolines varies greatly from the structure found in bisoxazoline ligands, where the two oxazolines are usually coplanar or bent towards each other (Fig. S77a–c†).67,68
The plane of a 2-phenyl group of one ligand is placed at an angle of 16.92° to the oxazoline plane of the other ligand, and the shortest contact is between the two C2O oxazoline carbon atoms (3.289 Å, less than the sum of two carbon atom van der Waals radii, 3.40 Å respectively; see the atom labeling scheme on Fig. S71†). As a consequence, the aliphatic oxazoline hydrogen atoms positioned on the inner face of the stacked oxazoline ring, H4O and H5OB, are directed towards the center of the 2-phenyl aromatic ring. This is in agreement with the significant upfield chemical shift of the corresponding 1H NMR peaks and the non-equivalence of oxazoline ring faces observed in the NMR spectra. Additionally, the 2-phenyl C2B1 carbon atom and the directly attached H2B1 hydrogen atom are positioned near rhodium at distances of 3.29 and 2.72 Å, respectively. These distances are smaller by 0.41 and 0.48 Å, than the corresponding 3.70 and 3.20 Å van der Waals radii sums of C–Rh and H–Rh, respectively. This observation is also in agreement with the very strong downfield shift of the corresponding peaks observed in the relating 1H and 13C NMR spectra.
In the solid-state structure, the complex molecules pack in (M)-helical-like supramolecular infinite columns. Each amide hydrogen atom is directed towards a BF4− anion, which bridges amide hydrogen atoms of adjacent complex molecules, while the amide carbonyl oxygen atoms are directed towards the cavities present in the crystal (Fig. S75†). The coordinating ability of the BF4− anion towards transition metals has been described as least coordinating.69 The two N–H⋯F–B distances are 2.16 and 2.53 Å, respectively; both less than the 2.57 Å sum of hydrogen and fluorine atom van der Waals radii. This indicates that the bridging has hydrogen bonding character. The adjacent columns, however, are not densely packed; they are rather offset, creating cavities between the columns, with smallest inter-atom distances in two vertical directions through the cavity being ∼9 Å (Fig. S76†). The third vertical direction is infinite, giving the cavities tunnel-like characteristics.
Enantioselective hydrogenation
:0.5–1:3), solvent (Table S3†), reaction temperature (−5 °C, 0 °C and room temperature) and reaction time (20 min–16 h) are collected in Table 1, Tables S2 and S3 and Graph S1†.
|
|
|||||||
|---|---|---|---|---|---|---|---|
| Reaction parameters | Metal precursor | ||||||
| Ir(COD)2BARF | Rh(COD)2BF4 | ||||||
| M:1p |
Cat. load./mol% | T/°C | t/h | Conv.b/% | ee/% | Conv.b/% | ee/% |
| a Reaction conditions: precatalytic complexes were formed in situ in CH2Cl2. The reaction mixtures were then injected with methyl α-acetamidocinnamate (c(S) = 6.7 mM) dissolved in CH2Cl2, pressurized with 20 bar of hydrogen and stirred at selected temperatures. b Conversion and selectivity were determined using GC-MS and chiral GC, respectively. c n.a. – not attempted. | |||||||
| 1:0.55 |
0.05 | −5 | 3 | n.a.c | n.a. | 18 | 66 (S) |
| 1:1.1 |
1.00 | r.t. | 16 | >99 | 82 (S) | >99 | 74 (S) |
| 0.50 | r.t. | 3 | 61 | 82 (S) | n.a. | n.a. | |
| 0.20 | r.t. | 3 | Traces | — | >99 | 72 (S) | |
| 0 | 3 | n.a. | n.a. | >99 | 72 (S) | ||
| 0.05 | −5 | 3 | n.a. | n.a. | 91 | 64 (S) | |
| 1:2.2 |
1.00 | r.t. | 16 | >99 | 84 (S) | >99 | 70 (S) |
| 0.50 | r.t. | 3 | 47 | 82 (S) | n.a. | n.a. | |
| 0.20 | r.t. | 3 | Traces | — | >99 | 72 (S) | |
| 0 | 3 | n.a. | n.a. | >99 | 70 (S) | ||
| 0.05 | −5 | 3 | n.a. | n.a. | 96 | 68 (S) | |
| 1:3.3 |
1.00 | r.t. | 3 | 20 | 82 (S) | >99 | 70 (S) |

In the tested catalytic reactions, both rhodium and iridium catalysts proved to be efficient and selective, as shown in Table 1. The rhodium catalyst successfully performed at much lower catalyst loadings and temperatures, retaining conversion and selectivity (up to 72% ee, at 0.05 mol%, −5 °C for 3 h). The iridium catalyst gave a slightly higher enantioselectivity; of up to 84% ee, but proved to be more sensitive to the variations of the reaction conditions. In particular, only partial conversion was achieved at 0.5 mol% of catalyst loading, r.t. and 3 h reaction time. The difference in sensitivity to reaction conditions is further emphasized by full conversion of rhodium catalyzed reactions in all screened solvents (except for MeCN), giving the highest selectivity in chloroform (85% ee) (Table S3†).
On the other hand, the iridium catalyst gave almost no conversion in most of the screened solvents other than CH2Cl2. As expected, use of a solvent which can disrupt hydrogen bonding, like tetrahydrofuran or isopropanol, resulted in the loss of enantioselectivity in the rhodium catalyzed reactions (Table S3†). However, retention of most of enantioselectivity (58% ee) was unexpectedly found in the hydrogenation reaction in trifluoroethanol. A similar occurrence has been reported previously in hydrogenation reactions with similar ligands in methanol.44 In all cases, the obtained selectivity with rhodium in CH2Cl2 as solvent was retained within the margin of error, regardless of the variations in reaction conditions (Table 1). This suggests that the catalytically active species is the same in all explored cases, and that only the amount of the catalytically active species that had formed varied. Various ligand to metal ratios were also studied during reaction optimization with iridium, revealing that using less ligand equivalents than one or more than two significantly affected conversion of the substrate (Table 1, Graph S1†). These results with both rhodium and iridium are an improvement in comparison to our previously reported results with this ligand, where the obtained result with [Rh(COD)(MeCN)2]BF4 as the catalyst precursor in CH2Cl2 afforded the product with 61% ee.45 As the solvent screening showed that acetonitrile as solvent causes complete loss of selectivity, the difference in our results can be attributed to catalyst poisoning by small amounts of acetonitrile introduced through the metal precursor. To the best of our knowledge, this makes one of the smallest supramolecular bidentate catalysts for asymmetric hydrogenation with ee >82% without any central or axial chirality integrated close to the metal center, alongside results published by Wenz et al.41 In order to assess whether the supramolecular interactions are responsible for the chiral induction, additional reactions with only triphenylphosphine (Table S2,† entry 5) and reactions with M:1p:PPh3 = 1:1:1 ratio were carried out (Table S5,† entry 31). In all cases full conversions were achieved, however, enantioselectivity dropped by roughly 20% in rhodium and iridium 1p/PPh3 catalyzed reactions.
Additionally, four trisubstituted olefin derivatives (Fig. S1†) were synthesized according to a previously described procedure,70 of which the naphthyl derivative can be used as a precursor for an analgesic SDZNKT343.71 All four substrates have been subjected to hydrogenation by both the rhodium and iridium homoleptic 1p catalyst (metal:ligand = 1:2.2); results are collected in Table 2. Almost complete conversions were achieved for all additional substrates, except for the tiophen-2-yl derivative. The obtained selectivity with iridium is mostly analogous to the results obtained for the benchmark phenyl substrate (∼80% ee).
|
|
||||
|---|---|---|---|---|
| Substrate | Metal precursor | |||
| Ir(COD)2BArF | Rh(COD)2BF4 | |||
| R | Conv.b/% | ee/% | Conv.b/% | ee/% |
| a Reaction conditions: precatalytic complexes were formed in situ in CH2Cl2 (1 mol%) in an inert argon atmosphere. The reaction mixtures were then injected with substrates (c(S) = 6.7 mM in the reaction mixture) dissolved in CH2Cl2, pressurized with 20 bar of hydrogen and stirred at room temperature for 16 h. Catalyst concentration in the reaction mixture was c(cat.) = 0.067 mM. b Conversion and selectivity were determined using GC-MS and chiral GC, respectively. c n.a. – not attempted. | ||||
| Phenyl | >99 | 84 (S) | >99 | 70 (S) |
| 4-Cl-phenyl | >99 | 82 (S) | >99 | 64 (S) |
| Tiophen-2-yl | 28 | 44 (S) | n.a.c | n.a.c |
| Tiophen-3-yl | >99 | 82 (S) | >99 | 65 (S) |
| Naphth-2-yl | >99 | 78 (S) | >99 | 62 (S) |

| Reaction parameters | Metal precursor | ||||||
|---|---|---|---|---|---|---|---|
| Ir(COD)2BArF | Rh(COD)2BF4 | ||||||
| Ligands | M:L1:L2 |
Catalyst loading/mol% | t/h | Conv./%b | ee/% | Conv./%b | ee/% |
| a Reaction conditions: precatalytic complexes were formed in situ in CH2Cl2 in an inert argon atmosphere. The reaction mixtures were then injected with methyl α-acetamidocinnamate (c(S) = 6.7 mM) dissolved in CH2Cl2, pressurized with 20 bar of hydrogen and stirred at room temperature for the indicated time. b Conversion and selectivity were determined using GC-MS and chiral GC, respectively. c n.a. – not attempted. | |||||||
| 1b | 1:2.2 |
1 | 3 | 0 | 0 | n.a. | n.a. |
| 1p, 1b | 1:1.1:1.1 |
1 | 16 | 72 | 70 (S) | >99 | 72 (S) |
| 0.5 | 3 | 16 | 74 (S) | >99 | 70 (S) | ||
| 0.2 | 3 | Traces | — | >99 | 72 (S) | ||
| 0.05 | 3 | n.a.c | n.a.c | 86 | 64 (S) | ||
| 1:1.1:2.2 |
1 | 16 | 39 | 65 (S) | n.a.c | n.a.c | |
| 1p, 1c | 1:1.1:1.1 |
1 | 16 | 92 | 64 (S) | >99 | 70 (S) |
| 1p, 1c* | 1:1.1:1.1 |
1 | 5 | 71 | 85 (S) | >99 | 71 (S) |
| 1p, 1d | 1:1.1:1.1 |
1 | 16 | 91 | 62 (S) | >99 | 72 (S) |
As expected, the oxazoline ligands by themselves do not form active catalysts for enantioselective hydrogenation (Table 3, first row). However, they may be added to modify the catalyst structure. Upon reviewing results obtained by rhodium catalysis there seems to be no apparent influence of added oxazoline ligands. On the other hand, the apparent lower activity of iridium makes it suitable for screening these types of heteroleptic catalysts. Reactions with added oxazoline ligands proceeded in all cases with somewhat lower conversions than the analogous reactions with the homoleptic 1p catalyst at the same conditions. The selectivity also dropped roughly by 20% ee in all cases except for the heteroleptic complex containing ligand 1c*, derived from (R)-phenylglycinol. This indicates the matching effect of the chiral elements of 1p and 1c* ligands. These results confirm that oxazolines are capable of inserting into the complex and the choice of substituents on the oxazoline ring plays the role in affecting the coordination sphere, and consequently affect the yield and selectivity.
Hydroformylation reactions
Styrene and 1-octene were chosen as substrates for asymmetric hydroformylation in order to screen the activity, regioselectivity and enantioselectivity of the in situ generated homoleptic 1p rhodium complex (Table 4 and Table S7†). In the hydroformylation of styrene, the best result was achieved when n-hexane was used as a solvent, at 40 °C, yielding a 3:97 linear to branched mixture and 40% ee of the branched enantiomeric product. These results are comparable to the results obtained for styrene in toluene, catalyzed by heteroleptic complexes, with dipeptidic triphenylphosphine and diphenylpyridylphosphine ligands, developed by Laungani et al.47
|
|
||||||
|---|---|---|---|---|---|---|
| Substrate | Ligand | Solvent | T/°C | Conv./% | l:b |
ee/% |
| a Reaction conditions: precatalytic complexes were formed in situ in a solvent prior to catalysis (1 mol%) in an inert argon atmosphere. The reaction mixtures were then injected with substrates (c(S) = 6.7 mM in the reaction mixture) dissolved in dry solvent and pressurized with p(H2/CO) = 20 bar, at selected temperatures for 16 h. Catalyst concentration in the reaction mixture was c(cat.) = 0.067 mM. The products were then converted to corresponding alcohols by reducing with NaBH4 (added at 0 °C) and stirring for another 4 h at room temperature. b Conversion and selectivity were determined using GC-MS and chiral GC, respectively. c n.d. = not determined. | ||||||
| Styrene | 1p | Toluene | 70 | >99 | 7:93 |
16 |
| 1p | Toluene | 40 | 35 | <1:99 |
24 | |
| 1d | Toluene | 70 | >99 | 37:63 |
0 | |
| 1d/PPh3 | Toluene | 25 | 84 | <1:99 |
14 | |
| None | n-Hexane | 40 | 51 | 20:80 |
n.d.c | |
| 1p | n-Hexane | 40 | 98 | 3:97 |
40 | |
| 1p | n-Hexane | 25 | 86 | 2:98 |
23 | |
| PPh3 | n-Hexane | 40 | >99 | 6:94 |
n.d. | |
| 1p/PPh3 | n-Hexane | 40 | >99 | 6:94 |
8 | |
| 1d/PPh3 | n-Hexane | 40 | >99 | 5:95 |
7 | |
| 1c | n-Hexane | 40 | 36 | 11:89 |
7 | |
| 1c* | n-Hexane | 40 | 64 | 14:86 |
6 | |
| 1p/1c* | n-Hexane | 40 | 96 | 8:92 |
4 | |
| 1p | CF3CH2OH | 25 | >99 | <1:99 |
18 | |
| 1p | C6H5Cl | 40 | 75 | 2:98 |
0 | |
| 1-Octene | 1p | C6H5Cl | 40 | 35 | 93:7 |
n.d. |
| 1p | Toluene | 40 | 94 | 82:18 |
0 | |
| 1p | n-Hexane | 40 | 60b | 87:13 |
0 | |
| 1p | CH2Cl2 | 40 | 77 | 80:20 |
0 | |
| 1p | THF | 40 | 79 | 75:25 |
0 | |

Hydroformylation reactions were also carried out using only the rhodium metal precursor, and homoleptic and heteroleptic complexes with PPh3 and oxazoline ligands. Unlike the previously shown hydrogenation reactions where both the rhodium and iridium metal compounds without ligands yielded no conversion, [Rh(acac)(CO)2] has shown significant catalytic activity even without ligands. Additionally, results obtained from reactions carried out with homoleptic complexes of oxazolines have shown different results compared to the reaction with only the metal precursor, indicating that the catalytically active complex is an oxazoline–Rh complex, and not just the precursor. Heteroleptic complexes of 1p with PPh3 or oxazolines gave almost complete conversions and similar linear to branched product ratios, but the obtained enantioselectivity is noticeably lower than for the homoleptic 1p complex. The drop in the selectivity observed when comparing the reactions with only 1p as the ligand and a 1p/PPh3 ligand mix illustrates that it is important to have a complex with two 1p ligands in order to achieve chiral selectivity, as the [Rh(1p)2]+ complex can participate in optimal hydrogen bonding.47,58
Similarly, results obtained for 1-octene are analogous to results obtained with triphenylphosphine (up to 25% of the branched product vs. 28%, respectively, and racemic mixture of the branched product in both cases),61 indicating that the alanine moieties might have little to no influence in hydroformylation of 1-octene.
Conclusion
Asymmetric hydrogenation and hydroformylation have been successfully carried out utilizing supramolecularly assembled metal complexes with “backdoor induction” of chirality, composed of amino acid bioconjugate triphenylphosphine and oxazoline ligands. The in situ generated homoleptic and heteroleptic rhodium and iridium catalysts, as well as their capabilities to self-assemble, have been studied by NMR, UV-VIS and CD spectroscopy, as well as X-ray diffraction. The NMR studies showed that conversions to precatalytic [ML2COD]+ complexes were above >9:1 for both homoleptic and heteroleptic derivatives of rhodium, while incomplete conversions were obtained with iridium, 3:1 and 1:2 for 1p and 1c* homoleptic complexes, respectively; and for the heteroleptic derivative, 4:3. In the case of all analyzed precatalytic metal complexes, however, significant presence of non-covalent interactions can be observed. Specifically, strong hydrogen bonding was found in the homoleptic 1p complexes and several significant upfield and downfield shifts of amide, aromatic and aliphatic peaks of ligand 1c* in all related complexes. Stability of the homoleptic 1c* rhodium complex, observed from NMR studies, allowed the crystallization of the corresponding single crystals and the structure in the solid state was confirmed to be [Rh(1c*)2COD]BF4. CD spectroscopy confirmed induction of chirality around the corresponding metal atom. Moreover, “backdoor induction” of chirality was confirmed for precatalytic homoleptic complexes of 1p. On the other hand, the obtained results for heteroleptic cases showed pronounced differences to their homoleptic analogues, further confirming formation of the heteroleptic species.
The rhodium catalyst proved to be very active in hydrogenation of enamides, even at low catalyst loading of 0.05 mmol%. It afforded full conversions in a number of other solvents and ee up to 85% and 74% ee in chloroform and dichloromethane, respectively. The analogous iridium catalyst is slower in hydrogenation of the dehydroamino acids and shows full conversion with selectivity up to 84% ee only in dichloromethane. Comparable results were obtained when these complexes were applied to hydrogenation of other dehydroamino acid methyl esters. Interestingly, oxazolines only affected the catalytic conversion and selectivity in iridium catalyzed reactions, while there was no apparent influence in rhodium catalyzed reactions. In particular, the choice of substituents on the position 4 of the oxazoline ring is emphasized, where only the addition of ligand 1c* retains the enantioselectivity (85% ee) due to a matching effect of 2 different chiral ligands. Additionally, the phosphine ligand 1p was applied to asymmetric hydroformylation of two substrates, achieving linear to branched ratios of up to <1:99. Enantioselectivity with styrene as the substrate of up to 40% ee was obtained. The results presented herein offer a simple comparison between properties of supramolecular rhodium and iridium catalysts for asymmetric hydrogenation and hydroformylation, as well as confirm that rhodium and iridium are promising candidates for the design and application of heteroleptic catalysts.
Experimental
General remarks
Reactions, which did not require the use of inert argon atmosphere, were carried out in ordinary glassware and chemicals were used as purchased from commercial suppliers without further purification. All amino acids and amino acid-derived amino alcohols used have (S)-configuration, unless stated otherwise. All amino acid substituents are denoted with their standard abbreviations, while amino alcohol substituents are, if applicable, denoted with their parent amino acid abbreviation and the hash symbol (e.g. Phg# stands for phenylglycinol). Coupling reagent abbreviations refer to the following compounds: 2-(1H-benzotriazole-1-yl)-1,1,3,3-tetramethylaminium tetrafluoroborate (TBTU), 1-hydroxybenzotriazole (HOBt), 1-[bis(dimethylamino)methy-lene]-1H-1,2,3-triazolo[4,5-b]pyridinium 3-oxide hexafluoro-phosphate (HATU). Reactions were monitored by TLC on silica gel 60 F254 plates and detected with a UV lamp (254 nm); crude products were purified using classic column or flash chromatography. ESI mass spectra were recorded on a HPLC-MS system (Agilent Technologies 1200) coupled with a 6410 Triple-Quadrupole mass spectrometer, operating in a positive ESI mode. High-resolution mass spectra were recorded on Agilent 6210 Time-of-Flight LC/MS (ESI). UV-Vis spectra were recorded on Cary 100 spectrophotometer and CD spectra were recorded on Jasco J-815 spectropolarimeter in 1.0 cm and 0.1 cm quartz Suprasil cells. Stock solutions of the isolated compounds were prepared for UV-Vis and CD measurements. The measured absorbance A (in UV-Vis) is converted to concentration-independent ε [M−1 cm−1] through the Lambert–Beer equation. The measured ellipticity θ [°] (in CD) is converted into the concentration independent Δε [M−1 cm−1] through the relation Δε = θ/(b × 32982 × c), where b [cm] is the path length and c [M] is the concentration. NMR spectra were obtained on a Bruker Avance AV300 or AV600 spectrometer, operating at 300 or 600 MHz for 1H and 75 or 150 MHz for 13C; if not indicated further, the spectra were recorded at room temperature. Chemical shifts, δ (ppm), indicate a downfield shift from the internal standard, tetramethylsilane, TMS. Coupling constants, J, are given in Hz. Individual peaks are marked as: singlet (s), doublet (d), triplet (t), quartet (q), quintet (quin.) or multiplet (m). GC-MS data were recorded on Agilent 7890/5977 and Agilent 8860 GC/Agilent 5977 MSD with a SST EI 350 instruments and chiral GC data on Agilent 8890 GC instrument with a FID.
:7 (MeOH:H2O) ratio was reached. A mixture of white solution with brown solid/oil and light brown oil was obtained. The mixture was cooled in the fridge and then filtered off. The filtered product mixture was dissolved in MeOH and heated to 80 °C in an oil bath and then H2O was added dropwise until 2:1 (MeOH:H2O) ratio was reached (or 1:1 if necessary). A light yellow solid was filtered under nitrogen over G4 frit sieve, washed with very small amounts of cold MeOH/H2O and dried with a continuous nitrogen stream. The product was used in the next step without further purification.45 Yield: 1.94 g (6.3 mmol, 79%). 1H NMR (600 MHz, CDCl3) δ/ppm: 8.10–8.03 (m, 2H), 7.54–7.47 (m, 1H), 7.47–7.41 (m, 1H), 7.36–7.27 (m, 10H). 31P NMR (243 MHz, CDCl3) δ/ppm: −5.35.
:6 = EtOAc:EtOH solvent mixture which was gradually changed to 1:1 = EtOAc:EtOH. Yield: 609.08 mg (1.6 mmol, 78%), colorless gel. 1H NMR (300 MHz, CD2Cl2) δ/ppm: 7.82–7.67 (m, 2H), 7.51–7.24 (m, 12H), 6.59 (d, J = 7.3 Hz, 1H), 4.68 (quin., J = 7.2 Hz, 1H), 3.74 (s, 3H), 1.46 (d, J = 7.2 Hz, 3H). 31P NMR (122 MHz, CD2Cl2) δ/ppm: −5.51. 13C NMR (75 MHz, CD2Cl2) δ/ppm: 173.73, 166.55, 139.05, 138.88, 137.11, 137.09, 137.01, 136.96, 136.95, 136.81, 134.72, 134.70, 134.27, 134.01, 132.75, 132.42, 129.40, 129.17, 129.10, 129.08, 128.99, 127.71, 52.78, 48.93, 18.57. MALDI-HRMS (m/z): expected 392.1415 (C23H22NO3P), observed 392.1407. UV-Vis [c(1p) = 0.06 mM, CH2Cl2; λmax, nm (ε, M−1 cm−1)]: 233 (17727), 260 (sh, 10547). CD [c(1p) = 0.38 mM, CH2Cl2; θmax, nm (εCD, M−1 cm−1)]: 266 (−2.66).
:hexane = 2:8 → pure EtOAc. Yield: 193.23 mg (0.68 mmol, 45%), yellow oil. 1H NMR (300 MHz, CDCl3) δ/ppm: 7.80–7.66 (m, 2H), 7.57–7.37 (m, 3H), 6.19 (s, 1H), 3.70 (s, 2H), 1.42 (s, 6H). 13C NMR (75 MHz, CDCl3) δ/ppm: 168.56, 134.91, 131.74, 128.72, 127.01, 77.58, 77.16, 76.73, 70.82, 56.57, 24.80.
“One pot” peptide coupling procedure in CH2Cl2 (compounds 3b, 3c, 3c* and 3d)
Isophthalic acid (1 equivalent) was dissolved in CH2Cl2 (100 mL). HATU (1 equivalent) and DIPEA (2 equivalents) were added and stirring was continued for 60 min. (S)-Ala–OMe·HCl (0.5 equivalent) and an amino alcohol (0.5 equivalent) in CH2Cl2 (10 mL) were added dropwise and stirring was continued for 24 hours. Afterwards, the procedure of adding the coupling reagent, DIPEA and amines was then repeated in the same manner as stated above. The reaction mixture was washed with NaHCO3 (sat. aq., 3 × 100 ml), citric acid (10% aq., 3 × 100 mL) and NaCl (sat. aq. 100 mL). The organic phase was dried over NaSO4, filtered and evaporated under reduced pressure to yield the crude product.63:ethyl acetate = 2:8. A colorless oil 2 (130.4 mg, 39%) and a white solid 3b (97.0 mg, 15%) were isolated. Mr(C16H20N2O6) = 322.15. ESI-MS (m/z): 323.1 (M + H+), 645.2 (2M + H+), 667.2 (2M + Na+). 1H NMR (300 MHz, CD2Cl2) δ/ppm: 8.28 (td, J = 1.8, 0.6 Hz, 1H), 7.99 (dddd, J = 33.8, 7.8, 1.8, 1.2 Hz, 2H), 7.51 (td, J = 7.8, 0.6 Hz, 1H), 6.76 (d, J = 7.2 Hz, 1H), 4.75 (quin., J = 7.2 Hz, 1H), 4.13 (s, 2H), 3.77 (s, 3H), 1.51 (d, J = 7.2 Hz, 3H), 1.36 (s, 6H). 13C NMR (151 MHz, CDCl3) δ/ppm: 174.11, 167.64, 166.15, 135.54, 133.75, 130.55, 130.07, 129.01, 125.34, 70.31, 56.76, 52.84, 48.79, 24.63, 24.59, 18.22.
:hexane = 1:1 → pure EtOAc. Yield: 185.2 mg (0.5 mmol, 13%), yellowish solid. 1H NMR (300 MHz, CDCl3) δ/ppm: 8.18 (t, J = 1.9 Hz, 1H), 7.85–7.76 (m, 2H), 7.48 (d, J = 7.4 Hz, 2H), 7.34–7.25 (m, 7H), 5.41–5.27 (m, 1H), 4.82 (t, J = 7.3 Hz, 1H), 4.18–3.90 (m, 2H), 3.82 (s, 3H), 3.36 (s, 1H), 1.54 (d, J = 7.3 Hz, 3H).
:hexane = 1:1 → pure EtOAc. Yield: 328.8 mg (0.9 mmol, 30%), white solid. 1H NMR (300 MHz, CDCl3) δ/ppm: 8.21 (t, J = 1.8 Hz, 1H), 7.84 (dddd, J = 21.8, 7.8, 1.8, 1.2 Hz, 2H), 7.45–7.31 (m, 7H), 5.35–5.23 (m, 1H), 4.79 (quin., 1H), 4.03–4.01 (m, 2H), 3.73 (s, 3H), 1.51 (d, J = 7.3 Hz, 3H). 13C NMR (75 MHz, CDCl3) δ/ppm: 174.52, 167.17, 166.69, 139.35, 134.70, 133.13, 131.25, 130.48, 129.03, 128.80, 127.77, 126.94, 124.99, 65.99, 60.53, 56.52, 52.92, 48.96, 21.17, 17.70, 14.31.
Traces of tetramethylurea (TMU) were present in some precursors after column chromatography, δ(TMU)/ppm: 2.80 in 1H NMR (CDCl3). If there was a significant amount of TMU present in the samples of precursors, corresponding precursor yields were calculated from their NMR spectra.
General oxazoline cyclization procedure (compounds 1a–d)
Diethylaminosulfur trifluoride (1.5 equivalents in 1 mL of dry CH2Cl2) was added dropwise to a cooled solution (−78 °C) of precursor (1 equivalent) in dry CH2Cl2 (14 mL). After stirring for 1 h at −78 °C, anhydrous K2CO3 (1.5 equivalents) was added in one portion and the mixture was allowed to warm to room temperature. The reaction was quenched with saturated aqueous NaHCO3 (20 mL). The biphasic mixture was extracted with EtOAc (three times with 40 mL). The combined organic extracts were washed with NaCl (sat. aq., 100 mL), dried over anhydrous Na2SO4 and concentrated.72:hexane = 2:8 → EtOAc:hexane = 1:1. Yield: 110.13 mg (0.6 mmol, 92%), colorless oil. 1H NMR (300 MHz, CD2Cl2) δ/ppm: 7.95–7.85 (m, 2H), 7.53–7.40 (m, 3H), 4.09 (s, 2H), 1.34 (s, 6H). 13C NMR (75 MHz, CDCl3) δ/ppm: 162.19, 131.30, 128.38, 128.34, 128.15, 79.23, 67.67, 28.54. MALDI-HRMS (m/z): expected 176.1075 (C11H13NO), observed 176.1074.
:ethyl acetate = 7:3. Yield: 173.3 mg (0.6 mmol, 57%), colorless oil. Mr(C16H20N2O4) = 304.14. ESI-MS (m/z): 305.2 (M + H+). 1H NMR (300 MHz, CDCl3) δ/ppm: 8.29 (s, 1H), 8.07 (d, J = 7.8 Hz, 1H), 7.99 (d, J = 7.8 Hz, 1H), 7.50 (t, J = 7.8 Hz, 1H), 6.77 (d, J = 6.6 Hz, 1H), 4.82 (quin., J = 7.2 Hz, 1H), 4.14 (s, 2H), 3.79 (s, 3H), 1.53 (d, J = 7.2 Hz, 3H), 1.40 (s, 6H). 13C NMR (75 MHz, CD2Cl2) δ/ppm: 173.79, 166.64, 161.32, 134.65, 131.42, 130.36, 129.12, 129.08, 126.62, 79.66, 68.21, 54.56, 54.20, 53.84, 53.48, 53.12, 52.80, 49.00, 28.51, 18.55. MALDI-HRMS (m/z): expected 305.1501, 327.1315 (C16H20N2O4), observed 305.1496, 327.1315.
:hexane = 1:1 → pure EtOAc. Yield: 66.6 mg (0.2 mmol, 36%), colorless oil. 1H NMR (300 MHz, CDCl3) δ/ppm: 8.43 (t, J = 1.8 Hz, 1H), 8.10 (ddt, J = 38.6, 7.8, 1.5 Hz, 2H), 7.54 (t, J = 7.8 Hz, 1H), 7.42–7.18 (m, 5H), 6.85 (d, J = 7.4 Hz, 1H), 5.41 (dd, J = 10.2, 8.2 Hz, 1H), 4.93–4.76 (m, 2H), 4.32 (t, J = 8.3 Hz, 1H), 3.78 (s, 3H), 1.53 (d, J = 7.2 Hz, 3H), 1.26 (t, 2H). 1H NMR (600 MHz, CD2Cl2) δ/ppm: 8.41 (td, J = 2.3, 1.8, 0.5 Hz, 1H), 8.15 (dt, J = 7.7, 1.4 Hz, 1H), 7.98 (ddd, J = 7.8, 1.9, 1.2 Hz, 1H), 7.54 (td, J = 7.8, 0.6 Hz, 1H), 7.47–7.15 (m, 5H), 6.85 (d, J = 7.4 Hz, 1H), 5.40 (dd, J = 10.1, 8.2 Hz, 1H), 4.83 (dd, J = 10.2, 8.4 Hz, 1H), 4.75 (quin., J = 7.3 Hz, 1H), 4.30 (t, J = 8.3 Hz, 1H), 3.76 (s, 3H), 1.50 (d, J = 7.2 Hz, 3H). 13C NMR (151 MHz, CDCl3) δ/ppm: 173.63, 166.12, 164.14, 142.10, 134.32, 131.66, 130.96, 129.04, 128.98, 127.97, 127.93, 126.90, 126.86, 126.57, 75.20, 70.35, 52.69, 48.74, 48.70, 18.58. 1MALDI-HRMS (m/z): expected 353.1501, 375.1315 (C20H20N2O4), observed 353.1493, 375.1316. UV-Vis [c(1c) = 0.06 mM, CH2Cl2; λmax, nm (ε, M−1 cm−1)]: 234 (16412), 248 (sh, 11752). CD [c(1c) = 0.38 mM, CH2Cl2; θmax, nm (εCD, M−1 cm−1)]: 266 (−7.14).
:hexane = 1:1 → pure EtOAc. Yield: 232.8 mg (0.7 mmol, 83%), colorless oil. 1H NMR (300 MHz, CDCl3) δ/ppm: 8.44 (td, J = 1.8, 0.5 Hz, 1H), 8.10 (ddt, 2H), 7.54 (td, J = 7.8, 0.6 Hz, 1H), 7.45–7.26 (m, 5H), 6.87 (d, J = 7.4 Hz, 1H), 5.42 (dd, J = 10.1, 8.2 Hz, 1H), 4.95–4.74 (m, 2H), 4.33 (t, J = 8.4 Hz, 1H), 3.78 (s, 3H), 1.52 (d, J = 7.2 Hz, 3H). 13C NMR (151 MHz, CD2Cl2) δ/ppm: 173.80, 166.24, 164.15, 142.79, 134.77, 131.70, 130.79, 129.24, 129.10, 128.49, 128.01, 127.19, 127.13, 126.96, 75.47, 70.54, 52.79, 49.04, 18.46. MALDI-HRMS (m/z): expected 353.1501, 375.1315 (C20H20N2O4), observed 353.1492, 375.1312. UV-Vis [c(1c*) = 0.06 mM, CH2Cl2; λmax, nm (ε, M−1 cm−1)]: 235 (18271), 249 (sh, 13063). CD [c(1c*) = 0.38 mM, CH2Cl2; θmax, nm (εCD, M−1 cm−1)]: 267 (10.02).
:hexane = 3:7 → EtOAc:hexane = 1:1. Yield: 226.2 mg (0.6 mmol, 67%), white solid. 1H NMR (300 MHz, CDCl3) δ/ppm: 8.31 (t, J = 1.8 Hz, 1H), 8.04 (ddt, J = 26.5, 7.9, 1.5 Hz, 2H), 7.51 (t, J = 7.8 Hz, 1H), 7.40–7.19 (m, 5H), 6.80 (d, J = 7.3 Hz, 1H), 4.82 (quin., J = 7.2 Hz, 1H), 4.70–4.53 (m, 1H), 4.27 (dt, 2H), 3.79 (s, 3H), 3.32–2.65 (m, 2H), 1.54 (d, J = 7.2 Hz, 3H). 13C NMR (151 MHz, CDCl3) δ/ppm: 173.66, 166.20, 163.44, 137.89, 134.31, 131.50, 130.71, 129.38, 128.99, 128.82, 128.74, 128.22, 126.75, 126.42, 72.23, 68.04, 52.71, 48.72, 41.88, 18.64. MALDI-HRMS (m/z): expected 367.1658, 389.1469 (C21H22N2O4), observed 367.1649, 389.1469.
Precatalytic Rh(I) and Ir(I) complexes
Stock solutions of [Rh(COD)2]BF4 and [Ir(COD)2]BArF and ligands in dry CH2Cl2 (or CD2Cl2 for NMR measurements) were prepared under argon. All spectroscopic measurements were performed under argon by injecting the cuvettes or Young NMR tubes via Hamilton needles with the metal precursor and ligand in a desired ratio and diluted to selected concentrations.![[thin space (1/6-em)]](https://www.rsc.org/images/entities/b_char_2009.gif) :1p = 1:2 solution.
[Rh(COD)2]BF4 (4.87 mg, 0.012 mmol), 1p ligand (9.79 mg, 0.025 mmol), 0.5 mL of deuterated dichloromethane. 1H NMR (600 MHz, CD2Cl2) δ/ppm: 7.85 (s, 2H), 7.77 (d, J = 7.2 Hz, 2H), 7.68 (m, 6H), 7.60–7.54 (m, 2H), 7.51–7.44 (m, 6H), 7.39 (m, 8H), 7.36–7.26 (m, 2H), 7.13 (m, 2H), 5.55 (m, 2H), 4.79–4.72 (m, 2H), 4.66 (quin., J = 7.3 Hz, 2H), 4.48 (m, 2H), 3.82 (s, 6H), 2.61 (m, 2H), 2.53–2.43 (m, 2H), 2.28–2.19 (m, 2H), 1.50 (d, J = 7.4 Hz, 6H). 31P NMR (243 MHz, CD2Cl2) δ/ppm: 27.08 (d, J = 145.4 Hz). 13C NMR (151 MHz, CD2Cl2) δ/ppm: 175.08, 165.54, 136.18, 136.13, 136.09, 135.57, 135.53, 135.49, 134.65, 134.62, 134.58, 133.82, 133.13, 132.42, 132.34, 131.76, 131.46, 130.97, 130.68, 130.07, 129.78, 129.39, 129.36, 129.32, 129.29, 129.26, 129.14, 128.98, 128.82, 128.79, 128.75, 128.65, 100.92, 99.68, 53.03, 49.24, 31.69, 30.20, 28.39, 17.43. UV-Vis [c(Rh) = 0.03 mM, CH2Cl2; λmax, nm (ε, M−1 cm−1)]: 236 (41895), 267 (sh, 22217), 442 (140). CD [c(Rh) = 0.03 mM, CH2Cl2; θmax, nm (εCD, M−1 cm−1)]: 274 (−4.26), 304 (−2.45), 373 (−0.96), 434 (0.42), 449 (0.59).
:1p:1c* = 1:1:1 solution.
[Rh(COD)2]BF4 (9.74 mg, 0.024 mmol), 1p ligand (9.79 mg, 0.025 mmol), 1c* ligand (8.08 mg, 0.025 mmol), 0.5 mL of deuterated dichloromethane. 1H NMR (600 MHz, CD2Cl2) δ/ppm: 10.30 (s, 1H), 8.47 (d, J = 7.8 Hz, 1H), 8.33 (d, J = 11.2 Hz, 1H), 8.17 (dd, J = 7.9, 1.4 Hz, 1H), 7.99–7.92 (m, 2H), 7.89 (dq, J = 7.8, 1.4 Hz, 1H), 7.68 (t, J = 7.9 Hz, 2H), 7.61 (td, J = 7.8, 2.1 Hz, 2H), 7.56–7.32 (m, 13H), 7.29–7.24 (m, 1H), 4.90–4.81 (m, 2H), 4.71–4.61 (m, 2H), 4.50–4.40 (m, 2H), 4.00–3.93 (m, 1H), 3.83 (s, 3H), 3.75 (s, 3H), 3.54 (q, J = 6.1, 3.9 Hz, 1H), 3.49–3.42 (m, 1H), 2.71–2.54 (m, 2H), 2.32–2.20 (m, 2H), 2.15–2.04 (m, 2H), 1.61 (d, J = 7.2 Hz, 3H), 1.66–1.59 (m, 2H), 1.53 (d, J = 7.3 Hz, 3H). 31P NMR (243 MHz, CD2Cl2) δ/ppm: 25.47, 24.85. 13C NMR (151 MHz, CD2Cl2) δ/ppm: 173.88, 173.83, 167.90, 166.28, 165.83, 140.52, 136.24, 136.19, 135.64, 135.56, 134.94, 134.74, 134.67, 134.60, 133.78, 133.71, 133.63, 133.54, 133.08, 132.54, 132.14, 131.63, 131.61, 130.77, 130.60, 130.33, 130.23, 130.21, 130.17, 129.78, 129.72, 129.55, 129.49, 129.43, 129.32, 129.25, 129.18, 128.97, 128.90, 128.13, 127.86, 127.77, 124.69, 108.01, 107.96, 105.99, 102.45, 102.39, 81.88, 81.80, 78.93, 78.85, 77.34, 76.27, 71.92, 71.38, 52.91, 52.79, 49.44, 49.28, 34.80, 30.87, 30.09, 29.21, 28.38, 27.08, 18.03, 17.86. UV-Vis [c(Rh) = 0.03 mM, CH2Cl2; λmax, nm (ε, M−1 cm−1)]: 236 (40006), 291 (sh, 8804), 407 (1948). CD [c(Rh) = 0.03 mM, CH2Cl2; θmax, nm (εCD, M−1 cm−1)]: 248 (5.63), 271 (6.65), 297 (6.61), 350 (−4.47), 422 (−0.59).
:1c* = 1:2 solution.
[Rh(COD)2]BF4 (4.87 mg, 0.012 mmol), 1c* ligand (8.08 mg, 0.025 mmol), 0.5 mL of deuterated dichloromethane. 1H NMR (600 MHz, CD2Cl2) δ/ppm: 10.08 (s, 2H), 9.06 (d, J = 7.6 Hz, 2H), 8.47–8.35 (m, 2H), 7.93 (t, J = 7.7 Hz, 2H), 7.59 (d, J = 7.1 Hz, 2H), 7.31–7.25 (m, 6H), 6.95 (dd, J = 7.5, 2.1 Hz, 4H), 4.79 (quin., J = 7.2 Hz, 2H), 4.05 (dd, J = 8.8, 3.2 Hz, 2H), 3.97 (dd, J = 9.4, 3.1 Hz, 2H), 3.86–3.79 (m, 4H), 3.78 (s, 6H), 3.69 (t, J = 9.0 Hz, 2H), 2.70 (dddd, J = 15.3, 10.2, 8.6, 6.7 Hz, 2H), 2.14 (dddd, J = 13.8, 10.6, 7.8, 3.9 Hz, 2H), 1.84–1.73 (m, 2H), 1.64 (d, J = 7.3 Hz, 6H), 1.39–1.28 (m, 2H). 13C NMR (151 MHz, CD2Cl2) δ/ppm: 173.63, 170.97, 166.13, 139.50, 136.04, 133.47, 133.05, 130.74, 130.14, 129.56, 129.49, 129.42, 128.98, 126.52, 82.80, 82.71, 80.12, 80.05, 77.32, 71.40, 52.75, 49.64, 31.65, 28.92, 28.39, 17.68. UV-Vis [c(Rh) = 0.03 mM, CH2Cl2; λmax, nm (ε, M−1 cm−1)]: 235 (34802), 348 (2174). CD [c(Rh) = 0.03 mM, CH2Cl2; θmax, nm (εCD, M−1 cm−1)]: 245 (2.98), 283 (−2.97), 319 (−2.18), 354 (−1.08), 388 (0.34).
:1p = 1:2 solution.
[Ir(COD)2]BArF (15.88 mg, 0.012 mmol), 1p ligand (9.79 mg, 0.025 mmol), 0.5 mL of deuterated dichloromethane. Free ligand peaks can be observed. 1H NMR (300 MHz, CD2Cl2) δ/ppm: 7.88 (d, J = 6.8 Hz, 2H), 7.81–7.24 (m, 37H), 7.09 (s, 3H), 4.67 (quin., J = 7.2 Hz, 2H), 4.51 (s, 2H), 4.00 (s, 2H), 3.84 (s, 6H), 2.56–2.13 (m, 4H), 1.76 (q, J = 1.6 Hz, 4H), 1.46 (d, J = 7.3 Hz, 6H). 31P NMR (122 MHz, CD2Cl2) δ/ppm: 18.1. 13C NMR (75 MHz, CD2Cl2) δ/ppm: 175.80, 165.03, 163.17, 162.51, 161.85, 161.19, 136.15, 135.94, 135.86, 135.22, 135.02, 134.95, 132.77, 132.15, 129.53, 129.45, 129.38, 129.21, 129.10, 128.44, 126.82, 122.80, 119.49, 117.95, 117.90, 96.64, 93.55, 93.16, 90.73, 87.25, 53.20, 52.05, 49.84, 49.16, 32.92, 32.17, 30.76, 29.92, 28.38, 28.01, 22.95, 17.33. UV-Vis [c(Ir) = 3.49 mM, CH2Cl2; λmax, nm (ε, M−1 cm−1)]: 395 (422.75), 494 (378.23), 578 (75.58). CD [c(Ir) = 0.03 mM, CH2Cl2; θmax, nm (εCD, M−1 cm−1)]: 262 (−8.57), 313 (−3.53), 400 (0.61), 493 (0.72), 583 (0.09).
:1p:1c* = 1:1:1 solution.
[Ir(COD)2BArF] (35.62 mg, 0.028 mmol), 1p ligand (10.96 mg, 0.028 mmol), 1c* ligand (9.86 mg, 0.028 mmol), 0.5 mL of deuterated dichloromethane. 1H NMR (300 MHz, CD2Cl2) δ/ppm: 9.70 (s, 1H), 8.46 (dd, J = 7.7, 1.6 Hz, 1H), 8.08 (dt, J = 7.8, 1.4 Hz, 1H), 7.92–6.97 (m, 31H), 7.21 (COSY assigned amide peak), 6.91 (COSY assigned amide peak), 4.94–4.87 (m, 2H), 4.46–4.41(m, 1H), 4.39–4.35 (m, 2H), 3.84 (s, 3H), 3.76 (s, 3H), 3.52 (t, J = 4.1 Hz, 1H), 3.39 (q, J = 5.9 Hz, 1H), 3.09 (t, J = 6.4 Hz, 1H), 2.36 (COSY-assigned COD peak), 2.14 (COSY-assigned COD peak), 1.58 (d, J = 7.2 Hz, 3H), 1.51 (d, J = 7.2 Hz, 3H), 1.45 (COSY-assigned COD peak), 1.31(COSY-assigned COD peak). UV-Vis [c(Ir) = 0.03 mM, CH2Cl2; λmax, nm (ε, M−1 cm−1)]: 237 (48700), 269 (sh, 19553), 385 (1508), 449 (810), 492 (923), 583 (327). CD [c(Ir) = 0.03 mM, CH2Cl2; θmax, nm (εCD, M−1 cm−1)]: 245 (4.49), 318 (−2.43).
:1c* = 1:2 solution.
[Ir(COD)2BArF] (17.81 mg, 0.014 mmol), 1c ligand (10.96 mg, 0.028 mmol), 0.5 mL of deuterated dichloromethane. 1H NMR (600 MHz, CD2Cl2) δ/ppm: 10.08 (s, 1H), 8.55 (d, J = 7.8 Hz, 1H), 8.24 (d, J = 7.7 Hz, 1H), 7.82 (t, J = 7.8 Hz, 1H), 7.73 (dt, J = 5.1, 2.3 Hz, 8H), 7.57 (s, 4H), 7.40–7.15 (m, 6H), 7.02 (d, J = 7.3 Hz, 2H), 7.00–6.96 (m, 4H), 4.97–4.85 (m, 3H), 4.59–4.51 (m, 1H), 4.13–4.05 (m, 1H), 3.84 (s, 3H), 3.82–3.77 (m, 2H), 3.71–3.65 (m, 1H), 3.35 (t, J = 9.0 Hz, 1H), 2.50–2.41 (m, 2H), 2.34–2.22 (m, 2H), 2.02–1.92 (m, 1H), 1.81–1.74 (m, 2H), 1.62 (d, J = 7.2 Hz, 3H), 1.03–0.96 (m, 1H). 13C NMR (151 MHz, CD2Cl2) δ/ppm: 172.14, 165.67, 162.67, 162.34, 162.01, 161.68, 138.65, 136.25, 135.22, 133.63, 132.73, 131.91, 130.39, 130.00, 129.82, 128.36, 126.27, 125.92, 125.65, 124.52, 122.31, 117.92, 117.87, 96.73, 93.57, 93.19, 90.96, 90.75, 77.28, 72.42, 68.38, 66.55, 53.08, 49.50, 32.91, 32.56, 32.00, 30.78, 28.86, 28.40, 28.08, 22.97, 18.50. UV-Vis [c(Ir) = 0.03 mM, CH2Cl2; λmax, nm (ε, M−1 cm−1)]: 238 (46343), 265 (sh, 22889), 327 (3141), 369 (1703), 426 (834), 472 (315). CD [CH2Cl2; θmax, nm (εCD, M−1 cm−1)]: 276 (−3.85), 355 (−2.26), 430 (0.54), 475 (−0.87).
:1p = 1:2 solution.
[Rh(COD)2]BF4 (4.87 mg, 0.012 mmol), 1p ligand (9.79 mg, 0.025 mmol), 0.5 mL of deuterated dichloromethane. 1H NMR (600 MHz, CD2Cl2) δ/ppm: 7.85 (s, 2H), 7.77 (d, J = 7.2 Hz, 2H), 7.68 (m, 6H), 7.60–7.54 (m, 2H), 7.51–7.44 (m, 6H), 7.39 (m, 8H), 7.36–7.26 (m, 2H), 7.13 (m, 2H), 5.55 (m, 2H), 4.79–4.72 (m, 2H), 4.66 (quin., J = 7.3 Hz, 2H), 4.48 (m, 2H), 3.82 (s, 6H), 2.61 (m, 2H), 2.53–2.43 (m, 2H), 2.28–2.19 (m, 2H), 1.50 (d, J = 7.4 Hz, 6H). 31P NMR (243 MHz, CD2Cl2) δ/ppm: 27.08 (d, J = 145.4 Hz). 13C NMR (151 MHz, CD2Cl2) δ/ppm: 175.08, 165.54, 136.18, 136.13, 136.09, 135.57, 135.53, 135.49, 134.65, 134.62, 134.58, 133.82, 133.13, 132.42, 132.34, 131.76, 131.46, 130.97, 130.68, 130.07, 129.78, 129.39, 129.36, 129.32, 129.29, 129.26, 129.14, 128.98, 128.82, 128.79, 128.75, 128.65, 100.92, 99.68, 53.03, 49.24, 31.69, 30.20, 28.39, 17.43. UV-Vis [c(Rh) = 0.03 mM, CH2Cl2; λmax, nm (ε, M−1 cm−1)]: 236 (41895), 267 (sh, 22217), 442 (140). CD [c(Rh) = 0.03 mM, CH2Cl2; θmax, nm (εCD, M−1 cm−1)]: 274 (−4.26), 304 (−2.45), 373 (−0.96), 434 (0.42), 449 (0.59).
:1p:1c* = 1:1:1 solution.
[Rh(COD)2]BF4 (9.74 mg, 0.024 mmol), 1p ligand (9.79 mg, 0.025 mmol), 1c* ligand (8.08 mg, 0.025 mmol), 0.5 mL of deuterated dichloromethane. 1H NMR (600 MHz, CD2Cl2) δ/ppm: 10.30 (s, 1H), 8.47 (d, J = 7.8 Hz, 1H), 8.33 (d, J = 11.2 Hz, 1H), 8.17 (dd, J = 7.9, 1.4 Hz, 1H), 7.99–7.92 (m, 2H), 7.89 (dq, J = 7.8, 1.4 Hz, 1H), 7.68 (t, J = 7.9 Hz, 2H), 7.61 (td, J = 7.8, 2.1 Hz, 2H), 7.56–7.32 (m, 13H), 7.29–7.24 (m, 1H), 4.90–4.81 (m, 2H), 4.71–4.61 (m, 2H), 4.50–4.40 (m, 2H), 4.00–3.93 (m, 1H), 3.83 (s, 3H), 3.75 (s, 3H), 3.54 (q, J = 6.1, 3.9 Hz, 1H), 3.49–3.42 (m, 1H), 2.71–2.54 (m, 2H), 2.32–2.20 (m, 2H), 2.15–2.04 (m, 2H), 1.61 (d, J = 7.2 Hz, 3H), 1.66–1.59 (m, 2H), 1.53 (d, J = 7.3 Hz, 3H). 31P NMR (243 MHz, CD2Cl2) δ/ppm: 25.47, 24.85. 13C NMR (151 MHz, CD2Cl2) δ/ppm: 173.88, 173.83, 167.90, 166.28, 165.83, 140.52, 136.24, 136.19, 135.64, 135.56, 134.94, 134.74, 134.67, 134.60, 133.78, 133.71, 133.63, 133.54, 133.08, 132.54, 132.14, 131.63, 131.61, 130.77, 130.60, 130.33, 130.23, 130.21, 130.17, 129.78, 129.72, 129.55, 129.49, 129.43, 129.32, 129.25, 129.18, 128.97, 128.90, 128.13, 127.86, 127.77, 124.69, 108.01, 107.96, 105.99, 102.45, 102.39, 81.88, 81.80, 78.93, 78.85, 77.34, 76.27, 71.92, 71.38, 52.91, 52.79, 49.44, 49.28, 34.80, 30.87, 30.09, 29.21, 28.38, 27.08, 18.03, 17.86. UV-Vis [c(Rh) = 0.03 mM, CH2Cl2; λmax, nm (ε, M−1 cm−1)]: 236 (40006), 291 (sh, 8804), 407 (1948). CD [c(Rh) = 0.03 mM, CH2Cl2; θmax, nm (εCD, M−1 cm−1)]: 248 (5.63), 271 (6.65), 297 (6.61), 350 (−4.47), 422 (−0.59).
:1c* = 1:2 solution.
[Rh(COD)2]BF4 (4.87 mg, 0.012 mmol), 1c* ligand (8.08 mg, 0.025 mmol), 0.5 mL of deuterated dichloromethane. 1H NMR (600 MHz, CD2Cl2) δ/ppm: 10.08 (s, 2H), 9.06 (d, J = 7.6 Hz, 2H), 8.47–8.35 (m, 2H), 7.93 (t, J = 7.7 Hz, 2H), 7.59 (d, J = 7.1 Hz, 2H), 7.31–7.25 (m, 6H), 6.95 (dd, J = 7.5, 2.1 Hz, 4H), 4.79 (quin., J = 7.2 Hz, 2H), 4.05 (dd, J = 8.8, 3.2 Hz, 2H), 3.97 (dd, J = 9.4, 3.1 Hz, 2H), 3.86–3.79 (m, 4H), 3.78 (s, 6H), 3.69 (t, J = 9.0 Hz, 2H), 2.70 (dddd, J = 15.3, 10.2, 8.6, 6.7 Hz, 2H), 2.14 (dddd, J = 13.8, 10.6, 7.8, 3.9 Hz, 2H), 1.84–1.73 (m, 2H), 1.64 (d, J = 7.3 Hz, 6H), 1.39–1.28 (m, 2H). 13C NMR (151 MHz, CD2Cl2) δ/ppm: 173.63, 170.97, 166.13, 139.50, 136.04, 133.47, 133.05, 130.74, 130.14, 129.56, 129.49, 129.42, 128.98, 126.52, 82.80, 82.71, 80.12, 80.05, 77.32, 71.40, 52.75, 49.64, 31.65, 28.92, 28.39, 17.68. UV-Vis [c(Rh) = 0.03 mM, CH2Cl2; λmax, nm (ε, M−1 cm−1)]: 235 (34802), 348 (2174). CD [c(Rh) = 0.03 mM, CH2Cl2; θmax, nm (εCD, M−1 cm−1)]: 245 (2.98), 283 (−2.97), 319 (−2.18), 354 (−1.08), 388 (0.34).
:1p = 1:2 solution.
[Ir(COD)2]BArF (15.88 mg, 0.012 mmol), 1p ligand (9.79 mg, 0.025 mmol), 0.5 mL of deuterated dichloromethane. Free ligand peaks can be observed. 1H NMR (300 MHz, CD2Cl2) δ/ppm: 7.88 (d, J = 6.8 Hz, 2H), 7.81–7.24 (m, 37H), 7.09 (s, 3H), 4.67 (quin., J = 7.2 Hz, 2H), 4.51 (s, 2H), 4.00 (s, 2H), 3.84 (s, 6H), 2.56–2.13 (m, 4H), 1.76 (q, J = 1.6 Hz, 4H), 1.46 (d, J = 7.3 Hz, 6H). 31P NMR (122 MHz, CD2Cl2) δ/ppm: 18.1. 13C NMR (75 MHz, CD2Cl2) δ/ppm: 175.80, 165.03, 163.17, 162.51, 161.85, 161.19, 136.15, 135.94, 135.86, 135.22, 135.02, 134.95, 132.77, 132.15, 129.53, 129.45, 129.38, 129.21, 129.10, 128.44, 126.82, 122.80, 119.49, 117.95, 117.90, 96.64, 93.55, 93.16, 90.73, 87.25, 53.20, 52.05, 49.84, 49.16, 32.92, 32.17, 30.76, 29.92, 28.38, 28.01, 22.95, 17.33. UV-Vis [c(Ir) = 3.49 mM, CH2Cl2; λmax, nm (ε, M−1 cm−1)]: 395 (422.75), 494 (378.23), 578 (75.58). CD [c(Ir) = 0.03 mM, CH2Cl2; θmax, nm (εCD, M−1 cm−1)]: 262 (−8.57), 313 (−3.53), 400 (0.61), 493 (0.72), 583 (0.09).
:1p:1c* = 1:1:1 solution.
[Ir(COD)2BArF] (35.62 mg, 0.028 mmol), 1p ligand (10.96 mg, 0.028 mmol), 1c* ligand (9.86 mg, 0.028 mmol), 0.5 mL of deuterated dichloromethane. 1H NMR (300 MHz, CD2Cl2) δ/ppm: 9.70 (s, 1H), 8.46 (dd, J = 7.7, 1.6 Hz, 1H), 8.08 (dt, J = 7.8, 1.4 Hz, 1H), 7.92–6.97 (m, 31H), 7.21 (COSY assigned amide peak), 6.91 (COSY assigned amide peak), 4.94–4.87 (m, 2H), 4.46–4.41(m, 1H), 4.39–4.35 (m, 2H), 3.84 (s, 3H), 3.76 (s, 3H), 3.52 (t, J = 4.1 Hz, 1H), 3.39 (q, J = 5.9 Hz, 1H), 3.09 (t, J = 6.4 Hz, 1H), 2.36 (COSY-assigned COD peak), 2.14 (COSY-assigned COD peak), 1.58 (d, J = 7.2 Hz, 3H), 1.51 (d, J = 7.2 Hz, 3H), 1.45 (COSY-assigned COD peak), 1.31(COSY-assigned COD peak). UV-Vis [c(Ir) = 0.03 mM, CH2Cl2; λmax, nm (ε, M−1 cm−1)]: 237 (48700), 269 (sh, 19553), 385 (1508), 449 (810), 492 (923), 583 (327). CD [c(Ir) = 0.03 mM, CH2Cl2; θmax, nm (εCD, M−1 cm−1)]: 245 (4.49), 318 (−2.43).
:1c* = 1:2 solution.
[Ir(COD)2BArF] (17.81 mg, 0.014 mmol), 1c ligand (10.96 mg, 0.028 mmol), 0.5 mL of deuterated dichloromethane. 1H NMR (600 MHz, CD2Cl2) δ/ppm: 10.08 (s, 1H), 8.55 (d, J = 7.8 Hz, 1H), 8.24 (d, J = 7.7 Hz, 1H), 7.82 (t, J = 7.8 Hz, 1H), 7.73 (dt, J = 5.1, 2.3 Hz, 8H), 7.57 (s, 4H), 7.40–7.15 (m, 6H), 7.02 (d, J = 7.3 Hz, 2H), 7.00–6.96 (m, 4H), 4.97–4.85 (m, 3H), 4.59–4.51 (m, 1H), 4.13–4.05 (m, 1H), 3.84 (s, 3H), 3.82–3.77 (m, 2H), 3.71–3.65 (m, 1H), 3.35 (t, J = 9.0 Hz, 1H), 2.50–2.41 (m, 2H), 2.34–2.22 (m, 2H), 2.02–1.92 (m, 1H), 1.81–1.74 (m, 2H), 1.62 (d, J = 7.2 Hz, 3H), 1.03–0.96 (m, 1H). 13C NMR (151 MHz, CD2Cl2) δ/ppm: 172.14, 165.67, 162.67, 162.34, 162.01, 161.68, 138.65, 136.25, 135.22, 133.63, 132.73, 131.91, 130.39, 130.00, 129.82, 128.36, 126.27, 125.92, 125.65, 124.52, 122.31, 117.92, 117.87, 96.73, 93.57, 93.19, 90.96, 90.75, 77.28, 72.42, 68.38, 66.55, 53.08, 49.50, 32.91, 32.56, 32.00, 30.78, 28.86, 28.40, 28.08, 22.97, 18.50. UV-Vis [c(Ir) = 0.03 mM, CH2Cl2; λmax, nm (ε, M−1 cm−1)]: 238 (46343), 265 (sh, 22889), 327 (3141), 369 (1703), 426 (834), 472 (315). CD [CH2Cl2; θmax, nm (εCD, M−1 cm−1)]: 276 (−3.85), 355 (−2.26), 430 (0.54), 475 (−0.87).
X-ray diffraction
X-ray intensity data for metal complex [Rh(1c*)2COD]BF4 were collected on XtaLAB diffractometer using monochromatic Cu-Kα radiation (λ = 1.54184 Å). The data were processed by the CrysalisPro1 program73 (unit cell determination and data reduction). The structures were solved by the program SHELXT74 and refined according to the least-squares procedure (F2 on all data) by the program SHELXL.75 Basic experimental data is given in Table S15 of ESI.† The absolute configurations of investigated compounds were known from the synthetic procedures. All non-hydrogen atoms were refined in the anisotropic model of atomic displacement parameters (ADP). The structure consist of three residues in asymmetric unit: two C2-symetric [Rh(1c*)2COD]+ complexes and [BF4]− anion. Molecular symmetries of complexes are crystallographic symmetries of I2 space group, so only one half of complexes belong to asymmetric unit of the structure (Fig. S74 in ESI†). Rigid-group restraints were applied to all atoms of the COD groups and to atoms of [BF4]− anion. Hydrogen atoms attached to carbon atoms were treated in the riding rigid body models, i.e. their positions were calculated from the positions of carbon atoms. Torsion angles of methyl groups were determined by the best fit to the difference electron density (HFIX 137). Positions and isotropic displacement parameters of amide hydrogen atoms were refined and their distances to nitrogen atoms were restrained to 0.86 Å. Additional infinite solvent accessible area (tunnels) of 2046 Å3 per unit cell was found (Fig. S76 in ESI†), without significant electron density peaks. Contribution of electron density from this area in the calculated structure factors was accounted by SQUEEZE procedure in program PLATON.76 The CCDC 2379143† contains the supplementary crystallographic data for this paper.Enantioselective hydrogenation and hydroformylation procedures
All catalytic reactions were carried out in a stainless-steel autoclave with an inset rack suitable for up to 8 reaction vessels (4 mL) with small Teflon stirring magnets. In a typical experiment, stock solutions of all compounds are prepared under inert conditions, a reaction vessel is injected with a metal precursor and ligand dissolved in dry solvent using Hamilton needles under argon atmosphere, and stirred for 60 minutes in the appropriate solvent. The desired substrate is added to the reaction mixture by dissolving in a small amount of reaction solvent and injecting into the vessel, which is then placed in an autoclave. The autoclave is filled twice with nitrogen and three times with hydrogen. Finally, hydrogenation is carried out under a pressure of 20 bar H2 and room temperature; or hydroformylation under a pressure of 10 bar H2 and 10 bar CO and an elevated temperature of 40 °C. At the end of the reaction, the gas is released from the autoclave and the reaction vessels are handled further. The reaction mixtures are diluted with ethyl acetate and filtered through a short column of silica gel (5 cm). The hydroformylation products are further transformed into the corresponding alcohols (reaction with NaBH4, at 0 °C, stirring overnight). Conversions were determined by GC and GC-MS measurements, and enantiomeric excess by GC on a chiral column. The absolute configuration of the products was determined according to the known order of elution under the given conditions (Fig. S58–S71 and Tables S8–S14†).70 Column Information for GC-MS: HP5-MS Column with the part Number 190915–433, column dimensions 30 m × 0.25 mm × 0.25 μm, temperature range −60 °C to 325 °C. Column Information for chiral GC: CP Chirasil Dex CB Column with the Part Number CP27503, column dimension 25 m × 0.32 mm × 0.25 μm, temperature range 20 °C–200 °C.Author contributions
M. B. prepared and characterized the compounds and single crystals, performed the UV-Vis, CD and NMR spectroscopic studies, hydrogenation experiments, hydroformylation experiments and wrote the manuscript draft. S. O. performed CD spectroscopic studies and hydroformylation experiments. B. P. solved the crystal structure. S. C. prepared the dehydroamino acid methyl ester substrates and supervised the technical execution of hydrogenation experiments. A. D. A. performed and supervised the technical execution of hydroformylation experiments. S. I. K., S. T. and J. G. de V. conceived the study and were involved in the preparation of the original proposal. M. B., S. O., S. C. and A. D. A. were also included as co-workers into the original application for funding. S. I. K., S. T., J. G. de V. and E. B., supervised the laboratory work and finalized the manuscript. All authors were involved in scientific discussion and have approved the manuscript.Data availability
Data for this article, including a Compounds overview, NMR spectra, overlapped NMR spectra, UV-Vis spectra, CD spectra, mass spectra, HRMS spectra, IR spectra, GC-MS and chiral GC spectra have been included as part of the ESI.† Crystallographic data for [Rh(1c*)2COD]BF4 has been deposited at the CCDC under 2379143 and can be obtained from https://www.ccdc.cam.ac.uk/data_request/cif.Conflicts of interest
There are no conflicts to declare.Acknowledgements
This work was supported by CAT Pharma (KK.01.1.1.04.0013), a project co-financed by the Croatian Government and the European Union through the European Regional Development Fund – the Competitiveness and Cohesion Operational Program; Croatian-German bilateral project (Ministry of Science and Education, Croatia and DAAD, Germany), the COST Action CA17120 Chemobrionics and Cage Cat (IP-2022-10-8456), a project financed by the Croatian Science Foundation. M. B. acknowledges the Croatian Science Foundation for a doctoral scholarship (DOK-2021–02-7366). We thank Dr Zoran Kokan for helpful discussions and Ernest Sanders for technical assistance.References
- T. P. Yoon and E. N. Jacobsen, Science, 2003, 299, 1691–1693 CrossRef CAS.
- C. Bruneau, Tetrahedron, 2024, 151, 133793 CrossRef CAS.
- L. Xu, T. Yang, H. Sun, J. Zeng, S. Mu, X. Zhang and G. Chen, Angew. Chem., Int. Ed., 2024, 63, e202319662 CrossRef CAS.
- C. Xie, Q. Guo, X. Wu, W. Ye and G. Hou, J. Org. Chem., 2023, 88, 15726–15738 CrossRef CAS.
- R. Gunasekar, R. L. Goodyear, I. Proietti Silvestri and J. Xiao, Org. Biomol. Chem., 2022, 20, 1794–1827 RSC.
- S. J. Roseblade and A. Pfaltz, Acc. Chem. Res., 2007, 40, 1402–1411 CrossRef CAS PubMed.
- J. Margalef, O. Pàmies and M. Diéguez, in Iridium Catalysts for Organic Reactions, ed. L. A. Oro and C. Claver, Springer International Publishing, Cham, 2020, vol. 69, pp. 153–205 Search PubMed.
- B. B. C. Peters and P. G. Andersson, J. Am. Chem. Soc., 2022, 144, 16252–16261 CrossRef CAS PubMed.
- A. Cadu and P. G. Andersson, J. Organomet. Chem., 2012, 714, 3–11 CrossRef CAS.
- J. A. Osborn, F. H. Jardine, J. F. Young and G. Wilkinson, J. Chem. Soc. A, 1966, 1711 RSC.
- R. Crabtree, Acc. Chem. Res., 1979, 12, 331–337 CrossRef CAS.
- L. Horner, H. Siegel and H. Büthe, Angew. Chem., Int. Ed. Engl., 1968, 7, 942–942 CrossRef CAS.
- W. S. Knowles and M. J. Sabacky, Chem. Commun., 1968, 1445 RSC.
- The Handbook of Homogeneous Hydrogenation, ed. J. G. de Vries and C. J. Elsevier, Wiley, 1st edn, 2006 Search PubMed.
- P. Braunstein and F. Naud, Angew. Chem., Int. Ed., 2001, 40, 680–699 CrossRef CAS.
- P. Schnider, G. Koch, R. Prétôt, G. Wang, F. M. Bohnen, C. Krüger and A. Pfaltz, Chem. – Eur. J., 1997, 3, 887–892 CrossRef CAS.
- J. F. Scholtes and O. Trapp, Synlett, 2021, 971–980 CAS.
- M. Cettolin, P. Puylaert and J. G. de Vries, in Rhodium Catalysis, ed. C. Claver, Springer International Publishing, Cham, 2017, vol. 61, pp. 231–261 Search PubMed.
- M. van den Berg, A. J. Minnaard, E. P. Schudde, J. van Esch, A. H. M. De Vries, J. G. de Vries and B. L. Feringa, J. Am. Chem. Soc., 2000, 122, 11539–11540 CrossRef CAS.
- L. Lefort, J. A. F. Boogers, A. H. M. de Vries and J. G. de Vries, Top. Catal., 2006, 40, 185–191 CrossRef CAS.
- D. Peña, A. J. Minnaard, J. A. F. Boogers, A. H. M. de Vries, J. G. de Vries and B. L. Feringa, Org. Biomol. Chem., 2003, 1, 1087–1089 RSC.
- M. T. Reetz and G. Mehler, Tetrahedron Lett., 2003, 44, 4593–4596 CrossRef CAS.
- M. T. Reetz, T. Sell, A. Meiswinkel and G. Mehler, Angew. Chem., Int. Ed., 2003, 42, 790–793 CrossRef CAS.
- R. Hoen, J. A. F. Boogers, H. Bernsmann, A. J. Minnaard, A. Meetsma, T. D. Tiemersma-Wegman, A. H. M. de Vries, J. G. de Vries and B. L. Feringa, Angew. Chem., Int. Ed., 2005, 44, 4209–4212 CrossRef CAS PubMed.
- J. W. Faller, S. C. Milheiro and J. Parr, J. Organomet. Chem., 2006, 691, 4945–4955 CrossRef CAS.
- M. T. Reetz and X. Li, Angew. Chem., Int. Ed., 2005, 44, 2959–2962 CrossRef CAS PubMed.
- M. T. Reetz, J. Ma and R. Goddard, Angew. Chem., Int. Ed., 2005, 44, 412–415 CrossRef CAS PubMed.
- D. J. Frank, A. Franzke and A. Pfaltz, Chem. – Eur. J., 2013, 19, 2405–2415 CrossRef CAS PubMed.
- J. N. H. Reek, B. de Bruin, S. Pullen, T. J. Mooibroek, A. M. Kluwer and X. Caumes, Chem. Rev., 2022, 122, 12308–12369 CrossRef CAS.
- N. R. Mote and S. H. Chikkali, Chem. – Asian J., 2018, 13, 3623–3646 CrossRef CAS.
- R. Bellini, J. I. van der Vlugt and J. N. H. Reek, Isr. J. Chem., 2012, 52, 613–662 CrossRef CAS.
- F. Song, G. Ouyang, Y. Li, Y. He and Q. Fan, Eur. J. Org. Chem., 2014, 6713–6719 CrossRef CAS.
- X. Jiang, L. Lefort, P. E. Goudriaan, A. H. M. de Vries, P. W. N. M. van Leeuwen, J. G. de Vries and J. N. H. Reek, Angew. Chem., Int. Ed., 2006, 45, 1223–1227 CrossRef CAS.
- Y. Li, Y. Feng, Y.-M. He, F. Chen, J. Pan and Q.-H. Fan, Tetrahedron Lett., 2008, 49, 2878–2881 CrossRef CAS.
- A. C. Laungani and B. Breit, Chem. Commun., 2008, 844–846 RSC.
- M. Birkholz, N. V. Dubrovina, H. Jiao, D. Michalik, J. Holz, R. Paciello, B. Breit and A. Börner, Chem. – Eur. J., 2007, 13, 5896–5907 CrossRef CAS.
- A. J. Sandee, A. M. van Der Burg and J. N. H. Reek, Chem. Commun., 2007, 864–866 RSC.
- V. S. Koshti, A. Sen, D. Shinde and S. H. Chikkali, Dalton Trans., 2017, 46, 13966–13973 RSC.
- A. C. Chandanshive, R. G. Gonnade and S. H. Chikkali, Chem. – Eur. J., 2024, 30, e202401077 CrossRef CAS.
- M. Durini, E. Russotto, L. Pignataro, O. Reiser and U. Piarulli, Eur. J. Org. Chem., 2012, 5451–5461 CrossRef CAS.
- K. M. Wenz, G. Leonhardt-Lutterbeck and B. Breit, Angew. Chem., Int. Ed., 2018, 57, 5100–5104 CrossRef CAS PubMed.
- M. Raynal, F. Portier, P. W. N. M. van Leeuwen and L. Bouteiller, J. Am. Chem. Soc., 2013, 135, 17687–17690 CrossRef CAS.
- Z. Kokan and S. I. Kirin, RSC Adv., 2012, 2, 5729 RSC.
- Z. Kokan and S. I. Kirin, Eur. J. Org. Chem., 2013, 8154–8161 CrossRef CAS.
- Z. Kokan, Z. Glasovac, M. Majerić Elenkov, M. Gredičak, I. Jerić and S. I. Kirin, Organometallics, 2014, 33, 4005–4015 CrossRef CAS.
- S. Opačak, Z. Kokan, Z. Glasovac, B. Perić and S. I. Kirin, Eur. J. Org. Chem., 2019, 2115–2128 CrossRef.
- A. C. Laungani, J. M. Slattery, I. Krossing and B. Breit, Chem. – Eur. J., 2008, 14, 4488–4502 CrossRef CAS.
- A. Desmarchelier, X. Caumes, M. Raynal, A. Vidal-Ferran, P. W. N. M. van Leeuwen and L. Bouteiller, J. Am. Chem. Soc., 2016, 138, 4908–4916 CrossRef CAS PubMed.
- C. Botteghi, G. Consiglio and P. Pina, Chimia, 1972, 26, 141–143 CAS.
- F. Agbossou, J.-F. Carpentier and A. Mortreux, Chem. Rev., 1995, 95, 2485–2506 CrossRef CAS.
- S. Chakrabortty, A. A. Almasalma and J. G. de Vries, Catal. Sci. Technol., 2021, 11, 5388–5411 RSC.
- V. F. Slagt, P. C. J. Kamer, P. W. N. M. van Leeuwen and J. N. H. Reek, J. Am. Chem. Soc., 2004, 126, 1526–1536 CrossRef CAS PubMed.
- Z. Yu, M. S. Eno, A. H. Annis and J. P. Morken, Org. Lett., 2015, 17, 3264–3267 CrossRef CAS PubMed.
- G. M. Noonan, J. A. Fuentes, C. J. Cobley and M. L. Clarke, Angew. Chem., Int. Ed., 2012, 51, 2477–2480 CrossRef CAS.
- R. Franke, D. Selent and A. Börner, Chem. Rev., 2012, 112, 5675–5732 CrossRef CAS PubMed.
- Z. Hua, V. C. Vassar, H. Choi and I. Ojima, Proc. Natl. Acad. Sci. U. S. A., 2004, 101, 5411–5416 CrossRef CAS.
- M. Jouffroy, R. Gramage-Doria, D. Sémeril, D. Armspach, D. Matt, W. Oberhauser and L. Toupet, Beilstein J. Org. Chem., 2014, 10, 2388–2405 CrossRef.
- S. S. Nurttila, P. R. Linnebank, T. Krachko and J. N. H. Reek, ACS Catal., 2018, 8, 3469–3488 CrossRef CAS PubMed.
- M. Vaquero, L. Rovira and A. Vidal-Ferran, Chem. Commun., 2016, 52, 11038–11051 RSC.
- P. Dydio, R. J. Detz and J. N. H. Reek, J. Am. Chem. Soc., 2013, 135, 10817–10828 CrossRef CAS PubMed.
- B. Breit and W. Seiche, J. Am. Chem. Soc., 2003, 125, 6608–6609 CrossRef CAS PubMed.
- R. Bellini, S. H. Chikkali, G. Berthon-Gelloz and J. N. H. Reek, Angew. Chem., 2011, 123, 7480–7483 CrossRef.
- M. Bakija, B. Perić and S. I. Kirin, New J. Chem., 2024, 48, 8702–8719 RSC.
- S. I. Kirin, H.-B. Kraatz and N. Metzler-Nolte, Chem. Soc. Rev., 2006, 35, 348–354 RSC.
- P. S. Pregosin and R. W. Kunz, 31P and 13C NMR of Transition Metal Phosphine Complexes, Springer Berlin Heidelberg, Berlin, Heidelberg, 1979 Search PubMed.
- L. J. Farrugia, J. Appl. Crystallogr., 1997, 30, 565–565 CrossRef CAS.
- G. L. Parker, S. Lau, B. Leforestier and A. B. Chaplin, Eur. J. Inorg. Chem., 2019, 2019, 3791–3798 CrossRef CAS PubMed.
- B. M. Schmidt, H.-A. Ho, K. Basemann, A. Ellern, T. L. Windus and A. D. Sadow, Organometallics, 2018, 37, 4055–4069 CrossRef CAS.
- R. Díaz-Torres and S. Alvarez, Dalton Trans., 2011, 40, 10742–10750 RSC.
- S. Chakrabortty, K. Konieczny, B. H. Müller, A. Spannenberg, P. C. J. Kamer and J. G. de Vries, Catal. Sci. Technol., 2022, 12, 1392–1399 RSC.
- C. Walpole, S. Y. Ko, M. Brown, D. Beattie, E. Campbell, F. Dickenson, S. Ewan, G. A. Hughes, M. Lemaire, J. Lerpiniere, S. Patel and L. Urban, J. Med. Chem., 1998, 41, 3159–3173 CrossRef CAS PubMed.
- G. Xu, Q. Luo, S. Eibauer, A. F. Rausch, S. Stempfhuber, M. Zabel, H. Yersin and O. Reiser, Dalton Trans., 2011, 40, 8800–8806 RSC.
- CrysAlisPro (Version 1.171.39.46), Rigaku Oxford Diffraction Ltd, Yarnton, Oxfordshire, England, 2018 Search PubMed.
- G. M. Sheldrick, Acta Crystallogr., Sect. A: Found. Adv., 2015, 71, 3–8 CrossRef.
- G. M. Sheldrick, Acta Crystallogr., Sect. C: Struct. Chem., 2015, 71, 3–8 Search PubMed.
- A. L. Spek, Acta Crystallogr., Sect. C: Struct. Chem., 2015, 71, 9–18 CrossRef CAS.
Footnote |
| † Electronic supplementary information (ESI) available: Synthetic procedures, schemes, and comprehensive spectroscopic characterization details. CCDC 2379143. For ESI and crystallographic data in CIF or other electronic format see DOI: https://doi.org/10.1039/d4dt02519a |
| This journal is © The Royal Society of Chemistry 2025 |