
Synthesis and proton-conductive behaviour of two MOFs with covalently bonded imidazoles in the channels†
Kun-Peng
Chen
a,
Yue
Ma
 a,
Hong-Xia
Ren
*a,
Chen-Xi
Zhang
c and
Qing-Lun
Wang
*b
a,
Hong-Xia
Ren
*a,
Chen-Xi
Zhang
c and
Qing-Lun
Wang
*b
aCollege of Chemistry, Nankai University, Tianjin 300071, P. R. China. E-mail: csxh3605@sina.com.cn
bKey Laboratory of Advanced Energy Materials Chemistry (Ministry of Education), Nankai University, Tianjin 300071, P. R. China. E-mail: wangql@nankai.edu.cn
cCollege of Chemical Engineering and Materials Science, Tianjin University of Science and Technology, Tianjin 300457, P. R. China
First published on 25th April 2024
Abstract
Immobilization of imidazole molecules as proton carriers into MOFs to facilitate proton conduction is a general strategy for developing high proton conductive materials. Herein, we designed two imidazole substituted phthalic acid ligands and constructed two novel MOFs, {[Zr6(OH)16(H3L1)4]Cl8·20H2O}n [Zr-MOF; H3L1 = 2-(1H-imidazol-4-yl) methylaminoterephthalic acid] and {Gd(HCOO)(H2L2)2}n [Gd-MOF; H3L2 = 5-(1H-imidazol-4-yl)methylaminoisophthalic acid] and fully studied their porous nature, stability and water-assisted proton conduction. The resulting Zr-MOF exhibits a high proton conductivity of 1.82 × 10⁻² S cm−1 at 98% RH and 80 °C, while Gd-MOF has a proton conductivity of 3.01 × 10⁻³ S cm−1 at 98% RH and 60 °C.
Introduction
Proton exchange membrane fuel cells (PEMFCs) have emerged as a promising alternative for vehicle applications due to their high energy conversion rate and low emission.1,2 As crucial components of PEMFCs, the commercial Nafion series membranes can reach proton conductivities of 10−1–10−2 S cm−1 at 60–80 °C and 98% relative humidity (RH).3 However, their high price and unstable proton conductivity over wide ranges of temperature and humidity restrict the development of these PEMFCs.4 In contrast, metal–organic frameworks (MOFs) are interesting materials for studying proton conduction owing to their porous nature and structural tenability.5,6 MOFs, whose proton conductivities are comparable to Nafion under humidity, are well-documented.7–10 Moreover, a number of proton conduction MOFs work under anhydrous conditions or at freezing temperature, providing wider ranges of working temperature than Nafion.10–13 Furthermore, the detailed structure information of MOFs provides the possibility to study the transfer mechanism of protons conducting at the atomic level. These advantages make MOFs a star material for proton conduction. Additionally, it has also been reported that the combination of MOFs and polymers can obtain conductive materials with high proton conductivity and can be used in PEMs for fuel cells.14–18To enhance the proton conductivities of the materials, researchers usually enwrap guest molecules (triazole, histamine, imidazole, or acids) into the channels of MOFs5,19–21 or graft acidic groups, such as –SO3H and –PO3H, on the channel surfaces of MOFs.7,8,22,23 Previous reports have revealed that imidazole molecules are powerful for developing high proton conductive MOFs under both anhydrous and moist conditions.21,24–26 Generally, imidazole molecules are incorporated into MOFs as guest molecules through vapor evaporation or immersion of imidazole molecules after activation of the MOFs.24 Binding of imidazole molecules to open metal sites is also a strategy to incorporate imidazole molecules to MOFs, although in some occasions it is less effective than loading imidazole directly.6,26 Apart from using imidazole molecules, imidazole derived ligands can also be used to construct proton conduction MOFs, leaving imidazole moieties on the backbones for proton conduction.27
Although direct immobilization of imidazole molecules in the pores effectively enhances proton conduction of the materials, the exact positions of imidazole molecules remain unknown, which hinders the exploration of the mechanism of proton transportation in these materials. In this context, we try to synthesize MOFs with fixed imidazole molecules to investigate the role of imidazole in proton conduction. We assumed that covalently attaching imidazoles to linkers can leave imidazoles in the pores of MOFs if imidazoles do not coordinate with metal sites. Therefore, rational selection of metal nodes is vital. Zr-based MOFs usually exhibit remarkable water stability and proton conductivity, especially UiO-66 derivatives.8,28 UiO-66 type proton conduction MOFs are based on Zr6 clusters, terephthalic acid, and uncoordinated Brønsted acid sites, which act as proton donors. Besides, defect sites of UiO-66 can enhance the proton conductivity in the framework, indicating that Zr–O clusters also contribute to proton conduction.29 Lanthanide MOFs are another type of crystal widely used to construct proton conduction MOFs, featuring abundant hydrogen bonds.30,31 Robust hydrogen bond networks in lanthanide MOFs allow them to conduct protons under an anhydrous atmosphere,11,13 while zirconium MOFs usually rely on water to conduct protons. Apart from proton conduction properties, the oxytropism of lanthanide and zirconium suggests a great opportunity to produce residue imidazole groups when carboxyl ligands are used to construct proton-conductive MOFs.
Keeping all these ideas in mind, we designed H3L1 (H3L1 = 2-(1H-imidazol-4-yl)methylaminoterephthalic acid, Scheme 1a) and H3L2 (H3L2 = 5-(1H-imidazol-4-yl)methylaminoisophthalic acid, Scheme 1b) to synthesize proton-conductive MOFs with zirconium and lanthanide as metal nodes, respectively. Finally, Zr-MOF {[Zr6(OH)16(H3L1)4]Cl8·20H2O}n and Gd-MOF {Gd(HCOO)(H2L2)2}n were obtained successfully under hydrothermal conditions. As expected, imidazole components occupy the pores of the MOFs and Zr-MOF exhibits a remarkable proton conductivity of 1.82 × 10⁻² S cm−1 at 98% RH and 80 °C, while Gd-MOF shows a proton conductivity 3.01 × 10⁻³ S cm−1 at 98% RH and 60 °C.
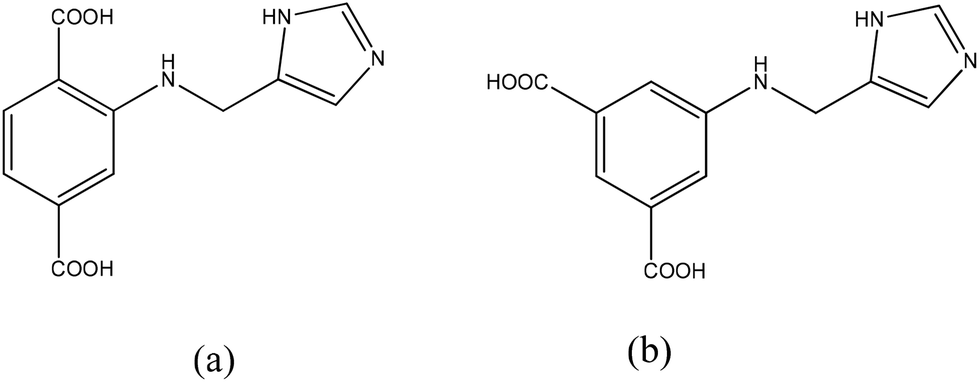 | ||
| Scheme 1 Structural diagrams of ligands H3L1 (a) and H3L2 (b). | ||
Experimental section
Materials and characterization techniques
All reagents were purchased commercially and used without further purification. NMR spectra were obtained on a Bruker Avance 400 MHz spectrometer. The IR spectra were determined by using a Nicolet NEXUS 470 Fourier transform infrared (FTIR) spectrometer (400–4000 cm−1; KBr pellet). Elemental analyses were determined on a vario EL CUBE elemental analyzer. SEM images were obtained on a Zeiss SIGMA 500 SEM apparatus. Thermogravimetric analysis (TGA) was carried out using a Rigaku Thermo plus EVO2 TG8121 from room temperature to 800 °C at 15 °C min−1 under air. A Smartlab X-ray diffractometer was used for collecting powder X-ray diffraction (PXRD) data. A Micrometrics ASAP 2020 Surface Characterization Analyzer was used to measure gas and water vapour adsorption/desorption isotherms. Before the adsorption measurements, the samples were heated at 100 °C under vacuum for 12 h. The AC impedance was tested with CHI 650E Electrochemical Workstation; the AC voltage amplitude of the electrochemical workstation was 0.01 V, and the frequency range was 1 to 106 Hz. The results of tests were fitted by using Zview 3.1 software.Crystal structure analysis
Single-crystal X-ray data of Gd-MOF were collected on a Rigaku HyPix diffractometer. Measurements were made at 100 K. Lorentz polarization and absorption corrections were applied. The structures were determined with the SHELXT structure solution program and refined with the SHELXL refinement package.32 The non-hydrogen atoms were located in successive difference Fourier syntheses and refined with anisotropic thermal parameters on F2. Hydrogen atom positions were calculated geometrically and refined using the riding model. Detailed crystallographic data are given in Tables S1 and S2.†Proton conductivity test
The proton conductivity was measured by using an AC impedance spectrum. The Zr-MOF powder (about 150 mg) was pressed under a pressure of 6 MPa into a round plate with a diameter of 6 mm and a thickness of 0.3–0.5 mm. Around 0.1 g Gd-MOF powder was pressed at 8 MPa to make a plate (about 0.2 × 0.4 × 1.0 cm3) because of the fragileness of a thin plate of Gd-MOF. The proton conductivities of the MOFs were calculated by σ = d/AR, where σ is the proton conductivity in S cm−1, d is the thickness of the measured sample piece, R is the membrane resistance, and A is the cross-sectional membrane area.Synthesis of 2-(1H-imidazol-4-yl)methylaminoterephthalic acid (H3L1·2HCl)
Imidazole-4-carboxaldehyde (0.884 g, 8.25 mmol) and 2-aminoterephthalic acid (1 g, 5.5 mmol) were added into a 250 mL single-neck round-bottomed flask, followed by 100 mL MeOH. The suspension was refluxed for 2 h, cooled to room temperature, and then washed with MeOH to obtain a pale yellow solid. The solid was suspended in 50 mL MeOH and NaBH4 (1 g, 26.43 mmol). After the reaction mixture was stirred for 2 h at room temperature, a clear solution was formed and then HCl solution was added to adjust the pH to 1. Yellow crystals were thus collected, washed with MeOH and dried in air. Yield: 1.05 g. Elemental analysis calcd (%) for C12H13Cl2N3O4: C 43.13, H 3.92, N 12.58; found: C 42.83, H 3.54, N 12.51. 1H NMR (400 MHz, deuterium oxide): δ (ppm) 8.53 (d, J = 1.5 Hz, 1H, imidazole-H), 7.87 (d, J = 8.2 Hz, 1H, ArH), 7.33 (d, J = 1.5 Hz, 1H, imidazole-H), 7.20 (d, J = 1.6 Hz, 1H, ArH), 7.15 (dd, J = 8.2, 1.6 Hz, 1H, ArH), 4.57 (s, 2H, –CH2–).Synthesis of 5-(1H-imidazol-4-yl)methylaminoisophthalic acid (H3L2·2HCl)
Imidazole-4-carboxaldehyde (0.884 g, 8.25 mmol) and 5-aminoisophthalic acid (1 g, 5.5 mmol) were dissolved in 40 mL DMF and stirred for 24 h at room temperature. The white Schiff base solid was collected and reduced by NaBH4 as explained for H3L1. The pH of the final solution was adjusted to 1 and a white crystal was collected. Yield: 0.82 g. Elemental analysis calcd (%) for C12H13Cl2N3O4: C 43.13, H 3.92, N 12.58; found: C 43.52, H 3.63, N 12.72. 1H NMR (400 MHz, DMSO-d6): δ (ppm) 13.06 (br, 2H, COOH), 9.09 (d, J = 1.4 Hz, 1H, imidazole-H), 7.77 (t, J = 1.5 Hz, 1H, ArH), 7.58 (d, J = 1.4 Hz, 1H, imidazole-H), 7.43 (d, J = 1.5 Hz, 2H, ArH), 6.86 (s, 1H, –NH–), 4.46 (s, 2H, –CH2–).Synthesis of {Gd(HCOO)(H2L2)2}n (Gd-MOF)
Gd(NO3)3·6H2O (0.045 g, 0.1 mmol), H3L2·2HCl (0.017 g, 0.05 mmol), 2 mL H2O, 2 mL DMF and 50 μL of 1 M HNO3 were mixed in a 10 mL glass vial. The glass vial was sealed and kept at 85 °C for 24 h. After cooling to room temperature, orange block-shaped crystals were harvested by filtration, washed with methanol and dried in the air. Yield: 6.0 mg (33.1%). Elemental analysis calcd (%) for C25H21GdN6O10: C, 41.55; H, 2.93; N, 11.63; found: C, 40.96; H, 3.14; N, 10.98.Synthesis of {[Zr6(OH)16(H3L1)4]Cl8·20H2O}n (Zr-MOF)
ZrCl4 (0.466 g, 2 mmol) and 2-(1H-imidazol-4-yl)methylaminoterephthalic acid (0.100 g, 0.3 mmol) were dissolved in 50 mL DMF in a 125 mL conical flask. The flask was sealed and placed in an oven operated at 100 °C for 24 h and then was allowed to cool at room temperature. Pale yellow powder was isolated by filtration and dried in air. This product was treated three times with 1 M HCl solution for 24 hours and then treated three times with deionized water for 24 hours to produce the Zr-MOF material. Yield: 0.84 g (34.5%). Elemental analysis calcd (%) for C48H96O52N12Cl8Zr6: C, 23.02; H, 3.86; N, 6.71; Zr, 21.85. Found (%): C, 22.95; H, 3.61; N, 6.64; Zr, 21.64.Results and discussion
Crystal structures of Gd-MOF and Zr-MOF
Single-crystal X-ray crystallographic analysis illustrated that Gd-MOF crystallizes in the tetragonal space group P41212 (Table S1†) and features a 3-D anionic framework, with covalently connected imidazolium ions as counterions existing in the pores. Crystal data and structural refinement details are shown in Table S1.† The asymmetric unit of Gd-MOF contains one Gd3+ ion, one disordered HCOO− and two deprotonated ligands of H3L2. As shown in Fig. 1a, each Gd(III) is nine-coordinated by four chelating carboxylate groups and one disordered HCOO−, which is the product of the hydrolysis of DMF molecules under acid. The adjacent Gd(III) ions are connected by the isophthalic ligand, resulting in the formation of the 3D framework. All the imidazole moieties are in the cavity of the framework and the nearest N3⋯N3 distance between two adjacent imidazole molecules is only 3.285 Å. Hydrogen bonds may exist between them, which thus increase its inherent proton conductivity.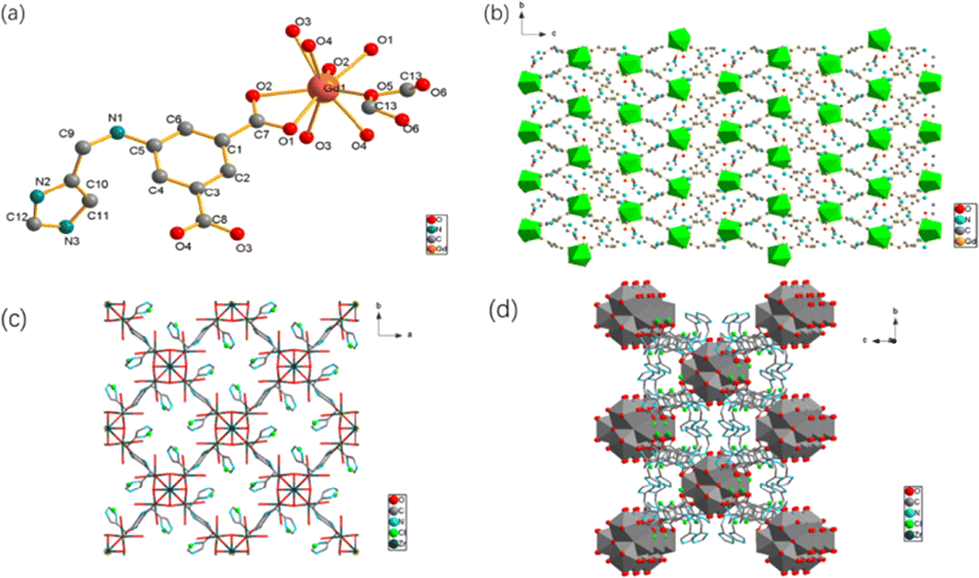 | ||
| Fig. 1 (a) Asymmetric unit of Gd-MOF. (b) 2D structure diagram of Gd-MOF. (c) 2D structure diagram of Zr-MOF. (d) The connectivity of the Zr6 clusters. | ||
The precise structure of Zr-MOF via single crystal X-ray crystallography cannot be obtained at present because only nano particles were formed during the hydrothermal reaction, which was shown by field-emission scanning electron microscopy (FE-SEM) (Fig. S1a†). EDS analysis for Zr-MOF shows a Zr![[thin space (1/6-em)]](https://www.rsc.org/images/entities/char_2009.gif) :Cl molar ratio = 1:1.42, which is approximate to 1:1.33 (Zr:Cl = 6:8) (Fig. S1b†). These data indicate a formula of four dicarboxylate ligands per Zr6 cluster as the imidazole and imine sites are fully protonated. The PXRD pattern of Zr-MOF was indexed and suggested that it crystallizes in the tetragonal space group with a = b = 14.642 Å, c = 20.722 Å, α = β = γ = 90°. These data indicate a bcu network of Zr-MOF, which was formed due to large size substituents on the linkers.23,33 A structure model was developed from a previous reported zirconium MOF with a similar terephthalic acid ligand and the space group I4/m was selected as explained in the document.34 Simulated annealing and Rietveld refinement were carried out with the FULLPROF software package (Fig. S2†).
:Cl molar ratio = 1:1.42, which is approximate to 1:1.33 (Zr:Cl = 6:8) (Fig. S1b†). These data indicate a formula of four dicarboxylate ligands per Zr6 cluster as the imidazole and imine sites are fully protonated. The PXRD pattern of Zr-MOF was indexed and suggested that it crystallizes in the tetragonal space group with a = b = 14.642 Å, c = 20.722 Å, α = β = γ = 90°. These data indicate a bcu network of Zr-MOF, which was formed due to large size substituents on the linkers.23,33 A structure model was developed from a previous reported zirconium MOF with a similar terephthalic acid ligand and the space group I4/m was selected as explained in the document.34 Simulated annealing and Rietveld refinement were carried out with the FULLPROF software package (Fig. S2†).
Absorption studies
N2 adsorption measurements of Zr-MOF and Gd-MOF were performed volumetrically at 77 K to study their porosities (Fig. 2). Zr-MOF showed a typical type-I adsorption–desorption isotherm, which is the characteristic of microporous solids. The Brunauer–Emmett–Teller (BET) surface area of the Zr-MOF was estimated to be 470 m2 g−1. Gd-MOF showed negligible uptake for N2, indicating the non-porous nature of the framework of Gd-MOF towards N2. The water uptake capacity critically affects the performances of water-mediated proton conducting materials. Consequently, the water vapour adsorption studies on active Zr-MOF and Gd-MOF samples have been performed at 298 K. Both of them start accumulating water vapour at very low relative pressure illustrating high water affinity of them. The water vapour uptake of Gd-MOF increases steadily as H2O pressure increases and reaches 129 cm3 g−1 at P/P0 = 0.95. By comparison, after increasing drastically from 102 cm3 g−1 at P/P0 = 0.03 to 380 cm3 g−1 at P/P0 = 0.32, the water vapour uptake of Zr-MOF grows much slower to 462 cm3 g−1 at P/P0 = 0.86, which is attributed to water molecular saturation. The isotherm of Zr-MOF reveals the adsorption of 21H2O molecules per structural formula unit at P/P0 = 0.86. Besides, desorption curves show hysteresis behaviours, which indicates strong hydrogen-bonding interactions between the guest water molecules and the hydrophilic groups (protonated imines and imidazoles).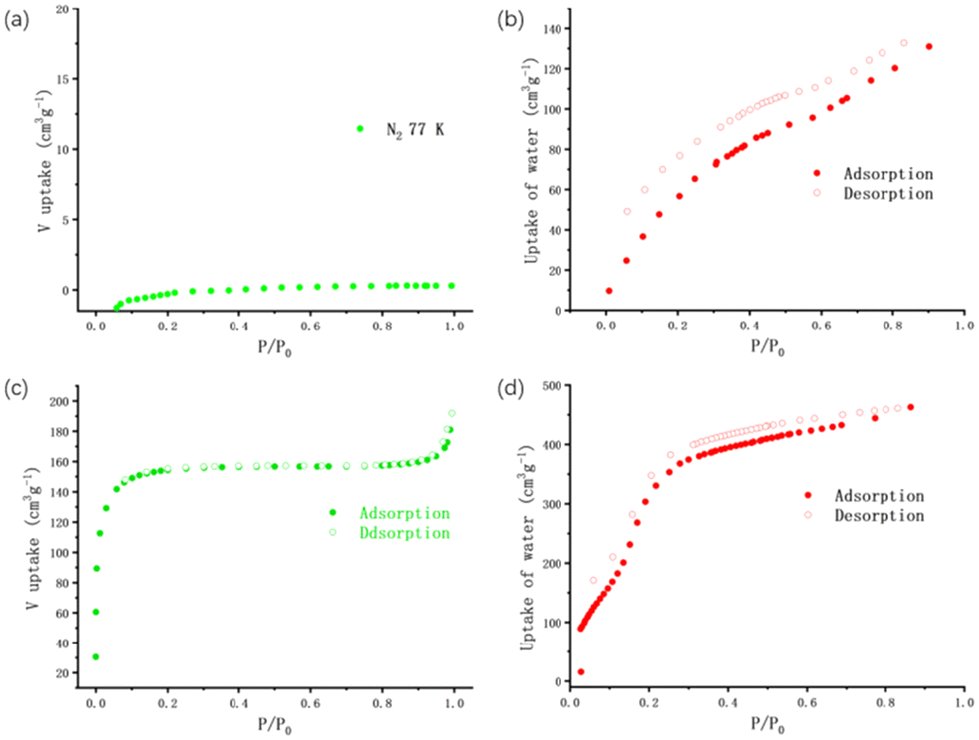 | ||
| Fig. 2 (a) N2 adsorption isotherms at 77 K of Gd-MOF. (b) Water vapour adsorption isotherm of Gd-MOF at 298 K. (c) N2 adsorption isotherms at 77 K of Zr-MOF. (d) Water vapour adsorption isotherm of Zr-MOF at 298 K. | ||
Thermo and chemical stabilities of Zr-MOF and Gd-MOF
In order to use the MOFs under various conditions, both thermal and chemical stabilities of Gd-MOF were assessed by thermogravimetric analysis, variable temperature powder X-ray diffraction (VTPXRD) and PXRD studies. Thermogravimetric analyses (TGA) and variable temperature powder X-ray diffraction (VTPXRD) showed that Gd-MOF can be thermally stable up to 260 °C (Fig. 3a and Fig. S3a†). A slight weight loss from 25 to 200 °C is mainly due to the loss of free solvent molecules. Gd-MOF exhibits two abrupt weight losses (Fig. 3a): the first one (from 280 to 330 °C) corresponding to the departure of HCOOH (exp. 6.9 wt%; theo. 6.8 wt%), which is determined by VTPXRD (Fig. S3a†), and the second, observed from 400 to 500 °C, is attributed to the decomposition of the organic components. When the temperature is above 600 °C, the compound completely turns to Gd2O3 (exp. 25.08 wt%; theo. 24.55 wt%). Regarding the chemical stability, Gd-MOF was refluxed in different organic solvents (methanol, acetone, acetonitrile, and toluene) and distilled water for 2 days. From the PXRD profiles, it is obvious that the framework structures are retained, which demonstrates the solvent stability of the solids (Fig. 3b and Fig. S3b†). However, Gd-MOF is unstable in both acid and base, as it will be slowly digested in water of pH = 3 and pH = 11.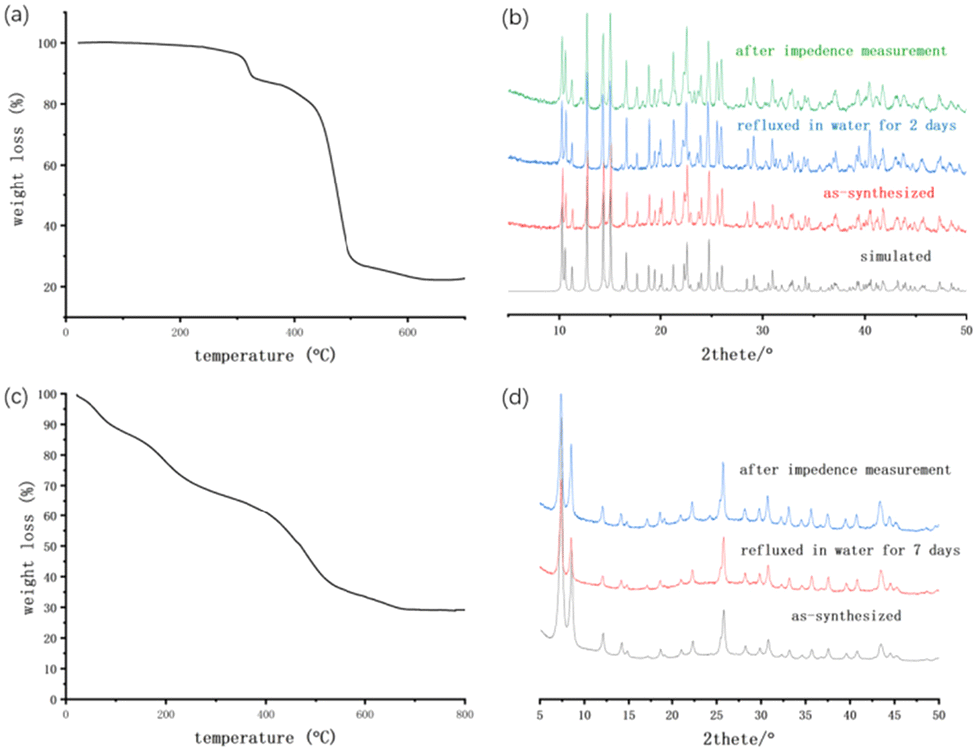 | ||
| Fig. 3 (a) TGA of Gd-MOF. (b) Simulated, as-synthesized, water treated and after impedance testing PXRD patterns for Gd-MOF. (c) TGA of Zr-MOF. (d) The as-synthesized, water treated and after impedance testing PXRD patterns for Zr-MOF. | ||
The TGA diagram of Zr-MOF demonstrates that Zr-MOF keeps losing weight during the heating process. The weight loss at 20–150 °C is mainly due to the loss of crystallized water molecules (exp. 14.0 wt%; theo. 14.4 wt%) (Fig. 3c). Departure of organic components and framework decomposition begin at around 400 °C. To explore water-mediated proton conduction of Zr-MOFs, we tested the water stability of them by refluxing them in water for 7 days. Robustness of the structure is confirmed by PXRD patterns, which illustrates the significant water stability of Zr-MOFs (Fig. 3d).
Proton conductivity behaviours
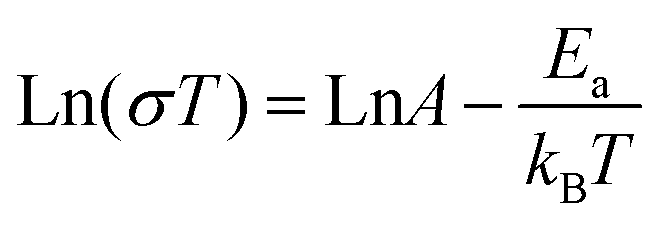
The proton conductivities of Gd-MOF and Zr-MOF were measured by an AC impedance method. The Nyquist plots for Gd-MOF demonstrate similar features, with one semicircle at a high frequency and a tail at a low frequency (Fig. 4a and S4a†). At room temperature and different relative humidity (RH) conditions, Nyquist diagrams of the Gd-MOF sample were obtained (Fig. S4a†). At the same temperature, the proton conductivity of Gd-MOF decreases and the tail of the Nyquist plots vanishes when the environmental humidity decreases. At 303 K, the proton conductivities of Gd-MOF are 8.98 × 10⁻⁵ S cm−1 (98% RH), 2.52 × 10⁻⁶ S cm−1 (80% RH), 1.01 × 10⁻⁶ S cm−1 (70% RH), 6.28 × 10⁻⁷ S cm−1 (60% RH), and 1.04 × 10⁻⁷ S cm−1 (50% RH) (Fig. S4a†). From the environmental humidity of 50% to a humidity of 98% RH, the proton conductivity increases by about 3 orders of magnitude, proving that humidity plays an important role on the proton conductivity of Gd-MOF. To verify the influence of temperature on the proton conductivity of Gd-MOF, the AC impendence was measured at different temperatures under 98% RH. From 303 K to 333 K, the radius size of the semicircle in Nyquist plots decreases obviously, and the conductivity increases significantly with the increasement of temperature and the maximum of 3.01 × 10⁻³ S cm−1 was found at 333 K and 98% RH, indicating that the proton conductivity of Gd-MOF is related to the temperature (Fig. 4a). The proton conductivity of Zr-MOF was also tested at different humidities at 303 K (Fig. S4b†). The proton conductivities of Zr-MOF are 9.69 × 10⁻⁴ S cm−1 (98% RH), 1.93 × 10⁻⁴ S cm−1 (80% RH), 1.45 × 10⁻⁴ S cm−1 (65% RH), 7.27 × 10⁻⁵ S cm−1 (50% RH), and 4.84 × 10⁻⁵ S cm−1 (40% RH) at 303 K. From the environmental humidity of 40% to a humidity of 98% RH, the proton conductivity only increases by about 1 order of magnitude, which is less than that of Gd-MOF. As we can see from water vapour adsorption isotherm of Zr-MOF at 298 K (Fig. 2d), water vapour uptake of Zr-MOF decreases slightly from P/P0 = 0.86 to P/P0 = 0.32. Consequently, the proton conductivity of Zr-MOF does not change dramatically as the environmental humidity drops. The temperature-dependent Nyquist plots at 98% RH exhibit that the proton conduction of Zr-MOF is also affected by temperature (Fig. 4c). As the temperature increases, the conductivity of Zr-MOF increases to 1.81 × 10⁻² S cm−1 at 353 K and 98% RH, which is close to those of the other UiO-66 frameworks (Table S3†).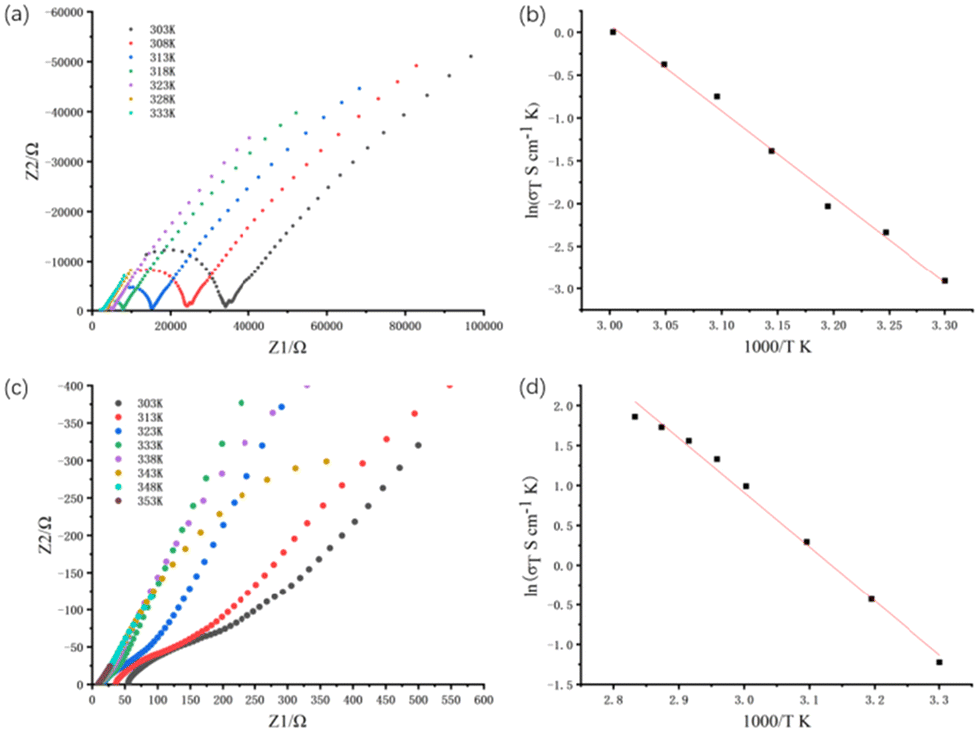 | ||
| Fig. 4 (a) Nyquist plots of Gd-MOF at 98% RH and different temperatures. (b) Arrhenius plots of Gd-MOF at 98% RH. (c) Nyquist plots of Zr-MOF at 98% RH and different temperatures. (d) Arrhenius plots of Zr-MOF at 98% RH. | ||
In order to study the mechanism of proton transport, the activation energy of proton transport is calculated by using the Arrhenius equation. Here is the formula:
 | (1) |
As can be seen from Fig. 3b and d, the well-matched PXRD patterns of Gd-MOF and Zr-MOF can be observed before and after impedance measurement, indicating the durability of the materials. Furthermore, in order to ensure the practical application of both MOFs, we investigated the relationship between the proton conductivity and time. As indicated in Fig. S5,† the proton conductivities remain almost constant for Zr-MOF under high temperature and humidity conditions after 24 h.
Conclusions
Two imidazoledicarboxylate-based proton-conductive MOFs were successfully synthesized, and their proton conduction was fully explored under water vapor conditions. The results demonstrate that both compounds feature temperature- and humidity-dependent conducting behaviour. Their best proton conductivities can reach 1.82 × 10⁻² S cm−1 for Zr-MOF at 98% RH and 80 °C and 3.01 × 10⁻³ S cm−1 for Gd-MOF at 98% RH and 60 °C. At the same time, their water and chemical stabilities by PXRD were also investigated. The time-dependent measurements revealed that the MOFs also have excellent electrochemical stability. The conductive mechanism has been discussed according to the structural analyses, Ea calculations, and water adsorption. Our research offers more choice for the design and preparation of new crystalline proton-conductive materials.Author contributions
Kun-Peng Chen: synthesis and testing of compounds, data curation, conceptualization, writing – manuscript, and visualization. Yue Ma: preparation of composite membranes and resources. Hong-Xia Ren: proton conductivity measurement. Chen-Xi Zhang: data process and analysis and manuscript revision. Qing-Lun Wang: funding acquisition, writing – reviewing and manuscript revision. All authors have given approval to the final version of the manuscript.Conflicts of interest
There are no conflicts to declare.Acknowledgements
This work was supported by the National Natural Science Foundation of China (No. 22371138, 21771111 and 21371104).References
- M. Z. Jacobson, W. G. Colella and D. M. Golden, Science, 2005, 308, 1901–1905 CrossRef CAS PubMed.
- B. C. H. Steele and A. Heinzel, Nature, 2001, 414, 345–352 CrossRef CAS PubMed.
- K. A. Mauritz and R. B. Moore, Chem. Rev., 2004, 104, 4535–4585 CrossRef CAS PubMed.
- Q. F. Li, R. H. He, J. O. Jensen and N. J. Bjerrum, Chem. Mater., 2003, 15, 4896–4915 CrossRef CAS.
- J. A. Hurd, R. Vaidhyanathan, V. Thangadurai, C. I. Ratcliffe, I. L. Moudrakovski and G. K. H. Shimizu, Nat. Chem., 2009, 1, 705–710 CrossRef CAS PubMed.
- F. M. Zhang, L. Z. Dong, J. S. Qin, W. Guan, J. Liu, S. L. Li, M. Lu, Y. Q. Lan, Z. M. Su and H. C. Zhou, J. Am. Chem. Soc., 2017, 139, 6183–6189 CrossRef CAS PubMed.
- F. Yang, G. Xu, Y. Dou, B. Wang, H. Zhang, H. Wu, W. Zhou, J.-R. Li and B. Chen, Nat. Energy, 2017, 2, 877–883 CrossRef CAS.
- W. J. Phang, H. Jo, W. R. Lee, J. H. Song, K. Yoo, B. Kim and C. S. Hong, Angew. Chem., Int. Ed., 2015, 54, 5142–5146 CrossRef CAS PubMed.
- S. Mukhopadhyay, J. Debgupta, C. Singh, R. Sarkar, O. Basu and S. K. Das, ACS Appl. Mater. Interfaces, 2019, 11, 13423–13432 CrossRef CAS PubMed.
- X.-M. Li, L.-Z. Dong, S.-L. Li, G. Xu, J. Liu, F.-M. Zhang, L.-S. Lu and Y.-Q. Lan, ACS Energy Lett., 2017, 2, 2313–2318 CrossRef CAS.
- Y. S. Wei, X. P. Hu, Z. Han, X. Y. Dong, S. Q. Zang and T. C. Mak, J. Am. Chem. Soc., 2017, 139, 3505–3512 CrossRef CAS PubMed.
- V. G. Ponomareva, K. A. Kovalenko, A. P. Chupakhin, D. N. Dybtsev, E. S. Shutova and V. P. Fedin, J. Am. Chem. Soc., 2012, 134, 15640–15643 CrossRef CAS PubMed.
- Q. Tang, Y. Liu, S. Liu, D. He, J. Miao, X. Wang, G. Yang, Z. Shi and Z. Zheng, J. Am. Chem. Soc., 2014, 136, 12444–12449 CrossRef CAS PubMed.
- H. A. Patel, N. Mansor, S. Gadipelli, D. J. L. Brett and Z. Guo, ACS Appl. Mater. Interfaces, 2016, 8, 30687–30691 CrossRef CAS PubMed.
- B.-B. Hao, N. Qiao, Y. Rong, C.-X. Zhang and Q.-L. Wang, Inorg. Chem., 2022, 61, 9533–9540 CrossRef CAS PubMed.
- X.-Y. Dong, J.-H. Wang, S.-S. Liu, Z. Han, Q.-J. Tang, F.-F. Li and S.-Q. Zang, ACS Appl. Mater. Interfaces, 2018, 10, 38209–38216 CrossRef CAS PubMed.
- P. Li, Y. Chen, F. Xiao, M. Cao, J. Pan, J. Zheng, H. Li, K. Zhao, X. Zhang and Y. Zhang, J. Mater. Sci., 2023, 58, 14154–14176 CrossRef CAS.
- S. Wang, H. Luo, X. Li, L. Shi, B. Cheng, X. Zhuang and Z. Li, Int. J. Hydrogen Energy, 2021, 46, 1163–1173 CrossRef CAS.
- D. Umeyama, S. Horike, M. Inukai, Y. Hijikata and S. Kitagawa, Angew. Chem., Int. Ed., 2011, 50, 11706–11709 CrossRef CAS PubMed.
- W. J. Phang, W. R. Lee, K. Yoo, D. W. Ryu, B. Kim and C. S. Hong, Angew. Chem., Int. Ed., 2014, 53, 8383–8387 CrossRef CAS PubMed.
- S. Bureekaew, S. Horike, M. Higuchi, M. Mizuno, T. Kawamura, D. Tanaka, N. Yanai and S. Kitagawa, Nat. Mater., 2009, 8, 831–836 CrossRef CAS PubMed.
- J. M. Taylor, K. W. Dawson and G. K. Shimizu, J. Am. Chem. Soc., 2013, 135, 1193–1196 CrossRef CAS PubMed.
- M. V. Nguyen, T. H. N. Lo, L. C. Luu, H. T. T. Nguyen and T. N. Tu, J. Mater. Chem. A, 2018, 6, 1816–1821 RSC.
- H. B. Luo, Q. Ren, P. Wang, J. Zhang, L. Wang and X. M. Ren, ACS Appl. Mater. Interfaces, 2019, 11, 9164–9171 CrossRef CAS PubMed.
- S. Liu, Z. Yue and Y. Liu, Dalton Trans., 2015, 44, 12976–12980 RSC.
- Y. Ye, W. Guo, L. Wang, Z. Li, Z. Song, J. Chen, Z. Zhang, S. Xiang and B. Chen, J. Am. Chem. Soc., 2017, 139, 15604–15607 CrossRef CAS PubMed.
- X. Xie, Z. Zhang, J. Zhang, L. Hou, Z. Li and G. Li, Inorg. Chem., 2019, 58, 5173–5182 CrossRef CAS PubMed.
- F. Yang, H. Huang, X. Wang, F. Li, Y. Gong, C. Zhong and J. R. Li, Cryst. Growth Des., 2015, 15, 5827–5833 CrossRef CAS.
- J. M. Taylor, S. Dekura, R. Ikeda and H. Kitagawa, Chem. Mater., 2015, 27, 2286–2289 CrossRef CAS.
- X. S. Xing, Z. H. Fu, N. N. Zhang, X. Q. Yu, M. S. Wang and G. C. Guo, Chem. Commun., 2019, 55, 1241–1244 RSC.
- S. S. Wang, X. Y. Wu, Z. Li and C. Z. Lu, Dalton Trans., 2019, 48, 9930–9934 RSC.
- G. M. Sheldrick, Acta Crystallogr., Sect. A: Found. Adv., 2015, 71, 3–8 CrossRef PubMed.
- S. Yuan, Y. P. Chen, J. S. Qin, W. Lu, L. Zou, Q. Zhang, X. Wang, X. Sun and H. C. Zhou, J. Am. Chem. Soc., 2016, 138, 8912–8919 CrossRef CAS PubMed.
- S. Rapti, D. Sarma, S. A. Diamantis, E. Skliri, G. S. Armatas, A. C. Tsipis, Y. S. Hassan, M. Alkordi, C. D. Malliakas, M. G. Kanatzidis, T. Lazarides, J. C. Plakatouras and M. J. Manos, J. Mater. Chem. A, 2017, 5, 14707–14719 RSC.
- K. D. Kreuer, A. Rabenau and W. Weppner, Angew. Chem., Int. Ed., 2003, 21, 208–209 CrossRef.
- K. D. Kreuer, Chem. Mater., 1996, 8, 610–641 CrossRef CAS.
Footnote |
| † Electronic supplementary information (ESI) available. CCDC 2321488. For ESI and crystallographic data in CIF or other electronic format see DOI: https://doi.org/10.1039/d3dt04338j |
| This journal is © The Royal Society of Chemistry 2024 |