
A review on the application of molecular descriptors and machine learning in polymer design
Yuankai
Zhao
a,
Roger J.
Mulder
 b,
Shadi
Houshyar
a and
Tu C.
Le
*a
b,
Shadi
Houshyar
a and
Tu C.
Le
*a
aSchool of Engineering, STEM College, RMIT University, GPO Box 2476, Melbourne, VIC 3001, Australia. E-mail: Tu.Le@rmit.edu.au
bCSIRO Manufacturing, Research Way, Clayton, VIC 3168, Australia
First published on 11th July 2023
Abstract
Polymers are an important class of materials with vast arrays of physical and chemical properties and have been widely used in many applications and industrial products. Although there have been many successful polymer design studies, the pace of materials discovery research can be accelerated to meet the high demand for new, functional materials. With the advanced development of artificial intelligence, the use of machine learning has shown great potential in data-driven design and the discovery of polymers to date. Several polymer datasets have been compiled, allowing robust machine learning models to be trained and provide accurate predictions of various polymer properties. Such models are useful for screening promising candidate polymers with high-performing properties prior to lab synthesis. In this review, we focus on the most critical components of polymer design using molecular descriptors and machine learning algorithms. A summary of existing polymer databases is provided, and the different categories of polymer descriptors are discussed in detail. The application of these descriptors in machine learning studies of polymer design is critically reviewed, leading to a discussion of the challenges, opportunities, and future perspectives for polymer research using these advanced computational tools.
1 Introduction
Polymers are one of the most important classes of materials in everyday use and in industry.1–7 Within the past decades, polymers have been explored for a wide range of applications from daily life to frontier technology, such as aerospace, building, medication, energy, and the food industry.8–10 Because of the broad spectrum of current and potential industrial uses, the need for new polymer materials with purpose-designed properties is significant. However, owing to the near infiniteness of chemical space, polymers possess a variety of distinctive physical, chemical and electrical properties. The immense combinations of extensive chemical composition, various monomer structures, complex polymer chain structures and various synthesis methods bring tremendous opportunities as well as challenges in polymer production and selection.11 The large number of published articles and high-dimensional polymer data make it resource intensive for researchers to screen the reported data and extract useful information on structure–property relationships, without the aid of machine learning (ML) and other advanced computational tools.12 Significant effort has been made in the past in the design and discovery of new polymers. Conventionally, trial-and-error experiments were done to synthesize and characterize new polymers. Although great success was achieved, the limitation of this approach is also inevitable, as experiments were all performed under the intuition and experience of researchers.13 Furthermore, the efficiency of such trial-and-error process is low and unstable. As a result, the innovation of new polymers is time-consuming and requires extensive resources.14 With the development of computational technology and materials theory, computational methods including Density Functional Theory (DFT) and Molecular Dynamics (MD) have been utilized for material design and development, although the cost of these computational studies is high.15,16In recent years, with the rapid development of computing power and Artificial Intelligence algorithms, ML has shown great utility in classification and regression tasks.17 ML approaches have the ability to process high-dimensional data, and extract both linear and non-linear relationships. As a result, ML can be deployed with high accuracy and the cost for computation is relatively low. As a consequence, ML has been aligned with other data-centric domains and achieved great success.18–20 For example, in the field of polymer design, the implementation of ML to identify the relationship between polymer microchemical structure and various macro properties has been proved to be efficient. In these studies, a polymer's structural information was coded as an input of the ML model and target polymer properties were set as output. The trained models absorb and store the underlying relationship, providing stable and precise predictions of polymer properties.21–24 The process of developing polymers with fit-for-function properties with the aid of ML can be summarised in critical steps as shown in Fig. 1.
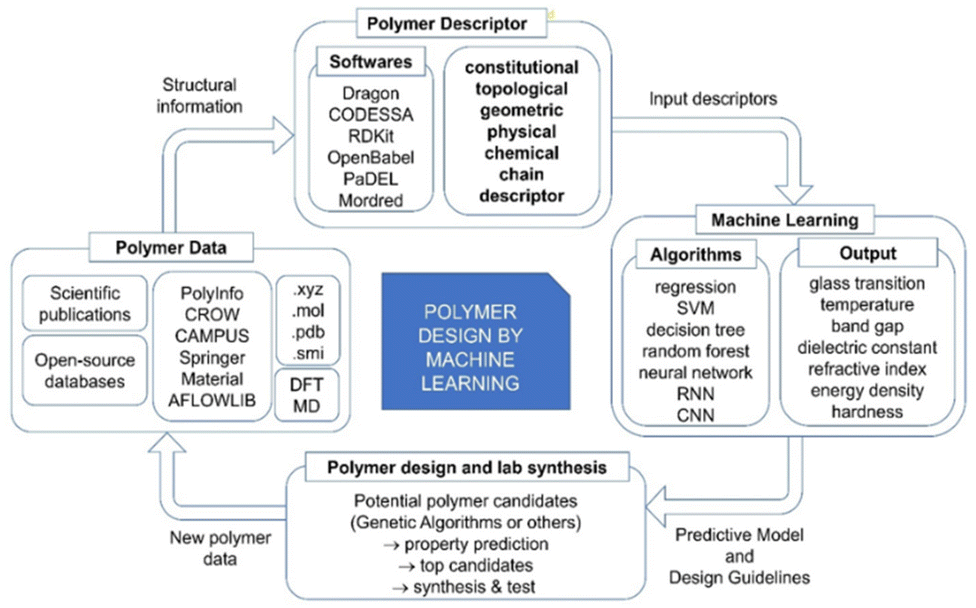 | ||
| Fig. 1 The critical components of polymer design with the aid of machine learning. | ||
Like in any other field, the collection of data is the first and crucial step in polymer design using ML. The robustness of the studies is closely related to the sufficiency and fidelity of data. However, the need for more relevant data has been a challenge for polymer design using ML due to the limitation and cost of lab-derived data as well as the need for standardisation in reporting such data. The two most common and reliable sources of polymer data are scientific publications and open-source databases. Polymer data reported in published articles are from lab experiments, so the reliability and fidelity are higher than other sources. However, a significant drawback is that manual data collection from the literature is very time consuming, resulting in inefficient data collection. One possible solution for efficient data extraction is using a natural language process (NLP) tool, but this approach still needs further development to become a practical solution.25 Open-source polymer databases are another important resource, which provide easy access to a large amount of data and supporting functions such as searching, sorting and visualising that contribute to more efficient data management. However, the data are usually obtained from multiple sources that use predicted or simulated data to enlarge the volume of the database, leading to a decrease of data fidelity. To solve this problem, some studies reported exploring of data fusion approaches to enhance the uniformity of data.26–28
The second step in the workflow is to transform polymer data into a computer-readable format. The numerical representation of a polymer is termed the polymer descriptor, which aims to capture essential polymer structural information for ML models.29 To date, there are thousands of polymer descriptors that have been developed to quantify diverse structural features.30 As polymer descriptors carry the information fed to ML models, the valid and relevant information carried by descriptors directly determines the accuracy achieved with ML models; therefore, the information captured by polymer descriptors is regarded as determining the success of the polymer design. Although a great many polymer descriptors have been developed, they are used differently in various polymer design applications. There is no rule on how to select the optimal descriptors, and it is difficult to evaluate the use of descriptors across studies. A more commonly accepted approach is to generate a long list of descriptors and select the ones that are most closely associated with the target properties. It can be foreseen that the construction of new polymer descriptors and the exploration of descriptor selection strategy will significantly promote the development of the whole field.
In the third step of polymer design, polymer descriptors and target property values are fed to the ML model as inputs and outputs. ML models are central to the overall process as they provide accurate property predictions and filter candidates with a high probability of possessing the desired properties, thus significantly reducing the research time. Another reason for adopting ML is that it is easy to deploy. In many studies, Python (a programming language) has been used and ML models can be built and evaluated in a short time period. To date, many ML models have been successfully developed for polymer design, ranging from simple regression to complex neural networks, by which diverse polymer properties are explored.31
In the final step of the process, the well-trained ML model will be used to identify polymer candidates with desired properties for lab synthesis. One common approach is to manually construct a set of candidate polymers, predict their property values and select the top-performing ones for synthesis. Another approach is the combination of Genetic Algorithm (GA) and generative methods. GA is a selection algorithm simulating natural evolution and polymers are seen as sequences of the building blocks. In each iteration of the generation, the more promising offspring will be selected to be reconstructed. Thus, after many generations, there is a high probability that newly generated polymers will meet the property requirements. Generative methods will apply the map from the hidden space of the property to the polymer structure space by using newly generated polymers. With this map, polymers with desired properties can be identified.
In this review, important components of polymer design and development using ML will be summarised with a focus on polymer descriptors. In section 2, the collection and management of polymer data will be discussed, and in section 3 the different categories of polymer descriptors will be explained. Available platforms and software generating these descriptors will be summarised. Algorithms for descriptor selection will also be introduced in detail. Section 4 provides an overview of different ML approaches, while section 5 critically reviews the application of polymer descriptors and ML algorithms in polymer design and development. In the last section, the achievements as well as limitations and challenges of the current polymer design technique using ML will be outlined, and future perspectives will be discussed.
2 Data collection
Data collection is the first stage of polymer design. The quality of the data is critical to the overall study. While low fidelity can lead to the failure of the model training, sufficient, high-quality data can facilitate the design of polymers with desired properties.32 Unfortunately, despite the large volume of data currently available in polymer databases, it is hard to obtain relevant data when studying specific polymer aspects.33–35 The need for polymer data has created an obstacle for current ML studies. Here, two main sources of polymer data will be discussed.One robust data resource is scientific publications, such as journal articles, conference papers and handbooks.36 Data obtained through these publications generally have a higher degree of credibility and accuracy because they are obtained directly from laboratory experiments.37 However, rich data are contained in articles, and collecting them requires much effort and is still mainly done manually. To overcome the difficulty of inefficient manual data collection, one ML approach of NLP has been explored and applied to extract polymer information.38–40 NLP can scan the input text and automatically extract polymer information including polymer name, synthesis methods, processing conditions and polymer property value. This method is still in the early stage but shows great potential with the rapid development of NLP.
Another important data resource is open-source polymer databases. These databases provide a large amount of data, saving a great deal of time, but many of them need to provide raw data directly and researchers can only access data for applications that may not be of interest. Collected data also come from multiple sources. First-principles theory computations such as DFT and MD are one of the important resources. Data generated by this non-trivial method are included in many databases, which may lead to mixing of data with different fidelity. A data fusion approach can be applied to balance the trade-off between data amount and quality.41,42 Polymers that have not been synthesised are also available in existing databases.43 Hypothetical polymer data generated by computational tools such as DFT and MD calculation are provided in such databases. Taking PI1M as an example, 12![[thin space (1/6-em)]](https://www.rsc.org/images/entities/char_2009.gif) 000 polymer data from the PoLyInfo database are fed into a generative recurrent neural network (RNN), which then samples approximately 1 million theoretical polymer data.44,45 Although hypothetical polymer databases show great potential for polymer design, the effectiveness of such is yet to be proved, and the application scope needs to be clarified. Table 1 lists some commonly used polymer databases.
000 polymer data from the PoLyInfo database are fed into a generative recurrent neural network (RNN), which then samples approximately 1 million theoretical polymer data.44,45 Although hypothetical polymer databases show great potential for polymer design, the effectiveness of such is yet to be proved, and the application scope needs to be clarified. Table 1 lists some commonly used polymer databases.
| Name | Description | URL |
|---|---|---|
| PoLyInfo | The largest polymer database containing over 20000 polymers and more than 100 types of properties. |
https://polymer.nims.go.jp/en |
| CROW | Thermo-physical data for over 250 polymers provides technical information on the most common plastics and resins. | https://www.polymerdatabase.com |
| CAMPUS | Over 9600 entries provided by plastic material suppliers. | https://www.campusplastics.com |
| PI1M | A hypothetical database containing about 1 million polymers. These polymers were created using a generated model trained using 12000 polymers from PoLyInfo. |
https://github.com/RUIMINMA1996/PI1M |
| Khazana | A platform containing over 3270 polymer entries storing structure and property data created by atomistic simulations. | https://khazana.gatech.edu |
| PubChem | Over 60000 polymers with structure and property information provided. |
https://pubchem.ncbi.nlm.nih.gov |
| Polymer property predictor and database | Provide 263 Flory–Huggins chi parameters and 212 glass transition temperature data. Also proved a binary polymer solution cloud point database of 6524 entries. With the value of polymer weight-average molecular weight (g mol−1), polydispersity index (Mw/Mn), polymer volume fraction, polymer mass fraction and tata cloud point temperature in degrees Celsius. | https://pppdb.uchicago.edu |
Effective gathering and storing of polymer data is a fundamental requirement in ML for polymer research. The first step is to determine a suitable data type. Data from peer-reviewed scientific publications are usually the best choice. However, manual searching of publications can be time-consuming, resulting in limited data availability for modelling and may impact the quality of ML models. On the other hand, some studies may require lower data fidelity and greater data amount. For these, collecting data from open-source databases can be useful. In many cases, data are generated computationally and are available in a much larger amount. Utilizing management tools provided by the sites enables efficient searches and grouping of a broader range of polymers, which can facilitate data collection.
Polymer data can be numeric or structural. Numeric data, including polymer names and property values, are often stored in tabular format such as Excel files for ease of transfer and utilization. Structural data, on the other hand, can be represented using various file formats, each possessing specific purposes and characteristics. Below are some commonly used file extensions for polymer structural data:
‘.mol’ or ‘.sdf’: these extensions refer to the MDL molfile and structure-data file formats, respectively. They are widely used for storing molecular structures, including atom coordinates, bond information, and additional properties.
‘.pdb’: the Protein Data Bank (PDB) format is primarily used for representing three-dimensional structures of biological macromolecules, such as proteins and nucleic acids. It contains information about the atom coordinates, connectivity, and experimental data.
‘.smiles’ or ‘.smi’: the Simplified Molecular Input Line Entry System (SMILES) format represents molecular structures using a line notation. It provides a compact and human-readable representation of molecules, enabling easy exchange and processing of chemical data.
‘.xyz’: this extension represents molecular structures in the XYZ file format. It includes atom coordinates and can be easily read and processed by various molecular visualization software packages.
3 Polymer descriptors
Polymer data cannot be used directly for ML model training. Therefore, polymer structures need to be represented in a computer-readable format. Polymer descriptors are numerical representations of polymers that extract important structural information and transfer it to ML models. The generation of polymer descriptors is the most critical step in polymer design using ML, as it determines how much valid polymer information can be transmitted to the models. Adequate, valid information is a prerequisite and important condition for ML models to obtain high prediction accuracy.To date, there are thousands of descriptors that can be used to describe polymer features. Despite such a large number, most descriptors can be classified into two categories: monomer-level descriptors and bulk material descriptors. A polymer is a chain-structured material with high molecular weight, and the structure and properties of the repeating units (monomers) are highly correlated with the properties of the polymer. Monomer-level descriptors focus on various features of monomers, such as chemical composition, number of carbon backbone, molecular weight, ring or linear structure and functional groups. Bulk material descriptors capture large-scale features, such as the chain length and structure, surface features, chemical and physical properties.
Polymer descriptor selection is another important process. For some studies, although a large number of polymer descriptors can be calculated, in most cases only a small set of them are needed. Descriptors intrinsically linked to the polymer properties should be selected. Irrelevant descriptors will not only increase the computational cost, but also affect the accuracy of the ML model. An overly large number of descriptors can lead to over-fitting of ML models. For studies that generate many descriptors, a common approach is to rank the association between each descriptor and the property of interest, and then select the top ones for ML training.46 To date, with the limited number of reported studies on ML for polymers, no commonly high-ranking descriptors have been identified. The use of scattering datasets, diverse target properties and trained models has resulted in different suitable descriptor sets for the studies.
In the following sections, the different types of descriptors will be discussed. A variety of well-developed software or programming packages that can calculate descriptors will be summarised.47–49 Descriptor selection algorithms will also be reviewed.
3.1 Monomer-level descriptors
Line notation is one descriptor that can effectively represent monomers where the structural information of monomers is encoded into a computer-readable line notation. The Simplified Molecular-Input Line-Entry System (SMILES) is a one-line notation where each monomer is represented by an ASCII string that uniquely encodes atoms, bonds, rings and branches of the monomer. Because SMILES strings are intuitively suitable for both human and machine to read, SMILES is widely used in materials research.50 A SMILES string can be directly used as a type of descriptor for an ML model or transformed to another format such as binary vectors or graphs.51,52 SMILES notation has also been extended for better representation.53–55Constitutional descriptors are another type of descriptor. They represent atom-based information, including different chemical attributes including type, weight, number of atoms in the molecular, and the bond between them.56 Some constitutional descriptors are summarised and shown in Table 2.
| Descriptor | Symbol |
|---|---|
| Molecular weight/average molecular weight | MW/AMW |
| Sum/mean of atomic van der Waals volumes (scaled on carbon atom) | Sv/Mv |
| Sum/mean of atomic Sanderson electro-negativities (scaled on carbon atom) | Se/Me |
| Sum/mean of atomic polarizabilities (scaled on carbon atom) | Sp/Mp |
| Mean electro-topological state | Ms |
| Number of atoms (H, C, O) | nH, nC, nO |
| Number of non-hydrogen atoms | nSK |
| Number of bonds/non-hydrogen bonds | nBT/nBO |
| Number of multiple bonds | nBM |
| Number of single/double/triple bonds | nSB/nDB/nTB |
| Number of aromatic bonds | nAB |
| Aromatic ratio | ARR |
| Number of rotatable bonds | RBN |
| Rotatable bond fraction | RBF |
| Number of rings | nCIC |
| Number of rings with 3–12 members | nR03–nR12 |
Topological descriptors are 2D connectivity-based indices representing the connections between atoms and sections in the structure, and these play a critical role in the modelling of polymer properties. Monomers are regarded as a connected graph in the topological representation, denoted as G = (V, E). Here V represents a set of vertices in the graph, which are the atoms in the monomers, while E represents a set of edges which are the bonds connecting atoms. Topological indices consider the monomers’ atom arrangement, and encode their shape, size, connection type and bonds, representing the 2D structural nature of the monomer.57,58Table 3 provides some commonly used topological and other 2D indices.
| Topological index | Description | Ref. |
|---|---|---|
| Walk and path count | Descriptors calculated based on molecular graph, counting various walks, paths of different lengths. | 59 |
| Autocorrelation indices | Autocorrelation descriptor encodes the relative position of atoms or atom properties by calculating the separation between atom pairs in terms of number of bonds or Euclidean distance. | 60 |
| Balaban J | Average sum of distance connectivity. | 61 |
| Kappa indices | Indices describing monomer shape | 62 |
| Wiener index (W) | Sum of all the edges in the shortest path in the monomer graph between all non-hydrogen atom pairs. | 63 |
| Hyper-Wiener index | An index calculated using the sum of distance and squared distance of atoms. | 64 |
| Hosoya (Z) | Number of sets of non-adjacent bonds in monomer graph, useful for physical properties modelling. | 65 |
Geometrical descriptors are generated from the atomic 3D coordinates, representing the 3D structural information. These geometrical descriptors can obtain structural information such as monomer shape, volume, and surface area. Monomers with the same chemical composition but different 3D structures can be differentiated by geometrical descriptors, thus they are useful for cases where the shape or structural changes play a critical role in defining polymer properties. Although geometrical descriptors provide more information than 2D descriptors, they can be computationally expensive.
Some common geometrical descriptors are listed in Table 4.
| Geometrical index | Description | Ref. |
|---|---|---|
| 3D Wiener index | Wiener index calculated by geometrical distance matrix. | 66 |
| 3D Balaban index | Balaban index is calculated by a geometrical distance matrix representing the distance between each pair of atoms in 3D space. | 67 |
| Shadow area | A set of six shape parameters calculated by the size of the shadow of the molecule projected on the X–Y, Y–Z and X–Z axes plane and relative normalized rectangle size. | 68 |
| Solvent-accessible surface area (SASA) | Solvent-accessible surface of the monomer. | 69 |
| Molar volume | Volume occupied by monomer. | 70 |
Fingerprint is another type of descriptor that is commonly used.23 These are simple one-dimensional vectors with each element denoting the presence or count of some pre-defined structures or those corresponding to some polymer properties. Fig. 2 is an example showing the features (fingerprint descriptors) of poly(prop-1-ene) monomer represented as a 1D vector.
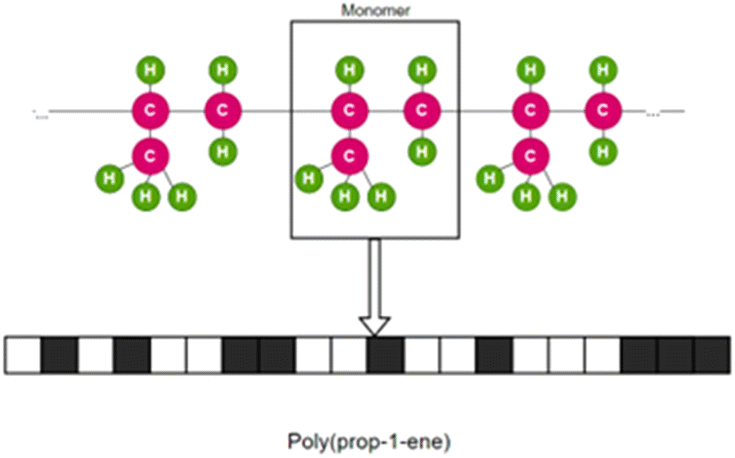 | ||
| Fig. 2 Fingerprint of poly(prop-1-end) monomer. The black and white boxes denote the presence or count of some pre-defined structures or those that correspond to some polymer properties. | ||
Although fingerprints can be used to describe polymer chain features, most of the fingerprints used to date are derived from monomer-scale information. In most studies, the similarity in fingerprints means similarity in polymer sub-structure or backbone and higher possibility of similar properties.
3.2 Bulk polymer-level descriptors
The physicochemical properties of the bulk polymers can be used as input descriptors in ML models predicting polymer properties. These physical and chemical properties could be influential factors of the target polymer properties where a high correlation between these properties exists. In cases where the polymer properties are determined by structural information that may not be numerically represented, considering polymer physicochemical descriptors can help increase the predictive accuracy. Table 5 summarises some physical and chemical properties reported in the PoLyInfo database.| Property type | Property |
|---|---|
| Physical property | Density |
| Specific volume | |
| Thermal property | Crystallization kinetics |
| Crystallization temperature | |
| Glass transition temperature | |
| Heat of crystallization | |
| Heat of fusion | |
| Thermal decomposition | |
| LC phase transition temperature | |
| Linear expansion coefficient | |
| Melting temperature | |
| Specific heat capacity thermal conductivity | |
| Thermal diffusivity | |
| Volume expansion coefficient | |
| Electrical property | Dielectric breakdown voltage |
| Dielectric constant (DC) | |
| Dielectric dispersion, electric conductivity | |
| Surface resistivity | |
| Volume resistivity | |
| Physicochemical property | Contact angle |
| Gas diffusion coefficient (D) | |
| Gas permeability coefficient (P) | |
| Gas solubility coefficient (S) | |
| Hansen parameter delta-d (dispersive component) | |
| Hansen parameter delta-h (hydrogen, bonding component) | |
| Hansen parameter delta-p (polar component) | |
| Interfacial tension | |
| Solubility parameter | |
| Surface tension | |
| Water absorption | |
| Water vapor transmission | |
| Heat characteristic | Brittleness temperature |
| Deflection temperature under load (HDT) | |
| Softening temperature | |
| Hardness | Rockwell hardness |
Polymer chain-level information can also be used as descriptors. They capture structural information such as shape, length, degree of branching and other features of the polymer chains. Examples of polymer chain-level descriptors are the longest or shortest of the side chain length and distance between two specific blocks. In many cases, the polymer chain-level descriptors have limited contribution to the predictivity of the models. However, for certain studies where polymer properties are highly dependent on the chain structure, these descriptors are necessary.
3.3 Polymer descriptor generation platform
The computation of polymer descriptors can be done using available software and open-source platforms. In most cases, using SMILES strings or structural files such as ‘.mol’ or ‘.xyz’ extension files, various polymer descriptors can be calculated quickly. Table 6 summarises some descriptor-generation software and platforms.| Software | Accessible descriptors | URL |
|---|---|---|
| Dragon | 5270 descriptors covering greatest variety of descriptors including constitutional, topological, connectivity and other 2D, 3D descriptors. | https://chm.kode-solutions.net/pf/dragon-7-0/ |
| CODESSA | Over 1500 descriptors including constitutional, topological, geometrical, electrostatic, quantum-chemical, and thermodynamics descriptors. | https://www.codessa-pro.com/index.htm |
| PaDEL | Over 1800 descriptors including 1D, 2D, 3D descriptors. Over 10 types of fingerprints are also available. | https://www.yapcwsoft.com/dd/padeldescriptor/ |
| Mordred | More than 1800 2D, 3D descriptors. | https://github.com/mordred-descriptor/mordred |
| ChemDesc | Over 3600 descriptors from Chemopy, BlueDesc, RDKit, CDK, Pybel, PaDE, including constitutional, topological, geometrical, autocorrelation, connectivity and other descriptors. | https://www.scbdd.com/chemdes/list-descriptors/ |
| RDKit | A Python package for molecular representation and calculation. RDkit can be coded directly to calculate descriptors or used with other packages such as Mordred, ChemPy. RDKit itself can calculate 208 descriptors including physicochemical properties and fraction of a substructure. | https://www.rdkit.org/ |
| alvaDesc | More than 5500 descriptors such as constitutional, topological, geometrical and molecular fingerprint descriptors. | https://www.alvascience.com/alvadesc/ |
3.4. Descriptor selection algorithm
As the number of theoretical available polymer descriptors is rising, descriptor selection is increasingly necessary in polymer studies. Although it is possible to build a quantitative structure–property relationship (QSPR) model with all descriptors, the descriptors needed to build a predictive model only require a small subset.29 By removing descriptors that are irrelevant, redundant or noisy, a simpler and faster QSPR model can be built to achieve higher predictive accuracy. This process can also decrease the dimensionality of the QSPR model's input. Compared with molecules of interest, the number of descriptors is required to be controlled to a reasonable range to ensure the model reliability. The aim of descriptor selection is to remove irrelevant input features, reduce the input dimensionality and give greater weight to descriptors with effective information. The descriptor selection algorithm is the process of getting rid of unwanted polymer descriptors while preserving necessary information. There are two main types of strategy for descriptor selection: filter method and wrapper method.71Filter methods are intuitive, classic methods that filter descriptors by their relevance. To quantify the importance of descriptors, the correlation between descriptors and the output property such as Pearson correlation coefficient, information gain and Chi squared test is calculated as the relevance score. The Pearson correlation coefficient quantifies the linear relationship between two variables, indicating negative, positive or no correlation. Information gain measures the reduction in entropy or impurity to determine the most informative features that contribute the most to accurate predictions. The Chi-squared test is a statistical test used to determine the significance of the association between categorical variables by comparing the observed frequencies with the expected frequencies. Fig. 3 shows the process.
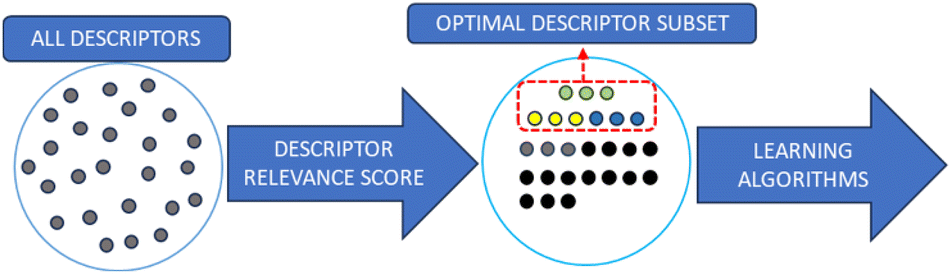 | ||
| Fig. 3 Descriptor selection workflow. The relevance score for each descriptor is computed. Based on the score, descriptors are ranked, and an optimal descriptor subset is identified. This subset is then fed into machine learning algorithms. | ||
Descriptors with top-ranking relevance scores are considered as carrying necessary information and have the highest correlation with the target property. Low-scoring descriptors are regarded as redundant or irrelevant, and will be removed. Once the relevance scores are computed and the descriptor ranking is determined, ML models are built using the highest-ranking descriptors. The total number of descriptors used in a model varies in different studies; however, this number should be less than half of the total number of data points.72
As the filter method is independent of the induction algorithm, it is quick, simple and easy to apply. However, the lack of interaction with the classifier can lead to a relatively low efficiency. Another disadvantage is that as the relevance scores of descriptors are calculated independently, the descriptors’ dependency cannot be considered. There are multiple approaches to calculate the relevance score, such as information gain, correlation coefficient, Euclidean distance and mutual information.73–77
Wrapper methods aim to find the subset of descriptors that can get the highest classifier accuracy. This subset is bound to the classifier and does not apply to other classifiers. Given that each classifier has its own biases, each will select different feature subsets. In general, the final prediction accuracy achieved by wrapper methods outperforms the filter method.29 One critical reason is that the correlation between descriptor and classifier is built, and descriptors’ dependence and their interaction with the predictive model are considered. The main disadvantages of wrapper methods include the high risk of overfitting, poor generalization ability and high computational cost. Several wrapper methods are summarized in Table 7.
| Method | Description | Advantage | Disadvantage |
|---|---|---|---|
| Forward selection78,79 | A descriptor with the highest fitness is first selected. Then progressively add one descriptor that performs the best with regard to fitness function (combined with previously selected descriptors). This process stops when the stopping criteria are reached. | Intuitive and simple to apply. | This method considers only the individual importance of descriptors. Descriptors that are relative and express as a group cannot be selected. |
| Backward elimination80 | Cyclically delete one descriptor until all descriptors left are significant. | Intuitive and simple to apply. | The error criterion is hard to set. |
| Stepwise selection81 | Add one descriptor that applies to the highest fitness function and analyze the significance of previous included descriptors. The descriptor that lost its significance will be removed. This process is repeated until no descriptor satisfies the selection criterion. | Simple to apply but the performance of this algorithm is good. | Non-linear relationships are not considered. Usually performs better on small descriptor poor.82 |
| Genetic algorithm83 | Simulating the natural selection phenomenon, GA algorithm first creates a group of N elements that contains same number of descriptors and calculates each individual's fitness. Then generates new offspring by crossover and mutation. Those with better fitness are kept and continue to reproduce. Different initial groups can be created to avoid local minimum and reach global optimum. | Simple to apply, falsifiable and considers global fitness.84 | It is hard to find the exact global optimum. |
Other methods, such as the Artificial Neural Network method and Simulated Annealing method have also been applied.85,86 As the selection methods become more elaborate, the risk of overfitting increases at the same time, and more computation and time are also required. To overcome the disadvantages above, a better strategy is to use a hybrid approach that combines different descriptor-selection algorithms. Some studies show that a hybrid approach can reduce the risk of overfitting, with promising performance.87,88
4 Machine learning approaches
Different ML algorithms can be applied to QSPR for polymers. Trained ML models can accurately predict various properties of interest and identify top candidates for further investigation. In this section, ML algorithms that have been used for polymer property prediction are introduced. ML optimization and evaluation methods are also discussed.Multiple linear regression (MLR) can be viewed as the most straightforward ML modelling algorithm.90 Regression-based algorithms are used in most reported polymer design studies using ML.91 MLR assumes that the relationship between input features and designated outputs is linear, which can be represented as:92
| y = w0 + w1x1 + w2x2 + w3x3 + ⋯ + wnxn | (1) |
 | (2) |
Gaussian process regression (GPR) is a generalized form of MLR. GPR is a non-parametric, Bayesian approach toward regression problems.93 Instead of assuming a closed function form representing the relationship between the input and output, GPR attempts to fit a flexible function curve for the prediction. GPR is a Bayesian approach-based approach, hence the prediction is in the form of probabilities.94 GPR performs well on small datasets, therefore it is suitable for polymer property prediction using ML. There are many other kinds of regression algorithms used in polymer studies, such as Partial Least Squares Regression, Stepwise Regression, Ridge Regression, Co-Kriging, and Lasso Regression.95,96
Support vector machine (SVM) is a powerful ML algorithm for modelling non-linear relationships, which can be used for both regression and classification tasks.97 SVM aims to map original data onto an N-dimensional hyperplane (N is the total number of descriptors) where data are linear-separable. The kernel method is used to map data to a higher dimension. On the hyperplane, a margin can be found that separates two classes of data; support vectors are the data points that are the closest to the margin. Using different data points as support vectors, the distance of this margin may change, and the target of SVM is to maximize this margin. Fig. 4 shows the hyperplane and how data are linearly separated in the SVM algorithm. The cost function of SVM is hinge loss. For each data point, the cost is 0 if it is correctly classified and 1 otherwise. Normally, a regularization penalty element (L2) is also added to SVM's loss function. With the loss calculated, weights of SVM can be updated by gradients calculated by taking partial derivatives. SVM is a robust ML algorithm and performs well in many studies.98,99
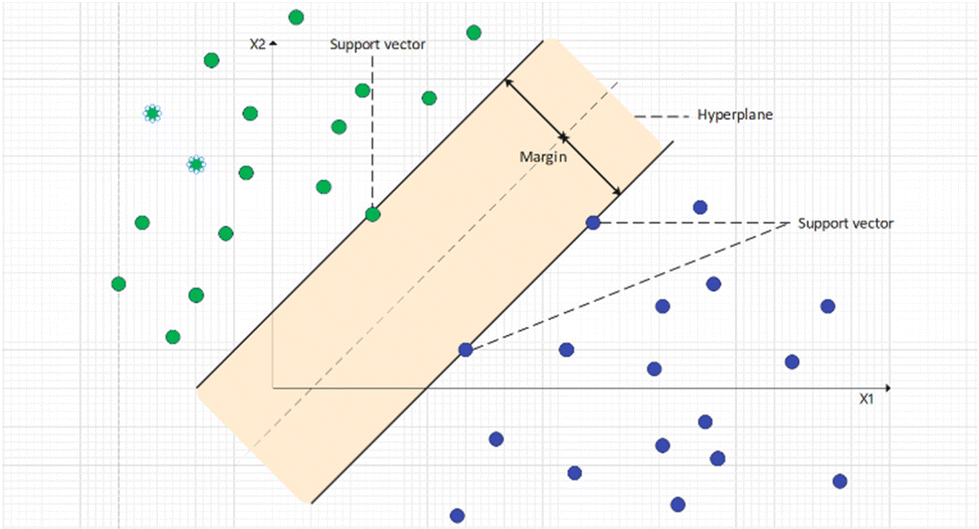 | ||
| Fig. 4 Support vectors and hyperplane in supporting vector machine algorithms. | ||
Decision tree (DT) is a tree-structure ML algorithm that can be used for both classification and regression.100 DT consists of internal nodes, leaves and branches, representing attributions, classes and classifications. In the training process, the selection of attributes that separate the tree into subtrees is achieved by calculating the relative loss. The most used loss function for DT is cross-entropy loss. The cross-entropy loss is small when most of the data are of the same class. Similar to any other ML method, one challenge for training decisions is overfitting. In DT, one approach for reducing overfitting is using the pruning algorithm that minimizes the decision tree branches.
Random forest (RF) is an ML algorithm based on a decision tree. It can also be used for regression and classification tasks.101 RF is an ensemble learning method that uses multiple decision trees to obtain a more accurate prediction. For each single decision tree, bias caused by outliers or improper model parameters and overfitting in small datasets may be challenging problems. In the RF training process, sub-datasets are selected randomly from the original dataset to train different decision trees. Attributes are also randomly selected to split the tree. The bootstrap aggregating algorithms used in RF can reduce the variance of models. Thus, in most cases, overfitting can be avoided. The great advantage of RF is that it can decrease the influence of a single decision tree, which makes it easy and fast to train. The outcome of RF is determined by decision trees with different weights and the influence of poorly trained decision trees is minimized.
Artificial neural network (ANN) is another important member of the ML algorithm family.102 It is a network structure composed of multiple connected layers with neurons. The most intuitive and simple ANN is the feed-forward neural network, which is composed of three components: input, hidden and output layer.103 Each layer has multiple neurons connected to neurons in the next layer. The structure of the feed-forward neural network and how layers are combined is illustrated in Fig. 5. The feed-forward neural network algorithm has multiple critical components including weight and bias, activation function, loss function and back propagation algorithm. In training a feed-forward neural network, weights connecting neurons and one bias value will be initialized firstly. Then numerical input descriptor values are put into the input layer; each neuron can have one value. After that, a weighted sum of neurons will be sent to neurons in the next layer. These sums will be put into an activation function, so the computation is non-linear. Similar computation will transfer through from the hidden layer to the output layer as the network output. In most cases, there is only one neuron in the output layer, and the output value is referred to as the prediction by the model. The difference between the prediction and measured values will be noted as the loss function and fed back to the model by the Back Propagation (BP) algorithm. Based on the loss, the gradient will be calculated to adjust the weights and bias. Each time a new input datum is fed into the network, the weights and bias will change until the model's prediction is close to the measured value.
 | ||
| Fig. 5 The structure of a simple feed-forward neural network. | ||
Deep learning is a class of neural networks with massive number of neurons and a more complex structure compared with ANN, such as convolutional neural network (CNN), regression neural network (RNN) and graph neural network (GNN).
The key advantage of deep learning is its ability to learn hierarchical representations of data, where each layer of the network extracts increasingly complex and abstract features from the input. This allows deep learning models to achieve state-of-the-art performance on a wide range of tasks. GNNs are a specialized class of neural networks designed to process and analyse data represented as graphs, leveraging the inherent structural information to achieve superior performance in capturing complex relationships and achieving state-of-the-art results in various tasks such as node classification, link prediction, and graph generation. It is important to note that although deep networks can achieve good accuracy, they demand large-size data. Thus, their application in polymer research is still very limited.
Genetic algorithm is an ML algorithm that simulates natural evolution. When applied to polymer studies, the first step of GA is to split polymers into blocks, as polymers can be regarded as a sequence of these blocks such as CH2 and CO. Next, there will be some rearrangement of these blocks to generate new candidate polymers by mutation, crossover and selection operations.104 Subsequently, new polymers will be assessed, and their potential to have desired properties will be evaluated. Finally, the top polymers are selected and used for the next generation cycle. This process repeats many times until high-performing candidates are generated. The key advantage of deep learning is its ability to learn hierarchical representations of data, where each layer of the network extracts increasingly complex and abstract features from the input. This allows deep learning models to achieve state-of-the-art performance on a wide range of tasks. Although deep networks’ demand for large-size data can be a limit, they have been proved to have the ability to achieve good accuracy, and have been used for polymer studies.105,106
The optimization of hyperparameters of an ML model is an important process. Here hyperparameter denotes the values that are used to adjust the learning process. A suitable hyperparameter set determines the performance of the ML model. For example, for a GNN, the number of neurons in each layer can directly impact the final accuracy. A appropriate training epoch number can avoid the risk of overfitting. There are multiple approaches to optimize hyperparameters, such as manual search, grid search, random search and Bayesian optimization.
Traditional grid search and random search have been widely used in materials science. Grid search algorithms manually search through a grid of hyperparameters, and different hyperparameter combinations will be tested. This method is easy to implement and can explore each combination, but requires much time and computation and has a low efficiency when the dimensionality of the hyperparameter is high. Random search avoids exhaustive searching by randomly selecting hyperparameter combinations. This can greatly reduce the cost of computation, and generally has a better performance than grid search. However, this algorithm always leads to a high variance due to its random nature.
If the ML model is trained and tested on one set of data, its stability needs to be validated. The cross-validation method can evaluate the stability of an ML model and indicate its ability to predict unseen data. The basic process of cross-validation is to split the dataset into training/testing sets multiple times following a certain pattern and evaluate the accuracy of the ML model on these testing sets. This approach can ensure that the bias and variance of the trained ML model is low, as most of the data have been covered. Algorithms such as leave-one-out, leave-more-out and k-fold cross-validation have been widely used in materials science.
ML can also be used for uncertainty quantification, via active learning methods such as adaptive sampling and Bayesian optimization.89 Active learning is a powerful approach within machine learning that enables efficient utilization of labelled data by strategically selecting informative samples to annotate from a large pool of unlabelled data. Instead of passively relying on random or pre-selected samples for labelling, active learning actively seeks out the most valuable instances for annotation, reducing the annotation burden and improving model performance. Adaptive sampling is a common active learning strategy that dynamically adjusts the sampling strategy based on the model's current knowledge, while Bayesian optimization incorporates probabilistic models to guide the selection process and iteratively refine the model's understanding of the data distribution, allowing for effective uncertainty quantification and targeted data acquisition. By actively engaging in the learning process, active learning methods enhance the efficiency, accuracy, and generalization capabilities of machine learning models.
In general, the choice of the ML algorithm is important. The performance of different ML models can vary based on the dataset and the descriptors generated. In many studies, a comparison between different ML models is commonly adapted to select the model with the best performance.107,108 The performance of ML models is commonly assessed using the correlation coefficient (r2), relative standard deviation, and root-mean-square deviation.
The accuracy of ML models can be assessed using different validation metrics. Correlation coefficient (r2) and root mean squared error (RMSE) are the most common performance indicators. r2 is a statistical metric and can be calculated as:
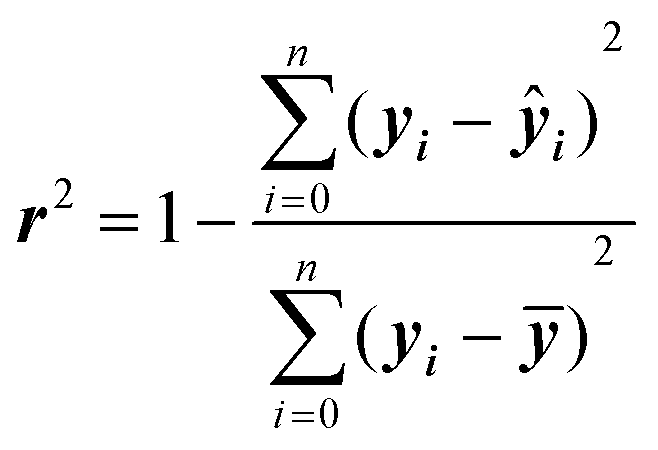 | (3) |
r 2 ranges from 0 to 1, with higher values indicating a better fit. Models with r2 of 0.90 or over for both training and set data are considered extremely accurate, while those with r2 of between 0.80 and 0.89 are viewed as highly accurate. r2 values of 0.70–0.79 indicate models with reasonable performance, and the range of 0.60–0.69 corresponds to low predictability. It should be noted that these are only rough guidelines, as some properties such as biological responses are more challenging to predict accurately and models with r2 of less than 0.70 could be regarded as good.
RMSE quantifies the average difference between the predicted values and the actual values in a regression model.
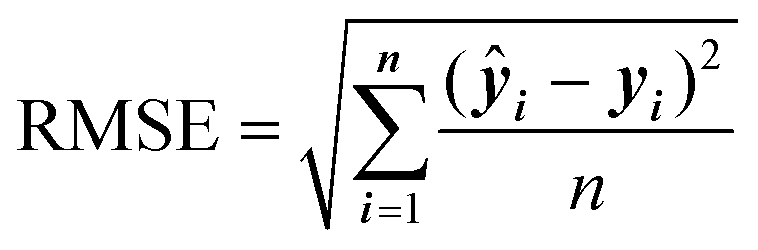 | (4) |
Mean squared error (MSE) quantifies the average squared difference between predicted and actual values, commonly used to evaluate the performance of regression models.
 | (5) |
5 Application of molecular descriptors and ML algorithm in polymer development
To date, there have been a few studies using different descriptors and ML models to predict polymer properties such as glass transition temperature, band gap, and dielectric constant, as shown in Table 8. The combination of polymer descriptors and ML algorithms plays an important role in the determination of predictive accuracy. As a result, in most of the studies, the computation and selection of polymer descriptors as well as the application of different ML algorithms have become necessary components.| Descriptor type | Dataset size & type | ML algorithm | Target property | Ref. |
|---|---|---|---|---|
| SMILES string-based | 7372 computational | RNN | Glass transition temperature | 51 |
| 6772 computational & experimental | RF | Dielectric constant | 109 | |
| 1200+ computational | RNN | Dielectric property value | 36 | |
| 300 experimental | CNN | Glass transition temperature | 110 | |
| 234 experimental | LR | Refractive index | 111 | |
| Topological & physicochemical | 100 experimental | MLR | Glass transition temperature | 112 |
| 221 experimental | PLSR | Refractive index | 113 | |
| 206 experimental | PLSR | Glass transition temperature | 114 | |
| 65 experimental | SVM | Intrinsic viscosity | 115 | |
| 77 experimental | PLSR | Polymer DNA binding | 116 | |
| Mediated transgene expression | ||||
| Geometrical & polymer-level descriptor | 169 experimental | MLRAG & ANN | Critical solution temperature | 117 |
| 133 experimental | MLR | Refractive index | 118 | |
| 262 experimental | MLR | Refractive index | 119 | |
| 24 experimental | MLR | Glass transition temperature | 120 | |
| 284 experimental | SVR | Band gap | 121 | |
| Vectorized fingerprint | 13000 computational & experimental |
GPR | Crystal bandgap, chain bandgap, frequency-dependent dielectric constant, glass transition temperature and melting temperature | 107 |
| 1073 computational & experimental | GCNN | Energy storage & electronics applications | 52 | |
| 284 experimental | KRR | Bandgap; electronic dielectric constant; ionic dielectric constant; total dielectric constant | 108 | |
| 778 computational & experimental | RF & DNN | Gas permeabilities | 122 |
In this section, based on different categories of polymer descriptors, polymer design and development with the aid of ML algorithms will be summarised.
5.1 Application of SMILES string descriptors
SMILES strings have been widely used in materials informatics and polymer development, where a monomer is represented by a string. SMILES strings can be used directly as polymer descriptors or as simple representations of the monomer structures, whereas 2D descriptors such as constitutional and topological descriptors can be generated using SMILES strings. However, three-dimensional properties cannot be captured by SMILES representation.Chen et al. developed a chemical language-processing model for predicting polymer glass transition temperature using 7372 data points.51 The model represented polymer structures using SMILES strings, ensuring uniqueness through canonical SMILES strings. The calculation of such descriptors was done using the RDKit package. To transfer SMILES strings to a digital representation that can be fed into the ML model, the unique characters used in these strings were collected into a list. Subsequently, each of these characters was allocated a corresponding number based on their location in the list. The SMILES strings were finally replaced by a series of numbers and fed into the ML model. As a result, in this study, there was a total of 45 characters in the list and SMILES strings were replaced by sequences of numbers ranging from 0 to 44. To ensure the lengths of number-sequences are uniform, shorter sequences were padded with zeros.
Regarding the ML algorithm, a series of RNN models has been deployed using the Keras API on the TensorFlow platform.122 In this study, the long short-term memory (LSTM) unit has been employed to build robust models. LSTM is a type of recurrent neural network unit that can solve sequential prediction tasks. Fig. 6 shows that polymers are represented by SMILES strings and fed to a neural network as character sequences.
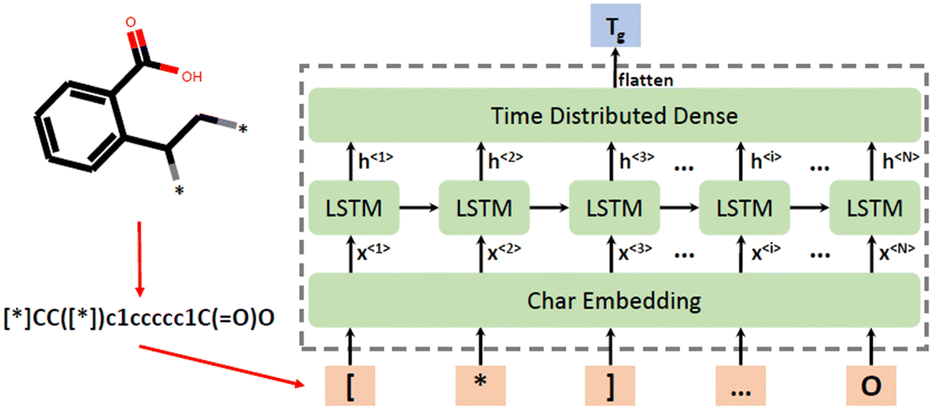 | ||
| Fig. 6 Polymer representation processing and ML model structure. Reproduced from ref. 51 with permission from MDPI, copyright 2021. | ||
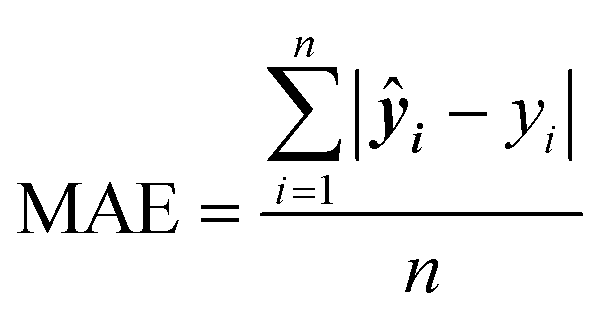
As a result, the trained model could predict the glass transition temperature to a reasonably high accuracy. The best-performing RNN model was measured with an r2 of 0.84 and an MAE of 30.69 °C, which indicate good performance.
A study focusing on polymers with dielectric constant (DC) for an environmentally friendly, high-speed communication network was reported by Liang et al.109 In this study, 6772 polymers from the CROW Polymer Property Database were used for training. As SMILES representation can tell whether a building block is on the main chain or side chain, in the first stage, all the polymer structures were encoded into SMILES strings. Several attributes were considered as descriptors to capture important structural information, such as the number and type of atoms on the main chain, number of side chains, and bonds type on the side chains, as shown in Fig. 7. A total of 29 features were used as the input for the ML model. Random forest (RF) was used to classify polymers into three groups where the dielectric constant was low, medium and high, respectively. The classification model reached an accuracy of 92.7%, which is enough for new polymer generation. New polymer structures were then generated using Genetic Algorithms and their properties were predicted using the obtained RF model. To validate the constructed model, the authors selected 40 polymers with promising prediction results and sent the synthesis request to the intelligent cloud lab for automatic synthesis in the synthesis process. Subsequently, three polymers were successfully synthesised and two of them showed great potential for correlated applications.
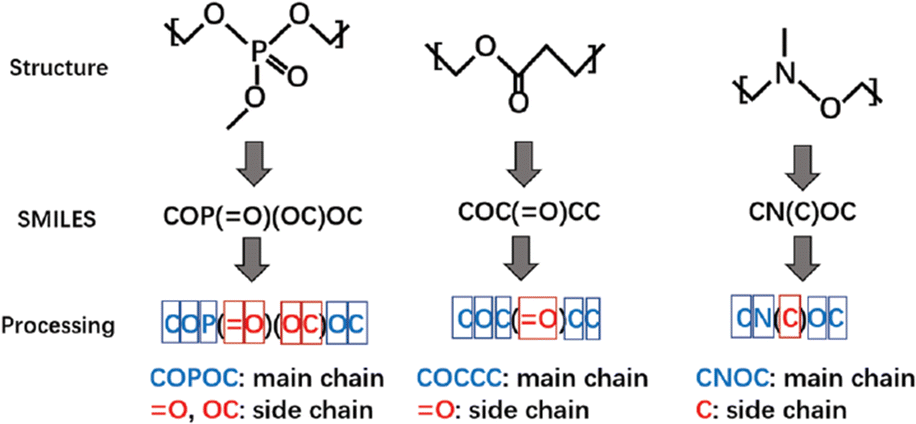 | ||
| Fig. 7 The process of converting polymer structures to SMILES strings and further preparation to generate input descriptors for machine learning models. Reproduced from ref. 109 with permission from the Royal Society of Chemistry, copyright 2021. | ||
In another SMILES string-based application, an original dataset of 1200 polymers was gathered and 5% of them were selected as a test set by taking every 20th sample.36 There were two stages in the descriptor generation process. The first involved transferring polymer monomer to SMILES strings, while the second included applying binary and decimal transformation to the obtained SMILES strings. In the binary transformation part, SMILES strings were encoded as sequences of 1 and −1. The longest sequence was 1136 bits long, and zeros were added to shorter sequences to ensure all sequences had the same length (zero-padded). For the decimal numerical transformation, string variables were converted according to the ASCII code. Similarly, all the numerical representations were zero-padded to 142 numbers long. The processing procedure is shown in Fig. 8.
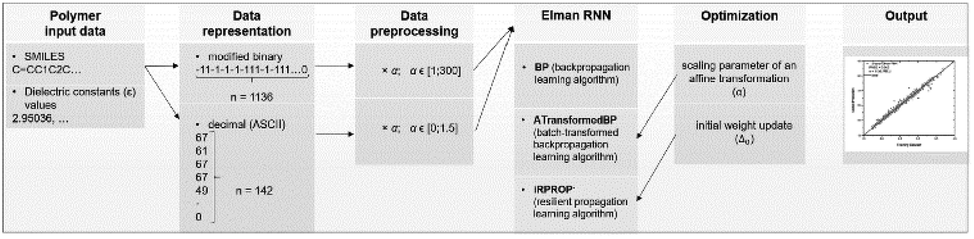 | ||
| Fig. 8 The binary and decimal transformation of SMILES strings. Reproduced from ref. 36 with permission from the American Chemical Society, copyright 2021. | ||
The ML models were built using RNN and applied with normalized backpropagation and resilient backpropagation learning algorithm. To evaluate the predictive accuracy, the trained models were analysed using RMSE and the relative standard deviation (RSD). The average RSD achieved was below 5% and RMSE values were all below 0.154. These results demonstrated the excellent prediction capabilities of the RNN model.
A study by Miccio and Schwartz explored the modelling of polymer glass transition temperature using deep learning.110 In this study, a dataset of about 300 polymers mainly composed of polystyrenes and polyacrylates was used. This dataset was split into training and test set. First, monomer structures were represented by SMILES strings which were then converted to a corresponding matrix by applying a one-hot encoding algorithm, as illustrated in Fig. 9. There were only zeros and ones in this matrix, indicating whether the corresponding characters of row (ACSII character) and column (SMILES string character) were the same. Thus, each polymer was transferred into a unique matrix and interpreted as a binary image which was then fed to a CNN.
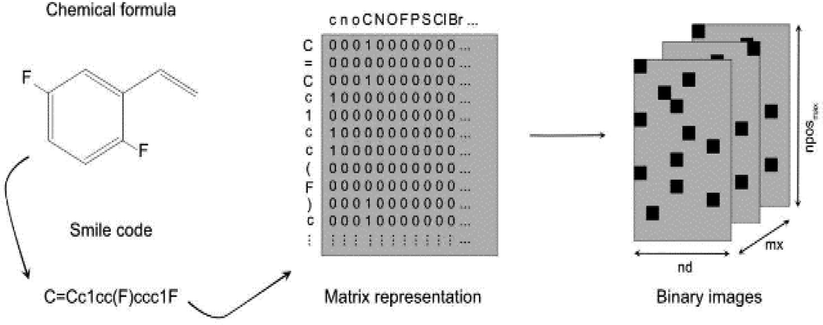 | ||
| Fig. 9 Illustration of how each monomer was transferred into a matrix, then converted into a binary image. Reproduced from ref. 110 with permission from Elsevier, copyright 2020. | ||
In this study, the trained CNN reached an average relative error as low as 6% on the test set. To further evaluate the prediction ability of the model, an extended dataset with more than 200 polymers was employed. As a result, the obtained relative errors were still low, as in the order of 8%. This proved the excellent performance of the model.
In another study on refractive index (n) prediction, ML models were developed using SMILES strings as well as computational descriptors derived from these strings.111 The dataset consisted of 234 experimental refractive indices measured at 298 K, divided into training, validation, and test sets of 78 entries each. Unlike previous studies, this research incorporated quantum-chemical descriptors, which are computationally demanding, in addition to SMILES-based constitutional and topological descriptors. The CORAL software was used and three different approaches to represent polymer structure were adopted: chemical graphs, SMILES strings and a hybrid representation.123 1-, 2- and 3-element SMILES attributes were considered. For example, if a SMILES string is denoted as ‘ABCDE’, then its structural attributes can be represented as shown in the following equations:
| ‘ABCDE’ → ‘A’, ‘B’, ‘C’, ‘D’, ‘E’ (1sk) |
| ‘ABCDE’ → ‘AB’, ‘BC’, ‘CD’, ‘DE’ (2sk) |
| ‘ABCDE’ → ‘ABC’, ‘BCD’, ‘CDE’ (3sk) |
The way of searching descriptors was to obtain the best feature step by step. The first descriptor was the most relevant structural attribute, and the rest were determined based on the model accuracy combined with previous descriptors. The QSPR models obtained were the sum of a constant and a linear combination of weighted descriptors, of which the weights were calculated based on the Monte Carlo simulation method.124 The validation of QSPR models was achieved based on a cross-validation approach using leave-one-out (loo) and leave-more-out (lmo). To ensure that the ML model had the general predictive ability, the accuracy of QSPR models was tested on an external test set. The best model had r2 values of 0.96 on the training set, 0.95 on the validation set and 0.85 on the external test set, which were of significantly better accuracy compared with previously published results. In this study, the author also found that calculated flexible descriptors can effectively represent molecular structure characteristics with comparable or superior levels of detail to a 3D-geometry-dependent method.
5.2 Application of topological indices and physicochemical descriptors
Topological indices are arguably the most common descriptors in materials informatics research.29 This is because they can capture structural information, which plays a critical role in determining material properties. As a result, the developed topological descriptors outnumber other categories of descriptors. On the other hand, polymers’ physical and chemical properties are also closely related to their structures and are often used together with topological indices. In many studies, the final predictive accuracy of the ML models can be increased by using a good selection of topological indices, so using a descriptor selection algorithm to extract relevant descriptors from a large pool of descriptors can be one essential part of the study.107 Some reported studies have employed such selection algorithms successfully.81A study by Anas Karuth et al. explored the glass transition temperature (Tg) of 100 amorphous polymers.112 The dataset was separated into training and testing sets, by ranking the Tg value and taking every 5th data point for the test set. As a result, there were 80 data points in the training set and 20 in the test set. The chemical structures of monomers were used to generate multi-dimensional descriptors. An initial set containing more than 4500 descriptors was generated using Dragon 6 software. These included descriptors from 0D to 3D and could be categorised as constitutional, topological, physicochemical and geometrical descriptors. After the elimination of some near-constant descriptors, 2863 descriptors remained.
A variable selection GA was then used to select a subset of descriptors, and an MLR analysis was applied to model the relationship between the microstructure and the Tg value of polymers. Fig. 10 illustrates the framework of the study. The best model was obtained using seven input variables, including 2D-matrix, 3DMorRSE, gateway, functional, atom pair and electro-topological index descriptor types.
 | ||
| Fig. 10 The framework of the Tg prediction by QSPR modelling. Reproduced from ref. 112 with permission from Elsevier, copyright 2021. | ||
Several QSPR models predicting glass transition temperature have been developed and evaluated. The seven-variable model reached an r2 value of 0.75 and root-mean-square error (RMSE) of 0.06 for the training set, and an r2 value of 0.74 and RMSE of 0.06 for the test set, which indicates a good predictive capability. This model was further validated by a y-scrambling plot and the results showed that it was a robust model with no coincidence. The study also reported that AVS_B(e) (Average vertex sum from Burden matrix weighted by Sanderson electronegativity), RARS (R matrix average row sum), and noxiranes (number of ethylene oxide groups) were the most influential descriptors for glass transition temperature in the model.
Khan et al. reported an ML study on the refractive index of polymers.113 An original dataset of 221 diverse organic polymers, including mixtures, was split into training and testing sets of 154 and 67 polymers, respectively, using the Kennard–Stone method.125 This data division method repeatedly removes data point pairs that were the farthest in the original dataset until the number of data entries reaches the required value. Removed data points are put into the test set. In this study, the polymer structures were encoded in ‘.sdf’ extension files and used as inputs for the PaDEL and Dragon software to calculate of descriptors.126 Please note that in the refractive index study, there were already several studies that used quantum-chemical descriptors, hence requiring a high computational cost. In this study, the authors only used constitutional and topological descriptors. For copolymers or mixtures, both monomers were considered, and the values of corresponding descriptors were weighted by their percentages. A large number of descriptors were computed and subjected to GA analysis to reduce the descriptor dimension (number).
By applying double cross-validation (DCV) and PLSR, four 6-variables models with different descriptor combinations were selected. Descriptors include constitutional, 2D atom pair, 2D matrix-based, molecular linear free energy relation, ring and edge adjacency indices descriptors. The highest accuracy achieved was r2 of 0.911 and 0.893 on the training and testing sets, respectively. An external test set was also used to evaluate the predictive capability of the models. The models achieved r2 values from 0.876 to 0.895. This demonstrated that the models achieved excellent accuracy for both internal and external validation datasets. The workflow of the study is summarised in Fig. 11. A virtual screening of the design library was also performed. Ninety-one compounds were designed and optimized using MarvinSketch software and their refractive index values were predicted by the generated models. To rank the descriptors based on their importance in four models, the authors derived the variable importance plot (VIP) and demonstrated that the top three important descriptors were MLFER_E (excessive molar refraction), Mi (mean first ionization potential) and B01[O–Si] (presence/absence of O–Si at topological distance 1).
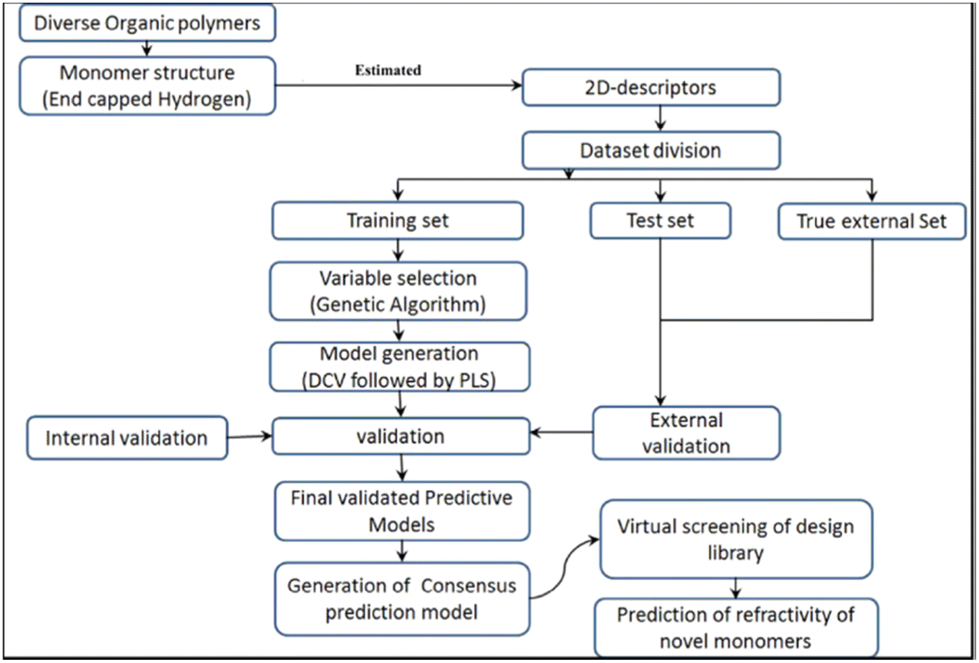 | ||
| Fig. 11 The workflow of the QSPR study about the refractive index of the polymer. Reproduced from ref. 113 with permission from the American Chemical Society, copyright 2018. | ||
In a QSPR modelling study on glass transition temperature prediction of diverse polymers, topological descriptors were applied.114 The dataset consisted of 206 polymers from different polymeric classes, with a 70% training set and a 30% testing set. Additionally, an external dataset of 38 diverse polymers was collected. Monomer structures were prepared using MarvinSketch software, and an initial pool of 2D descriptors was generated using PaDEL and Dragon software.127 Constant or near-constant value descriptors, as well as descriptors with zero or missing values, were removed. Variables with an absolute pairwise correlation of 0.95 or higher were also eliminated using the stepwise regression selection algorithm. As a result, 47 descriptors were selected by the stepwise selection method. These descriptors were used as the input for ML models, generated using the double cross-validation (DCV) tool and partial least squares (PLS) regression algorithms. Within several generated ML models, the five most robust and reliable models with different combinations of three latent variables were selected for the prediction of glass transition temperature. Fig. 12 outlines the workflow of the study.
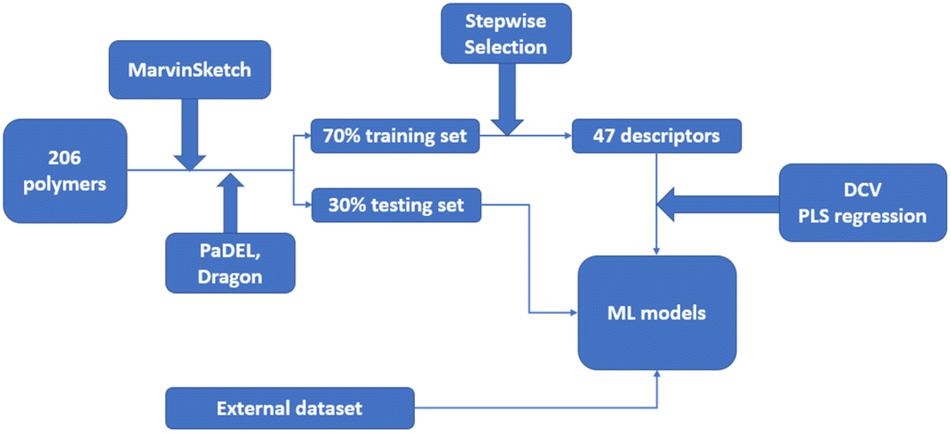 | ||
| Fig. 12 The workflow of the QSPR study about the glass transition temperature prediction with Machine Learning. | ||
The obtained models had an r2 (determination coefficient) ranging from 0.702 to 0.805 for the training set and a Q2 (correlation coefficient) varying from 0.713 to 0.759 for the test set. These models also performed well on the external test set, with a predicted variance of 0.822 and an r2pred(95%) of 0.869. The results suggest that the models have reached reasonably high accuracy.
Topological and other chemical descriptors are also important for other polymer properties such as intrinsic viscosity.115 In a study by S. Wang et al., a dataset composed of 65 polymer–solvent combinations was compiled. It was separated at a ratio of 80% and 20% for training and testing. Due to the high polymer weight, 1–5 monomers end-capped with hydrogen atoms were considered to represent the polymer structures. In the descriptor generation phase, firstly, the SMILES notation of all polymers and solvents was generated by RDKit. Then several quantum chemical descriptors, such as dipole moment, hardness, chemical potential, electrophilicity index, and total energy, were calculated through Python, and modules were generated through PaDEL, Mordred and Psi4. Thousands of topological and geometrical descriptors were also generated, filtered by variable value and pairwise correlation coefficient. The remaining descriptors were selected in the next stage by a genetic algorithm–multiple linear regression (GA-MLR) method. Although the MLR model had already been built, an SVM model was also trained for a higher predictive accuracy. It is noteworthy that SVM is a more powerful prediction tool that suits small datasets and is better than MLR in most cases.128,129
The SVM model achieved a much high accuracy than the MLR model, and was evaluated by an r2 value of 0. 92 and RMSE of 29.02 for the test set, compared with those of 0.83 and 42.62 in the MLR model. The significantly higher r2 values and lower RMSE indicate the superior performance of the SVM model and a non-linear relationship between the descriptors and the target property.
By calculating the mean effect of each descriptor, the quantum chemical descriptor highest occupied molecular orbital, autocorrelation of topological structure descriptor related to the polarizability of polymer and topological structure descriptor Moran coefficient related to the Sigma bond were demonstrated to be highly correlated with the intrinsic viscosity.
A limited number of studies have focused on aminoglycoside-derived polymers, but their investigation has highlighted the significance of topological descriptors in understanding these polymers. P. M. Khan and K. Roy conducted a QSPR modelling study on these polymers, specifically for predicting polymer–DNA binding and polymer-mediated transgene expression.116 The dataset comprised 33 polymers for DNA binding and 44 polymers for luciferase expression. Using Euclidean distance-based division, the datasets were split into training and testing sets (sizes of 25, 31 and 8, 10).125 Unlike previous studies that represented polymers based on their monomers, this study utilized representative blocks constructed from polymerization reactions. The building blocks were drawn using MarvinSketch software and stored in ‘.mol’ format. In the descriptor generation step, the authors calculated a set of 2D descriptors including ring descriptors, 2D atom pairs, connectivity indices and other topological indices using the PaDEL and AlvaDesc software. Initially, 154 and 170 descriptors were generated for two sets of polymers. These descriptors were then subjected to a GA feature selection algorithm and the number was reduced to 16 and 38. The final ML model was generated using the PLSR approach.
For DNA binding prediction, the r2 was 0.913 and Q2 was 0.878. For polymer-mediated transgene expression, models with different performances were generated. However, they had similar predictive accuracy, with an r2 of around 0.78 and a SEE of approximately 0.62. These values prove that the generated models have a reasonably good performance.
5.4 Application of geometrical descriptor and bulk polymer-level descriptor
Due to their complexity, geometrical descriptors are less common than topological indices. However, they can carry some necessary structural information for certain studies. Commonly, geometrical descriptors are generated together with many other types of descriptors, rather than on their own. On the other hand, in most of the studies, only descriptors describing monomers are used. In addition, there has been a very limited number of studies where chain-level, or bulk polymer-level descriptors are considered.A study predicting critical solution temperature (θ) using geometrical descriptors was reported by Jie Xu et al.117 In this study, 169 data points were collected, including 12 polymers and 67 solvents. These data points were divided into a training set of 112 points and a test set of 57 points. First, the structures of monomers end-capped with hydrogen atoms were used to calculate descriptors. Then, employing the HyperChem program, 3D-geometries of monomers were optimised to ensure the minimum energy conformations were obtained.130 Finally, the results were sent to Dragon software to generate a total of 430 polymer descriptors, including geometrical, 3D-MoRSE, WHIM and GETAWAY descriptors. To build the ML models, a stepwise Multi-Linear Regression Analysis (MLRA) was applied with Leave-One-Out (LOO) cross-validation (CV). As a result, a model containing 9 descriptors (GETAWAY, WHIM, 3D-MoRSE, and geometrical descriptors) was trained. The mean relative error (MRE) in the prediction of critical solution temperature for the training and testing sets was 4.02% and 5.05%, respectively. The comparison between experimental and predicted critical solution temperature is shown in Fig. 13. An ANN model was also trained with the quasi-Newton BFGS algorithm. The structure of the ANN was 9-8-1, representing the neuron number in the input, hidden, and output layers. The ANN model performed significantly better than the MLR model. The MRE value for the ANN model was 1.99% for the training set and 2.26% for the test set. The proposed models with evaluated high accuracy can be applied for further prediction. This study also suggested that the above nine descriptors are important and highly related to lower critical solution temperature.
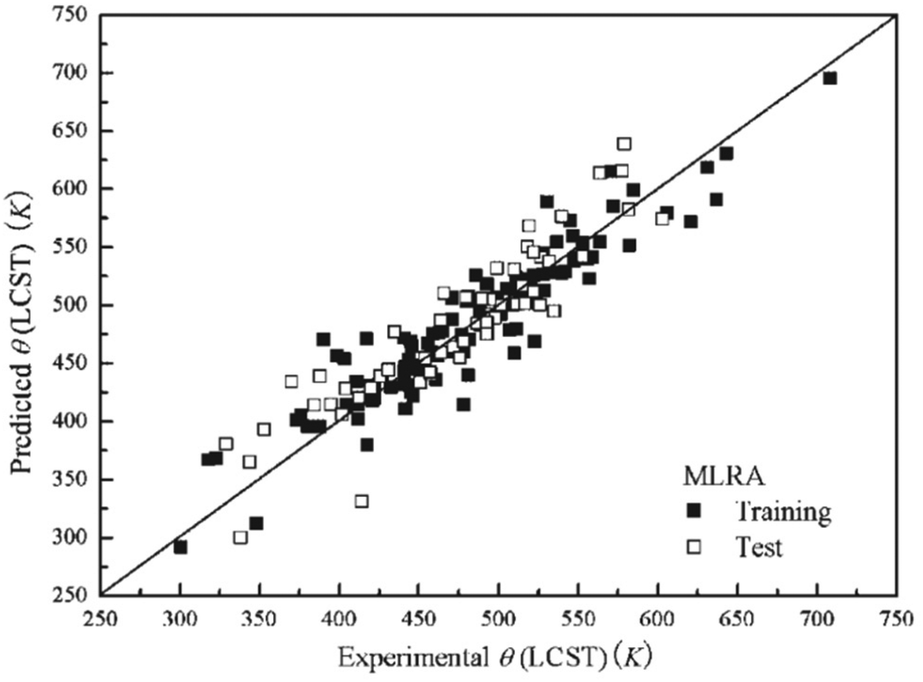 | ||
| Fig. 13 The prediction performance of the MLR model on both training and testing sets. Reproduced from ref. 117 with permission from John Wiley and Sons, copyright 2008. | ||
In a similar study, ML was used to predict the refractive indices of 133 polymers from diverse classes.118 First, the chemical structures of monomers were generated by the ChemDraw14 software.131 The Dragon software was then used to compute descriptors. Initially, a total of 4885 descriptors, including constitutional, topological, geometrical descriptors, were generated. Next, the descriptors were filtered by removing those with constant or near constant variables. Finally, the remaining descriptors were transformed using the logarithm function and fed into the QSARINS software for ML model construction.
An MLRA algorithm was applied with a GA to find the best combination of variables. As a result, a four-variable model was built with high accuracy. The r2 values are 0.932 and 0.882 for the training and test set, respectively, which confirms the excellent performance of the model.
Another QSPR study of refractive index was also reported.119 In this study, a set of 262 diverse polymers was collected from multiple publications. To represent polymers’ structure, the 2D structures of monomers were drawn using ChemDraw 16 software, end-capped with hydrogen atoms for consistent monomer functionality.131 The monomer structures were then optimized using HyperChem 8. The dataset was divided into a training and a test set, weighting of 75% and 25%, resulting in 203 structures in the training set and 66 in the test set. The refractive index values were converted to a logarithmic scale. A set of quantum descriptors was calculated. About 4500 descriptors including constitutional, topological, geometrical and some 3D matrix-based descriptors were also generated using Dragon 6. A combination of GA and MLRA was used to develop the ML models. The best-performing model had four input variables: constitutional, 2D autocorrelation, 2D matrix-based and 3D matrix-based descriptors. This model had high predictivity with r2 values of 0.904 and 0.880 for the training and test sets, respectively.
The importance of geometrical descriptors was emphasized in one study predicting the glass transition temperatures (Tg) for polymeric coating materials.120 In this study, a series of oligomers and block copolymers was synthesized. The Tg values of 24 polymer samples were measured. 18 samples were used as the training set and 6 were used as the test set. The chemical structures were prepared using Chemaxon and descriptors were computed using the Dragon 6 software.127 A total of more than 4000 descriptors were generated, including constitutional, walk and path counts, connectivity indices, information indices, 2D autocorrelations, geometrical and 3D-MoRSE descriptors. To reduce the dimension, constant descriptors were filtered, and as shown in Fig. 14, two weighing schemes were applied, including an additive calculations-based approach and a combinatorial calculations-based approach. In the end, about 475 descriptors were extracted for ML model training. Using these descriptors, multiple QSPR models were built and the four with the highest accuracy were selected. These four models were all linear combinations of 1–3 descriptors, including mixture-weighted Ghose–Crippen octanol–water partition coefficient, and 3D-MoRSE descriptors. It is noteworthy that 3D-MoRSE descriptors were found to be one of the most important descriptors. These models were constructed using the QSARINS software, and they had r2 values ranging from 0.851 to 0.911 for the training set and 0.872 to 0.935 for the test set, indicating very good predictive performance. Octanol–water partition coefficient and 3D-MoRSE unweighted descriptors were found to be the most important descriptors for glass transition temperatures.
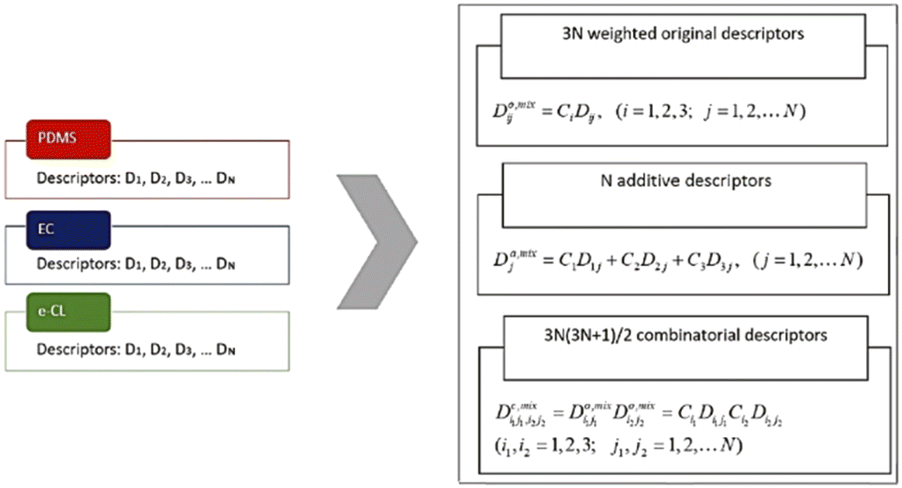 | ||
| Fig. 14 Two schemas that calculate the weighted mixture descriptors. Reproduced from ref. 120 with permission from John Wiley and Sons, copyright 2019. | ||
One ML-aided study designing polymers with desired band gap based on DFT calculation was achieved using a support vector regression (SVR) algorithm.121 This study collected 284 DFT-calculated polymer samples consisting of certain blocks, including CH2, NH, CO, C6H4, C4H2S, CS and O, from reported publications. A sphere exclusion was adopted to divide the dataset at a 4:1 ratio, resulting in a training set of 228 samples and a test set of 56 samples. Using the Dragon 7 software, a total of 5270 descriptors were generated, covering most of the descriptor types. First, descriptors with a Pearson correlation of greater than 0.95 and a standard deviation less than 0.0001 were filtered. The remaining 1093 features were then subjected to a maximum relevance minimum redundancy (mRMR) algorithm for further reduction. As shown in Fig. 15, 16 features were selected as the most relevant descriptors, including compositional information, topological indices and geometrical descriptors. The final SVR model achieved an excellent performance with r2 of 0.824 for the leave-one-out cross-validation and 0.925 for the test set.
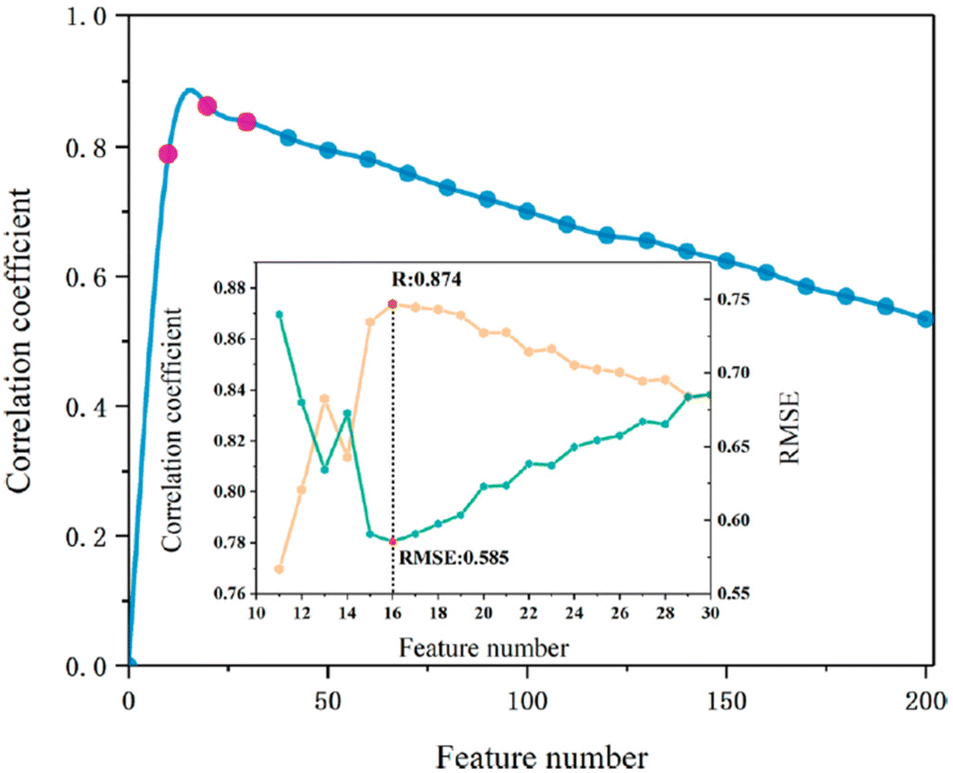 | ||
| Fig. 15 Model with 16 features had the highest R and lowest RMSE. Reproduced from ref. 121 with permission from the American Society, copyright 2021. | ||
This study also provided insights into the relationship pattern among the 16 selected features and the band gap.
5.5 Application of vectorized fingerprints
Vectorized fingerprints are vector-shaped descriptors, where each element represents the existence or the count of certain structural features in the polymer. It is fast to generate and covers a large number of different structural blocks. These features can be a specific atom, special ring structure or the length of the polymer chain. Currently, a few developed software and web applications support fast-and-accurate fingerprint generation. Thus, utilizing fingerprints in polymer design using ML may become more feasible for researchers.One good example is the Polymer Genome project where a 3000-features fingerprint can be computed quickly.107 The vectorized fingerprint is shown in Fig. 16.
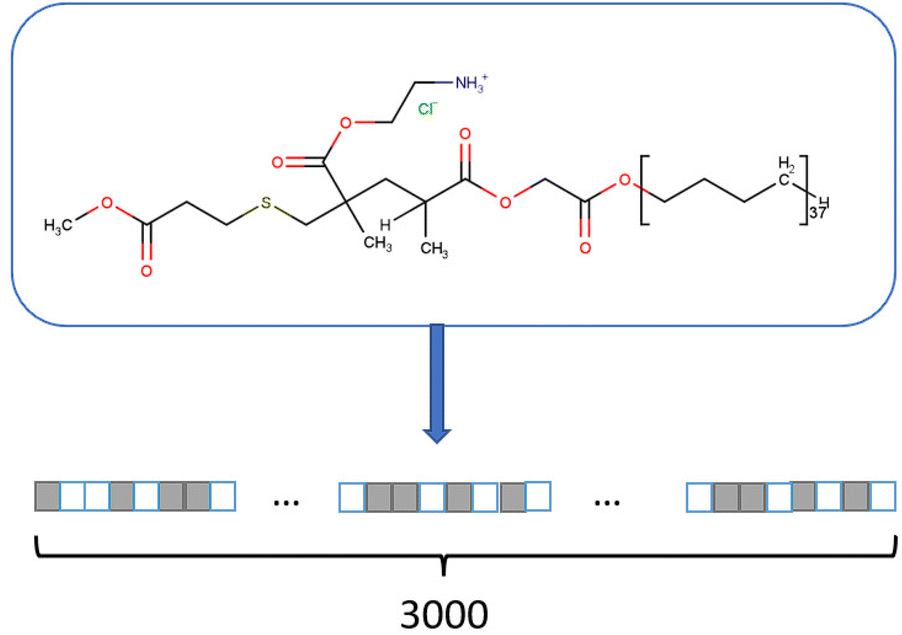 | ||
| Fig. 16 The 3000-length fingerprint generated from the monomer structure. The boxes denote the presence or count of some pre-defined structures or those that correspond to some polymer properties. | ||
There are over 13000 polymer entries and more than 20 polymer properties reported, such as crystal bandgap, chain bandgap, frequency-dependent dielectric constant, glass transition temperature and melting temperature. Data were collected from reported publications as well as from DFT modelling. The size of each dataset ranges from 80 to 6721. Descriptors in this study include those at the monomer level as well as the chain level. Constitution descriptors, topological indices, and geometrical descriptors are all covered. It should be noted that although many different features can be captured, many are irrelevant to the properties of interest. This study simplified the vectorized fingerprints using the recursive feature elimination (RFE) or the least absolute shrinkage and selection operator (LASSO) algorithms. Multiple GPR and ANN models were trained and tested to predict various polymer properties. Table 9 summarises the performance of some models reported by the Polymer Genome project.
| Polymer property | Data size | ML model | Performance (RMSE) |
|---|---|---|---|
| Crystal bandgap | 562 | GPR | 0.26 eV |
| Chain bandgap | 3881 | GPR | 0.24 eV |
| Frequency-dependent dielectric constant | 1193 | GPR | 0.16 |
| Refractive index (crystal) | 383 | GPR | 0.07 |
| Glass transition temperature | 5076 | GPR | 18.8 K |
| Electron affinity | 371 | GPR | 0.18 eV |
| Polymer density | 890 | GPR | 0.03 g cc−1 |
| Atomization energy | 391 | GPR | 0.01 eV per atom |
| Specific heat | 80 | GPR | 0.07 J gK−1 |
Another study that employed vectorized fingerprints was reported by Minggang Zeng et al.52 This study aimed to develop an ML model that can accurately predict polymer dielectric constant and bandgap. A dataset of 1073 polymers composed of three subsets was built. The first subset of 34 polymers was derived from experimental data. The second subset of 253 polymers was adopted from the Crystallography Open Database. The third subset including 314 organic polymers and 472 organometallic polymers resulted from DFT calculations. Polymers were represented by monomers’ SMILES notations. As shown in Fig. 17, the Crystallographic Information File (CIF) was converted to 2D graphs. These graphs were stored in feature vectors, including atomic and bonding vectors. These, together with target properties for each polymer and a JSON file storing the initialization vector for each atom, were fed to a GCNN.
 | ||
| Fig. 17 Polymer research using CIF file and Convolutional Neural Network. | ||
Besides GCNN, a few commonly used ML algorithms including Kernel Regression (KR), RF, Gradient Boosting and ANN were also used to train the models, for comparison. Results showed that GCNN achieved the most competitive accuracy with the MAE of the dielectric constant of 0.24, lower than reported values from other published papers.107 On the other hand, a higher but still acceptable MAE of 0.41 was found for band gap prediction.
A study by Arun Mannodi-Kanakkithodi was a classic example of fingerprint usage.108 First, 7 features were selected as the building blocks of the polymer structure. These include CH2, NH, CO, C6H4, C4H2S, CS and O. These blocks were selected as their existences are highly related to the target properties in this study, including bandgap, electronic dielectric constant, ionic dielectric constant and total dielectric constant. Then, 284 polymers with exactly 4 building blocks in this pool were considered and used as the training dataset. Polymers with 6 and 8 building blocks were used as the test set. The fingerprint was generated based on the building block count. Three matrixes with the size of 1 × 7, 7 × 7 and 7 × 7 × 7 were generated, representing single building block, block–block combination and block–block–block component. The elements of the fingerprint were the counts of the corresponding block. For example, a value of 2 in a 7 × 7 matrix means there were 2 block–block pairs in the monomer. In this work, a KRR was used for property prediction. The average error for the three properties was all in the order of 10% or less, and the comparison between DFT calculated and ML prediction is shown in Fig. 18.
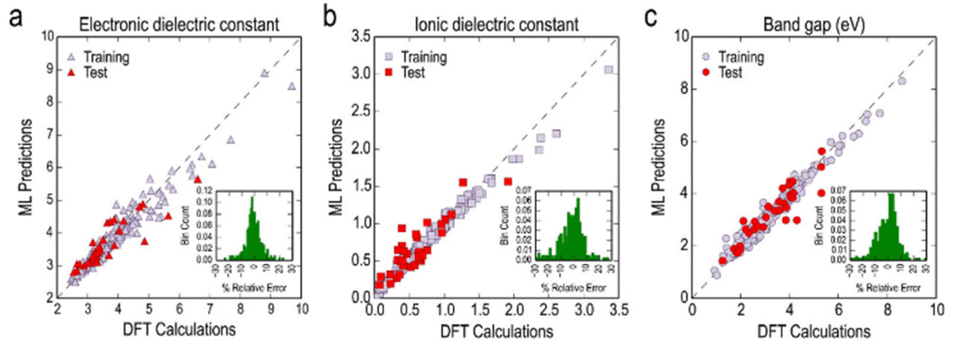 | ||
| Fig. 18 ML prediction and DFT calculation comparison on three properties: (a) electronic dielectric constant, (b) ionic dielectric constant, and (c) band gap. Reproduced from ref. 108 with permission from Nature Publishing Group, copyright 2016. | ||
Polymers with 6 and 8 blocks were also predicted using the obtained corresponding KRR model. The result confirmed the predictive ability and generalization of the models.
Vectorized fingerprints were also used to predict gas permeabilities.122 In this study, 778 homopolymers linked to He, H2, O3, N3, CO2 and CH4 were collected from PoLyInfo and other sources. 80% of the data was used as training and 20% as test set. A few processing steps were made to generate a descriptor capturing the key structural information of homopolymers, as shown in Fig. 19. Each polymer entry was represented by its unique SMILES string to allow the calculation of 146 relevant descriptors including constitutional, topological, and physical descriptors. A Morgan fingerprint with frequency was also generated for each entry. Because there were 3209 unique substructures involved in this study, a 3209-length fingerprint vector with binary elements was generated, each binary element denoting the existence of a certain substructure in the monomer. The fingerprint was then shortened to 114, leaving out the most frequently occurring substructures.
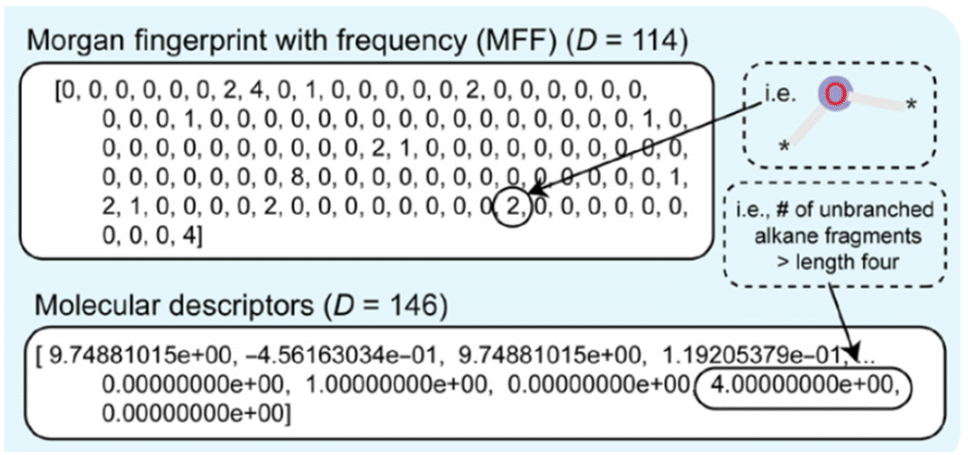 | ||
| Fig. 19 The generation of Morgan fingerprint and molecular descriptors. Reproduced from ref. 122 with permission from AAAS, copyright 2022. | ||
Finally, the obtained two kinds of descriptors were fed to RF and DNN for modelling. Predictions were made for 6 gases, and most models achieved an r2 value of around 0.9 for the training set and above 0.70 for the test set. Performance evaluations showed that the trained DNN model had a good predictive ability and ensemble-generalizes well. This study provided the chemical insight that VSA_EState8, a hybrid electronic state and van der Waals surface area (VSA) descriptor are the most important descriptors for predicting gas permeability.
6 Conclusions and future perspectives
Molecular descriptors and machine learning have shown great potential in polymer studies with robust, high-accuracy models developed for a range of polymer properties, from glass transition temperature and refractive index to band gap and dielectric constant and refractive index. The polymer informatics field is still in its early stage, but has witnessed the application of molecular descriptors and the development of novel descriptors for polymers. These achievements will pave the way for further breakthroughs where new, functional polymers are discovered using data-driven approaches, saving significant time and resources.There are a few challenges that exist, including the need for more available data of sufficient amount for ML and the demand for more novel ways to capture polymer structural information for ML models. Currently, ML models are built for small polymer datasets due to the difficulties in collecting data from scattered publications from different laboratories with different experimental setups. Furthermore, there are no standards for reporting such data. A larger volume of data can improve the predictive accuracy, expand the domain of applicability, and allow more advanced ML algorithms such as convolutional neural network and recurrent neural networks to be employed. The use of algorithms that can work with limited data such as transfer learning and generative adversarial network (GAN) should be encouraged.132 On the other hand, to date, most of the reported studies have used structural information of monomers as the only input descriptors for the ML models predicting the properties of the polymers. Chain-level and bulk properties are often neglected. As capturing structural information is central to generating accurate models, much effort is needed in this area. Although the current workflow can create thousands of descriptors using SMILES notations or other formats, feature selection algorithms usually classify them as irrelevant and only a small number of descriptors remain in the ML models. There is an urgent need to develop new descriptors that can informatively capture the structural similarities and differences of various polymers.
Polymer informatics studies will provide more practical value if the reverse design is more widely considered. Most studies are terminated when an ML model with reasonable accuracy is achieved.
Guidelines for designing new, fit-for-function polymers should be developed by using more interpretable descriptors and extracting through the use of more interpretable descriptors, and the extraction of feature (descriptor) importance from the models. Algorithms such as GA can generate virtual libraries of promising candidates for further laboratory analysis.
Author contributions
Zhao Yuankai: conceptualization, investigation, data curation, visualization, writing original draft. Shadi Houshyara, Roger J. Mulder: reviewing & editing, supervision. Tu C. Le: conceptualization, writing – review & editing, project administration, supervision.Conflicts of interest
The authors declare no conflicts of interest.Acknowledgements
Yuankai Zhao acknowledges the CSIRO-RMIT scholarship program.References
- M. Chandran, T. Senthilkumar and C. Murugesan, Conversion of plastic waste to fuel, Plastic Waste & Recycling, 2020, ch. 14, pp. 385–399 Search PubMed.
- S. W. Moore and P. J. Schneider, A Review of Cell Equalization Methods for Lithium Ion and Lithium Polymer Battery Systems, SAE Technical Paper, 2001, p. 0959 Search PubMed.
- A. C. Mayer, S. R. Scully, B. E. Hardin, M. W. Rowell and M. D. McGehee, Polymer-based solar cells, Mater. Today, 2007, 10, 28–33 CrossRef CAS.
- J. Wei, X. Chu, X.-Y. Sun, K. Xu, H.-X. Deng, J. Chen, Z. Wei and M. Lei, Machine learning in materials science, InfoMat, 2019, 1, 338–358 CrossRef CAS.
- J. N. Kumar, Q. Li and Y. Jun, Challenges and opportunities of polymer design with machine learning and high throughput experimentation, MRS Commun., 2019, 9, 537–544 CrossRef CAS.
- S. Fu, Z. Sun, P. Huang, Y. Li and N. Hu, Some basic aspects of polymer nanocomposites: a critical review, Nano Mater. Sci., 2019, 1, 2–30 CrossRef.
- F. M. Haque and S. M. Grayson, The synthesis, properties and potential applications of cyclic polymers, Nat. Chem., 2020, 12, 433–444 CrossRef CAS PubMed.
- R. Duncan, The dawning era of polymer therapeutics, Nat. Rev. Drug Discovery, 2003, 2, 347–360 CrossRef CAS PubMed.
- K. Ghosal and B. D. Freeman, Gas separation using polymer membranes: an overview, Polym. Adv. Technol., 1994, 5, 673–697 CrossRef CAS.
- K. Joshi and M. I. Patel, Recent advances in local feature detector and descriptor: a literature survey, Int. J. Multimed. Inf. Retr., 2020, 9, 231–247 CrossRef.
- D. J. Audus and J. J. de Pablo, Polymer Informatics: Opportunities and challenges, ACS Macro Lett., 2017, 6, 1078–1082 CrossRef CAS PubMed.
- A. F. Zahrt, J. J. Henle, B. T. Rose, Y. Wang, W. T. Darrow and S. E. Denmark, Prediction of higher-selectivity catalysts by computer-driven workflow and machine learning, Science, 2019, 363, eaau5631 CrossRef CAS PubMed.
- C. Kim, R. Batra, L. Chen, H. Tran and R. Ramprasad, Polymer design using genetic algorithm and machine learning, Comput. Mater. Sci., 2021, 186, 110067 CrossRef CAS.
- L. Ruddigkeit, R. van Deursen, L. C. Blum and J.-L. Reymond, Enumeration of 166 billion organic small molecules in the chemical universe database gdb-17, J. Chem. Inf. Model., 2012, 52, 2864–2875 CrossRef CAS PubMed.
- A. J. Cohen, P. Mori-Sánchez and W. Yang, Insights into current limitations of density functional theory, Science, 2008, 321, 792–794 CrossRef CAS PubMed.
- D. Frenkel, B. Smit and M. A. Ratner, Understanding molecular simulation: from algorithms to applications, Phys. Today, 1997, 50, 66–66 CrossRef.
- P. Xu, H. Chen, M. Li and W. Lu, New opportunity: Machine learning for polymer materials design and discovery, Adv. Theory Simul., 2022, 5, 2100565 CrossRef.
- A. J. Gormley and M. A. Webb, Machine learning in combinatorial polymer chemistry, Nat. Rev. Mater., 2021, 6, 642–644 CrossRef CAS PubMed.
- T. D. Huan, A. Mannodi-Kanakkithodi, C. Kim, V. Sharma, G. Pilania and R. Ramprasad, A polymer dataset for accelerated property prediction and design, Sci. Data, 2016, 3, 160012 CrossRef CAS PubMed.
- E. S. Brunette, R. C. Flemmer and C. L. Flemmer, in 2009 4th International Conference on Autonomous Robots and Agents, IEEE, Wellington, New Zealand, 2009, pp. 385–392.
- Y. Wu, J. Guo, R. Sun and J. Min, Machine learning for accelerating the discovery of high-performance donor/acceptor pairs in non-fullerene organic solar cells, npj Comput. Mater., 2020, 6, 1–8 CrossRef.
- K. K. Bejagam, J. Lalonde, C. N. Iverson, B. L. Marrone and G. Pilania, Machine learning for melting temperature predictions and design in polyhydroxyalkanoate-based biopolymers, J. Phys. Chem. B, 2022, 126, 934–945 CrossRef CAS PubMed.
- R. Ramprasad, R. Batra, G. Pilania, A. Mannodi-Kanakkithodi and C. Kim, Machine learning in materials informatics: recent applications and prospects, npj Comput. Mater., 2017, 3, 1–13 CrossRef.
- M. I. Jordan and T. M. Mitchell, Machine learning: trends, perspectives, and prospects, Science, 2015, 349, 255–260 CrossRef CAS PubMed.
- P. Shetty and R. Ramprasad, Automated knowledge extraction from polymer literature using natural language processing, iScience, 2021, 24, 101922 CrossRef CAS PubMed.
- F. Castanedo, A review of data fusion techniques, Sci. World J., 2013, 2013, e704504 Search PubMed.
- S. R. Stahlschmidt, B. Ulfenborg and J. Synnergren, Multimodal deep learning for biomedical data fusion: a review, Briefings Bioinf., 2022, 23, bbab569 CrossRef PubMed.
- A. Patra, R. Batra, A. Chandrasekaran, C. Kim, T. D. Huan and R. Ramprasad, A multi-fidelity information-fusion approach to machine learn and predict polymer bandgap, Comput. Mater. Sci., 2020, 172, 109286 CrossRef CAS.
- Danishuddin and A. U. Khan, Descriptors and their selection methods in QSAR analysis: paradigm for drug design, Drug Discovery Today, 2016, 21, 1291–1302 CrossRef CAS PubMed.
- R. Todeschini and V. Consonni, Handbook of molecular descriptors, Wiley, 1st edn., 2000 Search PubMed.
- Y. Liu, T. Zhao, W. Ju and S. Shi, Materials discovery and design using machine learning, J. Materiomics, 2017, 3, 159–177 CrossRef.
- W. Sha, Y. Li, S. Tang, J. Tian, Y. Zhao, Y. Guo, W. Zhang, X. Zhang, S. Lu, Y.-C. Cao and S. Cheng, Machine learning in polymer informatics, InfoMat, 2021, 3, 353–361 CrossRef CAS.
- J. Brandrup, E. H. Immergut, E. A. Grulke, A. Abe and D. R. Bloch, Polymer handbook, Wiley, New York, 1999, vol. 89 Search PubMed.
- G. Wypych, Handbook of polymers, Elsevier, 2022 Search PubMed.
- M. M. Cencer, J. S. Moore and R. S. Assary, Machine learning for polymeric materials: an introduction, Polym. Int., 2022, 71, 537–542 CrossRef CAS.
- A. L. Nazarova, L. Yang, K. Liu, A. Mishra, R. K. Kalia, K. Nomura, A. Nakano, P. Vashishta and P. Rajak, Dielectric polymer property prediction using recurrent neural networks with optimizations, J. Chem. Inf. Model., 2021, 61, 2175–2186 CrossRef CAS PubMed.
- G. Chen, Z. Shen, A. Iyer, U. F. Ghumman, S. Tang, J. Bi, W. Chen and Y. Li, Machine-learning-assisted de novo design of organic molecules and polymers: opportunities and challenges, Polymers, 2020, 12, 163 CrossRef CAS PubMed.
- E. Kim, K. Huang, A. Saunders, A. McCallum, G. Ceder and E. Olivetti, Materials synthesis insights from scientific literature via text extraction and machine learning, Chem. Mater., 2017, 29, 9436–9444 CrossRef CAS.
- O. Kononova, H. Huo, T. He, Z. Rong, T. Botari, W. Sun, V. Tshitoyan and G. Ceder, Text-mined dataset of inorganic materials synthesis recipes, Sci. Data, 2019, 6, 203 CrossRef PubMed.
- V. Tshitoyan, J. Dagdelen, L. Weston, A. Dunn, Z. Rong, O. Kononova, K. A. Persson, G. Ceder and A. Jain, Unsupervised word embeddings capture latent knowledge from materials science literature, Nature, 2019, 571, 95–98 CrossRef CAS PubMed.
- R. Batra, G. Pilania, B. P. Uberuaga and R. Ramprasad, Multifidelity information fusion with machine learning: a case study of dopant formation energies in hafnia, ACS Appl. Mater. Interfaces, 2019, 11, 24906–24918 CrossRef CAS PubMed.
- J. Ma, W. Yu, P. Liang, C. Li and J. Jiang, FusionGAN: A generative adversarial network for infrared and visible image fusion, Inf. Fusion, 2019, 48, 11–26 CrossRef.
- J. J. Irwin, T. Sterling, M. M. Mysinger, E. S. Bolstad and R. G. Coleman, ZINC: a free tool to discover chemistry for biology, J. Chem. Inf. Model., 2012, 52, 1757–1768 CrossRef CAS PubMed.
- R. Ma and T. Luo, PI1M: a benchmark database for polymer informatics, J. Chem. Inf. Model., 2020, 60, 4684–4690 CrossRef CAS PubMed.
- S. Otsuka, I. Kuwajima, J. Hosoya, Y. Xu and M. Yamazaki, in International Conference on Emerging Intelligent Data & Web Technologies, IEEE, Tirana, Albania, 2011, pp. 22–29.
- A. Mannodi-Kanakkithodi, A. Chandrasekaran, C. Kim, T. D. Huan, G. Pilania, V. Botu and R. Ramprasad, Scoping the polymer genome: A roadmap for rational polymer dielectrics design and beyond, Mater. Today, 2018, 21, 785–796 CrossRef CAS.
- A. Mauri, V. Consonni, M. Pavan and R. Todeschini, Dragon software: an easy approach to molecular descriptor calculations, MATCH Commun. Math. Comput. Chem., 2006, 56, 237–248 CAS.
- M. Karelson, U. Maran, Y. Wang and A. R. Katritzky, QSPR and QSAR models derived using large molecular descriptor spaces. a review of CODESSA applications, Collect. Czech. Chem. Commun., 1999, 64, 1551–1571 CrossRef CAS.
- P. Gramatica, N. Chirico, E. Papa, S. Cassani and S. Kovarich, QSARINS: A new software for the development, analysis, and validation of QSAR MLR models, J. Comput. Chem., 2013, 34, 2121–2132 CrossRef CAS.
- M. Guo, W. Shou, L. Makatura, T. Erps, M. Foshey and W. Matusik, Polygrammar: grammar for digital polymer representation and generation, Adv. Sci., 2022, 2101864 CrossRef CAS PubMed.
- G. Chen, L. Tao and Y. Li, Predicting polymers’ glass transition temperature by a chemical language processing model, Polymers, 2021, 13, 1898 CrossRef CAS PubMed.
- M. Zeng, J. N. Kumar, Z. Zeng, R. Savitha, V. R. Chandrasekhar and K. Hippalgaonkar, Graph convolutional neural networks for polymers property prediction, arXiv, 2018, arXiv:181106231 [Cond-Mat.Mtrl-Sci], DOI:10.48550/arXiv.1811.06231.
- T.-S. Lin, C. W. Coley, H. Mochigase, H. K. Beech, W. Wang, Z. Wang, E. Woods, S. L. Craig, J. A. Johnson, J. A. Kalow, K. F. Jensen and B. D. Olsen, Bigsmiles: a structurally-based line notation for describing macromolecules, ACS Cent. Sci., 2019, 5, 1523–1531 CrossRef CAS PubMed.
- G. B. Goh, N. O. Hodas, C. Siegel and A. Vishnu, Smiles2vec: an interpretable general-purpose deep neural network for predicting chemical properties, arXiv, 2018, ArXiv:171202034 [Cs Stat], DOI:10.48550/arXiv.1712.02034.
- J. Shao, Q. Gong, Z. Yin, W. Pan, S. Pandiyan and L. Wang, S2DV: converting SMILES to a drug vector for predicting the activity of anti-HBV small molecules, Brief. Bioinformatics, 2022, bbab593 CrossRef PubMed.
- W. Schubert and I. Ugi, Constitutional symmetry and unique descriptors of molecules, J. Am. Chem. Soc., 1978, 100, 37–41 CrossRef CAS.
- A. T. Balaban, Topological and stereochemical molecular descriptors for databases useful in QSAR, similarity/dissimilarity and drug design, SAR QSAR Environ. Res., 1998, 8, 1–21 CrossRef CAS.
- D. J. Klein, Topological indices and related descriptors in qsar and qspr, ed. J. devillers and A. T. Balaban, Gordon and breach science publishers, Singapore, 1999, vol. 811, p. 90-5699-239-2, $198.00 Search PubMed; J. Chem. Inf. Comput. Sci., 2002, 42, 1507–1507 Search PubMed.
- G. Ruecker and C. Ruecker, Counts of all walks as atomic and molecular descriptors, J. Chem. Inf. Comput. Sci., 1993, 33, 683–695 CrossRef CAS.
- G. Moreau and P. Broto, The autocorrelation of a topological structure: a new molecular descriptor, New J. Chem., 1980, 4(6), 359–360 CAS.
- A. T. Balaban, Highly discriminating distance-based topological index, Chem. Phys. Lett., 1982, 89, 399–404 CrossRef CAS.
- L. B. Kier, Shape indexes of orders one and three from molecular graphs, Quant. Struct.–Act. Relat., 1986, 5, 1–7 CrossRef CAS.
- F. Harary and R. Z. Norman, Graph theory as a mathematical model in social science, 1953, vol. 27 Search PubMed.
- M. Randić, Novel molecular descriptor for structure—property studies, Chem. Phys. Lett., 1993, 211, 478–483 CrossRef.
- H. Hosoya, Topological index. a newly proposed quantity characterizing the topological nature of structural isomers of saturated hydrocarbons, Bull. Chem. Soc. Jpn., 1971, 44, 2332–2339 CrossRef CAS.
- A. Mauri, V. Consonni and R. Todeschini, in Handbook of Computational Chemistry, ed. J. Leszczynski, Springer Netherlands, Dordrecht, 2016, pp. 1–29 Search PubMed.
- Z. Mihalic, S. Nikolic and N. Trinajstic, Comparative study of molecular descriptors derived from the distance matrix, J. Chem. Inf. Comput. Sci., 1992, 32, 28–37 CrossRef CAS.
- R. H. Rohrbaugh and P. C. Jurs, Descriptions of molecular shape applied in studies of structure/activity and structure/property relationships, Anal. Chim. Acta, 1987, 199, 99–109 CrossRef CAS.
- M. M. Gromiha and S. Ahmad, Role of solvent accessibility in structure based drug design, Curr. Comput. – Aided Drug Des., 2005, 1, 223–235 CrossRef CAS.
- F. Hirata and K. Arakawa, Molar volume of ions, Bull. Chem. Soc. Jpn., 1973, 46, 3367–3369 CrossRef CAS.
- G. Idakwo, J. Luttrell IV, M. Chen, H. Hong, P. Gong and C. Zhang, in Advances in Computational Toxicology, ed. H. Hong, Springer International Publishing, Cham, 2019, vol. 30, pp. 119–139 Search PubMed.
- T. Le, V. C. Epa, F. R. Burden and D. A. Winkler, Quantitative Structure–Property Relationship Modeling of Diverse Materials Properties, Chem. Rev., 2012, 112, 2889–2919 CrossRef CAS PubMed.
- L. A. Tarca, B. P. A. Grandjean and F. Larachi, Feature selection methods for multiphase reactors data classification, Ind. Eng. Chem. Res., 2005, 44, 1073–1084 CrossRef CAS.
- Y. Saeys, I. Inza and P. Larranaga, A review of feature selection techniques in bioinformatics, Bioinformatics, 2007, 23, 2507–2517 CrossRef CAS PubMed.
- V. Venkatraman, A. R. Dalby and Z. R. Yang, Evaluation of mutual information and genetic programming for feature selection in QSAR, J. Chem. Inf. Comput. Sci., 2004, 44, 1686–1692 CrossRef CAS PubMed.
- E. S. Goll and P. C. Jurs, Prediction of the normal boiling points of organic compounds from molecular structures with a computational Neural Network model, J. Chem. Inf. Comput. Sci., 1999, 39, 974–983 CrossRef CAS.
- Y. Liu, A comparative study on feature selection methods for drug discovery, J. Chem. Inf. Comput. Sci., 2004, 44, 1823–1828 CrossRef CAS PubMed.
- C. Merkwirth, H. Mauser, T. Schulz-Gasch, O. Roche, M. Stahl and T. Lengauer, Ensemble methods for classification in cheminformatics, J. Chem. Inf. Comput. Sci., 2004, 44, 1971–1978 CrossRef CAS PubMed.
- I. Guyon, J. Weston, S. Barnhill and V. Vapnik, Gene selection for cancer classification using support vector machines, Mach. Learn., 2002, 46, 389–422 CrossRef.
- S.-P. Yang, S.-T. Song, Z.-M. Tang and H.-F. Song, Optimization of antisense drug design against conservative local motif in simulant secondary structures of HER-2 mRNA and QSAR analysis, Acta Pharmacol. Sin., 2003, 24, 897–902 CAS.
- Z. Bursac, C. H. Gauss, D. K. Williams and D. W. Hosmer, Purposeful selection of variables in logistic regression, Source Code Biol. Med., 2008, 3, 17 CrossRef PubMed.
- M. Shahlaei, Descriptor selection methods in Quantitative Structure–Activity relationship studies: a review study, Chem. Rev., 2013, 113, 8093–8103 CrossRef CAS PubMed.
- M. Shahlaei, A. Madadkar-Sobhani, A. Fassihi, L. Saghaie, D. Shamshirian and H. Sakhi, Comparative Quantitative Structure–Activity Relationship study of some 1-aminocyclopentyl-3-carboxyamides as CCR2 inhibitors using stepwise MLR, FA-MLR, and GA-PLS, Med. Chem. Res., 2012, 21, 100–115 CrossRef CAS.
- B. T. Hoffman, T. Kopajtic, J. L. Katz and A. H. Newman, 2D QSAR modeling and preliminary database searching for dopamine transporter inhibitors using Genetic Algorithm variable selection of molconn Z descriptors, J. Med. Chem., 2000, 43, 4151–4159 CrossRef CAS PubMed.
- G. Castellano and A. M. Fanelli, Variable selection using neural-network models, Neurocomputing, 2000, 31, 1–13 CrossRef.
- M. Jung, J. Tak, Y. Lee and Y. Jung, Quantitative structure–activity relationship (QSAR) of tacrine derivatives against acetylcholinesterase (AChE) activity using variable selections, Bioorg. Med. Chem. Lett., 2007, 17, 1082–1090 CrossRef CAS PubMed.
- Z. Zeng, H. Zhang, R. Zhang and Y. Zhang, A hybrid feature selection method based on rough conditional mutual information and naive bayesian classifier, ISRN Appl. Math., 2014, 2014, 1–11 CrossRef.
- H. Rao, G. Yang, N. Tan, P. Li, Z. Li and X. Li, Prediction of hiv-1 protease inhibitors using machine learning approaches, QSAR Comb. Sci., 2009, 28, 1346–1357 CrossRef CAS.
- T. Lookman, P. V. Balachandran, D. Xue and R. Yuan, Active learning in materials science with emphasis on adaptive sampling using uncertainties for targeted design, npj Comput. Mater., 2019, 5, 21 CrossRef.
- G. K. Uyanık and N. Güler, A study on Multiple Linear Regression analysis, Procedia Soc. Behav. Sci., 2013, 106, 234–240 CrossRef.
- A. Z. Dudek, T. Arodz and J. Galvez, Computational methods in developing Quantitative Structure-Activity Relationships (QSAR): a review, Comb. Chem. High Throughput Screening, 2006, 9, 213–228 CrossRef CAS PubMed.
- D. F. Andrews, A robust method for Multiple Linear Regression, Technometrics, 1974, 16, 523–531 CrossRef.
- E. Schulz, M. Speekenbrink and A. Krause, A tutorial on Gaussian process regression: modelling, exploring, and exploiting functions, J. Math. Psychol., 2018, 85, 1–16 CrossRef.
- V. L. Deringer, A. P. Bartók, N. Bernstein, D. M. Wilkins, M. Ceriotti and G. Csányi, Gaussian process regression for materials and molecules, Chem. Rev., 2021, 121, 10073–10141 CrossRef CAS PubMed.
- F. Stulp and O. Sigaud, Many regression algorithms, one unified model - a review, Neural Networks, 2015, 69, 60–79 CrossRef PubMed.
- A. Mannodi-Kanakkithodi, G. Pilania and R. Ramprasad, Critical assessment of regression-based machine learning methods for polymer dielectrics, Comput. Mater. Sci., 2016, 125, 123–135 CrossRef CAS.
- C. Cortes and V. Vapnik, Support-vector networks, Mach. Learn., 1995, 20, 273–297 Search PubMed.
- X. J. Yao, A. Panaye, J. P. Doucet, R. S. Zhang, H. F. Chen, M. C. Liu, Z. D. Hu and B. T. Fan, Comparative study of QSAR/QSPR correlations using support vector machines, radial basis function neural networks, and Multiple Linear Regression, J. Chem. Inf. Comput. Sci., 2004, 1257–1266 CrossRef CAS PubMed.
- J.-P. Doucet, F. Barbault, H. Xia, A. Panaye and B. Fan, Nonlinear SVM approaches to QSPR/QSAR studies and drug design, Curr. Comput. – Aided Drug Des., 2007, 3, 263–289 CrossRef CAS.
- S. R. Safavian and D. Landgrebe, A survey of decision tree classifier methodology, IEEE Trans. Syst. Man Cybern., 1991, 21, 660–674 CrossRef.
- G. Biau and E. Scornet, A random forest guided tour, Test, 2016, 25, 197–227 CrossRef.
- A. K. Jain, J. Mao and K. M. Mohiuddin, Artificial neural networks: a tutorial, Computer, 1996, 29, 31–44 CrossRef.
- D. Svozil, V. Kvasnicka and J. Pospichal, Introduction to multi-layer feed-forward neural networks, Chemom. Intell. Lab. Syst., 1997, 39, 43–62 CrossRef CAS.
- L. Chen, G. Pilania, R. Batra, T. D. Huan, C. Kim, C. Kuenneth and R. Ramprasad, Polymer informatics: current status and critical next steps, Mater. Sci. Eng. R Rep., 2021, 144, 100595 CrossRef.
- M. Sun, S. Zhao, C. Gilvary, O. Elemento, J. Zhou and F. Wang, Graph convolutional networks for computational drug development and discovery, Brief. Bioinformatics, 2020, 21, 919–935 CrossRef PubMed.
- S. Amabilino, P. Pogány, S. D. Pickett and D. V. S. Green, Guidelines for recurrent neural network transfer learning-based molecular generation of focused libraries, J. Chem. Inf. Model., 2020, 60, 5699–5713 CrossRef CAS PubMed.
- H. D. Tran, C. Kim, L. Chen, A. Chandrasekaran, R. Batra, S. Venkatram, D. Kamal, J. P. Lightstone, R. Gurnani, P. Shetty, M. Ramprasad, J. Laws, M. Shelton and R. Ramprasad, Machine-learning predictions of polymer properties with Polymer Genome, J. Appl. Phys., 2020, 128, 171104 CrossRef.
- A. Mannodi-Kanakkithodi, G. Pilania, T. D. Huan, T. Lookman and R. Ramprasad, Machine learning strategy for accelerated design of polymer dielectrics, Sci. Rep., 2016, 6, 20952 CrossRef PubMed.
- J. Liang, S. Xu, L. Hu, Y. Zhao and X. Zhu, Machine-Learning-assisted low dielectric constant polymer discovery, Mater. Chem. Front., 2021, 5, 3823–3829 RSC.
- L. A. Miccio and G. A. Schwartz, From chemical structure to quantitative polymer properties prediction through convolutional neural networks, Polymer, 2020, 193, 122341 CrossRef CAS.
- P. R. Duchowicz, S. E. Fioressi, D. E. Bacelo, L. M. Saavedra, A. P. Toropova and A. A. Toropov, QSPR studies on refractive indices of structurally heterogeneous polymers, Chemom. Intell. Lab. Syst., 2015, 140, 86–91 CrossRef CAS.
- A. Karuth, A. Alesadi, W. Xia and B. Rasulev, Predicting glass transition of amorphous polymers by application of cheminformatics and molecular dynamics simulations, Polymer, 2021, 218, 123495 CrossRef CAS.
- P. M. Khan, B. Rasulev and K. Roy, QSPR modeling of the refractive index for diverse polymers using 2D descriptors, ACS Omega, 2018, 3, 13374–13386 CrossRef CAS PubMed.
- P. M. Khan and K. Roy, QSPR modelling for prediction of glass transition temperature of diverse polymers, SAR QSAR Environ. Res., 2018, 29, 935–956 CrossRef CAS PubMed.
- S. Wang, M. Cheng, L. Zhou, Y. Dai, Y. Dang and X. Ji, QSPR modelling for intrinsic viscosity in polymer–solvent combinations based on density functional theory, SAR QSAR Environ. Res., 2021, 32, 379–393 CrossRef CAS PubMed.
- P. M. Khan and K. Roy, QSPR modelling for investigation of different properties of aminoglycoside-derived polymers using 2D descriptors, SAR QSAR Environ. Res., 2021, 32, 595–614 CrossRef CAS PubMed.
- J. Xu, B. Chen and H. Liang, Accurate Prediction of θ (Lower Critical Solution Temperature) in Polymer Solutions Based on 3D Descriptors and Artificial Neural Networks, Macromol. Theory Simul., 2008, 17, 109–120 CrossRef CAS.
- F. Jabeen, M. Chen, B. Rasulev, M. Ossowski and P. Boudjouk, Refractive indices of diverse data set of polymers: A computational QSPR based study, Comput. Mater. Sci., 2017, 137, 215–224 CrossRef CAS.
- M. E. Erickson, M. Ngongang and B. Rasulev, A refractive index study of a diverse set of polymeric materials by QSPR with quantum-chemical and additive descriptors, Molecules, 2020, 25, 3772 CrossRef CAS PubMed.
- L. S. Petrosyan, N. Sizochenko, J. Leszczynski and B. Rasulev, Modeling of glass transition temperatures for polymeric coating materials: application of QSPR mixture-based approach, Mol. Inf., 2019, 38, 1800150 CrossRef CAS PubMed.
- P. Xu, T. Lu, L. Ju, L. Tian, M. Li and W. Lu, Machine learning aided design of polymer with targeted band gap based on DFT computation, J. Phys. Chem. B, 2021, 125, 601–611 CrossRef CAS PubMed.
- J. Yang, L. Tao, J. He, J. R. McCutcheon and Y. Li, Machine learning enables interpretable discovery of innovative polymers for gas separation membranes, Sci. Adv., 2022, 8, eabn9545 CrossRef CAS PubMed.
- A. P. Toropova, A. A. Toropov, S. E. Martyanov, E. Benfenati, G. Gini, D. Leszczynska and J. Leszczynski, CORAL: QSAR modeling of toxicity of organic chemicals towards Daphnia magna, Chemom. Intell. Lab. Syst., 2012, 110, 177–181 CrossRef CAS.
- C. Z. Mooney, Monte Carlo simulation, SAGE Publications, Inc., 1997, DOI:10.4135/9781412985116.
- R. W. Kennard and L. A. Stone, Computer aided design of experiments, Technometrics, 1969, 11, 137–148 CrossRef.
- C. W. Yap, PaDEL-descriptor: An open source software to calculate molecular descriptors and fingerprints, J. Comput. Chem., 2011, 32, 1466–1474 CrossRef CAS PubMed.
- Marvin sketch software, https://chemaxon.com/marvin, (accessed 26 September 2022) Search PubMed.
- B. Wang, H. Yi, K. Xu and Q. Wang, Prediction of the self-accelerating decomposition temperature of organic peroxides using QSPR models, J. Therm. Anal. Calorim., 2017, 128, 399–406 CrossRef CAS.
- Y. Pan, J. Jiang, R. Wang and H. Cao, Advantages of support vector machine in QSPR studies for predicting auto-ignition temperatures of organic compounds, Chemom. Intell. Lab. Syst., 2008, 92, 169–178 CrossRef CAS.
- HyperChem program, https://www.hypercubeusa.com/, (accessed 28 September 2022).
- ChemDraw – PerkinElmer Informatics, https://perkinelmerinformatics.com/products/research/chemdraw, (accessed 13 September 2022) Search PubMed.
- H. Yamada, C. Liu, S. Wu, Y. Koyama, S. Ju, J. Shiomi, J. Morikawa and R. Yoshida, Predicting Materials Properties with Little Data Using Shotgun Transfer Learning, ACS Cent. Sci., 2019, 5, 1717–1730 CrossRef CAS PubMed.
| This journal is © The Royal Society of Chemistry 2023 |